

Abstract
One of the most salient features to emerge in visual cortex is sensitivity to stimulus orientation. Here we asked if orientation selectivity, once established, is altered by successive stages of cortical processing. We measured patterns of orientation selectivity at all depths of the cat's visual cortex by making whole-cell recordings with dye-filled electrodes. Our results show that the synaptic representation of orientation indeed changes with position in the microcircuit, as information passes from layer 4 to layer 2+3 to layer 5. At the earliest cortical stage, for simple cells in layer 4, orientation tuning curves for excitation (depolarization) and inhibition (hyperpolarization) had similar peaks (within 0–7 deg, n = 11) and bandwidths. Further, the sharpness of orientation selectivity covaried with receptive field geometry (r = 0.74) - the more elongated the strongest subregion, the shaper the tuning. Tuning curves for complex cells in layer 2+3 also had similar peaks (within 0–4 deg, n = 7) and bandwidths. By contrast, at a later station, layer 5, the preferred orientation for excitation and inhibition diverged such that the peaks of the tuning curves could be as far as 90 deg apart (average separation, 54 deg; n = 6). Our results support the growing consensus that orientation selectivity is generated at the earliest cortical level and structured similarly for excitation and inhibition. Moreover, our novel finding that the relative tuning of excitation and inhibition changes with laminar position helps resolve prior controversy about orientation selectivity at later phases of processing and gives a mechanistic view of how the cortical circuitry recodes orientation.
As information is conveyed from the thalamus to the visual cortex, neurons become sensitive to the orientation of visual stimuli. The property of orientation selectivity is central to the study of visual sensory integration, both because of its key role in object recognition and because it provides a general framework for understanding how cortical circuits process information. The means by which orientation tuning emerges, however, are not yet resolved. Further, it is unclear if orientation selectivity, once established, changes in pattern with successive stages of striate cortical integration. Current debate about the generation of orientation selectivity focuses on the roles ascribed to thalamocortical versus intracortical connections. Thalamocortical schemes (Hubel & Wiesel, 1962; Palmer & Davis, 1981; Ferster, 1986, 1988; Jones & Palmer, 1987a,b; Chung & Ferster, 1998; Troyer et al. 1998) propose that orientation tuning emerges at the first stage of cortical processing, from the precise arrangement of inputs from the lateral geniculate nucleus of the thalamus onto cortical cells (Tanaka, 1983, 1985; Chapman et al. 1991; Reid & Alonso, 1995; Chung & Ferster, 1998). Feedback models, on the other hand, suggest that the resolution of orientation relies on local and long-range intracortical connections, with less reliance on the characteristics of thalamic input (Sillito, 1985; Nelson et al. 1994; Ben-Yishai et al. 1995; Douglas et al. 1995; Somers et al. 1995; Frégnac, 1996; Crook et al. 1997; Ringach et al. 1997; Sompolinsky & Shapley, 1997; Borg-Graham et al. 1998; Debanne et al. 1998; Adorjan et al. 1999; McLaughlin et al. 2000).
To evaluate the various schemes of orientation selectivity, we used the techniques of whole-cell recording and intracellular labelling in vivo to measure depolarizing and hyperpolarizing responses to oriented stimuli at different levels of cortical integration. First, we concentrated on the initial stage of cortical processing, the main thalomorecipient zone - layer 4. There, simple cells are the majority population; their receptive fields are built of elongated parallel subregions with alternating preference for stimulus contrast (Hubel & Wiesel, 1962; Palmer & Davis, 1981; Ferster, 1986, 1988; Heggelund, 1986; Jones & Palmer, 1987a; Tolhurst & Dean, 1987; Hirsch et al. 1995, 1998b; cf. Borg-Graham et al. 1998; Debanne et al. 1998). Next we examined higher stations in the cortical microcircuit. Specifically, we recorded from the main target of layer 4, the superficial layers (layer 2+3), and their main intracortical target, layer 5 (Lorente De Nò, 1944; Gilbert & Wiesel, 1981; Martin & Whitteridge, 1984). Complex cells populate these later, intracortical, stages of processing and have receptive fields that lack parallel subregions. Our results show that the relative orientation tuning of excitatory and inhibitory inputs varies with position in the cortical microcircuit and with receptive field class. At the earliest stage of processing (layer 4 simple cells) tuning curves for excitation and inhibition largely overlap and the elongation of subregions within the receptive field correlates with the sharpness of orientation sensitivity. These observations are predicted by thalamocortical models (Hubel & Wiesel, 1962; Palmer & Davis, 1981; Ferster, 1986, 1988; Jones & Palmer, 1987a,b; Chung & Ferster, 1998; Troyer et al. 1998). At later stages of integration (layer 5 complex cells), the tuning curves for excitation and inhibition separate, a result that is consistent with feedback models (Sillito, 1985; Nelson et al. 1994; Ben-Yishai et al. 1995; Douglas et al. 1995; Somers et al. 1995; Frégnac, 1996; Crook et al. 1997; Ringach et al. 1997; Borg-Graham et al. 1998; Debanne et al. 1998; Adorjan et al. 1999; McLaughlin et al. 2000). These findings suggest that striate cortex resolves stimulus orientation early on and then reprocesses that information further before directing output to other areas of the visual pathway.
METHODS
Preparation and anaesthesia
Experimental subjects were adult cats (1.5–3.5 kg) anaesthetized with ketamine (10 mg kg−1, i.m.) followed by thiopental sodium (20 mg kg−1, i.v.) or a mixture of diprivan (Propofol) and sufentanil citrate (Sufenta) (5 mg + 1 μg kg−1, i.v.). The depth of anaesthesia was monitored continuously and maintained by infusion of thiopental sodium (2–4 mg kg−1 h−1, i.v.) or diprivan and sufentanil citrate (5 mg + 1 μg kg−1 h−1, i.v.), adjusted as indicated by changes in the ECG and EEG. After the completion of a tracheotomy, craniotomy and related surgical procedures, animals were paralysed (vecuronium bromide (Norcuron) 0.2 mg kg−1 h−1, i.v., in lactated Ringer solution) and artificially ventilated; body temperature was maintained at 37–39 oC. Ultimately, the cats were given a lethal dose of anaesthetic and perfused. Procedures used were in accordance with the guidelines of the National Institutes of Health and the Rockefeller University Laboratory Animal Research Center.
Surgical procedures
An endotracheal tube was introduced through a tracheotomy before the animal was placed in a stereotaxic apparatus. Two cortical craniotomies were made; one centred on Horsley-Clark coordinates A6.5-L8.5 gave access to the lateral geniculate nucleus and the other, centred on Horsley-Clark coordinates P3-L2, was enlarged to expose the lateral gyrus. After the pupils were dilated with 1 % atropine sulfate and the nictitating membranes retracted with 10 % phenylephrine, the eyes were refracted and fitted with contact lenses to focus on a tangent screen. For each eye, the position of the area centralis and of the optic disk was determined by retroprojection with a fundus camera or fibre optic illuminator.
Recordings
Patch recordings in vivo (Pei et al. 1991; Ferster & Jagadeesh, 1992; Hirsch et al. 1995) were made with pipettes with resistances ≥ 12 MΩ when filled with internal solution containing (mm): potassium gluconate, 120; NaCl, 5; CaCl2, 1; MgCl2, 1; EGTA, 11; GTP, 0.2; ATP, 2; Hepes, 40; with 1 % biocytin; pH 7.3; 290 mosmol kg−1. The intracellular voltage was amplifed and stored on disk (sampling rate, 3–4 kHz). Voltage-current relationships were measured before and after each stimulus cycle to monitor changes in the access and input resistance, threshold for firing, and membrane time constant. Cells considered for analysis maintained their ability to fire repeatedly when injected with depolarizing current. Time constants ranged from 10 to 28 ms (average, 17.2 ms; standard deviation, 5.6 ms) and recordings lasted from 20 min to 5 h. It was often impractical to assign absolute resting potential as the ratio of access to seal resistance led to a voltage division in the records (Stühmer et al. 1983; Edwards & Konnerth, 1992). Recording site and morphological identification were determined after histological processing (Horikawa & Armstrong, 1988; Hirsch, 1995).
Receptive-field mapping
After centring the stimulus monitor over the hand-mapped receptive field, the static field structure was determined precisely with a modified sparse noise protocol (Jones & Palmer, 1987a; Hirsch et al. 1995). That is, light and dark squares were flashed singly for 40 ms in pseudo-random order 16 times each on a 16 × 16 grid: square size 0.4–1.7 deg, contrast 50–70 %, grid size 14 deg × 14 deg. Receptive fields were classified as simple or complex based on their spatial structure (Hubel & Wiesel, 1962; Hirsch et al. 1995, 1998b) and other criteria, as outlined elsewhere (Palmer & Davis, 1981; Jones & Palmer, 1987a; Skottun et al. 1991). Essentially, simple cells have receptive fields built of elongated, adjacent on- and off-subregions: in on-subregions bright stimuli excite and dark ones inhibit; for off-subregions the converse is true. Complex cells lack spatially segregated on- and off-subregions. On- and off-subregions correspond to bright-excitatory and dark-excitatory subregions, respectively (De Angelis et al. 1995). Maps of simple receptive fields were made by subtracting bright from dark responses and shown as contour plots (both spikes and subthreshold events were included). Each concentric line indicates a 10 % reduction in the response strength relative to the peak. Light and dark grey represent on- and off-subregions, respectively. Complex cells outside layer 4 often did not respond to the flashed stimulus (Hirsch et al. 1997); their receptive field centres were determined from responses to moving bars.
Measuring orientation tuning
Orientation tuning curves were calculated from responses to four to eight repetitions of a single bar swept at eight different orientations for 180 deg of visual space (angular resolution of 22 deg; 100 % contrast) presented on the stimulus monitor centred over the receptive field (see above). Bar width was 0.85 deg and velocity 10 deg s−1. Net depolarization (excitation) was defined as the area bordered by segments of the response waveform that fell between rest and more positive voltages and net hyperpolarization (inhibition) was defined as the area between rest and more negative voltages. Orientation tuning curves were constructed from measures of area rather than peak in order to include the responses evoked from the entire receptive field, not just the strongest spot. As well, measurements of area were resistant to distortions introduced by sporadic events. In practice, tuning curves constructed from area rather than peak values were smoother, though both were otherwise similar (data not shown). The recordings used to compare responses across the population were obtained at membrane potentials near spike threshold, but additional tuning curves from records at different membrane voltages were made when possible (see Fig. 4 and Hirsch et al. 1998b). The standard deviation of the values at a given point in the curve was never larger than 10 % of the averaged response. None of the cells recorded was clearly direction selective (directionality index below 35 %); in all cases, the preferred direction was included in the test. For simple cells, measurements were confined to a fixed time window determined by the duration of the response evoked from the strongest subregion by optimally oriented bars (bright and dark). This normalization procedure corrected for differences in the time taken for the variously oriented stimuli to cross the simple receptive fields, longest for the orthogonal and shortest for the optimal orientation. As complex receptive fields are not generally elongated, it was not necessary to apply a window before constructing curves. Finally, each tuning curve was fit to a Gaussian function:
where y0 is offset; xc is centre; ω is standard deviation and A is area. Orientation preference was defined as the centre of the Gaussian (xc) and bandwidth as half-width at half-height. When tuning curves were clearly asymmetric they were fitted to two half Gaussians. Summary Gaussian curves (Fig. 6B) were obtained by fitting the averaged raw data from all cells recorded in a given layer.
Figure 4. The orientation tuning profile of the net excitatory and inhibitory inputs differs in layer 5 complex cells.
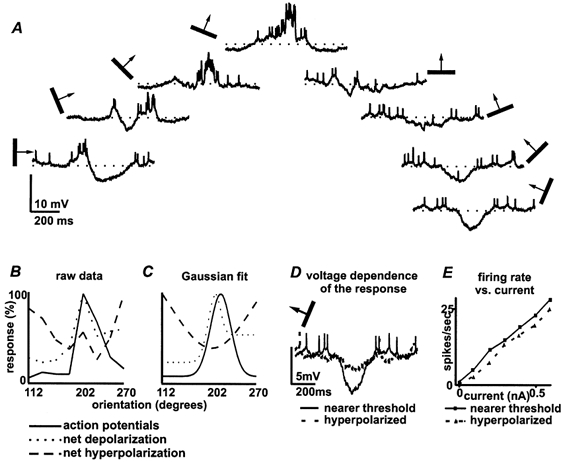
Results obtained from the same layer 5 cell illustrated in Fig. 3. A, semicircular display of averaged responses to stimuli of each orientation centred around the preferred orientation. B, normalized tuning curves for spikes, net excitation and net hyperpolarization; C, the Gaussian fits of those curves (see Methods). Orientation preferences for spikes (202 deg) and net excitation (199 deg) were similar while maximum inhibition was elicited by an orthogonally oriented bar (spike bandwidth, 20 deg; χ2 = 0.005). D, at a relatively hyperpolarized membrane level (dashed line) the response to the orthogonal bar was much smaller than that nearer threshold (continuous line). E, rate-current curves collected at each membrane level are similar; the only difference is the expected rightward shift with hyperpolarization.
Figure 6. Cortical processing changes the relative orientation tuning of excitatory and inhibitory inputs.
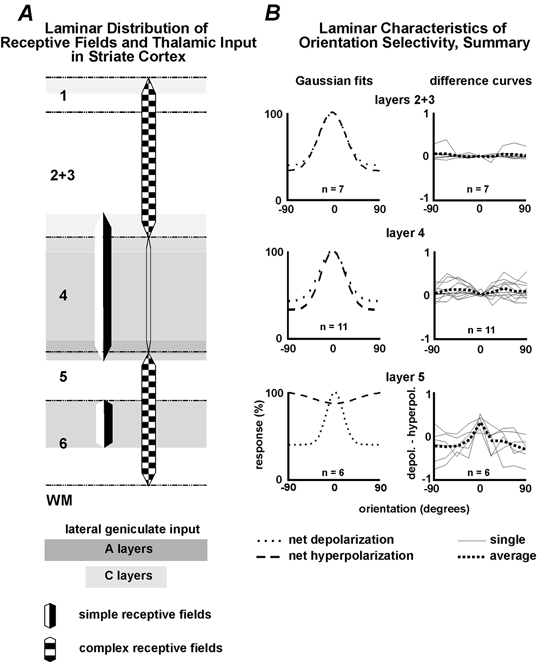
A, distribution of thalamic afferents and cortical receptive field types in the different layers of cat striate cortex. B, summary curves (Gaussian fits), computed by fitting Gaussians to the averaged results for all cells recorded at each layer. Top, in the superficial layers, bandwidths for net excitatory and inhibitory tuning curves (53 and 50 deg) were also alike (χ2 = 0.003). Difference in orientation preference between excitatory and inhibitory inputs ranged from 0 to 4 deg (average 1 deg, n = 7). Middle, in layer 4 simple cells, bandwidths for net excitatory (50 deg) and inhibitory (47 deg) responses are similar (χ2 = 0.002). Average difference in orientation preference was negligible, 2.3 deg (range, 0–7 deg; n = 11). Bottom, in layer 5, the averaged tuning curves for excitation and inhibition differed dramatically and both parameters rarely share dsimilar orientation preference or bandwidth (χ2 = 0.005). With one exception, inhibition peaked at an angle different from the preferred orientation. Differences in orientation preference between excitatory and inhibitory responses were 0, 22, 32, 90, 90 and 90 deg (average 54 deg, n = 6). The difference curves on the right, obtained by subtracting the raw inhibitory tuning curves from the raw excitatory tuning curves for all cells on each layer, further emphasize the laminar differences in the synaptic layout of orientation selectivity (see text).
RESULTS
Layer 4
The first, or thalamocortical, stage of cortical processing takes place mainly in layer 4. Figure 1 depicts receptive fields and orientation tuning curves of two simple cells in layer 4, one with a compact and another with an elongated receptive field. The cell with the compact receptive field (Fig. 1E) had a central on subregion bordered by weaker off-flanks. The orientation tuning curves for the cell (Fig. 1F and G) were plotted from recordings (Fig. 1A–C) made when the membrane potential was near spike threshold. In this and all figures, the definitions of excitation (net depolarization) and inhibition (net hyperpolarization) were the areas above or below the average membrane potential in the pre-stimulus condition (see Methods and Discussion). At that level, inhibitory input hyperpolarizes because the intracellular voltage is, by definition, above the reversal potential for inhibitory currents. As depicted in Fig. 1A, an optimally oriented bright bar evoked a response sequence - inhibition, excitation, inhibition - that corresponded to stimulus entry and exit from each of the three subfields (two individual trials of the stimulus and the average of all traces in bold beneath). All components of the response grew smaller as the stimulus angle deviated from the preferred orientation (Fig. 1B and C). Thus, the tuning of net excitation and inhibition were similar, as seen in plots of the raw data (Fig. 1F) and in the Gaussian fits of those data (Fig. 1G; see Methods). Similar tuning profiles for net excitation and inhibition were found for all eleven simple cells we tested (see Fig. 6B, middle left), whether their tuning was broad, as it was for cells whose subregions were compact (Fig. 1E), or narrow, as when the subregions were long (Fig. 1I). There was a strong correlation between the inverse of the aspect ratio (width/length) of the strongest subfield and the orientation bandwidth (r = 0.74; Martinez et al. 1999). Difference plots, graphs constructed by subtracting the inhibitory from the excitatory tuning curves for each cell (Fig. 6B, middle right), were typically flat, though in three cases the ratio of excitation to inhibition was marginally larger near the orthogonal orientation.
Figure 1. For simple cells, net excitatory and inhibitory responses have similar orientation preferences and the geometry of the receptive field predicts the sharpness of the curves.
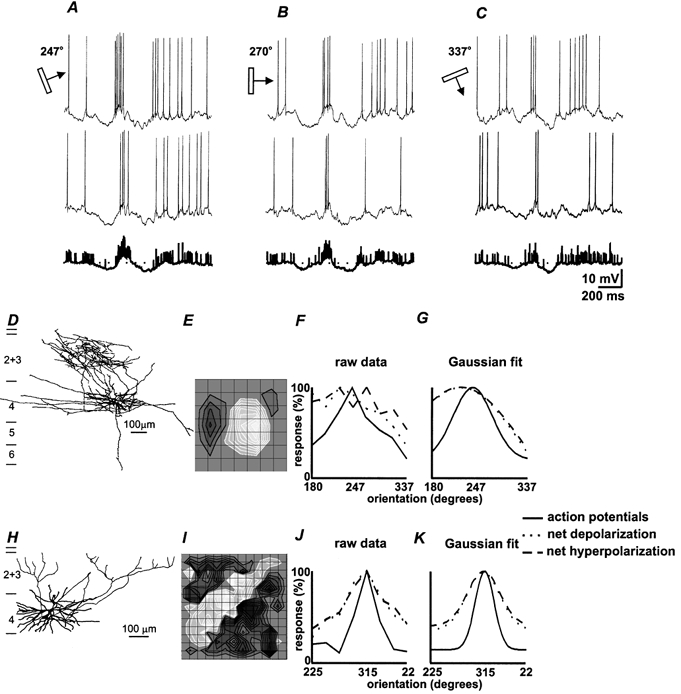
Top panels show responses of a spiny stellate cell in mid-layer 4 (D) to stimuli of three different orientations; A, the optimal, 247 deg; B, 270 deg; C, 337 deg (each column has two individual traces above the average of all eight trials, in bold). E, receptive field map; light grey contours represent on-subregions and dark grey contours off-subregions; grid spacing, 0.85 deg (see Methods). F, normalized orientation tuning plots for spikes, net depolarization and net hyperpolarization; G, the Gaussian fits of those curves (see Methods); bandwidth is 40 deg for spikes and 81 deg for both net excitatory and inhibitory responses (χ 2 = 0.009). H, a second spiny stellate cell in mid-layer 4; I, its long receptive field had a central on-subregion flanked by two off-subregions; grid spacing, 0.85 deg. J, normalized orientation tuning curves; K, Gaussian fits; bandwidths for net excitatory and inhibitory responses (48 deg) and for spikes (18 deg) are much narrower than in the previous example (χ2 = 0.004).
Our results for layer 4 simple cells are consistent with other reports (Ferster, 1986; Douglas et al. 1991; Ferster et al. 1996; Lampl et al. 2001) and set a standard for evaluating results obtained outside the layer. Complex cells had been variously reported to have either similar or different orientation preferences for excitatory and inhibitory inputs (Sillito, 1985; Douglas et al. 1991; Sato et al. 1991; Nelson et al. 1994; Crook et al. 1997; Ringach et al. 1997). These conflicting results had been used to advance opposing models of the generation of orientation selectivity (Ben-Yishai et al. 1995; Douglas et al. 1995; Somers et al. 1995; Frégnac, 1996; Troyer et al. 1998) and, ultimately, to support contrasting views of cortical function. In the following, we describe results obtained in the superficial (layer 2+3) versus the deep (e.g. layer 5) layers of the cortex and propose an explanation for this apparent discrepancy.
Layers 2+3
Cells in layer 4 project to layer 2+3 (Gilbert & Wiesel, 1981; Martin & Whitteridge, 1984). At this and subsequent intracortical stages of processing cells typically have complex receptive fields - on- and off-responses are superimposed rather than spatially separate (Hubel & Wiesel, 1962; Skottun et al. 1991). As many of such cells did not respond to static stimuli, receptive field structure was determined with moving bars. Figure 2 shows results obtained from a complex cell located in upper layer 2+3 (Fig. 2A). An optimally oriented dark bar swept across the receptive field evoked an irregular barrage of EPSPs and IPSPs (Fig. 2B), an intermixture expected from the overlap of bright and dark responses in the complex field. The amplitude of both net excitation and inhibition decreased smoothly as the bar tilted away from the preferred orientation (Fig. 2C and D) such that their bandwidths were only 3 deg apart.
Figure 2. The orientation tuning curves for net excitation and inhibition overlap in superficial complex cells.
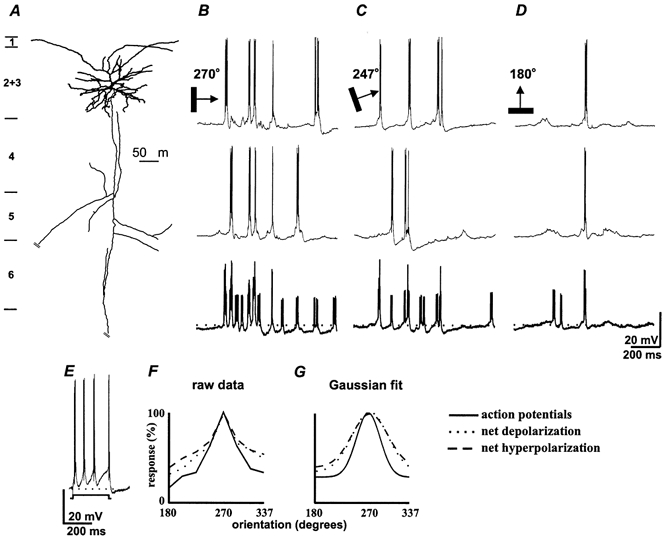
Responses of a pyramid in layer 2+3 (A) to bars at three different orientations; B, the optimal, 270 deg; C, 247 deg; D, 180 deg (in each panel the top two traces are single sweeps with the average of all four trials at the bottom in bold). E, response to a +0.6 nA current pulse shows intrinsic firing pattern. F, normalized orientation tuning plots for spikes, net depolarization and hyperpolarization; G, the Gaussian fits of those curves (see Methods). As for simple cells, orientation preference (270 deg) was similar for the three parameters, bandwidth was 28 deg for spikes, 45 deg for net excitatory responses and 48 deg for net inhibitory responses (χ2 = 0.005).
This particular cell fired in bursts rather than single spikes so after-hyperpolarizations could have contributed to the inhibitory curve (Fig. 2E). It is clear, however, that much of the visually evoked hyperpolarization was produced by inhibitory inputs as it often preceded activity and prior excitation did not predict its size. Control recordings made at a more hyperpolarized level of membrane potential confirmed this observation (data not shown).
Despite differences in receptive field structure and stimulus requirements (e.g. motion) (Movshon et al. 1978a; Hirsch et al. 1997) at the first two levels of cortical processing, responses at both stages shared common characteristics (Fig. 6B, top left). First, the tuning curves for excitation and inhibition had similar peaks (Gaussian fit; average difference in orientation preference, 1 deg; range, 0–4 deg; n = 7). Second, bandwidths for both parameters were alike (53 vs. 50 deg). These similarities are further illustrated in the difference curves (Fig. 6B, top right), which were typically flat, as was the case for layer 4.
Layer 5
A dramatic transformation of the layout of orientation tuning emerged in layer 5, which receives input from layer 2+3 (Gilbert & Wiesel, 1981; Martin & Whitteridge, 1984). For five of the six cells recorded in that layer, excitatory and inhibitory inputs had disparate orientation preferences. A pronounced example came from a complex cell located in lower layer 5 (Fig. 3A). Excitation dominated the response to an optimally oriented bar (Fig. 3B). With a 22 deg change in stimulus angle, inhibition became prominent as robust IPSPs cut into EPSPs (Fig. 3C). Ultimately, inhibition grew to define the response to the perpendicular stimulus (Fig. 3D).
Figure 3. In layer 5, maximum excitation and maximum inhibition are frequently evoked by stimuli with disparate orientations.
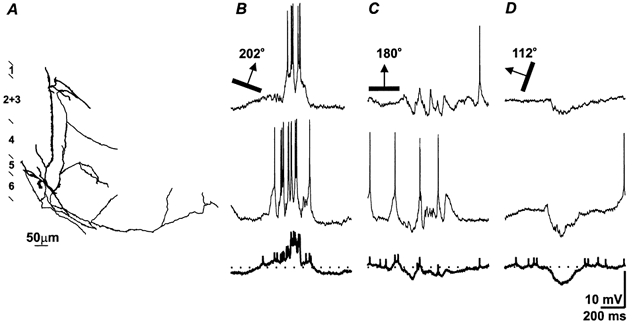
A, a pyramid in lower layer 5. B-D, its response to moving bars at three orientations; B, the optimal, 202 deg; C, 180 deg; D, 112 deg (in each panel the top two traces are single sweeps with the average of all eight trials in bold below). At the preferred orientation(B), excitation dominates the response while maximum inhibition is elicited by the orthogonal stimulus (D).
To highlight this new pattern of behavior we plotted the averaged traces for each of eight orientations, arranged in a semicircle centred around the optimal response (Fig. 4A). The responses for orientations on either side of the peak differed somewhat, but were consistent in that the ratio of inhibition to excitation increased with deviation from the optimal stimulus angle. Hence, the peaks of the tuning curves for excitation and inhibition were separated by 90 deg (Fig. 4B and C).
Figure 4D shows recordings made when the cell was hyperpolarized. The visually evoked suppression was weaker at the more negative level (Fig. 4D, dashed line) than when the cell was nearer the threshold for firing (Fig. 4D, continuous line). This observation is consistent with the idea that the evoked suppression was produced by inhibitory inputs rather than withdrawal of excitatory drive (Borg-Graham et al. 1998; Hirsch et al. 1998b; also see Methods and Discussion).
For a second layer 5 cell (Fig. 5), the excitatory responses at off-peak orientations were markedly asymmetric. This allowed us to examine how inhibition at non-preferred orientations might shape neuronal output. The response to the preferred orientation, 0 deg, was mainly excitatory (Fig. 5A), as in the previous example. For a stimulus tilted clockwise by 22 deg (Fig. 5B), IPSPs cut deeply into the excitation; when the bar tilted further clockwise, IPSPs predominated (Fig. 5D, positive angles). By contrast, excitation was marked in the response to all stimuli that tilted counterclockwise (Fig. 5D, negative angles). Thus the tuning curve for spikes rose slowly to the maximum but fell sharply to the baseline; that is, no output was produced by stimuli that tilted far to the right of the preferred angle (Fig. 5E and F).
Figure 5. Inhibition can shape the orientation profile in layer 5.
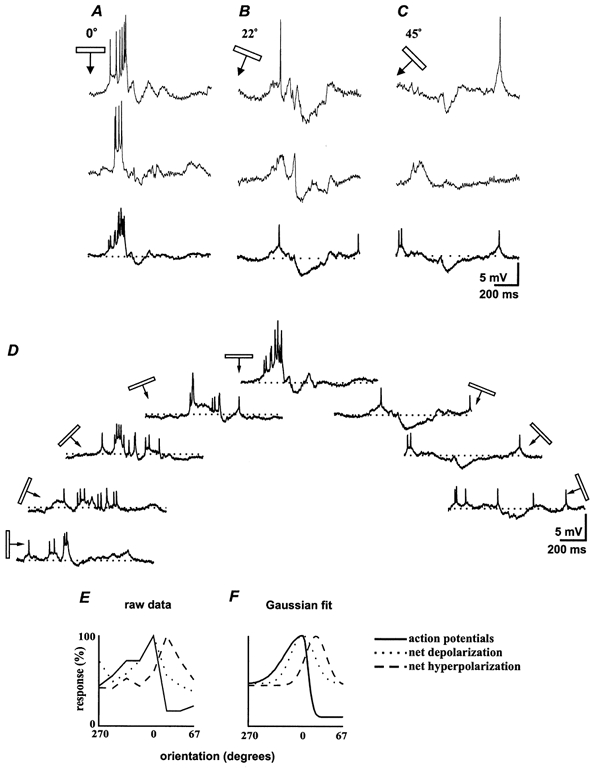
Responses of a second layer 5 cell to moving bars at three different orientations; A, the optimal, 0 deg; B, 22 deg; C, 45 deg (in each panel the top two traces are single sweeps with the average of all 4 trials in bold below). D, semicircular display of averaged responses (four trials) to stimuli of each orientation centred around the preferred orientation. E, normalized orientation tuning plots computed for spikes, net excitation and net inhibition; F, the Gaussian fits of those curves (see Methods). As in the previous example, spikes and net excitatory responses shared a common orientation preference (0 deg) but maximum net inhibition was offset by 22 deg. In this case, the spike tuning curve was asymmetric (fit is to two half-Gaussians). It was steeper on the right side, where the inhibitory tuning curve peaked. Bandwidths were 32 deg for the left leg and 13 deg for the right leg of the spike tuning curve (χ2 = 0.005).
Peak excitation relative to peak inhibition for the entire sample in layer 5 is shown in Fig. 6B, bottom plots. Disparities in orientation preference ranged from 22 to 90 deg (22, 32, 90, 90 and 90 deg) with only one cell having the same preference for both signs of input. Note that these summary graphs are very different from those obtained in layer 4 and the superficial layers (Fig. 6B, top middle). While there may be variations in response that our sample is too small to detect, it is clear that the orientation preference and tuning of excitation and inhibition became separable at later stages of intracortical processing.
DISCUSSION
Laminar differences in orientation tuning
Our results show, for the first time, that the relative orientation of excitation and inhibition in visual cortical neurons varies with laminar location, and thus with ordinal position in the processing stream. At the initial stage of cortical integration, for simple cells in cortical layer 4, the orientation tuning of excitation and inhibition have similar bandwidths and peaks, in keeping with earlier reports (Ferster, 1986, 1988; Anderson et al. 2000). At the second stage of cortical processing, the quality of orientation sensitivity does not seem greatly altered, aside from changes imposed by laminar differences in receptive field structure. In layer 2+3 as in layer 4, the tuning curves for excitation and inhibition typically overlap. Perhaps, the most obvious response transformation to arise in the superficial layers is that information about orientation selectivity is factored in with response properties that emerge there, such as enhanced selectivity for stimulus motion (Movshon et al. 1978a; Hirsch et al. 1997). This composite signal is relayed to layer 5 via the descending projections of superficial pyramidal cells (Gilbert & Wiesel, 1981; Martin & Whitteridge, 1984). Here, a dramatic change in the layout of orientation selectivity emerges; the preferred orientation for excitation and inhibition often diverge and tuning curves may be asymmetric in shape (cf. Ferster, 1986). Thus significant reprocessing and distribution of information about stimulus orientation occurs as early in the visual pathway as the striate cortex itself.
Synaptic basis of orientation tuning
In the course of this study, we have referred to net hyperpolarization as inhibition and net depolarization as excitation, a view largely consistent with past studies. There is agreement that the synaptic basis for visually evoked hyperpolarization is postsynaptic inhibition rather than withdrawal of excitation (Sato et al. 1991; Volgushev et al. 1993; Borg-Graham et al. 1998; Hirsch et al. 1998b; Anderson et al. 2000; and see Fig. 4). Although activity dependent intrinsic conductances also can lower the membrane voltage (e.g. Prince & Huguenard, 1988; Pineda et al. 1998; Sanchez-Vives et al. 2000), the role of this mechanism appeared limited - the presence or strength of the hyperpolarizations evoked by our stimulus did not depend on the amount of prior activity. In addition, the visually evoked suppression was reduced when the membrane was hyperpolarized. Visually driven cortical excitation also has its roots in synaptic drive (Tanaka, 1983, 1985; Toyama, 1988; Ghose et al. 1994; Reid & Alonso, 1995; Alonso & Martinez, 1998; Hirsch et al. 1998b), though its size may be influenced by intrinsic conductances (e.g. Stafstrom et al. 1985; Prince & Huguenard, 1988; Connors & Gutnick, 1990; Johnston et al. 1996). In any case, the ultimate effect of stimuli that hyperpolarize is to reduce firing rate while the action of stimuli that depolarize (that drive the membrane to spike threshold) is to increase activity. Thus, the exact degree to which synaptic input engages intrinsic membrane properties does not change the functional significance of our results.
Feedforward and feedback models of orientation selectivity
Receptive field structure and orientation tuning
Feedforward models rely on the convergence of aligned thalamic inputs to generate orientation selectivity (Hubel & Wiesel, 1962; Palmer & Davis, 1981; Ferster, 1986, 1988; Jones & Palmer, 1987a,b; Reid & Alonso, 1995; Ferster et al. 1996; Troyer et al. 1998; Anderson et al. 2000). These models assume that thalamic relay cells project to simple cells such that adjacent rows of on- and off-thalamic receptive field centres define flanking simple cell subregions (Hubel & Wiesel, 1962; Palmer & Davis, 1981; Ferster, 1986, 1988; Jones & Palmer, 1987b; Reid & Alonso, 1995; Troyer et al. 1998). A stimulus of the appropriate orientation activates all the relay cells in the ‘row’ while an orthogonal stimulus covers territory restricted to one relay cell centre. Thus, the more elongated a given subregion, the greater the ratio between the maximal and minimal response, and the narrower the orientation tuning. In keeping with this scheme, the geometry of the receptive field largely covaried with the sharpness of orientation tuning - the higher the length-to-width ratio of the strongest subregion, the narrower the bandwidth. A similar but less robust relationship between receptive field structure and acuity of tuning had been described in earlier extracellular studies (Jones & Palmer, 1987b; Gardner et al. 1999). Thus, the spatial structure of the receptive field appears to play a key, albeit not absolute, role in establishing orientation selectivity. Influences that could contribute to the variance in the sharpness of tuning include the number and relative strength of the component subregions, the temporal structure of the response (e.g. Movshon et al. 1978b; Jones & Palmer, 1987b; Reid et al. 1987; McLean & Palmer, 1989; Saul & Humphrey, 1992; Jagadeesh et al. 1993; De Angelis et al. 1995; Murthy et al. 1998) the relative strength of excitation and inhibition (Palmer & Davis, 1981; Tolhurst & Dean, 1987, 1990; Volgushev et al. 1993, 1996; Pei et al. 1994) or intracortical amplification of the optimal response (Douglas et al. 1995; Somers et al. 1995; Sompolinsky & Shapley, 1997).
It was not feasible to attempt comparison of receptive field structure to orientation tuning for complex cells; most such cells responded well only to moving stimulus but only weakly or not at all to the sparse stimulus (also see Hirsch, 1995; Hirsch et al. 1997, 1998a,b). These observations are not surprising. Earlier work showed that complex cells are rarely well driven by static flash. Further, they integrate their inputs by extremely nonlinear means rather than by additive spatial summation (Hubel & Wiesel, 1962; Movshon et al. 1978a; Szulborski & Palmer, 1990; Skottun et al. 1991).
Relative tuning of excitation and inhibition
Feedforward models assume that inhibition is supplied by inhibitory simple cells whose fields are the approximate mirror image of their partners (Palmer & Davis, 1981; Ferster, 1986; Hirsch et al. 1998b, 2000; Anderson et al. 2000). This scheme is supported by results of recent studies in which we mapped the distribution of excitation and inhibition in the field point by point (Hirsch, 1995; Martinez et al. 1999). Accordingly, we found, as have others (Ferster, 1986, 1988; Sato et al. 1991; Anderson et al. 2000), that excitation and inhibition in layer 4 and even layer 2+3 have similar tuning profiles (Fig. 6B, top, middle). Most feedback models depend on broader tuning of inhibition than excitation to sharpen orientation (Sillito, 1985; Nelson et al. 1994; Ben-Yishai et al. 1995; Douglas et al. 1995; Somers et al. 1995; Frégnac, 1996; Crook et al. 1997; Ringach et al. 1997; Sompolinsky & Shapley, 1997; Borg-Graham et al. 1998; Debanne et al. 1998; Adorjan et al. 1999; McLaughlin et al. 2000). If that arrangement were the case, the profiles produced by subtracting the inhibitory from the excitatory tuning curves would peak at the centre rather than assume the flat or shallow U-shaped profiles we measured (Fig. 6B).
In one important sense, our results do support ideas set out in feedback models. Specifically, our observation that the tuning curves for excitation and inhibition diverged at later stages of cortical processing is consistent with the idea that the striate cortical circuit can reconfigure information about orientation (Fig. 6B, bottom right). Although intracortical processing by the interlaminar circuitry does not seem to be the dominant means of generating orientation sensitivity in cat layer 4, we propose that it may be employed for that purpose in higher species (Lund et al. 1979; Fitzpatrick, 1996; Bosking et al. 1997; Callaway, 1998) where orientation selectivity is refined by iterative stages of cortical integration (Ringach et al. 1997; Mooser et al. 2000).
Functional implications
It seems likely that the independent orientation tuning of inhibition and excitation reflects circuitry used to resolve complex visual features. For example, a cell that becomes progressively inhibited by stimuli pivoting to the left but not to the right (e.g. Fig. 5) might be able to detect the direction of rotation. More generally, the complicated responses in layer 5 may relate to visually guided behaviours directed by its subcortical targets (Gilbert & Kelly, 1975) or to functions performed by cortical areas upstream (Salin & Bullier, 1995).
Acknowledgments
We wish to thank T. N. Wiesel for longstanding support and G. R. Burkitt, A. E. Krukowski, K. D. Miller, L. A. Palmer, R. Shapley, T. W. Troyer, U. Vollmer and T. N. Wiesel for helpful comments on previous versions of the manuscript. K. Desai, C. A. Gallagher, J. L. Kornblum, C. Pierre and C. Pillai drew the labelled cells and P. R. Peirce photographed many of them. This work was supported by NIH EY09395 to J.A.H. and a fellowship from the HFSPO to L.M.M.
REFERENCES
- Adorjan P, Levitt JB, Lund JS, Obermayer K. A model for the intracortical origin of orientation preference and tuning in macaque striate cortex. Visual Neuroscience. 1999;16:303–318. doi: 10.1017/s0952523899162114. [DOI] [PubMed] [Google Scholar]
- Alonso JM, Martinez LM. Functional connectivity between simple cells and complex cells in cat striate cortex. Nature Neuroscience. 1998;5:395–403. doi: 10.1038/1609. [DOI] [PubMed] [Google Scholar]
- Anderson J, Carandini M, Ferster D. Orientation tuning of input conductance, excitation, and inhibition in cat primary visual cortex. Journal of Neurophysiology. 2000;84:909–926. doi: 10.1152/jn.2000.84.2.909. [DOI] [PubMed] [Google Scholar]
- Ben-Yishai R, Bar-Or RL, Sompolinsky H. Theory of orientation tuning in visual cortex. Proceedings of the National Academy of Sciences of the USA. 1995;92:3844–3848. doi: 10.1073/pnas.92.9.3844. [DOI] [PMC free article] [PubMed] [Google Scholar]
- Borg-Graham LJ, Monier C, Frégnac Y. Visual input evokes transient and strong shunting inhibition in visual cortical neurons. Nature. 1998;393:369–373. doi: 10.1038/30735. [DOI] [PubMed] [Google Scholar]
- Bosking WH, Zhang Y, Schofield B, Fitzpatrick D. Orientation selectivity and the arrangement of horizontal connections in tree shrew striate cortex. Journal of Neuroscience. 1997;17:2112–2127. doi: 10.1523/JNEUROSCI.17-06-02112.1997. [DOI] [PMC free article] [PubMed] [Google Scholar]
- Callaway EM. Local circuits in primary visual cortex of the macaque monkey. Annual Review of Neuroscience. 1998;21:47–74. doi: 10.1146/annurev.neuro.21.1.47. [DOI] [PubMed] [Google Scholar]
- Chapman B, Zahs KR, Stryker MP. Relation of cortical cell orientation selectivity to alignment of receptive fields of the geniculocortical afferents that arborize within a single orientation column in ferret visual cortex. Journal of Neuroscience. 1991;11:1347–1358. doi: 10.1523/JNEUROSCI.11-05-01347.1991. [DOI] [PMC free article] [PubMed] [Google Scholar]
- Chung S, Ferster D. Strength and orientation tuning of the thalamic input to simple cells revealed by electrically evoked cortical suppression. Neuron. 1998;20:1177–1189. doi: 10.1016/s0896-6273(00)80498-5. [DOI] [PubMed] [Google Scholar]
- Connors BW, Gutnick MJ. Intrinsic firing patterns of diverse neocortical neurons. Trends in Neurosciences. 1990;13:99–104. doi: 10.1016/0166-2236(90)90185-d. [DOI] [PubMed] [Google Scholar]
- Crook JM, Kisvarday ZF, Eysel UT. GABA-induced inactivation of functionally characterized sites in cat striate cortex: Effects on orientation tuning and direction selectivity. Visual Neuroscience. 1997;14:141–158. doi: 10.1017/s095252380000883x. [DOI] [PubMed] [Google Scholar]
- De Angelis GC, Ohzawa I, Freeman RD. Receptive field dynamics in central visual pathways. Trends in Neurosciences. 1995;18:451–458. doi: 10.1016/0166-2236(95)94496-r. [DOI] [PubMed] [Google Scholar]
- Debanne D, Shulz DE, Fregnac Y. Activity-dependent regulation of ‘on’ and ‘off’ responses in cat visual cortical receptive fields. Journal of Physiology. 1998;508:523–548. doi: 10.1111/j.1469-7793.1998.00523.x. [DOI] [PMC free article] [PubMed] [Google Scholar]
- Douglas RJ, Koch C, Mahowald M, Martin KA, Suarez HH. Recurrent excitation in neocortical circuits. Science. 1995;269:981–985. doi: 10.1126/science.7638624. [DOI] [PubMed] [Google Scholar]
- Douglas RJ, Martin KA, Whitteridge D. An intracellular analysis of the visual responses of neurones in cat visual cortex. Journal of Physiology. 1991;440:659–696. doi: 10.1113/jphysiol.1991.sp018730. [DOI] [PMC free article] [PubMed] [Google Scholar]
- Edwards FA, Konnerth A. Patch-clamping cells in sliced tissue preparations. Methods in Enzymology. 1992;207:208–222. doi: 10.1016/0076-6879(92)07015-g. [DOI] [PubMed] [Google Scholar]
- Ferster D. Orientation selectivity of synaptic potentials in neurons of cat primary visual cortex. Journal of Neuroscience. 1986;6:1284–1301. doi: 10.1523/JNEUROSCI.06-05-01284.1986. [DOI] [PMC free article] [PubMed] [Google Scholar]
- Ferster D. Spatially opponent excitation and inhibition in simple cells of the cat visual cortex. Journal of Neuroscience. 1988;8:1172–1180. doi: 10.1523/JNEUROSCI.08-04-01172.1988. [DOI] [PMC free article] [PubMed] [Google Scholar]
- Ferster D, Chung S, Wheat H. Orientation selectivity of thalamic input to simple cells of cat visual cortex. Nature. 1996;380:249–252. doi: 10.1038/380249a0. [DOI] [PubMed] [Google Scholar]
- Ferster D, Jagadeesh B. EPSP-IPSP interactions in cat visual cortex studied with in vivo whole-cell patch recording. Journal of Neuroscience. 1992;12:1262–1274. doi: 10.1523/JNEUROSCI.12-04-01262.1992. [DOI] [PMC free article] [PubMed] [Google Scholar]
- Fitzpatrick D. The functional organization of local circuits in visual cortex: Insights from the study of tree shrew striate cortex. Cerebral Cortex. 1996;6:329–341. doi: 10.1093/cercor/6.3.329. [DOI] [PubMed] [Google Scholar]
- Frégnac Y. Dynamics of functional connectivity in visual cortical networks: An overview. Journal of Physiology. 1996;90:113–139. doi: 10.1016/s0928-4257(97)81412-x. [DOI] [PubMed] [Google Scholar]
- Gardner JL, Anzai A, Ohzawa I, Freeman RD. Linear and nonlinear contributions to orientation tuning of simple cells in the cat's striate cortex. Visual Neuroscience. 1999;16:1115–1121. doi: 10.1017/s0952523899166112. [DOI] [PubMed] [Google Scholar]
- Ghose GM, Freeman RD, Ohzawa I. Local intracortical connections in the cat's visual cortex: Postnatal development and plasticity. Journal of Neurophysiology. 1994;72:1290–1303. doi: 10.1152/jn.1994.72.3.1290. [DOI] [PubMed] [Google Scholar]
- Gilbert CD, Kelly JP. The projections of cells in different layers of the cat's visual cortex. Journal of Comparative Neurology. 1975;163:81–105. doi: 10.1002/cne.901630106. [DOI] [PubMed] [Google Scholar]
- Gilbert CD, Wiesel TN. Laminar specialization and intracortical connections in cat primary visual cortex. In: Schmitt FO, Worden FG, Adelman G, Dennis SG, editors. The organization of the Cerebral Cortex. Cambridge, MA, USA: MIT Press; 1981. pp. 164–190. [Google Scholar]
- Heggelund P. Quantitative studies of enhancement and suppression zones in the receptive field of simple cells in cat striate cortex. Journal of Physiology. 1986;373:293–310. doi: 10.1113/jphysiol.1986.sp016048. [DOI] [PMC free article] [PubMed] [Google Scholar]
- Hirsch JA. Synaptic integration in layer IV of the ferret striate cortex. Journal of Physiology. 1995;483:183–199. doi: 10.1113/jphysiol.1995.sp020577. [DOI] [PMC free article] [PubMed] [Google Scholar]
- Hirsch JA, Alonso JM, Martinez LM. The receptive field structure of inhibitory complex cells mirrors that of excitatory complex cells. Society for Neuroscience Abstracts. 1998a;24:766. [Google Scholar]
- Hirsch JA, Alonso JM, Reid RC. Visually evoked calcium action potentials in cat striate cortex. Nature. 1995;378:612–616. doi: 10.1038/378612a0. [DOI] [PubMed] [Google Scholar]
- Hirsch JA, Alonso JM, Reid CR, Martinez LM. Different synaptic responses of first and second order complex cells in cat striate cortex. Society for Neuroscience Abstracts. 1997;23:1668. [Google Scholar]
- Hirsch JA, Alonso JM, Reid RC, Martinez LM. Synaptic integration in striate cortical simple cells. Journal of Neuroscience. 1998b;18:9517–9528. doi: 10.1523/JNEUROSCI.18-22-09517.1998. [DOI] [PMC free article] [PubMed] [Google Scholar]
- Hirsch JA, Martinez LM, Alonso JM, Pillai C, Pierre C. Simple and complex inhibitory cells in layer 4 of the cat visual cortex. Society for Neuroscience Abstracts. 2000;26:1083. [Google Scholar]
- Horikawa K, Armstrong WE. A versatile means of labeling: Injection of biocytin and its detection with avidin conjugates. Journal of Neuroscience Methods. 1988;25:1–11. doi: 10.1016/0165-0270(88)90114-8. [DOI] [PubMed] [Google Scholar]
- Hubel DH, Wiesel TN. Receptive fields, binocular interaction and functional architecture in the cat's visual cortex. Journal of Physiology. 1962;160:106–154. doi: 10.1113/jphysiol.1962.sp006837. [DOI] [PMC free article] [PubMed] [Google Scholar]
- Jagadeesh B, Wheat HS, Ferster D. Linearity of summation of synaptic potentials underlying direction selectivity in simple cells of the cat visual cortex. Science. 1993;262:1901–1904. doi: 10.1126/science.8266083. [DOI] [PubMed] [Google Scholar]
- Johnston D, Magee JC, Colbert CM, Cristie BR. Active properties of neuronal dendrites. Annual Review of Neuroscience. 1996;19:165–186. doi: 10.1146/annurev.ne.19.030196.001121. [DOI] [PubMed] [Google Scholar]
- Jones JP, Palmer LA. The two-dimensional spatial structure of simple receptive fields in cat striate cortex. Journal of Neurophysiology. 1987a;58:1187–1211. doi: 10.1152/jn.1987.58.6.1187. [DOI] [PubMed] [Google Scholar]
- Jones JP, Palmer LA. An evaluation of the two-dimensional gabor filter model of simple receptive fields in cat striate cortex. Journal of Neurophysiology. 1987b;58:1233–1258. doi: 10.1152/jn.1987.58.6.1233. [DOI] [PubMed] [Google Scholar]
- Lampl I, Anderson JS, Gillespie DC, Ferster D. Prediction of orientation selectivity from receptive field architecture in simple cells of cat visual cortex. Neuron. 2001;30:263–274. doi: 10.1016/s0896-6273(01)00278-1. [DOI] [PubMed] [Google Scholar]
- Lorente De Nò R. Architecture, intracortical connections, motor projections. In: Fulton JF, editor. Physiology of the Nervous System. London: Oxford University Press; 1944. pp. 291–325. [Google Scholar]
- Lund JS, Henry GH, Macqueen CL, Harvey AR. Anatomical organization of the primary visual cortex (area 17) of the cat. A comparison with area 17 of the macaque monkey. Journal of Comparative Neurology. 1979;184:599–618. doi: 10.1002/cne.901840402. [DOI] [PubMed] [Google Scholar]
- McLaughlin D, Shapley R, Shelley M, Wielaard DJ. A neuronal network model of macaque primary visual cortex (V1): Orientation selectivity and dynamics in the input layer 4calpha. Proceedings of the National Academy of Sciences of the USA. 2000;97:8087–8092. doi: 10.1073/pnas.110135097. [DOI] [PMC free article] [PubMed] [Google Scholar]
- McLean J, Palmer LA. Contribution of linear spatiotemporal receptive field structure to velocity selectivity of simple cells in area 17 of cat. Vision Research. 1989;29:675–679. doi: 10.1016/0042-6989(89)90029-1. [DOI] [PubMed] [Google Scholar]
- Martin KA, Whitteridge D. Form, function and intracortical projections of spiny neurones in the striate visual cortex of the cat. Journal of Physiology. 1984;353:463–504. doi: 10.1113/jphysiol.1984.sp015347. [DOI] [PMC free article] [PubMed] [Google Scholar]
- Martinez LM, Reid RC, Alonso JM, Hirsch JA. The synaptic structure of the simple receptive field. Society for Neuroscience Abstracts. 1999;25:1048. [Google Scholar]
- Mooser F, Spor G, Bosking W, Fitzpatrick D. Response properties of layer 2/3 and layer 4 neurons in the tree shrew striate cortex: Physiological correlates of collinear connections. Society for Neuroscience Abstracts. 2000;26:141. [Google Scholar]
- Movshon JA, Thompson ID, Tolhurst DJ. Receptive field organization of complex cells in the cat's striate cortex. Journal of Physiology. 1978a;283:79–99. doi: 10.1113/jphysiol.1978.sp012489. [DOI] [PMC free article] [PubMed] [Google Scholar]
- Movshon JA, Thompson ID, Tolhurst DJ. Spatial summation in the receptive fields of simple cells in the cat's striate cortex. Journal of Physiology. 1978b;283:53–77. doi: 10.1113/jphysiol.1978.sp012488. [DOI] [PMC free article] [PubMed] [Google Scholar]
- Murthy A, Humphrey AL, Saul AB, Feidler JC. Laminar differences in the spatiotemporal structure of simple cell receptive fields in cat area 17. Vision Research. 1998;15:239–256. doi: 10.1017/s0952523898152045. [DOI] [PubMed] [Google Scholar]
- Nelson S, Toth L, Sheth B, Sur M. Orientation selectivity of cortical neurons during intracellular blockade of inhibition. Science. 1994;265:774–777. doi: 10.1126/science.8047882. [DOI] [PubMed] [Google Scholar]
- Palmer LA, Davis TL. Receptive-field structure in cat striate cortex. Journal of Neurophysiology. 1981;46:260–276. doi: 10.1152/jn.1981.46.2.260. [DOI] [PubMed] [Google Scholar]
- Pei X, Vidyasagar TR, Volgushev M, Creutzfeldt OD. Receptive field analysis and orientation selectivity of postsynaptic potentials of simple cells in cat visual cortex. Journal of Neuroscience. 1994;14:7130–7140. doi: 10.1523/JNEUROSCI.14-11-07130.1994. [DOI] [PMC free article] [PubMed] [Google Scholar]
- Pei X, Volgushev M, Vidyasagar TR, Creutzfeldt OD. Whole cell recording and conductance measurements in cat visual cortex in-vivo. NeuroReport. 1991;2:485–488. doi: 10.1097/00001756-199108000-00019. [DOI] [PubMed] [Google Scholar]
- Pineda JC, Waters RS, Foehring RC. Specificity in the interaction of HVA Ca2+ channel types with Ca2+-dependent ahps and firing behavior in neocortical pyramidal neurons. Journal of Neurophysiology. 1998;79:2522–2534. doi: 10.1152/jn.1998.79.5.2522. [DOI] [PubMed] [Google Scholar]
- Prince DA, Huguenard JR. Functional properties of neocortical neurons. In: Rakic P, Singer W, editors. Neurobiology of Neocortex. New York: John Wiley & Sons; 1988. pp. 153–176. [Google Scholar]
- Reid RC, Alonso JM. Specificity of monosynaptic connections from thalamus to visual cortex. Nature. 1995;378:281–284. doi: 10.1038/378281a0. [DOI] [PubMed] [Google Scholar]
- Reid RC, Soodak RE, Shapley RM. Linear mechanisms of directional selectivity in simple cells of cat striate cortex. Proceedings of the National Academy of Sciences of the USA. 1987;84:8740–8744. doi: 10.1073/pnas.84.23.8740. [DOI] [PMC free article] [PubMed] [Google Scholar]
- Ringach DL, Hawkan MJ, Shapley R. Dynamics of orientation tuning in macaque primary visual cortex. Nature. 1997;387:281–284. doi: 10.1038/387281a0. [DOI] [PubMed] [Google Scholar]
- Salin PA, Bullier J. Corticocortical connections in the visual system: Structure and function. Physiological Reviews. 1995;75:107–154. doi: 10.1152/physrev.1995.75.1.107. [DOI] [PubMed] [Google Scholar]
- Sanchez-Vives MV, Nowak LG, McCormick DA. Cellular mechanisms of long-lasting adaptation in visual cortical neurons in vitro. Journal of Neuroscience. 2000;20:4286–4299. doi: 10.1523/JNEUROSCI.20-11-04286.2000. [DOI] [PMC free article] [PubMed] [Google Scholar]
- Sato H, Daw NW, Fox K. An intracellular recording study of stimulus-specific response properties in cat area 17. Brain Research. 1991;544:156–161. doi: 10.1016/0006-8993(91)90899-7. [DOI] [PubMed] [Google Scholar]
- Saul AB, Humphrey AL. Temporal-frequency tuning of direction selectivity in cat visual cortex. Visual Neuroscience. 1992;8:365–372. doi: 10.1017/s0952523800005101. [DOI] [PubMed] [Google Scholar]
- Sillito AM. Inhibitory circuits and orientation selectivity in the visual cortex. In: Rose D, Dobson VG, editors. Models of the Visual Cortex. New York: John Wiley and Sons; 1985. pp. 396–407. [Google Scholar]
- Skottun BC, De Valois RL, Grosof DH, Movshon JA, Albrecht DG, Bonds AB. Classifying simple and complex cells on the basis of response modulation. Vision Research. 1991;31:1079–1086. doi: 10.1016/0042-6989(91)90033-2. [DOI] [PubMed] [Google Scholar]
- Somers DC, Nelson SB, Sur M. An emergent model of orientation selectivity in cat visual cortical simple cells. Journal of Neuroscience. 1995;15:5448–5465. doi: 10.1523/JNEUROSCI.15-08-05448.1995. [DOI] [PMC free article] [PubMed] [Google Scholar]
- Sompolinsky H, Shapley RM. New perspectives on the mechanisms fro orientation selectivity. Current Opinions in Neurobiology. 1997:515–522. doi: 10.1016/s0959-4388(97)80031-1. [DOI] [PubMed] [Google Scholar]
- Stafstrom CE, Schwindt PC, Chubb MC, Crill WE. Properties of persistent sodium conductance and calcium conductance of layer v neurons from cat sensorimotor cortex in vitro. Journal of Neurophysiology. 1985;53:153, 170. doi: 10.1152/jn.1985.53.1.153. [DOI] [PubMed] [Google Scholar]
- Stühmer A, Roberts M, Almers W. The loose patch clamp. In: Sakmann B, Neher E, editors. Single Channel Recording. New York: Plenum Press; 1983. pp. 123–132. [Google Scholar]
- Szulborski RG, Palmer LA. The two-dimensional spatial structure of nonlinear subunits in the receptive fields of complex cells. Vision Research. 1990;30:249–254. doi: 10.1016/0042-6989(90)90040-r. [DOI] [PubMed] [Google Scholar]
- Tanaka K. Cross-correlation analysis of geniculostriate neuronal relationships in cats. Journal of Neurophysiology. 1983;49:1303–1318. doi: 10.1152/jn.1983.49.6.1303. [DOI] [PubMed] [Google Scholar]
- Tanaka K. Organization of geniculate inputs to visual cortical cells in the cat. Vision Research. 1985;25:357–364. doi: 10.1016/0042-6989(85)90060-4. [DOI] [PubMed] [Google Scholar]
- Tolhurst DJ, Dean AF. Spatial summation by simple cells in the striate cortex of the cat. Experimental Brain Research. 1987;66:607–620. doi: 10.1007/BF00270694. [DOI] [PubMed] [Google Scholar]
- Tolhurst DJ, Dean AF. The effects of contrast on the linearity of spatial summation of simple cells in the cat's striate cortex. Experimental Brain Research. 1990;79:582–588. doi: 10.1007/BF00229326. [DOI] [PubMed] [Google Scholar]
- Toyama K. Functional connection of the visual cortex studied by cross-correlation techniques. In: Rakic P, Singer W, editors. Neurobiology of Neocortex. New York: John Wiley & Sons; 1988. pp. 203–217. [Google Scholar]
- Troyer TW, Krukowski AE, Priebe NJ, Miller KD. Contrast-invariant orientation tuning in cat visual cortex: Thalamocortical input tuning and correlation-based intracortical connectivity. Journal of Neuroscience. 1998;18:5908–5927. doi: 10.1523/JNEUROSCI.18-15-05908.1998. [DOI] [PMC free article] [PubMed] [Google Scholar]
- Volgushev M, Pei X, Vidyasagar TR, Creutzfeldt OD. Excitation and inhibition in orientation selectivity of cat visual cortex neurons revealed by whole-cell recordings in vivo. Visual Neuroscience. 1993;10:1151–1155. doi: 10.1017/s0952523800010257. [DOI] [PubMed] [Google Scholar]
- Volgushev M, Vidyasagar TR, Pei X. A linear model fails to predict orientation selectivity of cells in the cat visual cortex. Journal of Physiology. 1996;496:597–606. doi: 10.1113/jphysiol.1996.sp021711. [DOI] [PMC free article] [PubMed] [Google Scholar]