

Abstract
The spiking of cortical neurons critically depends on properties of the afferent stimuli. In the visual cortex, neurons respond selectively to the orientation and direction of movement of an object. The orientation and direction selectivity is improved upon transformation of the membrane potential changes into trains of action potentials. To address the question of whether the transformation of the membrane potential changes into spiking of a cell depends on the stimulus orientation and the direction of movement, we made intracellular recordings from the cat visual cortex in vivo during presentation of moving gratings of different orientations. We found that the relationship between the membrane polarization and the firing rate (input-output transfer function) depended on the stimulus orientation. The input-output transfer function was steepest during responses to the optimal stimulus; membrane depolarization of a given amplitude led to generation of more action potentials when evoked by an optimal stimulus than during non-optimal stimulation. The threshold for the action potential generation did not depend on stimulus orientation, and thus could not account for the observed difference in the transfer function. Oscillations of the membrane potential in the γ-frequency range (25–70 Hz) were most pronounced during optimal stimulation and their strength changed in parallel with the changes in the transfer function, suggesting a possible relationship between the two parameters. We suggest that the improved input-output relationship of neurons during optimal stimulation represents a novel mechanism that may contribute to the final sharp orientation selectivity of spike responses in the cortical cells.
The frequency of action potentials and the discharge pattern of cells in sensory areas of the neocortex reflect the properties of objects in the surrounding world. A cortical neuron responds preferentially to stimuli of a particular kind. Among the best studied examples of response specificity are orientation and direction selectivity in the visual cortex of cats and monkeys (Hubel & Wiesel, 1962; Benevento et al. 1972; Orban, 1984; Henry et al. 1994; Vidyasagar et al. 1996; Sompolinsky & Shapley, 1997). Most of the cortical cells generate action potentials only when the orientation and direction of movement of the stimulus that is presented in the receptive field correspond to a narrow range that is preferred by that cell. A high degree of specificity of cortical responses to the orientation and direction of movement of visual objects is produced by the co-operative action of multiple mechanisms (Henry et al. 1994; Vidyasagar et al. 1996; Sompolinsky & Shapley, 1997). An initial mild selectivity of membrane potential responses is brought about by orientation biases of thalamic inputs (Hubel & Wiesel, 1962; Benevento et al. 1972; Ferster, 1987; Vidyasagar, 1987; Ferster & Jagadeesh, 1992; Pei et al. 1994), and is amplified by voltage-sensitive conductances of the cell membrane (Nowak et al. 1984; Thomson et al. 1988; Huguenard et al. 1989; Deisz et al. 1991; Volgushev et al. 1992; Stuart & Sakmann, 1995) and by excitatory and inhibitory intracortical circuitry (Benevento et al. 1972; Vidyasagar, 1987; Douglas & Martin, 1991; Volgushev et al. 1993, 1996; Nelson et al. 1994; Pei et al. 1994; Douglas et al. 1995; Vidyasagar et al. 1996; Sompolinsky & Shapley, 1997). Further improvement in the selectivity takes place upon transformation of the membrane polarization into the spike responses, whereby only strong membrane depolarizations evoked by the stimuli of the optimal range lead to discharges, while weaker membrane potential responses remain mostly below the threshold for action potential generation (Carandini & Ferster, 2000; Volgushev et al. 2000a). Both earlier (Granit et al. 1963) and recent studies (Jagadeesh et al. 1992; Carandini et al. 1996; Gray & McCormick, 1996; Carandini & Ferster, 2000) demonstrated that a simple threshold-and-rectification model represents a good approximation of the relationship between the membrane potential and the discharge rate. However, application of this model to the analysis of spike generation during presentation of visual stimuli accounted for only about half of the variance of the firing rate of a cell (median 52 %; Carandini & Ferster, 2000). The extent to which the response selectivity is improved at the stage of transformation of the membrane polarization into spike responses was only partially accounted for by that model.
Here we investigate the following: (1) whether the relationship between the membrane polarization and the spiking frequency of a visual cortical neuron depends on parameters of visual stimulation; (2) the parameter(s) of the threshold-and-rectification relationship that may be affected; and (3) the role that the fine temporal structure of the input activity may play in postsynaptic integration.
Some of these results have been presented in abstract form (Volgushev et al. 2000b).
METHODS
Surgery and maintenance of animals were similar to those described in detail earlier (Pei et al. 1994; Volgushev et al. 1996, 2000a). Briefly, seven adult cats (3.0–4.5 kg) were anaesthetized with ketamine hydrochloride (Ketanest, Parke-Davis GmbH, Germany; 0.3 ml kg−1, i.m.) and Rompun (Bayer, Germany; 0.08 ml kg−1, i.m.). Surgery was started after stable anaesthesia with complete analgesia was achieved. The animal was placed in a stereotaxic frame, the skull was exposed and a craniotomy was performed over area 17 of the visual cortex. The hydraulically driven microelectrode holder (Narishige Instruments, Japan) was mounted directly onto the skull. During the experiment, adequate anaesthesia was maintained by a gas mixture of N2O:O2 (70:30) and 0.2–0.4 % halothane (Eurim-Pharm, Germany). Fluid replacement was achieved by the intra-arterial administration of 6 ml h−1 of Ringer solution containing 1.25 % glucose. Neuromuscular blockade was established by intra-arterial infusion of alcuronium chloride (0.15 mg kg−1 h−1) in Ringer solution. Artificial respiration was performed with a cat/rabbit ventilator (Model 6025, Ugo Basile, Biological Research Apparatus, Comaria-Varese, Italy). The volume (20–40 cm3) and the rate of stroke (7–15 min−1) were adjusted to maintain end-tidal CO2 between 3.5 and 4.0 %. End-tidal CO2, body temperature, heart rate, blood pressure and EEG were continuously monitored. At the end of the experiment, animals were killed by increasing the halothane concentration and injection of an overdose of barbiturate. The methods were in accordance with the guidelines published in the European Communities Council Directive (86/609/EEC, 1986) and were approved by a local animal welfare committee (Bezirksregierung Arnsberg, Germany).
Intracellular recordings from neurons in the visual cortex were made with sharp electrodes filled with 2.5 m potassium acetate or 1 m potassium acetate and 1 % biocytin (Sigma-Aldrich GmbH, Germany). Electrode resistance was 70–120 MΩ. After amplification (Axoclamp 2, Axon Instruments, USA, and additional DC-amplifier, total gain × 50 or × 100) and lowpass filtering at 3–5 kHz, the data were digitized at 10–20 kHz and fed into a computer (Spike-2, Cambridge Electronic Design, Cambridge, UK; PC-586). Cells with stable resting membrane potential (mean, −67.3 ± 2.59 mV; n = 15), recorded for at least 15 min, were used for further analysis. Ten of these 15 cells were recorded for longer than 30 min. Moving gratings for visual stimulation were generated on the screen of another computer using subroutines of the Vision Works stimulation system (Cambridge Research Systems, NH, USA) and our own programs. Stimuli were presented monocularly to the dominant eye. Stimuli of different orientations were presented in a pseudorandom sequence. A complete set of orientations (8–16 in different cells) was repeated several times (1–5 in different cells). Gratings of different orientations, presented to a given cell, had the same contrast as well as spatial and temporal frequencies. The mean resting potential was calculated as follows: the mean value of the membrane potential was first calculated in 100 ms epochs taken just before presentation of each stimulus, then these values were averaged across all stimuli in a set and across all repetitions. This final mean value was used for all further calculations (of response amplitude, spike threshold, etc.) and is referred to as the mean resting potential of a cell. Action potentials were detected by a computer algorithm based on measurements of the voltage change rate (dV/dt). When, during a period of 0.1–0.4 ms, dV/dt remained within a pre-set range, an event was considered as a rising slope of an action potential. Detected spikes were highlighted on the trace of the membrane potential record and also displayed at high temporal resolution to control the performance of the algorithm. The length of the window and the limits for dV/dt change were adjusted individually for each cell. The lower limit of the rate of dV/dt was set to assure that no subthreshold events were included and the upper limit was set to prevent misdetection of electric artefacts as spikes. Typically, we used a window of 0.3 ms width and voltage change rates between 15 and 1500 V s−1. During the upstroke the spikes in different cells had average slopes between 65 and 200 V s−1 (mean, 117 ± 9.9 V s−1; n = 15 cells). The threshold of action potential generation was determined as the difference between the voltage at which the regenerative process started (dV/dt reached a pre-set value, as above) and the mean resting potential (Volgushev et al. 2000c). This algorithm was similar to that used recently by Azouz & Gray (1999). On average, the spike threshold was 11.8 ± 1.35 mV more positive than the mean resting potential (n = 15). For calculation of the membrane potential responses, spikes were removed from the traces. The magnitude of the postsynaptic potential (PSP) response was estimated as the deviation of the membrane potential from the mean resting level (calculated as described above). Cells were classified as simple or complex according to standard criteria (Orban, 1984). A selectivity index was calculated as the ratio of the difference between responses to optimal and non-optimal orientations (or optimal and null directions) divided by their sum. The selectivity index can vary from 0 to 1; 1 corresponds to the maximal selectivity. To calculate the bandwidth of the tuning of PSPs or spikes, the response strength was expressed as a percentage of the range between the maximal response (100 %) and the minimal response (0 %). The width of the resulting tuning at the 50 % level was calculated and is referred to as tuning bandwidth. Fourier analysis of membrane potential oscillations was performed using Spike-2 software (Cambridge Electronic Design). Fourier analysis was performed for the epochs during which a cell was stimulated with a moving grating of a particular orientation, from the beginning to the termination of the grating movement. The duration of the epochs used for Fourier analysis varied between 3 and 5 s in different cells depending on the duration of grating movement, but in each cell the duration of the epochs used for the analysis of responses to different orientations of the grating was the same. For statistical evaluation of the data we used SPSS for Windows software (SPSS Inc., Chicago, IL, USA) and our own programs. We used Student's two-tailed t test and non-parametric Wilcoxon and Kolmogorov-Smirnov tests. Student's t test was used to evaluate the significance of the correlation between the two variables in regression analysis. Differences were considered as significant at P < 0.05 if not stated otherwise. Data are presented as means ± s.e.m.
RESULTS
We studied the relationship between spike responses and the underlying membrane potential changes using intracellular recordings from neurons in the cat visual cortex. In a visual cortical cell with a complex receptive field, an optimally oriented grating drifting in the preferred (optimal) direction induced a strong and sustained depolarization shift of the membrane potential from the resting level and vigorous spiking (Fig. 1A). Typically for complex cells, both the membrane potential and spiking were only weakly modulated at the temporal frequency of the stimulation. When the grating moved in the opposite (null) direction, the amplitude of the depolarization shift of the membrane potential became much lower, and the spike responses were weaker. An orthogonally oriented (non-optimal) grating failed to evoke any substantial depolarization of the cell membrane potential, rather it led to a pronounced hyperpolarization of the cell by 7–8 mV. Occasionally, the hyperpolarizing response was interrupted by a short depolarization during which a few spikes appeared (Fig. 1A). Both the membrane potential responses and the spiking of this cell depended markedly on the stimulus orientation and direction of movement. Orientation and direction selectivity of the spike responses was higher than that of the PSPs; the selectivity indices increased from 0.81 to 0.90, and from 0.19 to 0.35, respectively. To compare the tuning of the PSPs with the tuning of spikes, the response strength was expressed as a percentage of the range between the maximal response, taken as 100 %, and the minimal response, taken as 0 % (Fig. 1B). The resulting tuning curves show that the tuning of spike responses was narrower than that of the membrane potential responses (23.4 and 54.8 deg, respectively). The higher selectivity and sharper tuning of spike responses was typical for visual cortical cells (Fig. 1C and D). On average (n = 15), orientation selectivity of spike responses was about two times higher, and direction selectivity about three times higher than those of PSP responses (0.98 ± 0.02 vs. 0.55 ± 0.04 and 0.51 ± 0.08 vs. 0.14 ± 0.02, respectively; P < 0.005, Wilcoxon test). The bandwidth of the tuning curve was significantly narrower for the spike responses (33.5 ± 3.4 vs. 59.8 ± 7.1 deg; P < 0.005).
Figure 1. Orientation selectivity of postsynaptic potential and spike responses.
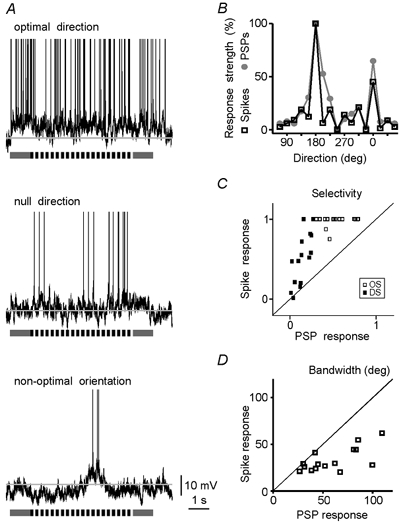
A, responses of a complex cell in cat visual cortex to a grating moving in the optimal direction, in the opposite (null) direction and to the non-optimally oriented grating. In this and subsequent figures, grey horizontal lines indicate the mean membrane potential during the interstimulus intervals (−78 mV for this cell), and bars below the membrane potential traces indicate grating on- and off-set, period of movement and temporal frequency. Action potentials are truncated. B, dependence of the amplitude of the membrane potential response (PSPs, •) and of the spike response (Spikes, □) on the direction of stimulus movement for the cell shown in A. The strength of both PSP and spike responses is normalized between 0 and 100 % to facilitate comparison of tuning curves. C, scatter diagram showing the relationship between the selectivity of the spike responses (ordinate) and the membrane potential responses (abscissa) for the whole sample. □, orientation selectivity data; ▪, direction selectivity data. D, scatter diagram showing the relationship between the bandwidth of orientation tuning of spike responses (ordinate) and membrane potential responses (abscissa) for the whole sample.
To address the question of whether more action potentials are evoked by the optimal stimuli simply because of a more depolarizing input, or whether an additional mechanism facilitating spike generation may be involved, we studied the PSP-to-spike transfer function of a cell during presentation of stimuli of different orientations. To calculate the transfer function, intracellularly recorded responses of a cell to a moving grating of a particular orientation were divided into equal successive time intervals of 25–100 ms. In each of these intervals the spiking frequency and, after removing the spikes, the average deviation of the membrane potential from the mean resting level were measured (Fig. 2A and B). Pairs of these values obtained in sliding time-windows were used to plot the PSP-to-spike transfer function (Fig. 2C), which shows the relationship between membrane potential polarization and spiking frequency. In the transfer function of a cell, three regions could be distinguished. Low-amplitude PSPs remained sub-threshold and did not evoke spikes. In the threshold range, the membrane depolarization of a given amplitude could either lead to spikes or fail to evoke action potentials. In the supra-threshold range of PSP amplitudes the spikes were securely generated, although their number varied (Fig. 2C and Fig. 3A). The PSP-to-spike transfer functions of a cell were calculated separately for each stimulus orientation and direction of movement. Interestingly, the relationship between the PSP amplitude and the spiking frequency was not the same during presentation of stimuli of different orientations. Supra-threshold membrane depolarizations of comparable mean amplitude usually led to generation of more spikes during the optimal stimulation than during presentation of stimuli of any other orientation or direction of movement (Fig. 3A and D). To quantify the PSP-to-spike transfer function we used a simple rectification model. A linear regression between the PSP amplitude and the spiking frequency was calculated for those time windows in which action potentials were generated. We used a simple y-on-x regression for estimation of the slopes since it allows calculation of the slope directly from the data. Any other method of formalization of the transfer function would include additional assumptions and free parameter(s), which cannot be calculated from the data and thus would make the estimation of the slope less secure. A simple rectification model has been shown to provide a reasonably good approximation of the relationship between the membrane polarization and the firing frequency (Granit et al. 1963; Jagadeesh et al. 1992; Carandini et al. 1996; Gray & McCormick, 1996; Carandini & Ferster, 2000). The slope of the transfer function was significantly (P < 0.001) steeper during the optimal than during the non-optimal responses. To control for reliability of this relationship, we calculated the transfer function and its slope in each cell using sliding windows of a different width (range 25–100 ms). Independently of the width of the sliding window, the slope of the transfer function was steepest during the optimal stimulation (data not shown). Further, calculation of the transfer function from repeated presentation of the same stimuli also showed the robustness of this relationship. In all but one of 13 cells in which enough spikes were generated to allow calculation of the transfer function from individual stimulus presentations, the maximal slope of the transfer function was repeatedly associated with presentation of the stimuli of optimal orientation. The difference between the preferred and null direction of movement of optimally oriented grating was less consistent: in 5 of 12 cells, repetitive estimations of the transfer function revealed the steepest slope either during the preferred or null direction. However, in both situations the slopes were steeper than during responses to non-optimal orientation. The steepest slope of the transfer function during the optimal stimulation was typical for the whole sample (P < 0.01 for 14 of 15 cells). For quantitative comparison of the data across the sample we used estimations of transfer functions from the responses to the optimal, null and non-optimal stimuli. In all 15 cells the transfer functions were calculated using sliding windows of the same width (50 ms). For the time windows in which spikes were generated, the firing frequency was significantly correlated with the membrane potential changes in 42 out of 45 cases (P < 0.001 in 25 cases, P < 0.01 in 7 cases, P < 0.05 in 10 cases). In the remaining three cases, the significance level was not reached because of the low frequency of action potentials in non-optimal responses. However, when calculated for the ranges of matched PSP amplitudes, which also included data points with no spikes (see below), the correlation between the spiking and the membrane potential change was significant in all 45 cases (P < 0.001 in 42 cases, P < 0.01 in 2 cases, P < 0.05 in 1 case). The relationship between parameters of the transfer functions during the optimal vs. non-optimal, or optimal vs. null, responses is shown in the scatter plots of Fig. 3E–H. In the scatter plot in Fig. 3E, most of the points and all diamond-shaped symbols, which show the relationship of slopes of transfer functions during the optimal as compared to non-optimal orientation, are located above the main diagonal. The slopes of the transfer functions during presentation of the optimally oriented gratings moving in the optimal direction were steeper than those calculated from the responses to the opposite, null direction of movement. All but a few open circles in the scatter plot of Fig. 3E are located above or at the main diagonal. Group data analysis revealed that the slope of the transfer function during optimal stimulation was significantly steeper than during stimulation with gratings of non-optimal orientation (7.29 ± 3.15 vs. 2.02 ± 0.65 Hz mV−1; Kolmogorov-Smirnov test, P = 0.017). During presentation of gratings that moved in a null direction of movement, the slope of the transfer function was typically (in 10 out of 15 cells) between the optimal and the non-optimal value (4.97 ± 1.87 Hz mV−1). When the data for non-optimal and null stimulation were pooled together, the difference between the pooled data and the slopes during the optimal stimulation remained significant (Kolmogorov-Smirnov test, P = 0.0046). Steeper transfer functions were associated with stronger spike responses, as demonstrated by the significant correlation (P < 0.05) between the slope of the transfer function and the total number of spikes in the response in all but three cells in our sample.
Figure 2. Calculation of the input-output transfer function of a cell.
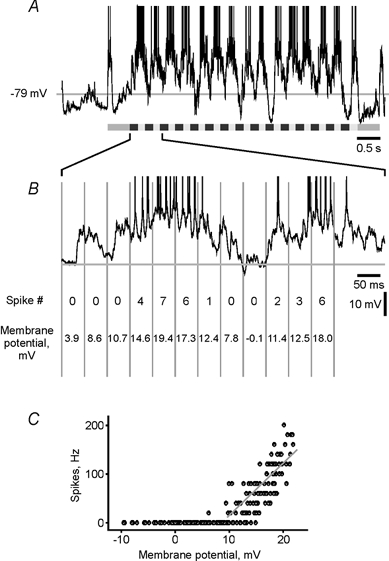
A, response of a simple cell to a moving grating; spikes are truncated. B, part of the response in A shown at an expanded (× 10) time scale and divided into successive 50 ms intervals (vertical grey lines). In each interval the number of spikes and the deviation of the membrane potential from the mean resting level were calculated. C, plot of PSP-to-spike transfer function using pairs of the membrane potential and spiking frequency values obtained from each 50 ms window of the whole response shown in A. The transfer function shows the dependence of spiking frequency (ordinate) on the membrane polarization relative to the mean resting level (abscissa). A regression line was calculated for the time windows with spikes. r = 0.74, P < 0.001.
Figure 3. Transformation of PSPs to spike responses depends on stimulus orientation.
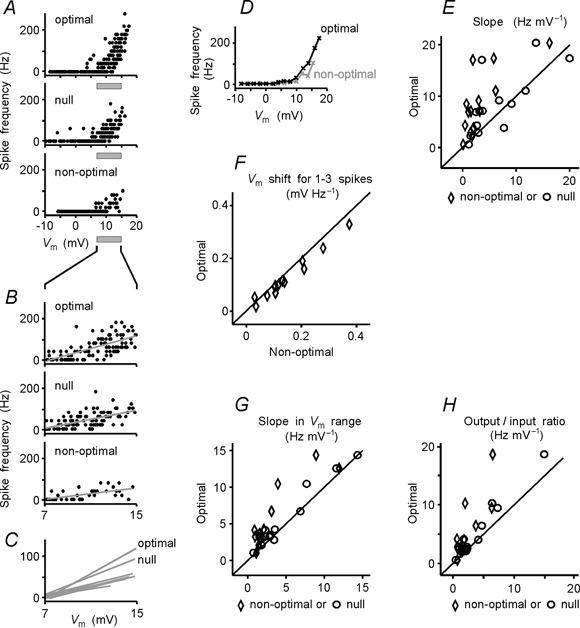
A, PSP-to-spike transfer functions of a cell calculated from 5 s responses to presentation of optimal grating, the same grating moving in a null direction and non-optimally oriented grating. Width of the sliding window for estimation of the transfer function was 50 ms. Optimal: r = 0.71, P < 0.001; null: r = 0.44, P < 0.001; non-optimal: r = 0.46, P < 0.05. B, PSP-to-spike transfer functions in a selected range of PSP response amplitudes, as indicated in A. The range was selected to yield a similar mean amplitude of PSP responses to stimuli of any orientation. Regression lines and their slopes were calculated for all data points within the selected range. Optimal: r = 0.71; null: r = 0.61; non-optimal: r = 0.62; P < 0.001 for all three cases. C, superimposed regression lines for PSP-to-spike transfer functions within the selected range of matching PSP amplitudes for eight stimulus orientations. Note that transfer functions are steeper during presentation of optimally oriented stimuli moving in either (optimal or null) directions when compared to stimuli of other than optimal orientations. D, running window averages of PSP-to-spike transfer function during the optimal and non-optimal stimulation (data from A). To calculate the running window average, membrane potential and spiking frequency values were averaged within 2 mV intervals and connected by the line. E, relationship between the slopes of PSP-to-spike transfer functions during optimal stimulation (ordinate) and during null (circles) or non-optimal (diamonds) stimulation (abscissa) for the whole sample. Regression lines and their slopes were calculated (as in the example shown in A) for the time windows during which spikes were generated. F, population data for the relationship between the mean value of the membrane potential in the 50 ms windows and 1–3 action potentials during optimal stimulation (ordinate) and non-optimal stimulation (abscissa). G and H, population data for the relationship between the slopes of PSP-to-spike transfer functions (G) and output/input ratios (H) within selected ranges of matching amplitudes of PSP responses to optimal, null and non-optimal stimulation. The slope of the transfer function (G) and output/input ratio (H) during optimal stimulation (ordinate) are plotted against those during null or non-optimal stimulation (abscissa). The slope of the transfer function was calculated as in the example illustrated in B, within selected ranges of matching PSP response amplitudes; the output/input ratio was calculated as mean spiking frequency divided by the mean membrane potential response. In E-H, diagonals show equality lines.
One possible reason for the steeper PSP-to-spike transfer function during optimal stimulation could be the occurrence of PSP and spike responses of very large amplitudes that were never evoked by non-optimal stimuli. Strong membrane depolarization and spiking at high frequency, which occurred during the optimal responses, could have been a source of two types of error in calculation of the PSP-to-spike transfer function, and thus could affect the comparison of the transfer function of a cell during the optimal and non-optimal stimulation. The first type of error could be due to the shunting of the membrane depolarization by the action potentials generated at a high frequency. The second type of error could be due to a supra-linear increase of the spiking rate with very strong depolarization of the membrane. Any of these possible errors would lead to an overestimation of the steepness of the slope of the transfer function during optimal stimulation. To check for these possibilities we made the following analyses in a restricted range of firing rates or in a restricted range of PSP response amplitudes. To determine whether a difference in spiking rates could have contributed to the observed differences in the slopes of the transfer function, we calculated the average membrane potential depolarization for data points with 1–3 spikes. This low firing rate was observed during both optimal and non-optimal responses. In 14 of 15 cells, the membrane depolarization leading to the generation of 1–3 spikes was of a lower amplitude during the optimal than during the non-optimal stimulation (Fig. 3F). This difference was significant for the whole sample (P < 0.004, Wilcoxon test). Thus, higher firing rates during the optimal response do not account for the steeper PSP-to-spike transfer functions. To check for the second possibility, i.e. whether strong membrane depolarizations during the optimal responses could account for the steeper transfer functions, we made the following analysis in a restricted range of PSP responses from the threshold region to nearly maximal amplitudes of the non-optimal responses (Fig. 3B). This range was selected individually for each cell, but it remained the same for the analysis of the responses of the same cell to different stimuli. The range was selected in two steps as follows: (1) for responses to non-optimal stimulation from the distribution of membrane potential values for the windows with spikes, the extreme values were discarded (< 10 % of the values) and the limits of the remaining distribution defined the selected range, (2) as the next step, for each orientation we took all pairs of values of the membrane potential/spike number for which the membrane potential values fell within this selected range, i.e. those pairs also with zero spikes. The selection of the range of PSP response amplitudes allowed us to exclude influences on the estimation of transfer functions, on the one hand the large, possibly saturating responses, and on the other the occasional just-threshold spike generation. Furthermore, within that range, the membrane potential depolarizations evoked by the stimuli of any orientation were of similar average magnitude. This allowed us to describe spike generation during the optimal, null and non-optimal stimulation under conditions of membrane depolarizations of comparable magnitude. For the range of matched PSP amplitudes we estimated two parameters of the transfer function, its slope and its output/input ratio. The slope of the transfer function remained significantly steeper during the optimal responses than during responses evoked by stimuli of any other orientation (Fig. 3C). This relationship was representative for the whole sample (Fig. 3G). Comparison of the slopes of the transfer functions within the range of matched PSP amplitudes during optimal stimulation on the one hand, and non-optimal or null stimulation on the other, revealed a significant difference (7.40 ± 2.27 vs. 4.54 ± 0.96 Hz mV−1, Wilcoxon test, P < 0.01; Kolmogorov-Smirnov test, P = 0.011). As an additional parameter, which characterizes the transformation of the membrane potential changes within the range of matched amplitudes into spike responses, we calculated the output/input ratio. This was calculated as mean spiking frequency divided by the mean PSP response amplitude within the range of matched amplitudes. We used this parameter because the output/input ratio gives a better estimation of the spike rate increase per millivolt of the membrane depolarization than the slope in two peculiar situations that are possible in theory: (1) if a line with a steeper slope were located below the line with a smoother slope or (2) if the two lines with the same slope were shifted vertically one against the other. For the example in Fig. 3A–C, the output/input ratio was higher during the optimal than during the non-optimal or null stimulation (6.77, 3.28 and 5.86 Hz mV−1, respectively). For the whole sample, the output/input ratio during the optimal stimulation was significantly higher than during non-optimal or null stimulation (Fig. 3H) (4.84 ± 1.22 vs. 2.86 ± 0.55 Hz mV−1, Wilcoxon test, P < 0.01; Kolmogorov-Smirnov test, P < 0.001). These results demonstrate that higher amplitudes of membrane depolarizations during optimal responses do not account for the significantly steeper PSP-to-spike transfer functions. If membrane depolarization of the same mean magnitude is considered, more spikes are generated when evoked by an optimally oriented stimulus.
It has been reported recently (Azouz & Gray, 1999) that the threshold for action potential generation in visual cortical neurons in vivo could fluctuate in a range of about 10 mV. If the spike threshold were systematically lower during optimal stimulation, this could account for the observed difference in transfer functions. To test for this possibility, we estimated the threshold for spikes generated by a cell during presentation of moving gratings of different orientations and during interstimulus intervals. Spike thresholds were estimated from the same data sets as were used for quantification of the transfer functions. In addition to the periods of stimulus presentation, interstimulus intervals were also included in the analysis. Figure 4A–C shows an example of such an estimation. During two repetitive presentations of a set of eight stimulus orientations, this simple cell generated 818 action potentials. The threshold of each spike relative to the mean membrane potential was determined using a computer algorithm (see Methods) and was plotted against the number of the action potential in Fig. 4B. These data show that, although the spiking threshold fluctuated, its variation was not correlated with the stimulus orientation. The independence of the threshold for the generation of action potentials in relation to the stimulus orientation is further evident from the comparison of the distributions of the thresholds of spikes generated during the whole period of analysis and during optimal or non-optimal stimulation. Neither the shape of the three distributions nor the mean values were significantly different from each other (20.6 ± 1.73 mV, n = 818; 20.4 ± 1.57 mV, n = 109; 20.4 ± 1.49 mV, n = 46; for all comparisons, Student's t test, P > 0.4 and Wilcoxon test, P > 0.5; Fig. 4C). This result was consistent for all other cells in our sample. Figure 4D shows the relationship between the mean threshold for spike generation during optimal or non-optimal stimulation (ordinate), plotted against the mean spike threshold as estimated for the whole period of analysis. In this figure, all points are located at the main diagonal or close to it, either slightly above or below, demonstrating the absence of systematic differences between the spike thresholds estimated for different conditions of stimulation. The mean values of the threshold for action potential generation during the whole period of analysis and during the optimal and non-optimal stimulation did not differ significantly (11.8 ± 1.22, 11.9 ± 1.26 and 11.7 ± 1.26 mV, respectively, n = 15; t test and Wilcoxon test, P > 0.8; Kolmogorov-Smirnov test, P > 0.99 for all three comparisons). These data demonstrate that spike generation threshold did not depend on stimulus orientation and hence fluctuations of the spiking threshold cannot account for the difference in the PSP-to-spike transfer function during optimal and non-optimal stimulation. Thus, the threshold, unlike the slope of the membrane potential to spike relationship, was not affected by changing the stimulus orientation.
Figure 4. Threshold for action potential generation does not depend on stimulus orientation.
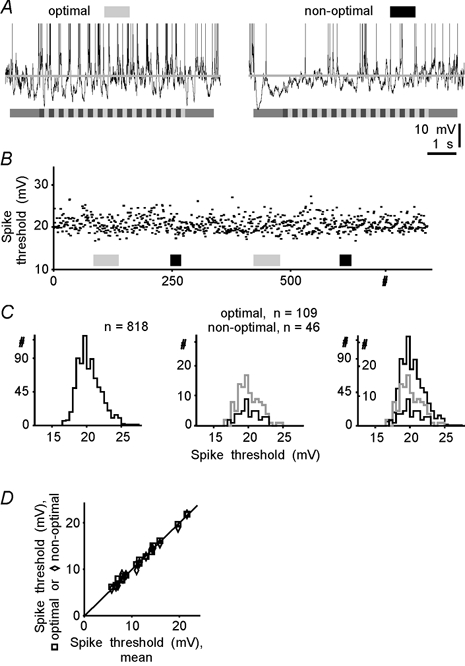
A, responses of a cortical cell to the moving grating of optimal and non-optimal orientation. Mean membrane potential during the interstimulus intervals was −69 mV; spikes are truncated. B, thresholds of 818 action potentials generated by a cortical cell during responses to moving gratings of different orientation and during interstimulus intervals. Each point represents the threshold of one action potential. Spikes generated during responses to optimal and non-optimal stimulation are indicated by the grey and filled bars, respectively. Since more spikes occurred during the optimal stimulation, the grey bars are longer. Other orientations are not indicated for clarity. C, distribution of the thresholds of the action potentials generated during the whole period of analysis (left), during optimal and non-optimal responses (middle), and superposition of the three distributions (right). Note that the three distributions do not differ significantly. Data in A-C are from the same cell. D, relationship between the threshold for action potential generation during presentation of stimuli of optimal (squares) or non-optimal (diamonds) orientation (ordinate) and the mean spike threshold estimated for the period of presentation of the whole set of orientations (abscissa). Data for 15 cells. Diagonal shows an equality line.
It is known from in vitro experiments that sine-wave or white-noise modulation of the membrane potential is more effective in evoking reliable spiking than a current step of a similar or even higher constant amplitude (Mainen & Sejnowski, 1995; Volgushev et al. 1998). Furthermore, optimal stimulation of cortical cells is often accompanied by high-frequency oscillations of the local field potential and multiunit activity (Eckhorn et al. 1988; Gray & Singer, 1989; Singer, 1993; Singer & Gray, 1995). Oscillations of the membrane potential were also found in visual cortical neurons (Jagadeesh et al. 1992; Gray & McCormick, 1996; Azouz & Gray, 1999), but their dependence on stimulus orientation has not been investigated so far. To assess possible differences in the fine temporal structure of the membrane potential responses evoked by stimuli of different orientations, we performed a power-spectrum analysis. Oscillations of the membrane potential in the γ-frequency range (25–70 Hz) were always stronger during responses to the optimally oriented gratings than during non-optimal responses. This relationship was observed in cells with receptive fields of both simple (Fig. 5A) and complex (Fig. 5B) type, and was consistently found in our sample (Fig. 5C, diamond-shaped symbols). The comparison of the strength of γ-frequency oscillations of the membrane potential during optimal and null-direction of movement revealed an overall tendency of the γ-power to be weaker during the null-stimulation, although in few cases its strength was essentially the same under these two conditions of stimulation. Such cases are represented by the open circles that are positioned on the main diagonal in Fig. 5C. For the whole sample, a strong correlation was found between the power of γ-frequency oscillations of the membrane potential and the number of spikes in the response (r = 0.76, P < 0.001).
Figure 5. Strength of membrane potential oscillations in the γ-frequency range depends on stimulus orientation and is related to the PSP-to-spike transfer function of the cell.
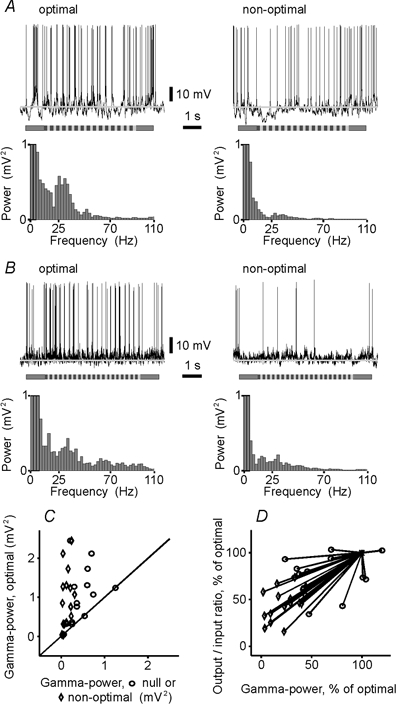
A and B, responses of a simple (A) and a complex (B) cell to gratings of the optimal and non-optimal orientations and power spectra, calculated after removing the spikes. The mean membrane potential during interstimulus intervals (grey lines) was −64 mV in A and −74 mV in B. Initial bins of power spectra are truncated. Note the stronger oscillations of the membrane potential in the γ-frequency range (25–70 Hz) during the optimal stimulation in both cells. C, relationship between the strength of membrane potential oscillations in the γ-frequency range during optimal stimulation (ordinate) and during grating movement in the null direction or at non-optimal orientation (abscissa) for the whole sample. Diagonal shows equality line. D, relationship between changes of output/input ratio (ordinate) and power of γ-frequency oscillations of the membrane potential (abscissa) with stimulus orientation. For each cell, the output/inputc ratio within a range of matching amplitudes (see Fig. 3B, E and F for details) and the γ-power of the membrane potential oscillations during presentation of grating of non-optimal orientation (diamonds) or moving in the null direction (circles) were plotted as a percentage of the optimal for the cell and connected with a line to the optimum (asterisk, 100 %). Note the clear tendency for the output/input ratio to increase when the γ-power increases.
Changing the stimulus orientation led to parallel changes of the transfer function and of the strength of membrane potential oscillations in the γ-frequency range. In each cell, we calculated the correlation between the output/input ratio and the γ-power of the membrane potential oscillations, using data obtained from several presentations of the gratings of different orientations. In 13 of 15 cells, the correlation between these two parameters was significant, with correlation coefficients ranging between 0.56 and 0.91 (P < 0.001 in 4 cells, P < 0.01 in 3 cells and P < 0.05 in 6 cells). To illustrate this relationship for the whole sample, we plotted (Fig. 5D) the output/input ratio and the γ-power of membrane potential oscillations during non-optimal (diamond-shaped symbols) and null (open circles) stimulation as a percentage of the optimal values, and connected each non-optimal and null value to the optimum by a line. All but three of these lines have a positive slope, demonstrating that an increase in the γ-power of the membrane potential oscillations was typically accompanied by an increase in the output/input ratio. Three exceptional cases, in which γ-frequency oscillations were apparently lower during the optimal as compared to the null direction of movement (circles to the right from 100 % on abscissa), represent cells with exceptionally weak oscillations in the γ-frequency range (compare Fig. 5C). The direction selectivity of these cells was also very low (selectivity index of the PSP responses < 0.06). Despite these exceptions, the correlation between changes in the output/input ratio and changes in the strength of the membrane potential oscillations in the γ-frequency range in the whole sample was strong and highly significant (r = 0.77, P < 0.001).
DISCUSSION
The most important results of this study could be summarized as follows: (1) the data presented here demonstrate that a cell's PSP-to-spike transfer function does not remain constant, but depends on the parameters of afferent stimulation, and is steepest during optimal stimulation; (2) we show that the threshold for action potential generation does not depend on the optimality of the stimulus; and (3) our data show that oscillations of the membrane potential in the γ-frequency range are strongest during the optimal stimulation. Furthermore, we found a covariance of the γ-power strength and the steepness of the transfer function. Below we discuss these points, as well as the implications of our findings for mechanisms of response selectivity and for spike generation in vivo.
Optimality of the stimulus and input-output gain
Our data show that the PSP-to-spike transfer function of a cell depends on the parameters of afferent stimulation. Depolarization of the cell membrane to the same mean level leads to generation of more action potentials when evoked by an optimal stimulus than during non-optimal stimulation. Several lines of evidence indicate that the observed dependence of the transfer function of a cell on stimulus orientation was not due to some peculiarities of our recording technique or data analysis. (1) Estimation of the transfer function from repeated trials yielded similar results. (2) Changing the width of the sliding time-window (25–100 ms) did not affect the main result, i.e. the slope of the transfer function remained steepest during the optimal responses. (3) For each cell, the frequency of spikes evoked by PSP depolarizations of matched amplitudes was higher during the responses to optimal than to non-optimal orientations. (4) The transfer function was significantly steeper during optimal than during non-optimal stimulation in most of the cells and this difference was highly significant in the group data.
Co-variation of the transfer function of a cell with the strength of γ-frequency oscillations of its membrane potential (see below) suggests that higher input-output gain might be associated with the higher temporal precision of the excitatory and inhibitory inputs to a cell, the inhibition acting in counter-phase to the excitation. This conjecture is supported by the observation that γ-frequency oscillations of the extracellularly recorded signals are accompanied by an increase in the correlation strength between spiking of individual neurons (Eckhorn et al. 1988; Gray & Singer, 1989; Gray et al. 1990). Excitatory inputs that are producing high-frequency oscillations of the membrane potential may originate from both thalamic relay cells and cortical neurons. The most conceivable sources of the excitatory intracortical inputs are the immediate neighbours of a cell that prefer similar orientations. Notably, inhibitory intracortical inputs, which are involved in fine temporal structuring of the membrane potential fluctuations of a cell during the optimal stimulation, should be strongly activated by that same stimulus orientation, and hence might also originate from nearby cortical neurons. Indeed, each cortical cell receives the majority of its excitatory and inhibitory synapses from its local neighbours (Kisvarday et al. 1997; Yousef et al. 1999). These local connections are known to contribute to orientation and direction selectivity (Crook & Eysel, 1992; Crook et al. 1996), and their precise temporal co-ordination might further improve response selectivity. Such a scenario may also explain why an overall amount of inhibition impinging onto the cell is often maximal during the strongest, optimal responses (Ferster 1987; Douglas & Martin 1991).
γ-Frequency oscillations of the membrane potential
Our data demonstrate that oscillations of the membrane potential in the γ-frequency range are strongest during the optimal stimulation. These results support earlier qualitative observations (Jagadeesh et al. 1992; Gray & McCormick, 1996; Azouz & Gray, 1999) and are complementary to the studies that reported clear cases of γ-frequency oscillations of the local field potentials, multiunit activity and the spiking of individual neurons in the visual cortex (Eckhorn et al. 1988; Gray & Singer, 1989; Gray et al. 1990). High-frequency oscillations observed in these extracellularly recorded signals were also stimulus dependent and were most prominent during presentation of the optimal stimuli (Eckhorn et al. 1988; Gray & Singer, 1989; Gray et al. 1990). Membrane potential oscillations most probably have a predominantly synaptic origin (Jagadeesh et al. 1992; Bringuier et al. 1997; Lampl et al. 1999), although in some cell types intrinsic membrane mechanisms may also contribute (Silva et al. 1991; Llinás et al. 1991; Jahnsen & Karnup, 1994; Gutfreund et al. 1995; Gray & McCormick, 1996; Hutcheon et al. 1996). Oscillations of the membrane potential could be instrumental for precise synchronization of discharges of nerve cells (Lampl & Yarom, 1993; König et al. 1996; Volgushev et al. 1998). It should be noted here that what really matters for the generation of reliable and precise spiking, and thus for producing synchronous patterns of activity of cell assemblies, is the presence of high-frequency components in the power spectra of the membrane potential fluctuations (Mainen & Sejnowski, 1995; Nowak et al. 1997). Since the γ-band includes a broad range of frequencies (25–70 Hz), increasing their strength will not necessarily lead to ‘oscillations’ in a strict sense (i.e. periodic changes with a constant frequency), but will nevertheless increase precision of action potential timing. Due to their ability to increase temporal precision of spike trains, oscillations in the γ-frequency range may facilitate the synchronization of activity of neuronal assemblies, and thus be involved in dynamic selection of functionally coherent cell assemblies; this was suggested as one of the potential solutions of the binding problem (Eckhorn et al. 1988; Gray & Singer, 1989; Singer, 1993, 1999; Singer & Gray, 1995; von der Malsburg, 1999).
We observed that changes in the input-output transfer function co-vary with the power of γ-frequency fluctuations of the membrane potential. This suggests a possible relationship between the two parameters and introduces a new possible role of γ-frequency fluctuations, namely the modulation of the gain at which depolarizations of the membrane of a neuron are translated into action potential trains. In other words, the fine temporal structure of the on-going synaptic input to a cell determines the gain at which that input is translated into cell discharges. One important implication of such dynamic gain regulation is that the final output (spiking) of a cell depends not only on the amplitude of the membrane depolarization, but is also determined by the fine temporal structure of the synaptic input. Increasing the strength of γ-frequency oscillations at the input may lead to an increase in the slope of the transfer function and thus to an amplification of the spike response. One further interesting consequence of the improved input-output relationship for γ-frequency activity in individual cells would be a selective increase in the impact of activity in that particular range and a facilitation of propagation of γ-range activity through the neural network. Increasing the strength of γ-frequency fluctuations at the common input to a cell assembly would increase temporal precision and thus the synchrony of spiking of the cells in that assembly. At the same time the high-frequency component of the input will be most accurately replicated in the output of that cell assembly. In turn, when the output of the assembly is composed of synchronous spiking with a high fraction of γ-range activity, it has the best chance of successfully activating common targets and providing that next-stage population of neurons with a tool (i.e. synchronous spiking) for further transmission of a message encoded by γ-frequency activity through the neuronal network.
A novel mechanism of response selectivity
The dependence of the transfer function of a cell on parameters of visual stimulation and its co-variation with the strength of γ-power of the membrane potential fluctuations suggest a novel mechanism that can increase the number of action potentials in the optimal response. Our data show that the input-output relationship is improved when visual cortical neurons are driven by their optimal stimulus. During the optimal stimulation, the frequency composition of the membrane potential contains a stronger component in the γ-frequency range. Under these conditions of increased precision of the counter-phase relationship between the excitation and inhibition, integration of excitatory inputs at the cellular membrane and spike generation become more efficient. This interpretation is supported by several lines of evidence from in vivo and in vitro studies. Extracellular recordings demonstrated that the optimal stimulation is usually associated with the strongest oscillations of the field potentials, multiunit activity and spiking of individual cells (Eckhorn et al. 1988; Gray & Singer, 1989; Gray et al. 1990). In a recent intracellular study, it was found that trial-to-trial variation of the spike count is linearly correlated with the amount of membrane potential fluctuation in the high-frequency (γ) range (Azouz & Gray, 1999). In vitro experiments showed that high-frequency modulation of the membrane potential of neocortical cells improves the temporal precision of spike responses and facilitates the generation of spike trains (Mainen & Sejnowski 1995; Carandini et al. 1996; Nowak et al. 1997; Volgushev et al. 1998).
On the basis of our findings and the published evidence we suggest that γ-frequency modulation of the synaptic input could constitute a novel mechanism for shaping the response selectivity of cortical neurons by improving the input-output relationship of a cell. Acting in co-operation with other mechanisms of response selectivity (Vidyasagar et al. 1996; Sompolinsky & Shapley, 1997) such as biased excitatory and inhibitory inputs (Hubel & Wiesel, 1962; Benevento et al. 1972; Ferster, 1987; Vidyasagar, 1987; Ferster & Jagadeesh, 1992; Volgushev et al. 1993, 1996; Pei et al. 1994), amplification of high-amplitude excitatory PSPs by voltage-gated membrane processes (Nowak et al. 1984; Thomson et al. 1988; Huguenard et al. 1989; Deisz et al. 1991; Volgushev et al. 1992; Stuart & Sakmann, 1995), sharpening of the selectivity upon PSP-to-spike transformation by a threshold mechanism (Carandini & Ferster, 2000; Volgushev et al. 2000a) and amplification of strong spike responses by positive feedback connections (Douglas & Martin, 1991; Nelson et al. 1994; Sillito et al. 1994; Douglas et al. 1995), this new mechanism might contribute to the final sharp tuning of cortical responses. Our preliminary estimations show that this mechanism accounts for about 10–30 % of the selectivity improvement that takes place during PSP-to-spike transformation (M. Volgushev, J. Pernberg and U. T. Eysel, unpublished data).
Implications for action potential generation in vivo
A classical view of spike generation considers a neuron to be an integrate-and-fire unit: when the membrane depolarization reaches a certain threshold, action potentials are generated and stronger depolarization leads to spiking at higher frequency (Granit et al. 1963). This simple threshold-and-rectification model provides a reasonably good approximation of the relationship between membrane depolarization and spiking (Jagadeesh et al. 1992; Carandini et al. 1996; Gray & McCormick, 1996; Carandini & Ferster, 2000). However, formal application of this model revealed its inability to adequately describe spike generation in a broader physiological context, for example regarding contrast-gain control in visual cortical neurons (Albrecht & Geisler, 1991; Heeger, 1992). On the basis of extracellularly recorded spike responses of cortical neurons an alternative, contrast-normalization model has been suggested to account for the generation of spike responses of cortical cells from supposed membrane potential changes under different conditions of visual stimulation (Albrecht & Geisler, 1991; Heeger, 1992; Carandini et al. 1997; Tolhurst & Heeger, 1997). Rigorous application of both these models to the real data revealed that in some experimental situations neither of the two provided a reasonable fit (Tolhurst & Heeger, 1997). An obvious drawback of both models is that they did not take into consideration (for the sake of simplicity of mathematical description of a model) the influence of the fine temporal structure of the membrane potential changes on spike generation, which, as our data show, modulates the input-output gain of the cell. The importance of the high-frequency components of the membrane potential fluctuations for spike generation has been clearly demonstrated in in vitro experiments with injection of currents of different frequency composition into the cells. Increasing the content of the high-frequency components in the injected signal led to an increase in the temporal precision and reproducibility of spike trains (Mainen & Sejnowski 1995; Carandini et al. 1996; Nowak et al. 1997). Our present data show that the fine temporal structure of the synaptic input is indeed of the utmost importance for spike generation in vivo during generation of responses to sensory stimulation. An increase in the γ-power of the membrane potential fluctuations improved the input-output relationship of cortical cells and facilitated action potential generation. A biophysically plausible explanation for the sensitivity of the spike generation mechanism to the high-frequency fluctuations, and thus to the rate of the membrane potential changes, is based on the dynamic balance between the inactivation and de-inactivation of voltage-gated sodium channels. Two synergistic processes might contribute here. First, since with stronger fluctuations of the membrane potential in the high-frequency range any depolarization is rapidly followed by a hyperpolarization of the membrane, de-inactivation of the voltage-gated sodium channels which were inactivated during the depolarization phase is facilitated. Second, when the membrane potential shifts towards the threshold of action potential generation, fewer channels will be inactivated during a fast rise of the potential as compared to a slower, low-frequency, depolarization. A recent in vivo study demonstrated that this kind of dynamic regulation of action potential generation is indeed highly relevant for sensory-evoked spike responses (Azouz & Gray, 2000). Consistent with the results reported by Azouz & Gray (1999, 2000) we can confirm that spike thresholds in vivo are not fixed values, but that they can fluctuate within a range of several millivolts. Our data extend these observations by showing that these fluctuations do not depend on stimulus orientation. Rather, the spiking threshold remains, on average, the same during presentation of stimuli of different orientation. In contrast to the threshold of action potential generation, the input-output gain did depend on stimulus orientation and was highest during optimal stimulation. This finding could partly explain why the models of spike generation with fixed gain fail to account for experimental data obtained under different conditions of stimulation. Including the gain as an additional variable might improve the performance of the models.
Acknowledgments
We are grateful to Drs Marina Chistiakova and Zoltan Kisvarday for comments on the earlier version of the manuscript, to Dr Sivert Lindstrom for stimulating discussions and to Dr Michail Moukovski for the help with statistical analysis of the data. This study is supported by the Deutsche Forschungsgemeinschaft SFB 509 TP A5.
REFERENCES
- Albrecht DG, Geisler WS. Motion selectivity and the contrast-response function of simple cells in the visual cortex. Visual Neuroscience. 1991;7:531–546. doi: 10.1017/s0952523800010336. [DOI] [PubMed] [Google Scholar]
- Azouz R, Gray CM. Cellular mechanisms contributing to response variability of cortical neurons in vivo. Journal of Neuroscience. 1999;19:2209–2223. doi: 10.1523/JNEUROSCI.19-06-02209.1999. [DOI] [PMC free article] [PubMed] [Google Scholar]
- Azouz R, Gray CM. Dynamic spike threshold reveals a mechanism for synaptic coincidence detection in cortical neurons in vivo. Proceedings of the National Academy of Sciences of the USA. 2000;97:8110–8115. doi: 10.1073/pnas.130200797. (abstract) [DOI] [PMC free article] [PubMed] [Google Scholar]
- Benevento LA, Creutzfeldt OD, Kuhnt U. Significance of intracortical inhibition in the visual cortex. Nature. 1972;238:124–126. doi: 10.1038/newbio238124a0. [DOI] [PubMed] [Google Scholar]
- Bringuier V, Fregnac Y, Baranyi A, Debanne D, Shulz DE. Synaptic origin and stimulus dependency of neuronal oscillatory activity in the primary visual cortex of the cat. Journal of Physiology. 1997;500:751–774. doi: 10.1113/jphysiol.1997.sp022056. [DOI] [PMC free article] [PubMed] [Google Scholar]
- Carandini M, Ferster D. Membrane potential and firing rate in cat primary visual cortex. Journal of Neuroscience. 2000;20:470–484. doi: 10.1523/JNEUROSCI.20-01-00470.2000. [DOI] [PMC free article] [PubMed] [Google Scholar]
- Carandini M, Heeger DJ, Movshon JA. Linearity and normalization in simple cells of the macaque primary visual cortex. Journal of Neuroscience. 1997;17:8621–8644. doi: 10.1523/JNEUROSCI.17-21-08621.1997. [DOI] [PMC free article] [PubMed] [Google Scholar]
- Carandini M, Mechler F, Leonard CS, Movshon JA. Spike train encoding by regular-spiking cells of the visual cortex. Journal of Neurophysiology. 1996;76:3425–3441. doi: 10.1152/jn.1996.76.5.3425. [DOI] [PubMed] [Google Scholar]
- Crook JM, Eysel UT. GABA-induced inactivation of functionally characterized sites in cat visual cortex (area 18): Effects on orientation tuning. Journal of Neuroscience. 1992;12:1816–1825. doi: 10.1523/JNEUROSCI.12-05-01816.1992. [DOI] [PMC free article] [PubMed] [Google Scholar]
- Crook JM, Kisvarday ZF, Eysel UT. GABA-induced inactivation of functionally characterized sites in cat visual cortex (area 18): Effects on direction selectivity. Journal of Neurophysiology. 1996;75:2071–2088. doi: 10.1152/jn.1996.75.5.2071. [DOI] [PubMed] [Google Scholar]
- Deisz RA, Fortin G, Zieglgänsberger W. Voltage dependence of excitatory postsynaptic potentials of rat neocortical neurons. Journal of Neurophysiology. 1991;65:371–382. doi: 10.1152/jn.1991.65.2.371. [DOI] [PubMed] [Google Scholar]
- Douglas RJ, Koch C, Mahowald M, Martin KAC, Suarez HH. Recurrent excitation in neocortical circuits. Science. 1995;269:981–985. doi: 10.1126/science.7638624. [DOI] [PubMed] [Google Scholar]
- Douglas RJ, Martin KAC. A functional microcircuit for cat visual cortex. Journal of Physiology. 1991;440:735–769. doi: 10.1113/jphysiol.1991.sp018733. [DOI] [PMC free article] [PubMed] [Google Scholar]
- Eckhorn R, Bauer R, Jordan W, Brosch M, Kruse W, Munk M, Reitboeck HJ. Coherent oscillations: a mechanism of feature linking in the visual cortex. Biological Cybernetics. 1988;60:121–130. doi: 10.1007/BF00202899. [DOI] [PubMed] [Google Scholar]
- Ferster D. Origin of orientation-selective EPSPs in simple cells of cat visual cortex. Journal of Neuroscience. 1987;7:1780–1791. doi: 10.1523/JNEUROSCI.07-06-01780.1987. [DOI] [PMC free article] [PubMed] [Google Scholar]
- Ferster D, Jagadeesh B. EPSP-IPSP interactions in cat visual cortex studied with in vivo whole-cell patch recording. Journal of Neuroscience. 1992;12:1262–1274. doi: 10.1523/JNEUROSCI.12-04-01262.1992. [DOI] [PMC free article] [PubMed] [Google Scholar]
- Granit R, Kernell D, Shortess GK. Quantitative aspects of repetitive firing of mammalian motoneurones, caused by injected currents. Journal of Physiology. 1963;168:911–931. doi: 10.1113/jphysiol.1963.sp007230. [DOI] [PMC free article] [PubMed] [Google Scholar]
- Gray CM, Engel AK, König P, Singer W. Stimulus-dependent neuronal oscillations in cat visual cortex: Receptive field properties and feature dependence. European Journal of Neuroscience. 1990;2:607–619. doi: 10.1111/j.1460-9568.1990.tb00450.x. [DOI] [PubMed] [Google Scholar]
- Gray CM, McCormick DA. Chattering cells: Superficial pyramidal neurons contributing to the generation of synchronous oscillations in the visual cortex. Science. 1996;274:109–113. doi: 10.1126/science.274.5284.109. [DOI] [PubMed] [Google Scholar]
- Gray CM, Singer W. Stimulus-specific neuronal oscillations in orientation columns of cat visual cortex. Proceedings of the National Academy of Sciences of the USA. 1989;86:1698–1702. doi: 10.1073/pnas.86.5.1698. [DOI] [PMC free article] [PubMed] [Google Scholar]
- Gutfreund Y, Yarom Y, Segev I. Subthreshold oscillations and resonant frequency in guinea-pig cortical neurons: physiology and modelling. Journal of Physiology. 1995;483:621–640. doi: 10.1113/jphysiol.1995.sp020611. [DOI] [PMC free article] [PubMed] [Google Scholar]
- Heeger DJ. Normalization of cell responses in cat striate cortex. Visual Neuroscience. 1992;9:181–197. doi: 10.1017/s0952523800009640. [DOI] [PubMed] [Google Scholar]
- Henry GH, Michalski A, Wimborne BM, McCart RJ. The nature and origin of orientation specificity of the visual pathways. Progress in Neurobiology. 1994;43:381–437. doi: 10.1016/0301-0082(94)90061-2. [DOI] [PubMed] [Google Scholar]
- Hubel D, Wiesel TN. Receptive fields, binocular interaction and functional architecture in the cat's visual cortex. Journal of Physiology. 1962;160:106–154. doi: 10.1113/jphysiol.1962.sp006837. [DOI] [PMC free article] [PubMed] [Google Scholar]
- Huguenard JR, Hamill OP, Prince DA. Sodium channels in dendrites of rat cortical pyramidal neurons. Proceedings of the National Academy of Sciences of the USA. 1989;86:2473–2477. doi: 10.1073/pnas.86.7.2473. [DOI] [PMC free article] [PubMed] [Google Scholar]
- Hutcheon B, Miura RM, Puil E. Subthreshold membrane resonance in neocortical neurons. Journal of Neurophysiology. 1996;76:683–697. doi: 10.1152/jn.1996.76.2.683. [DOI] [PubMed] [Google Scholar]
- Jagadeesh B, Gray CM, Ferster D. Visually evoked oscillations of membrane potential in cells of cat visual cortex. Science. 1992;257:552–554. doi: 10.1126/science.1636094. [DOI] [PubMed] [Google Scholar]
- Jahnsen H, Karnup S. A spectral analysis of the integration of artificial synaptic potentials in mammalian central neurons. Brain Research. 1994;666:9–20. doi: 10.1016/0006-8993(94)90277-1. [DOI] [PubMed] [Google Scholar]
- Kisvarday ZF, Toth E, Rausch M, Eysel UT. Orientation-specific relationship between populations of excitatory and inhibitory lateral connections in the visual cortex of the cat. Cerebral Cortex. 1997;7:605–618. doi: 10.1093/cercor/7.7.605. [DOI] [PubMed] [Google Scholar]
- König P, Engel AK, Roelfsema PR, Singer W. How precise is neuronal synchronization? Neural Computation. 1996;7:469–485. doi: 10.1162/neco.1995.7.3.469. [DOI] [PubMed] [Google Scholar]
- Lampl I, Reichova I, Ferster D. Synchronous membrane potential fluctuations in neurons of the cat visual cortex. Neuron. 1999;22:361–374. doi: 10.1016/s0896-6273(00)81096-x. [DOI] [PubMed] [Google Scholar]
- Lampl I, Yarom Y. Subthreshold oscillations of the membrane potential: a functional synchronizing and timing device. Journal of Neurophysiology. 1993;70:2181–2186. doi: 10.1152/jn.1993.70.5.2181. [DOI] [PubMed] [Google Scholar]
- Llinás R, Grace A, Yarom Y. In vitro neurons in mammalian cortical layer 4 exhibit intrinsic oscillatory activity in the 10- to 50-Hz frequency range. Proceedings of the National Academy of Sciences of the USA. 1991;88:897–901. doi: 10.1073/pnas.88.3.897. [DOI] [PMC free article] [PubMed] [Google Scholar]
- Mainen ZF, Sejnowski TJ. Reliability of spike timing in neocortical neurons. Science. 1995;268:1503–1506. doi: 10.1126/science.7770778. [DOI] [PubMed] [Google Scholar]
- Nelson S, Toth L, Sheth B, Sur M. Orientation selectivity of cortical neurons during intracellular blockade of inhibition. Science. 1994;265:774–777. doi: 10.1126/science.8047882. [DOI] [PubMed] [Google Scholar]
- Nowak L, Bregestovski P, Ascher P, Herbet A, Prochiantz A. Magnesium gates glutamate-activated channels in mouse central neurones. Nature. 1984;307:462–465. doi: 10.1038/307462a0. [DOI] [PubMed] [Google Scholar]
- Nowak LG, Sanchez-Vives MV, McCormick DA. Influence of low and high frequency inputs on spike timing in visual cortical neurons. Cerebral Cortex. 1997;7:487–501. doi: 10.1093/cercor/7.6.487. [DOI] [PubMed] [Google Scholar]
- Orban GA. Neuronal Operations in theVisual Cortex. Berlin, Heidelberg, New York and Tokyo: Springer-Verlag; 1984. [Google Scholar]
- Pei X, Vidyasagar TR, Volgushev M, Creutzfeldt OD. Receptive field analysis and orientation selectivity of postsynaptic potentials of simple cells in cat visual cortex. Journal of Neuroscience. 1994;14:7130–7140. doi: 10.1523/JNEUROSCI.14-11-07130.1994. [DOI] [PMC free article] [PubMed] [Google Scholar]
- Sillito AM, Jones HE, Gerstein GL, West DC. Feature-linked synchronization of thalamic relay cell firing induced by feedback from the visual cortex. Nature. 1994;369:479–482. doi: 10.1038/369479a0. [DOI] [PubMed] [Google Scholar]
- Silva LR, Amitai Y, Connors BW. Intrinsic oscillations of neocortex generated by layer 5 pyramidal cells. Science. 1991;251:432–435. doi: 10.1126/science.1824881. [DOI] [PubMed] [Google Scholar]
- Singer W. Synchronization of cortical activity and its putative role in information processing and learning. Annual Review of Psychology. 1993;55:349–374. doi: 10.1146/annurev.ph.55.030193.002025. [DOI] [PubMed] [Google Scholar]
- Singer W. Neuronal synchrony: A versatile code for the definition of relations? Neuron. 1999;24:49–65. doi: 10.1016/s0896-6273(00)80821-1. [DOI] [PubMed] [Google Scholar]
- Singer W, Gray CM. Visual feature integration and the temporal correlation hypothesis. Annual Review of Neuroscience. 1995;18:555–586. doi: 10.1146/annurev.ne.18.030195.003011. [DOI] [PubMed] [Google Scholar]
- Sompolinsky H, Shapley R. New perspectives on the mechanisms for orientation selectivity. Current Opinion in Neurobiology. 1997;7:514–522. doi: 10.1016/s0959-4388(97)80031-1. [DOI] [PubMed] [Google Scholar]
- Stuart G, Sakmann B. Amplification of EPSPs by axosomatic sodium channels in neocortical pyramidal neurons. Neuron. 1995;15:1065–1076. doi: 10.1016/0896-6273(95)90095-0. [DOI] [PubMed] [Google Scholar]
- Thomson AM, Girdlestone D, West DC. Voltage-dependent currents prolong single-axon postsynaptic potentials in layer III pyramidal neurons in rat neocortical slices. Journal of Neurophysiology. 1988;60:1896–1907. doi: 10.1152/jn.1988.60.6.1896. [DOI] [PubMed] [Google Scholar]
- Tolhurst DJ, Heeger DJ. Comparison of contrast-normalization and threshold models of the responses of simple cells in cat striate cortex. Visual Neuroscience. 1997;14:293–309. doi: 10.1017/s0952523800011433. [DOI] [PubMed] [Google Scholar]
- Vidyasagar TR. A model of striate response properties based on geniculate anisotropies. Biological Cybernetics. 1987;57:11–23. doi: 10.1007/BF00318712. [DOI] [PubMed] [Google Scholar]
- Vidyasagar TR, Pei X, Volgushev M. Multiple mechanisms underlying the orientation selectivity of visual cortical neurones. Trends in Neurosciences. 1996;19:272–277. doi: 10.1016/S0166-2236(96)20027-X. [DOI] [PubMed] [Google Scholar]
- Volgushev M, Chistiakova M, Singer W. Modification of discharge patterns of neocortical neurons by induced oscillations of the membrane potential. Neuroscience. 1998;83:15–25. doi: 10.1016/s0306-4522(97)00380-1. [DOI] [PubMed] [Google Scholar]
- Volgushev M, Pei X, Vidyasagar TR, Creutzfeldt OD. Postsynaptic potentials in the cat visual cortex: dependence on polarization. NeuroReport. 1992;3:679–682. doi: 10.1097/00001756-199208000-00006. [DOI] [PubMed] [Google Scholar]
- Volgushev M, Pei X, Vidyasagar TR, Creutzfeldt OD. Excitation and inhibition in orientation selectivity of cat visual cortex neurons revealed by whole-cell recordings in vivo. Visual Neuroscience. 1993;10:1151–1155. doi: 10.1017/s0952523800010257. [DOI] [PubMed] [Google Scholar]
- Volgushev M, Pernberg J, Eysel UT. Comparison of the selectivity of postsynaptic potentials and of spike responses in cat visual cortex. European Journal of Neuroscience. 2000a;12:257–263. doi: 10.1046/j.1460-9568.2000.00909.x. [DOI] [PubMed] [Google Scholar]
- Volgushev M, Pernberg J, Eysel UT. A new mechanism contributing to orientation and direction selectivity of neurons in cat visual cortex. European Journal of Neuroscience. 2000b;12(suppl. 11):128. [Google Scholar]
- Volgushev M, Vidyasagar TR, Chistiakova M, Yousef T, Eysel UT. Membrane properties and spike generation in rat visual cortical cells during reversible cooling. Journal of Physiology. 2000c;522:59–76. doi: 10.1111/j.1469-7793.2000.0059m.x. [DOI] [PMC free article] [PubMed] [Google Scholar]
- Volgushev M, Vidyasagar TR, Pei X. A linear model fails to predict orientation selectivity of cells in the cat visual cortex. Journal of Physiology. 1996;496:597–606. doi: 10.1113/jphysiol.1996.sp021711. [DOI] [PMC free article] [PubMed] [Google Scholar]
- Von der Malsburg C. The what and why of binding: The modeler's perspective. Neuron. 1999;24:95–104. doi: 10.1016/s0896-6273(00)80825-9. [DOI] [PubMed] [Google Scholar]
- Yousef T, Bonhoeffer T, Kim DS, Eysel UT, Toth E, Kisvarday ZF. Orientation topography of layer 4 lateral networks revealed by optical imaging in cat visual cortex (Area 18) European Journal of Neuroscience. 1999;11:4291–4308. doi: 10.1046/j.1460-9568.1999.00863.x. [DOI] [PubMed] [Google Scholar]