

Abstract
Each stage of the striate cortical circuit extracts novel information about the visual environment. We asked if this analytic process reflected laminar variations in synaptic physiology by making whole-cell recording with dye-filled electrodes from the cat's visual cortex and thalamus; the stimuli were flashed spots. Thalamic afferents terminate in layer 4, which contains two types of cell, simple and complex, distinguished by the spatial structure of the receptive field. Previously, we had found that the postsynaptic and spike responses of simple cells reliably followed the time course of flash-evoked thalamic activity. Here we report that complex cells in layer 4 (or cells intermediate between simple and complex) similarly reprised thalamic activity (response/trial, 99 ± 1.9 %; response duration 159 ± 57 ms; latency 25 ± 4 ms; average ± standard deviation; n = 7). Thus, all cells in layer 4 share a common synaptic physiology that allows secure integration of thalamic input. By contrast, at the second cortical stage (layer 2+3), where layer 4 directs its output, postsynaptic responses did not track simple patterns of antecedent activity. Typical responses to the static stimulus were intermittent and brief (response/trial, 31 ± 40 %; response duration 72 ± 60 ms, latency 39 ± 7 ms; n = 11). Only richer stimuli like those including motion evoked reliable responses. All told, the second level of cortical processing differs markedly from the first. At that later stage, ascending information seems strongly gated by connections between cortical neurons. Inputs must be combined in newly specified patterns to influence intracortical stages of processing.
Novel features of the visual scene emerge at each level of striate cortical processing (Hubel & Wiesel, 1962; Gilbert, 1977; Movshon et al. 1978a,b; Bullier & Henry, 1979a; Ferster & Lindström, 1983; Emerson et al. 1987; Szulborski & Palmer, 1990; Douglas et al. 1991; De Angelis et al. 1995; Ohzawa & Freeman, 1997; Ringach et al. 1997). This integrative capacity involves both the structure of the cortical microcircuit (Lorente De Nò, 1944; Gilbert & Kelly, 1975; Gilbert & Wiesel, 1979, 1981; Lund et al. 1979; Martin & Whitteridge, 1984; Fitzpatrick, 1996; Callaway, 1998) and the physiology of its component connections (Hirsch & Gilbert, 1991, 1993; Stern et al. 1992; Hirsch, 1995; Stratford et al. 1996; Thomson & Deuchars, 1997; Tsodyks & Markram, 1997; Reyes et al. 1998; Gil et al. 1999). Yet the synaptic processes that transmit visual information through cortex remain unresolved. This gap exists because most earlier studies have employed techniques unable to reveal intracellular events or have used in vitro preparations where natural means of stimulation are impossible. To study directly the synaptic patterns of signal transfer through the cortical circuit, we combined the techniques of whole-cell recording and intracellular labelling in vivo (Pei et al. 1991; Ferster & Jagadeesh, 1992) with traditional types of visual stimulation.
Taken together, studies of the early visual pathway suggest that sensory information is strongly gated as it is relayed from layer 4 to layer 2+3 - from the first to the second cortical station. Layer 4 is defined as the first stage of cortical integration because it is the main recipient of thalamic input (Lorente De Nò, 1944; Hubel & Wiesel, 1962; LeVay & Gilbert, 1976; Humphrey et al. 1985; Peters & Payne, 1993). There, sparse stimuli such as flashed spots or bars drive brisk activity (Hubel & Wiesel, 1962; Movshon et al. 1978a; Palmer & Davis, 1981a; Mullikin et al. 1984; Heggelund, 1986; Jones & Palmer, 1987; Ferster, 1988). Layer 2+3 represents second order cortical processing since it receives projections from layer 4 (Lund et al. 1979; Gilbert & Wiesel, 1979, 1981; Martin & Whitteridge, 1984; Hirsch, 1995; Hirsch et al. 1995, 1998b; Fitzpatrick, 1996) and is mainly above the reach of thalamic afferents (LeVay & Gilbert, 1976; Humphrey et al. 1985). Cells at this second stage are no longer well driven by static visual patterns. Rather, they prefer richer stimuli such as those including motion (Hubel & Wiesel, 1962; Gilbert, 1977; Movshon et al. 1978b; Hirsch et al. 1997, 1998a). Such laminar differences in stimulus selectivity are likely to generalize to other cortices. In somatosensory cortex, sparse stimuli have a weaker effect in layer 2+3 than in layer 4 (Brumberg et al. 1999) while stronger ones drive cells throughout the cortical depth (Zhu & Connors, 1999).
To examine differences between thalamocortical and intracortical gating, we compared intracellular records from layer 4 and layer 2+3. Cells were classified both anatomically and in terms of receptive field structure, as simple or complex - the two main types of visual cortical receptive fields. Although this manuscript focuses on complex cells, we describe both types of receptive field and their laminar distribution as background for the experiments. Simple cells compose the majority population in layer 4 (Hubel & Wiesel, 1962; Gilbert, 1977). They have receptive fields built of parallel, adjacent on- and off-subregions in which stimuli of the opposite contrast evoke responses of the inverse sign - push-pull: in on-subregions, bright stimuli excite (push) and dark stimuli inhibit (pull) (Hubel & Wiesel, 1962; Movshon et al. 1978a; Palmer & Davis, 1981a, b; Heggelund, 1986; Jones & Palmer, 1987; Ferster, 1988; Skottun et al. 1991; De Angelis et al. 1995; Hirsch et al. 1998b; cf. Borg-Graham et al. 1998). Complex cells are a minority population in layer 4 where, like simple cells, they receive monosynaptic input from the thalamus (Hoffman & Stone, 1971; Bullier & Henry, 1979a, b; Ferster & Lindström, 1983; Tanaka, 1983; Alonso & Martinez, 1998) but are the dominant class in the superficial layers, 2+3 (Hubel & Wiesel, 1962; Gilbert, 1977). They are defined as having receptive fields that lack parallel adjacent on- and off-domains. For example, complex cells may be excited by bright or dark stimuli placed in the same region of visual space (push-push) or by stimuli of only one contrast, for example bright but not dark squares (push-null) (Hubel & Wiesel, 1962; Movshon et al. 1978b; Palmer & Davis, 1981a, b; Skottun et al. 1991; De Angelis et al. 1995).
Our finding was that no matter what the spatial structure of the receptive field, responses of cells at the first cortical stage resembled envelopes of thalamic activity. At the next cortical level, in layer 2+3, the postsynaptic potentials evoked by the static stimulus were labile, though moving objects elicited strong responses. As a whole, our findings suggest that mechanisms at the levels of the excitatory synapse and dendrite regulate signal transfer between cortical layers more strongly than between thalamus and cortex: A large effort is made to incorporate general patterns of ascending information into cortex, but after that, the effort devoted to stimuli lacking appropriate features is limited.
METHODS
Anaesthesia
Adult cats, 2.5–3.5 kg, were anaesthetized with ketamine (10 mg kg−1, i.m.) followed by thiopental sodium (20 mg kg−1, i.v.) or a mixture of diprivan (Propofol) and sufentanil citrate (Sufenta) (5 mg + 1 μg kg−1, i.v.) supplemented as needed. Lidocaine was applied topically at all incisions or points of pressure. Temperature (37–38 °C), ECG, EEG, and expired CO2 (27–36 mmHg) were monitored throughout the experiment. Anaesthesia was maintained by a continuous infusion of thiopental sodium (2–4 mg kg−1 h−1, i.v.) or diprivan + sufentanil citrate (5 mg + 1 μg kg−1 h−1i.v.), adjusted as indicated by the EEG and ECG. After the completion of surgery, animals were paralysed (vecuronium bromide (Norcuron) 0.2 mg kg−1 h−1, i.v.) and artificially ventilated. Procedures used were in accordance with the guidelines of the National Institutes of Health and the University Laboratory Animal Research Center.
Surgery
An endotracheal tube was introduced through a tracheotomy before the animal was placed in a stereotaxic apparatus. For 12 experiments, two cortical craniotomies were made; one centred on Horsley-Clark coordinates A6.5-L8.5 gave access to the lateral geniculate nucleus of the thalamus (see Hirsch et al. 1998b) and the other, centred on Horsley-Clark coordinates P3-L2, was enlarged to expose the lateral gyrus. For five experiments, only the craniotomy above the thalamus was made. Pupils were dilated with 1 % atropine sulfate and the nictitating membranes retracted with 10 % phenylephrine. Eyes were refracted, fitted with contact lenses to focus on a tangent screen, and immobilized with posts fixed to the sclera. For each eye, the position of the area centralis and of the optic disk was determined by retroprojection with a fundus camera or fiber optic illuminator.
Recording
Patch-pipette resistance was ≥12 MΩ when filled with internal solution containing (mm): potassium gluconate, 120; NaCl, 5; CaCl2, 1; MgCl2, 1; EGTA, 11; GTP, 0.2; ATP, 2; Hepes, 40; with 1 % biocytin; pH 7.3; 290 mosmol kg−1 (Malinow & Tsien, 1990). For two cells, 10 mm QX-314 Br (courtesy of Astra) was included in the pipette as these cells were also part of an earlier study of calcium-evoked action potentials (Hirsch et al. 1995). Initial seal resistances were 0.5–1.0 GΩ. Recordings were made with an Axopatch 200a amplifier and stored as described below; neither capacitance nor access resistance was compensated, so very fast spikes may have been filtered. The voltage-current relationship was measured before and after each cycle of the stimulus protocol to monitor changes in the apparent access and input resistance, threshold for firing and membrane time constant. Cells considered for analysis maintained their ability to fire repeatedly in response to depolarizing current pulses and had consistent current-voltage relationships during the length of the recording session used for analysis. Ultimately, the bridge was balanced off-line by subtracting the scaled voltage-current relationship of the electrode after the recording session from those obtained when the cell was attached. Since the access resistance often increased following rupture of the membrane (see Blanton et al. 1989; Edwards & Konnerth, 1992), recorded voltage was sometimes divided (see Stühmer et al. 1983). Thus, we report time constants rather than input resistance as these depend on normalized rather than absolute measures. In addition, drift can occur over the long time courses of the recording so we do not provide absolute resting potentials.
Acquisition of visually evoked responses
Intracellular records were collected by a computer running the Discovery software package (Datawave Systems, Longmont, CO, USA), intracellular records were normally sampled at 3–4 kHz. Each recording session was also stored on videotape. Receptive fields were first mapped by hand by sweeping a bright bar across the tangent screen to determine placement of the monitor in which stimuli were generated. An AT-vista board (Truevision, Indianapolis, IN, USA), controlled by the same computer that received the data, generated the visual stimuli (frame rate 100, 105, 128, or 140 Hz). Each cycle of the stimulus protocol consisted of light or dark squares at various contrast settings (range: 30–70 %) flashed singly for 29–39 ms in pseudorandom order, 16 times on a 16 × 16 grid (sparse noise; Jones & Palmer, 1987). Grid spacing ranged from 0.4–0.85 deg and square size from 0.4–1.7 deg. When possible, responses to computer-generated, variously oriented moving bright and dark bars (width 0.85 deg, velocity 10 deg s−1) were obtained.
Receptive field classification
Maps of simple receptive fields were made by subtracting responses to dark stimuli from responses to bright stimuli; maps for complex cells were made from responses to bright (on) and dark (off) stimuli and displayed separately. Like those for simple cells, maps of thalamic receptive fields were made by subtracting responses to bright from dark stimuli. In all maps shown, light grey indicates depolarization to bright stimuli and dark grey indicates depolarization to dark ones, with stronger responses shown as brighter or darker regions, respectively; the weakest regions represent 10 % of the peak value. Receptive fields with separate and adjacent on- and off-subregions were classified as simple (Hubel & Wiesel, 1962; Movshon et al. 1978a; Palmer & Davis, 1981a, b; Heggelund, 1986; Jones & Palmer, 1987; Ferster, 1988; Skottun et al. 1991; De Angelis et al. 1995; Hirsch et al. 1998b; cf. Borg-Graham et al. 1998). The terms ‘on’ and ‘off’ are interchangeable with the terms bright excitatory and dark excitatory (De Angelis et al. 1995) or excitatory and inhibitory (Hubel & Wiesel, 1962) used by others. Cells whose receptive fields had overlapping on- and off-regions or that responded only to dark or bright squares were classified as complex (Hubel & Wiesel, 1962; Movshon et al. 1978a,b; Palmer & Davis, 1981a,b; Skottun et al. 1991; De Angelis et al. 1995). Note that the complex cells that responded to just one polarity of the flashed stimulus might be classified by others as simple cells (e.g. Henry, 1977). These, however, differed from simple cells in many ways; for example they lacked push-pull (see Palmer & Davis, 1981a, b for further discussion). In addition, we found that their absolute selectivity for stimulus contrast was limited to the case of static stimuli - all responded to moving bright and dark bars.
Measures of responsiveness
Every cell in layer 4 was well driven by the flashed stimulus while most cells in the superficial layers (2+3) were not, even if stimulus contrast and size were increased. When a receptive field could not be discerned with flashed spots, we considered each trial of the stimulus to have ‘failed’ to evoke a response. For those superficial cells driven by stationary stimuli, responses were often intermittent. Successful responses were defined by two criteria. The first criterion was that the membrane voltage should deviate by ≥ 20 % of the amplitude of the single largest synaptic response; we chose the 20 % limit to separate spontaneous from evoked events. For example, the second trace in Fig. 6B was designated a failure because there were no voltage changes ≥20 % of the peak response (third trace) during the response widow (39–189 ms) measured from the averaged trace (Fig. 6B, bottom, bold trace). The second requirement was that the membrane voltage move from and towards rest within the time window defined by the averaged response; we set this criterion to separate synaptic events from ongoing oscillations in the membrane voltage. For example, a waveform like the third trace in Fig. 6C would have been considered a failure; the membrane voltage climbed but did not begin to return to rest within the response window. A response percentage of 100 % meant that a cell successfully responded to each of the 16 stimulus trials; 50 % meant that 8 trials were successful and 8 failed. Finally, to calculate coefficients of variation of peak amplitudes, we used a median filter to remove action potentials.
Figure 6. Synaptic responses of a second order complex cell that include both excitation and inhibition.
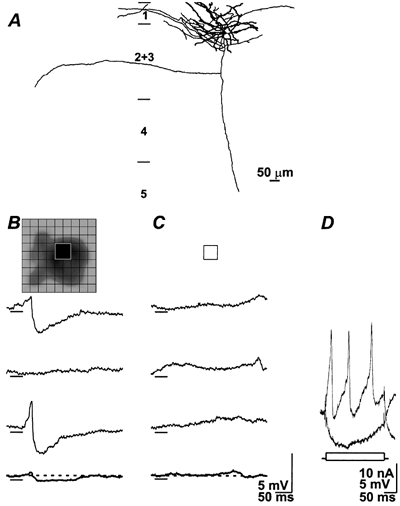
The cell body and dendrites were confined to the superficial aspect of layer 2+3; the lightly filled axon was directed towards the white matter (A). B, 3 individual responses to the dark stimulus (bar under traces) flashed in the peak of the receptive field (inset). Bright stimuli were without effect (inset indicates that bright stimuli were flashed at the same position as the dark ones) and reveal examples of the baseline (C) (see Table 1, fourth entry for 2nd order complex cells). D, responses to pulses of DC current.
Histology
Following histological processing (Horikawa & Armstrong, 1988; Hirsch, 1995) labelled neurons were drawn using a camera lucida, or a computerized 3-D reconstruction system, (Microbrightfield, Inc., Cochester VT, USA). Reconstruction of the electrode tracks revealed the location of the recording site, which was usually at the soma; dendritic recordings are specifically indicated in the text.
RESULTS
The experimental subjects for the cortical recordings were 12 adult cats; additional results from these animals are part of other studies either published or in preparation. Apart from the cell types described by Fig. 1 (e.g. Hirsch et al. 1998b), this study combines results from seven first order cells (in or bordering layer 4) and 11 second order cells in the superficial layers. Morphologically, the sample includes spiny stellate and pyramidal cells. Recordings lasted from 20 min to 2.5 h; all cells included in the study had time constants longer than 10 ms (range, 11–32 ms; mean ± s.d., 19 ± 5 ms) and fired repetitively in response to injection of depolarizing current. The description of responses from the lateral geniculate nucleus of the thalamus comes from extracellular recordings summarized in Hirsch et al. 1998b and from intracellular studies with five additional adult cats; the sample included five on-centre and five off-centre relay cells (time constant: range, 14–34 ms; mean ± s.d., 22 ± 7 ms; all cells fired repetitively to injection of depolarizing current).
Figure 1. Characteristics of first order processing illustrated by comparing responses of a cortical simple cell with those of a thalamic relay cell.
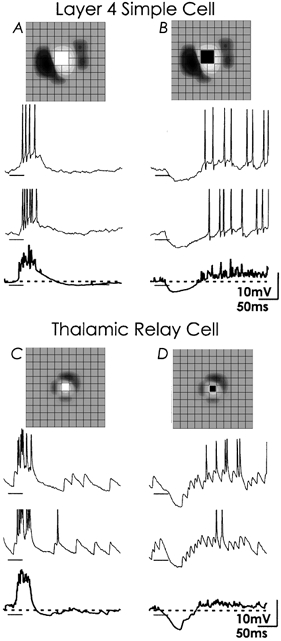
Synaptic responses to bright and dark squares flashed within the on subregion of a layer 4 simple cell (A, B) and an on centre of a thalamic relay cell (C, D). Each panel shows 2 individual responses to the stimulus, with the average of all 16 in bold beneath; dashed line indicates baseline. Action potentials are clipped in the middle records; stimulus duration is marked by the bars under the traces. Insets above the columns of traces indicate the position and sign of the stimulus in the receptive field map (light grey is on, dark grey is off; grid spacing is 0.8 deg (A, B) and 0.4 deg (C, D)). For both the cortical and the thalamic neuron, each flashed stimulus evoked responses that were similar. Bright squares evoked strong suprathreshold depolarizations and dark stimuli evoked inhibition followed by pronounced ‘rebound’ excitation. The cortical and thalamic traces differ mainly in the quality of excitatory synaptic input, large single EPSPs (presumed retinal inputs) are seen in the baseline of the relay cell while single events in the records from the cortical cell were not clear-cut.
Visual responses of cells in cortical layer 4: first order synaptic physiology
We reasoned that if there were a unique synaptic physiology at the first cortical stage, then it should emerge in the responses of all cells in layer 4, whether the spatial structure of their receptive fields was simple or complex. That pattern could then be used as a standard against which to judge responses from the superficial layers. To allow direct comparison across the entire sample, all cells were tested with an identical stimulus that comprised individually flashed bright or dark squares.
Simple cells
In earlier studies we recorded from 30 simple cells, the main type of first order cell; all were located in thalamorecipient zones or had their dendrites extending into those regions (Hirsch et al. 1995, 1998b, 2000; Martinez et al. 1999, 2002). The synaptic responses of these cells shared common patterns that are central to this study. Figure 1 compares intracellular recordings from a simple cell in layer 4 (Fig. 1A and B) with those from a typical relay cell in the lateral geniculate nucleus of the thalamus (Fig. 1C and D; n = 10); the recordings were made during two separate experiments. Every bright spot that fell in the simple cell's on-subregion or the relay cell's on-centre evoked a strong depolarization capped by a train of action potentials, ‘push’ (Fig. 1A and C); the top traces show responses to individual squares and the bottom traces in bold show the average of all 16 trails. Dark spots (Fig. 1B and D) that fell in the simple cell's on-subregion or the relay cell's on-centre produced strong inhibition, ‘pull’ followed by a depolarizing rebound. Responses varied somewhat in amplitude but little in structure so the envelope of the averaged trace resembled the individual ones. Overall, the shape of the cortical depolarizations and thalamic firing patterns were strikingly similar (for population values for simple and thalamic cells see Table 1 in Hirsch et al. 1998b). Thus, simple cells are able to transmit general envelopes of thalamic input.
Table 1.
Response duration and probality for first and second order complex cells
| Bright response | Dark response | |||||
|---|---|---|---|---|---|---|
| Cell type and laminar location | Response/trial (%) | Initial phase (ms) | Late phase (ms) | Response/trial (%) | Initial phase (ms) | Late phase (ms) |
| 1st order complex* | ||||||
| Spiny stellate cell | 100 | 29–110 | 110–208 | 100 | 30–90 | 90–168 |
| Spiny stellate cell | 100 | 19–62 | 80–150 | 94 | 23–58 | 85–122 |
| Lower 4 pyramid | 100 | 26–70 | 88–160 | 100 | 30–70 | 82–140 |
| Lower 4 pyramid | 100 | 31–128 | 220–300 | 100 | 27–123 | 158–273 |
| Pyramid, 3–4 border | 100 | 22–98 | 98–192 | 100 | 30–86 | 86–145 |
| 1st Order Intermediate* | ||||||
| Pyramid, 3–4 border | 100 | 22–85 | 98–180 | 100 | 37–72 | 108–170 |
| 4 (track only) | 100 | 28–95 | 95–251 | 94 | 28–100 | 100–225 |
| 2nd order complex** | Bright Response | Dark Response | ||||
| Upper 2+3 pyramid | 100 | 45–88 | 56 | 49–72 | ||
| Upper 2+3 pyramid | 0 | — | 94 | 32–220 | ||
| Upper 2+3 pyramid | 0 | — | 88 | 32–72 | ||
| Upper 2+3 pyramid | 0 | — | 88 | 39–180 | ||
| 2+3 (track only) | 56 | 50–110 | 75 | 50–110 | ||
| Upper 2+3 pyramid | 0 | — | 63 | 42–62 | ||
| Upper 2+3 pyramid | 0 | — | 0 | — | ||
| Upper 2+3 pyramid | 0 | — | 0 | — | ||
| Upper 2+3 pyramid | 0 | — | 0 | — | ||
| Upper 2+3 pyramid | 0 | — | 0 | — | ||
| Upper 2+3 dendrite | 100 | 32–87 | 81 | 46–145 | ||
Measurements were made from averaged responses at the peak of the receptive filed. The range for the ‘initial phase’ of response corresponds to the depolarization that follows stimulus onset. The value for the ‘late phase’ charts the second wave of depolarization, which corresponds to the ‘rebound’ discharge of thalamic relay cells. The responses of second order complex cells did not divide into early and late components so only one range is given; values include the duration of both excitatory and inhibitory responses. Response reliability is given as the percentage of times that a stimulus evoked a response for all 16 trials. Averaged latencies are for the earliest response, whether evoked by a bright or dark stimulus. The confidence level for the differences in somatic response duration, response per trial, and latency were obtained with one-tailed t tests, last line. An additional assay using the product of two binomial sums took the discrete, yes or no nature of the latter measure into account; the result was P < 1.4× 10−47. Measures for both parameters were from somatic responses only.
1st order mean ± s.d.: response duration, 160 ± 56 ms; response/trial, 99 ± 2 %; latency, 25 ± 4 ms
2st order mean ± s.d.: response duration, 72 ± 60 ms; response/trial, 31 ± 40 % latency, 39 ± 7 ms.
It is also important to note that flashed spots of the appropriate size (0.85–1.7 deg and contrast (50–70 %) can drive simple cells as vigorously as moving bars. For example, for 10, presumed excitatory, simple cells (taken from Hirsch et al. 1995, 1998b; Martinez et al. 2002) both static and moving stimuli drove rapid firing. For static stimuli, firing rates reached 207 ± 70 spikes s−1 and for optimally oriented bars, 212 ± 74 spikes s−1, with the difference between the rates for a given cell, 0.2 ± 28 spikes s−1.
Complex cells
In addition to simple cells, layer 4 contains a population of complex cells, as discussed in the Introduction. We asked if the flash-evoked responses of complex cells in layer 4 also reflected the pattern of thalamic drive. This proved to be the case for the five complex cells we sampled in layer 4, or at its borders, and for two additional cells whose receptive fields were intermediate between simple and complex.
To help understand the following section, a diagram outlining the putative thalamocortical connections for simple and complex cells in layer 4 is shown in Fig. 2. Simple fields are built by rows of on- and off-centre relay cells whose receptive fields are spatially offset while first order complex cells receive input from on- and off-centre relay cells whose receptive fields are overlapping (e.g. Palmer & Davis, 1981a, b).
Figure 2. Putative circuits for thalamic input to first order cells, both simple and complex.
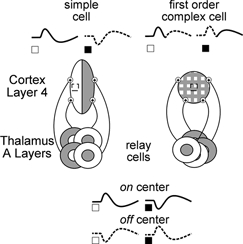
Diagram of putative circuits in layer 4. Left, simple cell that receives input from spatially segregated columns of on- (white) and off -(grey)centre thalamic relay cells shown below. Right, complex cell receives input from on- and off-centre cells whose receptive fields overlap. Traces show envelopes of postsynaptic responses propagated from on-centre (continuous line) and off-centre (dashed line) relay cells. Stimulus site is shown as an empty box in the receptive field.
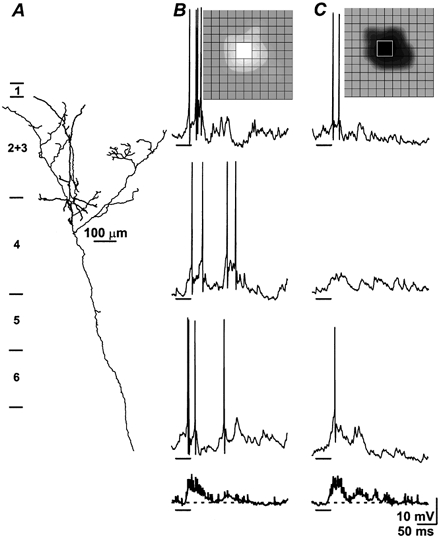
Figure 3 illustrates recordings from a first order complex cell; it was a spiny stellate cell with dendrites confined to layer 4 and an axon that sent dense projections to the superficial layers (Fig. 3A); anatomically the cell was no different from simple spiny stellate cells (Gilbert & Wiesel, 1979; Martin & Whitteridge, 1984; Hirsch et al. 1998b). The layout of the panels in Figs. 3B and C is like that in Fig. 1 except that the maps for bright and dark excitation are shown separately because they overlapped one another (see Methods). Because of the push-push relationship between bright and dark stimuli, the response waveform had the shape of a bimodal depolarization rather than the ‘simple’ pattern of push-pull (e.g. Fig. 1A and B). Despite differences in the spatial structure of the receptive field and the sign of response to stimuli of the opposite contrast, the similarity between this complex cell's responses and those of simple cells are remarkable (Hirsch et al. 1998b). First, the flashed stimuli reliably evoked postsynaptic responses. All five first order complex cells, and the two cells intermediate between simple and complex, responded to virtually every trial of the stimulus; the average percentage of response per trial was 99.4 ± 1.9 % (see Table 1). Second, the shape of the postsynaptic response comprised initial and late components that corresponded to the thalamic onset and rebound discharges (see Table 1 in Hirsch et al. 1998b), as is especially clear in traces displayed in Fig. 3B. For all seven cells, the average duration of the first component was 67 ± 28 ms and of the second, 96 ± 28 ms (see Table 1). Last, response latencies (25 ± 4 ms) were consistent with direct thalamic input (Hirsch et al. 1995, 1998b).
Figure 3. Synaptic responses of first order complex cells share common features with those of simple cells.
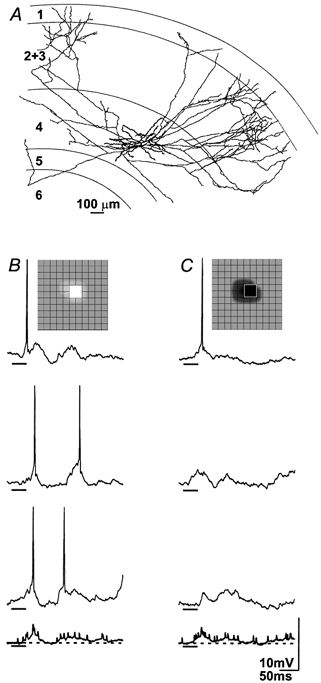
Reconstruction of a spiny stellate cell in the middle of cortical layer 4 with dense axonal projections to the superficial layers (A). B and C, 3 individual responses to the stimulus flashed in the peak of the receptive field (inset, grid spacing is 0.8 deg) and the average of all 16 trials in bold at bottom; stimulus duration is marked by bars beneath the traces. Like simple cells, this cell responded vigorously and at short latency to the flashed stimulus. In addition, the envelope of the component depolarizations (see Table 1, first entry) resembled the onset and rebound responses of thalamic relay cells (see Table 1 in Hirsch et al. 1998b). As this was a complex cell, both bright (B) and dark (C) stimuli evoked an early and late wave of depolarization instead of the ‘simple’ pattern of onset or rebound excitation.
Another example of a first order complex cell is shown in Fig. 4. The cell was a pyramid located at the border between layers 4 and 2+3 (Fig. 4A). The laminar distribution of first order complex cells was similar to that of simple cells, both spread from the lower to upper border of the layer. As for the previous example, the synaptic responses were reliable and bimodal. The chief difference between this cell's responses and those of others was the noisy baseline - there seemed to be high rates of spontaneous synaptic input. We have observed such complicated baselines in a few simple cells as well (see Fig. 4 of Hirsch et al. 1995; Fig. 1 of Hirsch et al. 1998b).
Figure 4. First order complex cells have a signature pattern of response regardless of laminar position.
Partial reconstruction of a lightly labelled pyramid at the border between layers 4 and 2+3 with prominent projections to layer 2+3 (A). B and C, 3 individual responses to the stimulus flashed in the peak of the receptive field (inset, grid spacing is 0.8 deg), with the average of all 16 trials in bold at bottom; dashed line indicates baseline and bars under the traces mark stimulus duration; the cell was hyperpolarized with −0.1nA DC current to reveal better the synaptic potentials. The response pattern resembled that of the spiny stellate cell illustrated in Fig. 3, though the baseline is noisier (see Table 1, last entry for 1st order complex cells).
Visual responses of cells in cortical layer 2+3: second order synaptic physiology
Responses to the static stimulus
As mentioned in the Introduction, complex cells typically fail to respond to the same flashed stimuli that drive simple cells well. The following figures address the synaptic basis of this type of selectivity. Figure 5 illustrates responses typical of superficial pyramids. The cell's dendritic arbor was confined to the upper half of layer 2+3 and the receptive field was complex. The records depicted here are clearly different from those obtained from cells in layer 4 (see Figs 1A and B, 3 and 4). Synaptic responses were often brief and did not have the bimodal shape that was characteristic of first order complex or simple cells. The average duration of response (bright 43 ms, dark 23 ms) was less than half the shortest recorded from a first order complex cell (bright 131 ms, dark 99 ms); see Table 1. For the entire sample, the average response duration (72 ± 60 ms) was less than half that of first order cells (159 ± 57 ms). Even though this cell responded more frequently than all other superficial cells to the flashed stimulus, the responses to dark stimuli were intermittent and evident in only 9 of the 16 trials (e.g. Fig. 5C, middle trace). For the entire sample, the average response per trial was 31 ± 40 %, less than a third that of first order cells (99 ± 2 %). Response latency (39 ± 7 ms) was longer than for first order cells (25 ± 4 ms) as well. The inset in Fig. 5D shows that the cell membrane was healthy and able to fire repetitively in response to depolarization.
Figure 5. Brief synaptic responses to stationary stimuli are typical of second order complex cells.

This cell was a pyramid with dendrites confined to the superficial aspect of layer 2+3; the axon arborized densely in the home layer (A). B and C, 3 individual responses to the stimulus flashed in the peak of the receptive field (inset, grid spacing is 0.8 deg), with the average of all 16 trials in bold; bars under the traces mark stimulus duration. The flashed stimuli evoked a brief, monophasic EPSP whose latency was longer and time course shorter than first order cells. Failures in response to dark stimuli were common, e.g. middle trace in C (see Table 1, initial entry for 2nd order cells). D, responses to pulses of DC current.
For some superficial cells, the flashed stimuli evoked both inhibition and excitation, as seen in Fig. 6. Like the last example, this cell was a pyramid located in the top of layer 2+3 (Fig. 6A). This cell responded only to dark but not bright spots and these responses were highly variable (Fig. 6B). The top trace shows a large IPSP truncating an EPSP. The middle trace depicts a failure, or lack of somatic response (see Methods for definition). The bottom trace is a complex waveform that appears to involve excitation and inhibition. These traces indicate that somatic inhibition alone did not gate excitatory inputs - failures in its absence were common. The traces in the Fig. 6C reveal the baseline waveforms, as bright spots were without effect. Failures were as common when the membrane was depolarized by current injection, indicating that the absence of a response did not represent a finely calibrated balance between excitation and inhibition (not shown). In fact, only three of the seven superficial cells driven by the stationary stimulus responded to stimuli of both polarities, bright and dark (increases in stimulus duration, contrast or size rarely tilted the balance between response success and failure). Finally, Fig. 6D shows that the cell was healthy and fired repetitively in response to current injection; note that this recording was made when Na+ channels were blocked pharmacologically as part of an earlier study (Hirsch et al. 1995) so that only Ca2+ spikes remained.
All told, the records shown in Fig. 5 and Fig. 6 illustrate a common trend. If superficial cells respond to stationary stimuli at all, the responses are usually inconsistent and brief (the length of the averaged response in Fig. 6B is due to the repolarization of the early IPSPs). The variability of response is shown in Fig. 7, where the coefficient of variation of the maximal response is plotted for first (black columns) and second (open columns) order cells in A and for the probability that a cell would respond to stimulus at the peak of the field in B (calculated from all 32 trials to dark and bright stimuli). Attributes of response to dark and bright stimuli are summarized separately for the entire sample in the lower half of Table 1. Overall, the records from layer 4 were significantly different from those obtained in layer 2+3; P < 0.003 for response duration; P < 0.000006 for response/trial and P < 0.0007 for the coefficient of variability of the peak of the response (one-tailed t tests).
Figure 7. Constancy of response for first and second order complex cells.
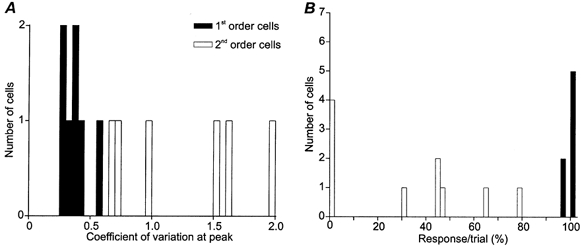
A, histogram showing the distribution of the coefficient of variability at the peak of response for first (▪) and second order cells (□). B, histogram showing the response probability for both populations.
How do recordings in the soma compare to those in the dendrite? In rare instances we have been able to record from remote processes, as was the case illustrated in Fig. 8 (the other three cases included simple cells at the border of layer 4 and complex cell in layer 6). Here, records are shown for the best bright stimulus (Fig. 8B) and best dark one (Fig. 8C), which were spatially offset (the responses to dark and bright moving bars overlapped; data not shown). The responses, evoked by bright squares, were more vigorous than any we have obtained from somatic recording sites (Fig. 8B). The rapid rise of the component potentials suggests that they were EPSPs produced by synapses near the recording site, though a contribution from dendritic action potentials is possible. In addition, spontaneous EPSPs were frequent in the baseline. The responses to dark stimuli (Fig. 8C) were smaller, slower to peak and had longer latencies, as if they were produced farther away from the recording site. Thus, though preliminary, the recordings illustrated in Fig. 8 hint that processing at the dendritic level may be more complex than can be appreciated from the soma.
Figure 8. Dendritic recordings from a superficial pyramid.
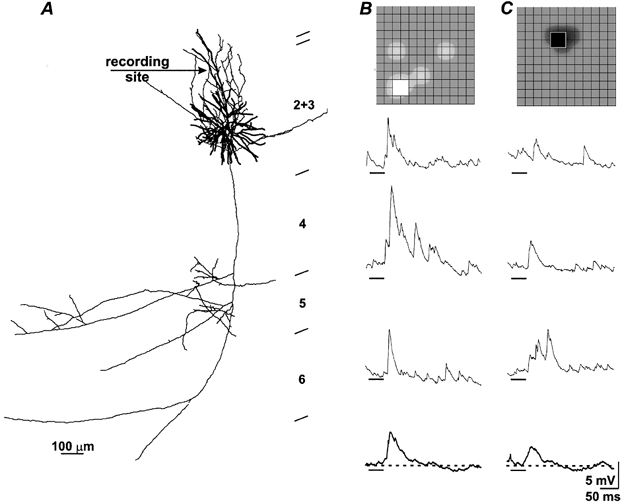
The cell was a pyramid in mid-layer 2+3 with axonal projections to the home layer, layer 5 and area 18 (not shown). Arrow points towards recording site (A). Note that this figure differs from earlier ones in showing responses to stimuli in different spatial positions as the peak for the on-responses and the peak for the off-responses were spatially displaced (insets). Bright spots (B) evoked rapidly rising EPSPs while dark spots (C) elicited smaller and more slowly rising events that occurred at longer latency (see Table 1, entry for dendritic recording).
Responses to moving stimuli
It is important to emphasize that cells in layer 2+3 are selective for motion and that the absence or weakness of response to flashed stimuli was not a sign that the cells from which we recorded were functionally impaired. To make this point, Fig. 9 illustrates three superficial cells that responded well to moving stimuli but had virtually no response to flash. Each example illustrates a different quality of the motion-evoked response in the superficial layers. The recordings for Fig. 9A were made when the cell was hyperpolarized with DC current (0.9 nA) to emphasize the strong evoked EPSPs. The middle panel (Fig. 9B) illustrates how the moving stimuli could evoke strong volleys of firing. The third panel (Fig. 9C) shows responses to a stimulus of a sub-optimal orientation (25 deg from the preferred orientation); these records reveal a complex interplay of EPSPs and IPSPs and spikes. Last presence or absence of response to flash did not appear to correlate with other features such as overall morphology or firing pattern.
Figure 9. Second order complex cells respond vigorously to moving bars.
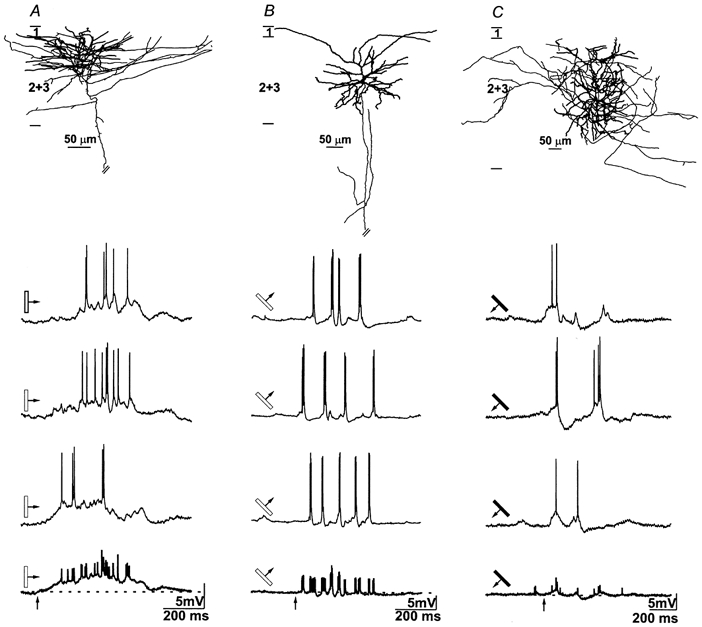
Each of the three panels shows the reconstruction of a pyramid at the superficial aspect of layer 2+3 (A and B projected out of cortex, C had only intralaminar projections), with response waveforms recorded for 3 individual trials and the average of all (4–8) in bold beneath. The arrow under the averaged trace points to entry in the responsive region and the stimulus sign, angle and direction is indicated at left. Moving bars swept across the receptive field evoked various combinations of EPSPs, IPSPs and action potentials even though these cells were essentially insensitive to static stimuli.
DISCUSSION
The goal was to understand if differences in the synaptic physiology at successive stages of cortical processing could contribute to the analysis of sensory inputs. Thus, we compared visually evoked synaptic responses from the first and second stations of the striate cortical microcircuit. At the first cortical stage, layer 4, cells were able to capture and relay even simple patterns of ascending input. The sparse, static stimuli we employed evoked action potentials whose underlying PSPs tracked the envelope of thalamic activity. At the next cortical level, in layer 2+3, response structure could not be assumed from antecedent firing patterns. Many cells failed to register the flashed stimuli; those that did typically gave brief and intermittent responses, even in the absence of IPSPs. Moving stimuli, however, always drove robust activity. The most parsimonious interpretation of our results is that transmission from the first to the second cortical stage is gated by excitatory synapses and dendritic properties rather than by strong inhibition. Overall, the work suggests that the physiological structure of the gate between layers 2+3 and 4 provides an economical means of selecting for stimulus features such as motion.
The first stage of cortical processing: thalamocortical circuitry
At the first level of cortical processing, for simple and complex cells alike, a large investment is made to absorb ascending information. The circuit is able to transmit even the simple patterns of thalamic input that static stimuli evoke (and see Hirsch et al. 1998b). Further, as best seen for simple cells, even inappropriate stimuli, such as a bright spot in an off-subregion, evoke strong postsynaptic responses. This responsive synaptic physiology may reflect a high degree of security or efficacy at thalamocortical synapses (Stratford et al. 1996; Gil et al. 1999) that is amplified by intracortical input (McGuire et al. 1984; Ferster & Lindström, 1985; Peters & Payne, 1993; Ahmed et al. 1994; Grieve & Sillito, 1995; Hirsch, 1995; Hirsch et al. 1998c; Stratford et al. 1996; Chung & Ferster, 1998; Feldmeyer et al. 1999; Gil et al. 1999).
Relationship between synaptic physiology and stimulus representation
Palmer and Davis (1981a,b) described a subclass of complex cells that may correspond to the first order complex cells illustrated here. Like simple cells, complex cells of this subtype responded briskly to flashed stimuli for the duration of the stimulus. Also like simple cells, these exhibited essentially linear spatial summation (Movshon et al. 1978a; Palmer & Davis, 1981b; Jones & Palmer, 1987; Tolhurst & Dean, 1987; Skottun et al. 1991), though the push-push (rather than push-pull) structure of their field would have precluded a linear response to contrast reversing stimuli like sinusoidal gratings. Thus, both simple and complex cells at the first stage of processing might be specialized to preserve temporal and spatial aspects of the stimulus.
The second stage of cortical processing: intracortical circuitry
The same static stimuli that drive first order cells so well were substantially less effective in activating cells at the second cortical stage. At the outset, we had considered three broad classes of mechanism, any or all of which could contribute interlaminar processing as schematized in Fig. 10 where idealized postsynaptic responses of superficial cells are indicated by the bold waveforms. The first category was somatic thresholding (Fig. 10A). The depolarization following each stimulus would have the same bimodal shape as for antecedent cells, but the amplitude would be too small to drive firing. This was easy to imagine because ultrastructural studies had shown that intracortical synaptic terminals are small (LeVay, 1973; McGuire et al. 1984, 1991; Johnson & Burkhalter, 1996) compared to geniculocortical synapses (Davis & Sterling, 1979; McGuire et al. 1984; Ahmed et al. 1994). Further, cross-correlation studies suggested that intracortical connections are sometimes weaker than geniculocortical ones (Tanaka, 1983, 1985; Toyama, 1988; Ghose et al. 1994; Reid & Alonso, 1996; Alonso & Martinez, 1998). A second possible gating mechanism was one in which inhibition inverts the sign of the response (Fig. 10B). This is just like the ‘pull’ of the simple cell (see Fig. 1B) and recalls the finding that inhibition can reverse the sign of response in the somatosensory receptive field (Moore & Nelson, 1998). Further, cell bodies and the axon hillocks of superficial pyramids are densely innervated by inhibitory contacts (Fairén et al. 1983; Fariñas & DeFelipe, 1991a, b). The last category groups a variety of mechanisms as ‘attrition’. Here, the activity from presynaptic simple cells could be prevented from influencing the somatic membrane voltage of the postsynaptic cells (Fig. 10C). Included in this category were (a) presynaptic processes that govern the probability that a given spike leads to release of transmitter (Thomson & West, 1993; Allen & Stevens, 1994; Stratford et al. 1996; Dobrunz & Stevens, 1997; Varela et al. 1997; Gil et al. 1999); (b) postsynaptic factors like gating by dendritic ion channels (Spencer & Kandel, 1961; Stafstrom et al. 1985; Kim & Connors, 1993; Hirsch et al. 1995; Yuste & Tank, 1996; Schiller et al. 1997; Golding & Spruston, 1998) and electrotonic filtering (Fatt & Katz, 1951; Rall, 1977) and (c) increases in membrane conductance produced by remote inhibition or background synaptic activity (Bernander et al. 1991; Pare et al. 1998a,b; Destexhe & Pare, 1999).
Figure 10. Diagrams of possible synaptic responses at the second stage of cortical processing.
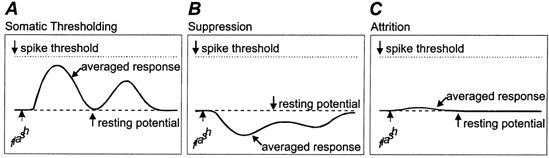
Panel A depicts the shape of response predicted by summing the activity patterns produced in layer 4. Panel B illustrates a trace that would result if interposed inhibition dominated the response. Panel C shows a waveform representative of various processes that influence reliability of the transfer of ascending information.
Our results suggest the last category of mechanisms as the most plausible. The envelope of presynaptic firing pattern is not reproduced, nor do responses reflect a dominant balance of inhibition. Rather, at later stages, responses are typically brief and intermittent, with wholesale failures in the relay of information to the soma common.
We were surprised by this observation at first. Studies in vitro had shown that electrical activation of cells in layer 4 elicited robust responses throughout layer 2+3 (e.g. Hirsch & Gilbert, 1991, 1993; Shao & Burkhalter, 1996). In addition, shocks to the optic radiations activate cells throughout the cortical depth in vivo (Hoffman & Stone, 1971; Ferster & Lindström, 1983; Douglas et al. 1991). Viewing the work in vitro and in vivo from the perspective of coincidence detection (Joris et al. 1998) suggests an explanation for the discrepancy. Electrical shocks synchronize presynaptic inputs. In vivo, if superficial cell responded to flash at all, the response usually occurred when thalamic drive of layer 4 was strongest (e.g. Fig. 1C; Hirsch et al. 1998b; Wolfe & Palmer, 1998) when both the number and firing rates of active cells in the presynaptic pool would be greatest. The resulting consonance of input could lead to temporal summation and potentiation at single synapses (Thomson & West, 1993; Tank et al. 1995; Thomson, 1997; Egger et al. 1999) as well as to spatial summation and facilitatory interactions of convergent inputs (see below); these mechanisms could increase the success of signal transfer. While coincidence detection is a general feature of neural integration, it may weigh in more heavily in some instances than in others, for example at later vs. earlier stages.
More generally, intracellular recordings in vivo provide a new perspective on cellular mechanisms that studies in vitro have revealed. The lability of response to flashed stimuli offers a view of the actual output of an ensemble composed of unreliable connections: elegant experiments in vitro have shown that failures in transmission across single intracortical synapses are common (Thomson & West, 1993; Allen & Stevens, 1994; Stratford et al. 1996; Dobrunz & Stevens, 1997; Thomson & Deuchars, 1997; Gil et al. 1999). Further, given the sparseness of the somatic response vs. dendritic response, our results emphasize the importance of passive (Fatt & Katz, 1951; Rall, 1977) and active (Spencer & Kandel, 1961; Stafstrom et al. 1985; Bernander et al. 1991; Regehr et al. 1993; Hirsch et al. 1995; Schiller et al. 1997; Golding & Spruston, 1998; Pare et al. 1998a; Magee, 1999; Svoboda et al. 1999) dendritic mechanisms of regulating input. In addition, the results are consistent with the view that, in vivo, when cells are subject to a constant barrage of synaptic input, events at the dendrite may not be transmitted as readily to the soma (Bernander et al. 1991; Pare et al. 1998a,b; Destexhe & Pare, 1999) as they may be in vitro (Magee, 1999).
Relationship between synaptic physiology and stimulus detection
Our work shows clearly that access of input from layer 4 to layer 2+3 is securely gated. How do the appropriate visual signals open the door? Insight comes from early studies by Movshon et al. (1978b) who observed that individual flashed bars evoked little activity from most complex cells. By contrast, pairs of bars drove substantial firing provided that their separation in time and space corresponded to cellular preference for velocity. Thus, the authors proposed that facilitatory interactions between convergent excitatory inputs establish the basis for motion selectivity in complex cells. In intracellular terms, that means that the postsynaptic effect of any single incoming stream remains minimal pending arrival of subsequent input. This scheme is consistent with the economy of processing that we have found, and that theories of sparse coding suggest (Sakitt & Barlow, 1982; Laughlin et al. 1998; Vinje & Gallant, 2000). In the future we hope to investigate the nature of synaptic interactions that moving stimuli call into play.
Acknowledgments
We are grateful to T. N. Wiesel for support. We thank R. Clay Reid for software for the stimulus, data acquisition and display, J. Brumberg for comments on the manuscript, F. Sommer for advice on statistics, C. Gallagher and J. Kornblum for reconstructing neurons and P. Peirce for photography. The work was funded by the Klingenstein Fund Inc and NIH grant EY09395 to J.A.H. and an HFSPO fellowship to L.M.M.
REFERENCES
- Ahmed B, Anderson JC, Douglas RJ, Martin KA, Nelson JC. Polyneuronal innervation of spiny stellate neurons in cat visual cortex. Journal of Comparative Neurology. 1994;341:39–49. doi: 10.1002/cne.903410105. [DOI] [PubMed] [Google Scholar]
- Allen C, Stevens CF. An evaluation of causes of unreliability of synaptic transmission. Proceedings of the National Academy of Sciences of the USA. 1994;9:10380–10383. doi: 10.1073/pnas.91.22.10380. [DOI] [PMC free article] [PubMed] [Google Scholar]
- Alonso JM, Martinez LM. Functional connectivity between simple cells and complex cells in cat striate cortex. Nature Neuroscience. 1998;5:395–403. doi: 10.1038/1609. [DOI] [PubMed] [Google Scholar]
- Bernander O, Douglas RJ, Martin KA, Koch C. Synaptic background activity influences spatiotemporal integration in single pyramidal cells. Proceedings of the National Academy of Sciences of the USA. 1991;88:11569–11573. doi: 10.1073/pnas.88.24.11569. [DOI] [PMC free article] [PubMed] [Google Scholar]
- Blanton M, Lo Turco JJ, Kriegstein AR. Whole-cell recording from neurons in slices of reptilian and mammalian cerebral cortex. Journal of Neuroscience Methods. 1989;30:203–210. doi: 10.1016/0165-0270(89)90131-3. [DOI] [PubMed] [Google Scholar]
- Borg-Graham LJ, Monier C, Fregnac Y. Visual input evokes transient and strong shunting inhibition in visual cortical neurons. Nature. 1998;393:369–373. doi: 10.1038/30735. [DOI] [PubMed] [Google Scholar]
- Brumberg JC, Pinto DJ, Simons DJ. Cortical columnar processing in the rat whisker-to-barrel system. Journal of Neurophysiology. 1999;82:1808–1817. doi: 10.1152/jn.1999.82.4.1808. [DOI] [PubMed] [Google Scholar]
- Bullier J, Henry GH. Ordinal position of neurons in cat striate cortex. Journal of Neurophysiology. 1979a;42:1251–1263. doi: 10.1152/jn.1979.42.5.1251. [DOI] [PubMed] [Google Scholar]
- Bullier J, Henry GH. Laminar distribution of first-order neurons and afferent terminals in cat striate cortex. Journal of Neurophysiology. 1979b;42:1271–1281. doi: 10.1152/jn.1979.42.5.1271. [DOI] [PubMed] [Google Scholar]
- Callaway EM. Local circuits in primary visual cortex of the macaque monkey. Annual Review of Neuroscience. 1998;21:47–74. doi: 10.1146/annurev.neuro.21.1.47. [DOI] [PubMed] [Google Scholar]
- Chung S, Ferster D. Strength and orientation tuning of the thalamic input to simple cells revealed by electrically evoked cortical suppression. Neuron. 1998;20:1177–1189. doi: 10.1016/s0896-6273(00)80498-5. [DOI] [PubMed] [Google Scholar]
- Davis TL, Sterling P. Microcircuitry of cat visual cortex: Classification of neurons in layer iv of area 17, and identification of the patterns of lateral geniculate input. Journal of Comparative Neurology. 1979;188:599–627. doi: 10.1002/cne.901880407. [DOI] [PubMed] [Google Scholar]
- De Angelis GC, Ohzawa I, Freeman RD. Receptive field dynamics in central visual pathways. Trends in Neurosciences. 1995;18:451–458. doi: 10.1016/0166-2236(95)94496-r. [DOI] [PubMed] [Google Scholar]
- Destexhe A, Pare D. Impact of network activity on the integrative properties of neocortical pyramidal neurons in vivo. Journal of Neurophysiology. 1999;81:1531–1547. doi: 10.1152/jn.1999.81.4.1531. [DOI] [PubMed] [Google Scholar]
- Dobrunz LE, Stevens CF. Heterogeneity of release probability, facillitation, and depletion at central synapses. Neuron. 1997;18:995–1008. doi: 10.1016/s0896-6273(00)80338-4. [DOI] [PubMed] [Google Scholar]
- Douglas RJ, Martin KA, Whitteridge D. An intracellular analysis of the visual responses of neurones in cat visual cortex. Journal of Physiology. 1991;440:659–696. doi: 10.1113/jphysiol.1991.sp018730. [DOI] [PMC free article] [PubMed] [Google Scholar]
- Edwards FA, Konnerth AR. Patch-clamping cells in sliced-tissue preparations. Methods in Enzymology. 1992;207:208–222. doi: 10.1016/0076-6879(92)07015-g. [DOI] [PubMed] [Google Scholar]
- Egger V, Feldmeyer D, Sakmann B. Coincidence detection and changes of synaptic efficacy in spiny stellate neurons in rat barrel cortex. Nature Neuroscience. 1999;2:1098–1105. doi: 10.1038/16026. [DOI] [PubMed] [Google Scholar]
- Emerson RC, Citron MC, Vaughn WJ, Klein SA. Nonlinear directionally selective subunits in complex cells of cat striate cortex. Journal of Neurophysiology. 1987;58:33–65. doi: 10.1152/jn.1987.58.1.33. [DOI] [PubMed] [Google Scholar]
- Fairén A, Defelipe J, Regidor J. Nonpyramidal neurons: General account. In: Peters A, Jones EG, editors. Cerebral Cortex: Cellular Components of the Cerebral Cortex. New York: Plenum Press; 1983. pp. 201–253. [Google Scholar]
- Fariñas I, Defelipe J. Patterns of synaptic input on corticocortical and corticothalamic cells in the cat visual cortex. I. The cell body. Journal of Comparative Neurology. 1991a;304:53–69. doi: 10.1002/cne.903040105. [DOI] [PubMed] [Google Scholar]
- Fariñas I, Defelipe J. Patterns of synaptic input on corticocortical and corticothalamic cells in the cat visual cortex. II. The axon initial segment. Journal of Comparative Neurology. 1991b;304:70–77. doi: 10.1002/cne.903040106. [DOI] [PubMed] [Google Scholar]
- Fatt, Katz B. An analysis of the endplate potential recorded with an intracellular electrode. Journal of Physiology. 1951;115:320–370. doi: 10.1113/jphysiol.1951.sp004675. [DOI] [PMC free article] [PubMed] [Google Scholar]
- Feldmeyer D, Egger V, Lubke J, Sakmann B. Reliable synaptic connections between pairs of excitatory layer 4 neurones within a single ‘barrel’ of developing rat somatosensory cortex. Journal of Physiology. 1999;521:169–190. doi: 10.1111/j.1469-7793.1999.00169.x. [DOI] [PMC free article] [PubMed] [Google Scholar]
- Ferster D. Spatially opponent excitation and inhibition in simple cells of the cat visual cortex. Journal of Neuroscience. 1988;8:1172–1180. doi: 10.1523/JNEUROSCI.08-04-01172.1988. [DOI] [PMC free article] [PubMed] [Google Scholar]
- Ferster D, Jagadeesh B. EPSP-IPSP interactions in cat visual cortex studied with in vivo whole-cell patch recording. Journal of Neuroscience. 1992;12:1262–1274. doi: 10.1523/JNEUROSCI.12-04-01262.1992. [DOI] [PMC free article] [PubMed] [Google Scholar]
- Ferster D, Lindström S. An intracellular analysis of geniculo-cortical connectivity in area 17 of the cat. Journal of Physiology. 1983;342:181–215. doi: 10.1113/jphysiol.1983.sp014846. [DOI] [PMC free article] [PubMed] [Google Scholar]
- Ferster D, Lindström S. Synaptic excitation of neurones in area 17 of the cat by intracortical axon collaterals of cortico-geniculate cells. Journal of Physiology. 1985;367:233–252. doi: 10.1113/jphysiol.1985.sp015822. [DOI] [PMC free article] [PubMed] [Google Scholar]
- Fitzpatrick D. The functional organization of local circuits in visual cortex: Insights from the study of tree shrew striate cortex. Cerebral Cortex. 1996;6:329–341. doi: 10.1093/cercor/6.3.329. [DOI] [PubMed] [Google Scholar]
- Ghose GM, Freeman RD, Ohzawa I. Local intracortical connections in the cat's visual cortex: Postnatal development and plasticity. Journal of Neurophysiology. 1994;72:1290–1303. doi: 10.1152/jn.1994.72.3.1290. [DOI] [PubMed] [Google Scholar]
- Gil Z, Connors BW, Amitai Y. Efficacy of thalamocortical and intracortical synaptic connections: Quanta, innervation, and reliability. Neuron. 1999;23:385–397. doi: 10.1016/s0896-6273(00)80788-6. [DOI] [PubMed] [Google Scholar]
- Gilbert CD. Laminar differences in receptive field properties of cells in cat primary visual cortex. Journal of Physiology. 1977;268:391–421. doi: 10.1113/jphysiol.1977.sp011863. [DOI] [PMC free article] [PubMed] [Google Scholar]
- Gilbert CD, Kelly JP. The projections of cells in different layers of the cat's visual cortex. Journal of Comparative Neurology. 1975;163:81–105. doi: 10.1002/cne.901630106. [DOI] [PubMed] [Google Scholar]
- Gilbert CD, Wiesel TN. Morphology and intracortical projections of functionally characterised neurones in the cat visual cortex. Nature. 1979;280:120–125. doi: 10.1038/280120a0. [DOI] [PubMed] [Google Scholar]
- Gilbert CD, Wiesel TN. Laminar specialization and intracortical connections in cat primary visual cortex. In: Schmitt FO, Worden FG, Adelman G, Dennis SG, editors. The Organization of the Cerebral Cortex. Cambridge, MA, USA: MIT Press; 1981. pp. 164–190. [Google Scholar]
- Golding NL, Spruston N. Dendritic sodium spikes are variable triggers of axonal action potentials in hippocampal ca1 pyramidal neurons. Neuron. 1998;21:1189–1200. doi: 10.1016/s0896-6273(00)80635-2. [DOI] [PubMed] [Google Scholar]
- Grieve KL, Sillito AM. Non-length-tuned cells in layers II/III and IV of the visual cortex: The effect of blockade of layer VI on responses to stimuli of different lengths. Experimental Brain Research. 1995;104:12–20. doi: 10.1007/BF00229851. [DOI] [PubMed] [Google Scholar]
- Heggelund P. Quantitative studies of enhancement and suppression zones in the receptive field of simple cells in cat striate cortex. Journal of Physiology. 1986;373:293–310. doi: 10.1113/jphysiol.1986.sp016048. [DOI] [PMC free article] [PubMed] [Google Scholar]
- Henry GH. Receptive field classes of cells in the striate cortex of the cat. Brain Research. 1977;133:1–28. doi: 10.1016/0006-8993(77)90045-2. [DOI] [PubMed] [Google Scholar]
- Hirsch JA. Synaptic integration in layer IV of the ferret striate cortex. Journal of Physiology. 1995;483:183–199. doi: 10.1113/jphysiol.1995.sp020577. [DOI] [PMC free article] [PubMed] [Google Scholar]
- Hirsch JA, Alonso JM, Reid RC. Visually evoked calcium action potentials in cat striate cortex. Nature. 1995;378:612–616. doi: 10.1038/378612a0. [DOI] [PubMed] [Google Scholar]
- Hirsch JA, Alonso JM, Reid CR, Martinez LM. Different synaptic responses of first and second order complex cells in cat striate cortex. Society for Neuroscience Abstracts. 1997;23:1668. [Google Scholar]
- Hirsch JA, Alonso JM, Martinez LM. The receptive field structure of inhibitory complex cells mirrors that of excitatory complex cells. Society for Neuroscience Abstracts. 1998a;24:766. [Google Scholar]
- Hirsch JA, Alonso JM, Reid RC, Martinez LM. Synaptic integration in striate cortical simple cells. Journal of Neuroscience. 1998b;18:9517–9528. doi: 10.1523/JNEUROSCI.18-22-09517.1998. [DOI] [PMC free article] [PubMed] [Google Scholar]
- Hirsch JA, Gallagher CA, Alonso JM, Martinez LM. Ascending projections of simple and complex cells in layer 6 of the cat striate cortex. Journal of Neuroscience. 1998c;18:8086–8094. doi: 10.1523/JNEUROSCI.18-19-08086.1998. [DOI] [PMC free article] [PubMed] [Google Scholar]
- Hirsch JA, Gilbert CD. Synaptic physiology of horizontal connections in the cat's visual cortex. Journal of Neuroscience. 1991;11:1800–1809. doi: 10.1523/JNEUROSCI.11-06-01800.1991. [DOI] [PMC free article] [PubMed] [Google Scholar]
- Hirsch JA, Gilbert CD. Long-term changes in synaptic strength along specific intrinsic pathways in the cat visual cortex. Journal of Physiology. 1993;461:247–262. doi: 10.1113/jphysiol.1993.sp019512. [DOI] [PMC free article] [PubMed] [Google Scholar]
- Hirsch JA, Martinez LM, Alonso JM, Pillai C, Pierre C. Simple and complex inhibitory cells in layer 4 of the cat visual cortex. Society for Neuroscience Abstracts. 2000;26:1083. [Google Scholar]
- Hoffman KP, Stone J. Conduction velocity of afferents to cat visual cortex: A correlation with cortical receptive field properties. Brain Research. 1971;32:460–466. doi: 10.1016/0006-8993(71)90340-4. [DOI] [PubMed] [Google Scholar]
- Horikawa K, Armstrong WE. A versatile means of labeling: Injection of biocytin and its detection with avidin conjugates. Journal of Neuroscience Methods. 1988;25:1–11. doi: 10.1016/0165-0270(88)90114-8. [DOI] [PubMed] [Google Scholar]
- Hubel DH, Wiesel TN. Receptive fields, binocular interaction and functional architecture in the cat's visual cortex. Journal of Physiology. 1962;160:106–154. doi: 10.1113/jphysiol.1962.sp006837. [DOI] [PMC free article] [PubMed] [Google Scholar]
- Humphrey AL, Sur M, Uhlrich DJ, Sherman SM. Projection patterns of individual x-and y-cell axons from the lateral geniculate nucleus to cortical area 17 in the cat. Journal of Comparative Neurology. 1985;233:159–189. doi: 10.1002/cne.902330203. [DOI] [PubMed] [Google Scholar]
- Johnson RR, Burkhalter A. Microcircuitry of forward and feedback connections within rat visual cortex. Journal of Comparative Anatomy. 1996;368:383–398. doi: 10.1002/(SICI)1096-9861(19960506)368:3<383::AID-CNE5>3.0.CO;2-1. [DOI] [PubMed] [Google Scholar]
- Jones JP, Palmer LA. The two-dimensional spatial structure of simple receptive fields in cat striate cortex. Journal of Neurophysiology. 1987;58:1187–1211. doi: 10.1152/jn.1987.58.6.1187. [DOI] [PubMed] [Google Scholar]
- Joris PX, Smith PH, Yin TC. Coincidence detection in the auditory system: 50 years after Jeffress. Neuron. 1998;21:1235–1238. doi: 10.1016/s0896-6273(00)80643-1. [DOI] [PubMed] [Google Scholar]
- Kim HG, Connors BW. Apical dendrites of the neocortex: Correlation between sodium- and calcium-dependent spiking and pyramidal cell morphology. Journal of Neuroscience. 1993;13:5301–5311. doi: 10.1523/JNEUROSCI.13-12-05301.1993. [DOI] [PMC free article] [PubMed] [Google Scholar]
- Laughlin SB, de van Ruyter Steveninck RR, Anderson JC. The metabolic cost of neural information. Nature Neuroscience. 1998;1:36–41. doi: 10.1038/236. [DOI] [PubMed] [Google Scholar]
- LeVay S. Synaptic patterns in the visual cortex of the cat and monkey. Electron microscopy of golgi preparations. Journal of Comparative Neurology. 1973;150:53–85. doi: 10.1002/cne.901500104. [DOI] [PubMed] [Google Scholar]
- LeVay S, Gilbert CD. Laminar patterns of geniculocortical projection in the cat. Brain Research. 1976;113:1–19. doi: 10.1016/0006-8993(76)90002-0. [DOI] [PubMed] [Google Scholar]
- Lorente De Nò R. Architecture, intracortical connections, motor projections. In: Fulton JF, editor. Physiology of the Nervous System. London: Oxford University Press; 1944. pp. 291–325. [Google Scholar]
- Lund JS, Henry GH, Macqueen CL, Harvey AR. Anatomical organization of the primary visual cortex (area 17) of the cat. A comparison with area 17 of the macaque monkey. Journal of Comparative Neurology. 1979;184:599–618. doi: 10.1002/cne.901840402. [DOI] [PubMed] [Google Scholar]
- McGuire BA, Gilbert CD, Rivlin PK, Wiesel TN. Targets of horizontal connections in macaque primary visual cortex. Journal of Comparative Neurology. 1991;305:370–392. doi: 10.1002/cne.903050303. [DOI] [PubMed] [Google Scholar]
- McGuire BA, Hornung JP, Gilbert CD, Wiesel TN. Patterns of synaptic input to layer 4 of cat striate cortex. Journal of Neuroscience. 1984;4:3021–3033. doi: 10.1523/JNEUROSCI.04-12-03021.1984. [DOI] [PMC free article] [PubMed] [Google Scholar]
- Magee JC. Dendritic Ih normalizes temporal summation in hippocampal ca1 neurons. Nature Neuroscience. 1999;2:508–514. doi: 10.1038/12229. [DOI] [PubMed] [Google Scholar]
- Malinow R, Tsien RW. Presynaptic enhancement shown by whole-cell recordings of long-term potentiation in hippocampal slices. Nature. 1990;346:177–180. doi: 10.1038/346177a0. [DOI] [PubMed] [Google Scholar]
- Martin KA, Whitteridge D. Form, function and intracortical projections of spiny neurones in the striate visual cortex of the cat. Journal of Physiology. 1984;353:463–504. doi: 10.1113/jphysiol.1984.sp015347. [DOI] [PMC free article] [PubMed] [Google Scholar]
- Martinez LM, Reid RC, Alonso JM, Hirsch JA. The synaptic structure of the simple receptive field. Society for Neuroscience Abstracts. 1999;25:1048. [Google Scholar]
- Martinez LM, Alonso JM, Reid RC, Hirsch JA. Laminar processing of stimulus orientation in cat visual cortex. Journal of Physiology. 2002;540:321–333. doi: 10.1113/jphysiol.2001.012776. [DOI] [PMC free article] [PubMed] [Google Scholar]
- Moore CI, Nelson SB. Spatio-temporal subthershold receptive fields in the vibrissa representaation of rat primary somatosensory cortx. journal of Neurophysiology. 1998;80:2882–2892. doi: 10.1152/jn.1998.80.6.2882. [DOI] [PubMed] [Google Scholar]
- Movshon JA, Thompson ID, Tolhurst DJ. Spatial summation in the receptive fields of simple cells in the cat's striate cortex. Journal of Physiology. 1978a;283:53–77. doi: 10.1113/jphysiol.1978.sp012488. [DOI] [PMC free article] [PubMed] [Google Scholar]
- Movshon JA, Thompson ID, Tolhurst DJ. Receptive field organization of complex cells in the cat's striate cortex. Journal of Physiology. 1978b;283:79–99. doi: 10.1113/jphysiol.1978.sp012489. [DOI] [PMC free article] [PubMed] [Google Scholar]
- Mullikin WH, Jones JP, Palmer LA. Receptive-field properties and laminar distribution of x-like and y-like simple cells in cat area 17. Journal of Neurophysiology. 1984;52:350–371. doi: 10.1152/jn.1984.52.2.350. [DOI] [PubMed] [Google Scholar]
- Ohzawa I, Freeman RD. Spatial pooling of subunits in complex cell receptive fields. Society for Neuroscience Abstracts. 1997;23:1669. [Google Scholar]
- Palmer LA, Davis TL. Receptive-field structure in cat striate cortex. Journal of Neurophysiology. 1981a;46:260–276. doi: 10.1152/jn.1981.46.2.260. [DOI] [PubMed] [Google Scholar]
- Palmer LA, Davis TL. Comparison of responses to moving and stationary stimuli in cat striate cortex. Journal of Neurophysiology. 1981b;46:277–295. doi: 10.1152/jn.1981.46.2.277. [DOI] [PubMed] [Google Scholar]
- Pare D, Lang EJ, Destexhe A. Inhibitory control if somatic and dendritic sodium spikes in neocortical pyramidal neurons in vivo:An intracellular study. Neuroscience. 1998a;84:377–402. doi: 10.1016/s0306-4522(97)00530-7. [DOI] [PubMed] [Google Scholar]
- Pare D, Shink E, Gaudreau H, Destexhe A, Lang EJ. Impact of spontaneous synaptic activity on the resting properties of cat neocortical pyramidal neurons in vivo. Journal of Neurophysiology. 1998b;79:1450–1460. doi: 10.1152/jn.1998.79.3.1450. [DOI] [PubMed] [Google Scholar]
- Pei X, Volgushev M, Vidyasagar TR, Creutzfeldt OD. Whole cell recording and conductance measurements in cat visual cortex in-vivo. NeuroReport. 1991;2:485–488. doi: 10.1097/00001756-199108000-00019. [DOI] [PubMed] [Google Scholar]
- Peters A, Payne BR. Numerical relationships between geniculocortical afferents and pyramidal cell modules in cat primary visual cortex. Cerebral Cortex. 1993;3:69–78. doi: 10.1093/cercor/3.1.69. [DOI] [PubMed] [Google Scholar]
- Rall W. Handbook of Physiology, The Nervous System: Cellular Biology of Neurons. Bethesda: American Physiological Society; 1977. Core conductor theory and cable properties of neurons; pp. 39–97. [Google Scholar]
- Regehr W, Kehoe J, Ascher P, Armstrong C. Synaptically triggered action potentials in dendrites. Neuron. 1993;11:145–151. doi: 10.1016/0896-6273(93)90278-y. [DOI] [PubMed] [Google Scholar]
- Reid RC, Alonso JM. The processing and encoding of information in the visual cortex. Current Opinion in Neurobiology. 1996;6:475–480. doi: 10.1016/s0959-4388(96)80052-3. [DOI] [PubMed] [Google Scholar]
- Reyes A, Lujan R, Rozov A, Burnashev N, Somogyi P, Sakmann B. Target-cell-specific facilitation and depression in neocortical circuits. Nature Neuroscience. 1998;1:279–285. doi: 10.1038/1092. [DOI] [PubMed] [Google Scholar]
- Ringach DL, Hawken MJ, Shapley R. Dynamics of orientation tuning in macaque primary visual cortex. Nature. 1997;387:281–284. doi: 10.1038/387281a0. [DOI] [PubMed] [Google Scholar]
- Sakitt B, Barlow HB. A model for the economical encoding of the visual image in cerebral cortex. Biological Cybernetics. 1982;43:97–108. doi: 10.1007/BF00336972. [DOI] [PubMed] [Google Scholar]
- Schiller J, Schiller Y, Stuart G, Sakmann B. Calcium action potentials restricted to distal apical dendrites of rat neocortical pyramidal neurons. Journal of Physiology. 1997;505:605–616. doi: 10.1111/j.1469-7793.1997.605ba.x. [DOI] [PMC free article] [PubMed] [Google Scholar]
- Shao Z, Burkhalter A. Different balance of excitation and inhibition in forward and feedback circuits of rat visual cortex. Journal of Neuroscience. 1996;16:3009–3018. doi: 10.1523/JNEUROSCI.16-22-07353.1996. [DOI] [PMC free article] [PubMed] [Google Scholar]
- Skottun BC, De Valois RL, Grosof DH, Movshon JA, Albrecht DG, Bonds AB. Classifying simple and complex cells on the basis of response modulation. Vision Research. 1991;31:1079–1086. doi: 10.1016/0042-6989(91)90033-2. [DOI] [PubMed] [Google Scholar]
- Spencer WA, Kandel ER. Electrophysiology of hippocampal neurons. IV. Fast prepotentials. Journal of Neurophysiology. 1961;24:272–285. doi: 10.1152/jn.1961.24.3.272. [DOI] [PubMed] [Google Scholar]
- Stafstrom CE, Schwindt PC, Chubb MC, Crill WE. Properties of persistent sodium conductance and calcium conductance of layer V neurons from cat sensorimotor cortex in vitro. Journal of Neurophysiology. 1985;53:153–170. doi: 10.1152/jn.1985.53.1.153. [DOI] [PubMed] [Google Scholar]
- Stern P, Edwards FA, Sakmann B. Fast and slow components of unitary epscs on stellate cells elicited by focal stimulation in slice of the rat visual cortex. Journal of Physiology. 1992;449:247–278. doi: 10.1113/jphysiol.1992.sp019085. [DOI] [PMC free article] [PubMed] [Google Scholar]
- Stratford KJ, Tarczy-Hornoch K, Martin KA, Bannister NJ, Jack JJ. Excitatory synaptic inputs to spiny stellate cells in cat visual cortex. Nature. 1996;382:258–261. doi: 10.1038/382258a0. [DOI] [PubMed] [Google Scholar]
- Stühmer A, Roberts M, Almers W. The loose patch clamp. In: Sakmann B, Neher E, editors. Single Channel Recording. New York: Plenum; 1983. pp. 123–132. [Google Scholar]
- Svoboda K, Helmchen F, Denk W, Tank DW. Spread of dendritic excitation in layer 2/3 pyramidal neurons in rat barrel cortex in vivo. Nature Neuroscience. 1999;2:65–73. doi: 10.1038/4569. [DOI] [PubMed] [Google Scholar]
- Szulborski RG, Palmer LA. The two-dimensional spatial structure of nonlinear subunits in the receptive fields of complex cells. Vision Research. 1990;30:249–254. doi: 10.1016/0042-6989(90)90040-r. [DOI] [PubMed] [Google Scholar]
- Tanaka K. Cross-correlation analysis of geniculostriate neuronal relationships in cats. Journal of Neurophysiology. 1983;49:1303–1318. doi: 10.1152/jn.1983.49.6.1303. [DOI] [PubMed] [Google Scholar]
- Tanaka K. Organization of geniculate inputs to visual cortical cells in the cat. Vision Research. 1985;25:357–364. doi: 10.1016/0042-6989(85)90060-4. [DOI] [PubMed] [Google Scholar]
- Tank DW, Regehr WG, Delaney KR. A quantitative analysis of presynaptic calcium dynamics that contribute to short-term enhancement. Journal of Neuroscience. 1995;15:7940–7952. doi: 10.1523/JNEUROSCI.15-12-07940.1995. [DOI] [PMC free article] [PubMed] [Google Scholar]
- Thomson AM, West DC. Fluctuation in pyramid-pyramid excitatory postsynaptic potentials modified by presynaptic firing pattern and postsynaptic membrane potential using paired intracellular recordings in rat neocortex. Neuroscience. 1993;54:329–346. doi: 10.1016/0306-4522(93)90256-f. [DOI] [PubMed] [Google Scholar]
- Thomson AM. Activity-dependent properties of synaptic transmission at two classes of connections made by rat neocortical pyramidal axons in vitro. Journal of Physiology. 1997;502:131–147. doi: 10.1111/j.1469-7793.1997.131bl.x. [DOI] [PMC free article] [PubMed] [Google Scholar]
- Thomson AM, Deuchars J. Synaptic interactions in neocortical local circuits: Dual intracellular recordings in vitro. Cerebral Cortex. 1997;7:510–522. doi: 10.1093/cercor/7.6.510. [DOI] [PubMed] [Google Scholar]
- Tolhurst DJ, Dean AF. Spatial summation by simple cells in the striate cortex of the cat. Experimental Brain Research. 1987;66:607–620. doi: 10.1007/BF00270694. [DOI] [PubMed] [Google Scholar]
- Toyama K. Functional connection of the visual cortex studied by cross-correlation techniques. In: Rakic P, Singer W, editors. Neurobiology of Neocortex. New York: John Wiley & Sons; 1988. pp. 203–217. [Google Scholar]
- Tsodyks MV, Markram H. The neural code between neocortical pyramidal neurons depends on neurotransmitter release probability. Proceedings of the National Academy of Sciences of the USA. 1997;94:719–723. doi: 10.1073/pnas.94.2.719. [DOI] [PMC free article] [PubMed] [Google Scholar]
- Varela JA, Sen K, Gibson J, Fost J, Abbott LF, Nelson SB. A quantitative description of short-term plasticity at excitatory synapses in layer 2/3 of rat primary visual cortex. Journal of Neuroscience. 1997;17:7926–7940. doi: 10.1523/JNEUROSCI.17-20-07926.1997. [DOI] [PMC free article] [PubMed] [Google Scholar]
- Vinje WE, Gallant JL. Sparse coding and decorrelation in primary visual cortex during natural vision. Science. 2000;287:1273–1276. doi: 10.1126/science.287.5456.1273. [DOI] [PubMed] [Google Scholar]
- Wolfe J, Palmer LA. Temporal diversity in the lateral geniculate nucleus of cat. Visual Neuroscience. 1998;15:653–675. doi: 10.1017/s0952523898154068. [DOI] [PubMed] [Google Scholar]
- Yuste R, Tank DW. Dendritic integration in mammalian neurons, a century after Cajal. Neuron. 1996;16:701–716. doi: 10.1016/s0896-6273(00)80091-4. [DOI] [PubMed] [Google Scholar]
- Zhu JJ, Connors BW. Intrinsic firing patterns and whisker-evoked synaptic responses of neurons in the rat barrel cortex. Journal of Neurophysiology. 1999;81:1171–1183. doi: 10.1152/jn.1999.81.3.1171. [DOI] [PubMed] [Google Scholar]