

Abstract
In humans, somatosensory stimulation results in increased corticomotoneuronal excitability to the stimulated body parts. The purpose of this study was to investigate the underlying mechanisms. We recorded motor evoked potentials (MEPs) to transcranial magnetic stimulation (TMS) from abductor pollicis brevis (APB), first dorsal interosseous (FDI), and abductor digiti minimi (ADM) muscles. MEP amplitudes, recruitment curves (RC), intracortical inhibition (ICI), intracortical facilitation (ICF), resting (rMT) and active motor thresholds (aMT) were recorded before and after a 2-h period of ulnar nerve electrical stimulation at the wrist. Somatosensory input was monitored by recording somatosensory evoked potentials. To differentiate excitability changes at cortical vs. subcortical sites, we recorded supramaximal peripheral M-responses and MEPs to brainstem electrical stimulation (BES). In order to investigate the involvement of GABAergic mechanisms, we studied the influence of lorazepam (LZ) (a GABAA receptor agonist) relative to that of dextromethorphan (DM) (an NMDA receptor antagonist) and placebo in a double-blind design. We found that somatosensory stimulation increased MEP amplitudes to TMS only in the ADM, confirming a previous report. This effect was blocked by LZ but not by either DM or placebo and lasted between 8 and 20 min in the absence of (i) changes in MEPs elicited by BES, (ii) amplitudes of early somatosensory-evoked potentials or (iii) M-responses. We conclude that somatosensory stimulation elicited a focal increase in corticomotoneuronal excitability that outlasts the stimulation period and probably occurs at cortical sites. The antagonistic effect of LZ supports the hypothesis of GABAergic involvement as an operating mechanism.
Somatosensory input is required for accurate motor performance (Bastian, 1887; Pearson, 2000) and for learning new motor skills (Pavlides et al. 1993). A reduction of this input by local anaesthesia impairs motor control in healthy subjects (Edin & Johansson, 1995; Aschersleben et al. 2001). Similarly, patients with decreased somatosensory inputs due to large-fibre sensory neuropathy display characteristic abnormal motor behaviour (Rothwell et al. 1982; Gordon et al. 1995). In patients with stroke, somatosensory deficits are associated with a slower recovery of motor function (Reding & Potes, 1988).
On the other hand, it has been proposed that increased somatosensory input in the form of peripheral nerve stimulation may enhance motor function (Hamdy et al. 1998). In healthy subjects, a prolonged period of peripheral nerve stimulation can induce a lasting increase in corticomotoneuronal excitability to the stimulated body parts (Hamdy et al. 1998; Ridding et al. 2000). In patients with motor deficits secondary to stroke, it has been suggested that stimulation of peripheral nerves enhances the effectiveness of neurorehabilitation (Johansson et al. 1993; Powell et al. 1999; Wong et al. 1999; Conforto et al. 2002). The mechanisms underlying these effects are incompletely understood.
The purpose of this study was to enhance our understanding of the modulatory effects of somatosensory stimulation on corticomotoneuronal excitability (Ridding et al. 2000). We provide evidence for a cortical origin of this modulatory effect. Further experiments indicated that it is heavily influenced by GABAergic mechanisms.
METHODS
Subjects
Eleven healthy right-handed normal volunteers (eight males, three females) aged 18–45 years (mean 33 years) with no history of either neurological or psychiatric diseases participated in this study. Handedness was evaluated by the Edinburgh Inventory (Oldfield, 1971). A complete neurological examination was normal in all subjects. All subjects gave written informed consent. This study was performed according to the Declaration of Helsinki and the protocol was approved by the NINDS Investigational Review Board. All subjects participated in several experiments.
Experimental protocol
Electrophysiological measurement of CM excitability by transcranial magnetic stimulation (TMS) was obtained on different days before and after one of two interventions: (a) a 2-h period of electrical stimulation of the ulnar nerve; and (b) a 2-h idle time (no stimulation). This latter control condition was added because attentional and cognitive factors (Rosler et al. 1999; Rossini et al. 1999) vary during the course of the 2–3-h experiments and can influence corticomotoneuronal excitability. Subjects sat on a comfortable chair during all experiments.
We first identified the optimal position to stimulate the ulnar nerve at the wrist by recording the M-response. Silver-silver chloride electrodes (diameter 10 mm) were then placed with the cathode proximal.
Trains of electrical stimulation were delivered at 1 Hz (Grass stimulator S 8800 with SIU5 stimulus isolation unit, Grass Instrument Division, Astro-Med Inc., West Warwick, RI, USA). Each train consisted of five single pulses of 1 ms duration delivered at 10 Hz (Ridding et al. 2000). The stimulus intensity was adjusted to elicit small compound muscle action potentials (CMAPs) of 50–100 μV from the ADM in the absence of visible finger movements. This low stimulation intensity and the stimulus duration of 1 ms preferentially activate large cutaneous and proprioceptive sensory fibres (Panizza et al. 1992). Stimulation was painless, comfortable, and resulted in mild paresthesias in digits 4 and 5 (sometimes also 3). Relaxation during the 2-h period of somatosensory stimulation was monitored by electromyography (EMG). During the stimulation period, subjects remained seated, reading books or magazines of their choice. They were instructed to avoid arm movements. However, they were allowed to change their arm position during the 2-h period if the initial position was no longer comfortable. Supramaximal M-responses were recorded from the abductor pollicis brevis (APB), first dorsal interosseous (FDI), and abductor digiti minimi (ADM) muscles before and after stimulation and idle time.
Somatosensory-evoked potentials (SEPs) during ulnar nerve stimulation were recorded to monitor the stability of the signal arriving in the cerebral cortex. The active recording electrode was placed over C4′ (2 cm posterior to C4) referenced to Fz (Terao et al. 1999). EEG activity was pre-amplified, filtered (2 Hz-2 kHz), and stored using a Counterpoint device (see below) and a Labview application (Kaelin-Lang & Cohen, 2000). Peak-to-peak amplitudes of components N20-P25 and P25-N33, thought to reflect arrival and initial cortical processing of somatosensory input (Allison et al. 1991; Cheron et al. 2000), were measured during and after the 2-h stimulation period.
Transcranial magnetic stimulation
Motor evoked potentials (MEPs) were recorded from APB, FDI, and ADM muscles using silver-silver chloride electrodes in a tendon belly arrangement on the non-dominant left hand. EMG was pre-amplified and band-pass filtered (10 Hz-2 kHz) using a Dantec Counterpoint electromyograph (Dantec Electronics, Skovlunde, Denmark). Input was then fed into an IBM compatible personal computer (486DX) with a Keithley DAS-1600 I/O board controlled by an ‘Asyst’ application (Keithley, Taunton, MA, USA) or to a computerized data acquisition system built with the Labview graphical programming language (sampling rate 5 kHz) (Kaelin-Lang & Cohen, 2000). Its ‘conditional triggering’ feature was used to deliver TMS stimuli only when target muscles (one to three depending on the experiment) were relaxed. Relaxation was defined as EMG activity at baseline < 40 μV peak-to-peak amplitude for at least 1 s. MEP amplitude was expressed relative to the maximal peripheral M-responses. TMS was delivered to the optimal scalp position (right motor cortex) to stimulate the target muscle. TMS was delivered through a figure-of-eight-shaped magnetic coil (outside diameter 8.7 cm) connected to a Quad-module and two Magstim 200 magnetic stimulators (The Magstim Company, Dyfed, UK). The magnetic coil was placed tangentially to the scalp, with the intersection of both wings at a 45 deg angle with the midline to optimally stimulate the motor cortex (Brasil-Neto et al. 1992; Mills et al. 1992).
Measures of corticomotoneuronal excitability
Resting motor thresholds
The resting motor threshold (rMT) was defined as the minimum TMS intensity (measured to the nearest 1 % of the maximum output of the magnetic stimulator) required to elicit at least five out of 10 MEP ≥ 50 mV in consecutive trials (Rossini et al. 1994). TMS stimulus intensities were expressed relative to rMT measured from the ADM. There were no statistically significant differences between rMT from the ADM, APB and FDI. The active motor threshold (aMT) was defined as the minimum TMS intensity (measured to the nearest 1 % of the maximum output of the magnetic stimulator) required to elicit at least five out of 10 MEPs ≥ 100 mV in consecutive trials during background muscle facilitation (5 % maximal isometric muscle contraction of the ADM; see Kaelin-Lang & Cohen, 2000).
Recruitment curves
Mean MEP amplitudes were obtained in response to 10 TMS stimuli delivered at each of four stimulus intensities: 10, 20, 30 and 40 % above rMT in 10 subjects. In three subjects who demonstrated a significant increase in MEP amplitude in this first experiment, recruitment curves were also obtained at 10 randomly intermixed stimulus intensities (step of 5 % absolute stimulator output, six stimuli at each intensity). Based on these data, a nonlinear regression analysis was implemented using the Levenberg-Marquard least-mean-squares algorithm with the Boltzmann function (Devanne et al. 1997; Kaelin-Lang & Cohen, 2000):
This function is used to relate the amplitude of the response (MEPa) to the TMS stimulation intensity (I) and has three different parameters: the function plateau (P), the stimulus intensity (I50) required to obtain an MEP amplitude 50 % of the plateau, and the slope parameter k, which is related to the maximal function steepness (Devanne et al. 1997).
Intracortical inhibition and facilitation
Intracortical inhibition (ICI) and intracortical facilitation (ICF) were measured with paired-pulse TMS as previously described (Kujirai et al. 1993; Ziemann et al. 1996). Briefly, active motor thresholds (aMT) were determined first. Conditioning stimulus intensity was then set to 90 % of the aMT. The intensity of the test stimulus was that required to evoke MEPs of approximately 1 mV (often close to 40 % above rMT). The order of presentation of inhibitory (2 ms), excitatory (15 ms) and control trials (test stimulus alone) intervals was randomized. Six to eight trials were recorded for each ISI.
Brainstem electrical stimulation
A previous study evaluating the effects of a 2-h period of somatosensory stimulation on the responses to TMS and TES under muscle facilitation did not allow identification of the site of the excitability changes (Ridding et al. 2000). For this reason, we opted to study responses to brainstem electrical stimulation (BES). We compared motor potentials evoked by BES (Ugawa et al. 1991) with those evoked by TMS in two subjects with a documented increase in TMS-evoked MEPs. MEPs induced in response to TMS and BES were recorded before and after the 2-h period of somatosensory stimulation. The order of presentation of TMS and BES stimuli was randomized. BES was delivered through surface electrodes from a Digitimer D180 electrical stimulator (Digitimer Ltd, Hertfordshire, UK). Stimulating electrodes in a bipolar montage were fixed with collodion on the skin overlying the mastoids (Ugawa et al. 1991). MEPs induced in response to TMS (10) and BES (5) were stored for off-line analysis. Interval between stimuli varied randomly between 7 and 12 s. Because BES is a painful procedure, only two subjects were studied.
Effects of lorazepam and dextromethorphan
We investigated the effects of systemic administration of lorazepam (LZ), a benzodiazepine that facilitates γ-aminobutyric acid A (GABAA) receptor-mediated inhibition (Macdonald & Kelly, 1995) and of dextromethorphan (DM), a noncompetitive N-methyl-d-aspartate (NMDA) receptor antagonist (Apland & Braitman, 1990) on the increased corticomotor excitability elicited by somatosensory stimulation. Both drugs were administered in a placebo-controlled double-blind design in separate sessions.
Lorazepam
Pre- and post-intervention measures were obtained at a time when calculated drug levels were therapeutic. Testing was first performed 2 h following intake of a single oral dose of LZ (0.038 mg kg−1 orally) in five subjects. At this time, blood levels are expected to be within the therapeutic range and remain there for 3–5 h (Greenblatt et al. 1993). A pharmacokinetic computer simulation that assumes a two-compartment model with first-order oral absorption (Gupta et al. 1990) was performed for each subject (considering individual LZ dose and body weight) to estimate concentrations before, during, and after the 2-h period of somatosensory stimulation (WinNonlin v1.5, Pharsight, Mountain View, CA, USA). Results indicated that LZ concentrations exceeded 42.9 ng ml−1, well above therapeutic levels (Greenblatt et al. 1989) in all individuals and intervals tested (range: 42.9–56 mg l−1).
Dextromethorphan
Since DM (2 mg kg−1 orally) rapidly reaches therapeutic blood levels and has a relatively short half-life (2.5 h) (Hollander et al. 1994), a single oral dose was administered 30 min preceding the 2-h period of somatosensory stimulation in six subjects. DM at this dose results in serum and brain concentrations in humans (Hollander et al. 1994; Steinberg et al. 1996) similar to those that induce NMDA receptor block in vitro (Apland & Braitman, 1990). Since DM is rapidly metabolized to dextorphan, a similarly active compound (Hollander et al. 1994), and brain tissue DM and dextorphan concentrations are much higher than those present in blood (Steinberg et al. 1996), DM plasma levels are an imprecise indicator of CNS action (Hollander et al. 1994) and were not calculated.
Placebo
Placebo was given at exactly the same time as the active drugs. Because the time of intake was not the same for DM and for LZ, each drug had its own placebo session. Side-effects were rated according to the subjects’ self-report as absent, minimal, mild or moderate.
Statistical analysis
‘GB-Stat’ software (Dynamic Microsystems, Silver Spring, MD, USA) and ad hoc Labview applications were used for statistical analysis. Effects of somatosensory stimulation on MEP amplitudes recorded at four different stimulus intensities were compared using repeated measures ANOVA with two within-subject factors: ‘time’ (before and after intervention) and ‘intensity’ (four levels). The focality of the effect was analysed with a two-way ANOVA model with factors ‘muscle’ (three levels) and ‘time’ (before and after intervention), and the time course experiment with a one-way ANOVA (factor ‘time’, four levels). Student's t test and the Wilcoxon test were used for post-hoc testing. Recruitment curves were analysed using a nonlinear regression analysis (Capaday et al. 1999) followed by F-test statistics (Motulsky & Ransnas, 1987). The significance level was set to P < 0.05 after correction for multiple comparisons, when required. All results are given as means ± standard error of the mean (s.e.m.). All ANOVA results are given with the degree of freedom (d.f.) and the F value.
RESULTS
Effects of somatosensory stimulation on corticomotoneuronal excitability
A 2-h period of somatosensory stimulation of the ulnar nerve resulted in significantly increased MEP amplitude srecorded from the ulnar nerve-innervated ADM muscle (ANOVA, main factor ‘time’, d.f. = 1, F = 7.91, P < 0.01), while the control intervention failed to elicit this effect (Fig. 1).
Figure 1. Changes induced by a 2-h period of somatosensory stimulation (A,B,C) or 2 h idle time (D) on the amplitude of motor evoked potentials (MEPs) recorded from the abductor digiti minimi (ADM).
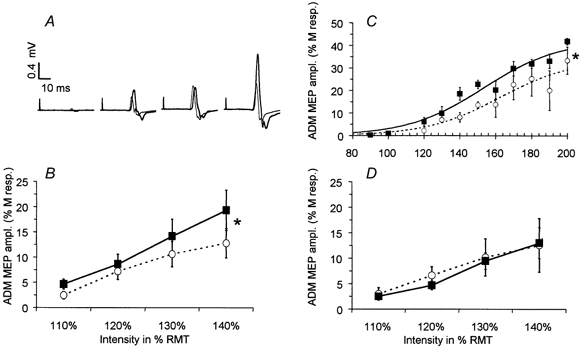
A, representative 3-MEP averages evoked by TMS at intensities 10, 20, 30 and 40 % above motor threshold in one representative experiment, before (thin line) and after (thick line) the 2-h period of somatosensory stimulation. B, grand average of ADM-MEP amplitude (mean ±s.e.m., n = 10) from all subjects recorded at TMS intensities 10, 20, 30 and 40 % above motor threshold (○….○: before intervention; ▪–▪: after 2-h period of somatosensory stimulation). C, recruitment curve (mean of three subjects) recorded at 10 randomly intermixed TMS intensities before (○) and after (▪) the 2-h period of somatosensory stimulation (mean ±s.e.m.). The dotted line represents the Boltzmann sigmoid function estimated by nonlinear regression before the 2-h period of somatosensory stimulation; the thick line represents the Boltzmann function estimated after stimulation. Both curves were significantly different from each other (see Methods for the statistics used). Amplitude is expressed as a percentage of the supramaximal M-response. *P < 0.05. D, a control period consisting of a 2-h idle time (without somatosensory stimulation) did not significantly change the amplitude of MEPs (mean ±s.e.m.) recorded from the ADM at TMS intensities 10, 20, 30 and 40 % above motor threshold (○….○: before the 2-h idle time; ▪–▪: after 2-h period of idle time; n = 6).
In the absence of a significant interaction between factors ‘time’ and ‘intensity’ (ANOVA, d.f. = 3, F = 0.8, P = 0.48), the MEP amplitude increase was more pronounced at higher levels of stimulation. At 40 % above rMT (Fig. 1B) MEP amplitudes variably increased in 8 of 10 subjects (on average by 67.8 ± 23.4 %, range −13 % to +252 %, n = 10). As expected, ADM amplitudes were significantly higher at higher stimulation intensities (ANOVA, main factor ‘intensity’, d.f. = 3, F = 3.44, P < 0.05).
A more detailed analysis of recruitment curves (Devanne et al. 1997) showed that both the plateau (P) (P before: 33.8 % M-response; after: 42.4 % M-response) and the I50 parameters (I50 before: +62.4 % above rMT; after: +53.4 % above rMT) of the recruitment curve were changed by somatosensory stimulation while the slope parameter k remained unchanged (k before: 20.3; after: 21) (Fig. 1C).
The intersession variability of this effect (measured with the coefficient of variation) within individuals who participated in three or more experiments (maximum six) ranged between 9.8 and 49.8 % (average 28.3 %, n = 5 subjects).
The 2-h period of somatosensory stimulation did not significantly influence: (a) ADM rMT (before: 45.1 ± 1.2 %; after: 45.1 ± 1.2 %, n = 21); (b) ADM aMT (before: 36.3 ± 1.6 %; after: 36.7 ± 1.4 %, n = 9); (c) intracortical inhibition (ICI) (ICI before: 47.4 ± 14 %, ICI after: 50.9 ± 8.9 %); or (d) intracortical facilitation (ICF) (ICF before: 158.9 ± 10.9 %; ICF after: 186.4 ± 42.9 %, n = 5). Post-hoc power analysis of these data demonstrated that for a power of 80 % with an alpha error of 5 %, our data allowed detection of changes as small as 1 % in rMT and 5 % in aMT (absolute stimulator's output) but only 35 % in ICI and 115 % in ICF.
Focality of excitability changes elicited by somatosensory stimulation
In contrast to the MEP amplitudes recorded from the ADM, MEP amplitudes simultaneously recorded from the APB muscle, which is innervated by the unstimulated median nerve, remained unchanged by both the 2-h period of somatosensory stimulation and the control intervention (2-h idle time) (Fig. 2). These results were reproducible in a separate experiment: MEPs were simultaneously recorded from the FDI, APB, and ADM at a TMS intensity 40 % above rMT before and after a 2-h period of somatosensory stimulation. Baseline amplitude of MEPs recorded from the APB and FDI were often higher than from the ADM (ANOVA, main factor ‘muscle’, d.f. = 2, F = 3.5, P < 0.05, Fig. 3C and D).
Figure 2. Changes induced by a 2-h period of somatosensory stimulation or 2 h idle time on the amplitude of motor-evoked potentials (MEPs) recorded from the median nerve-innervated abductor pollicis brevis (APB).
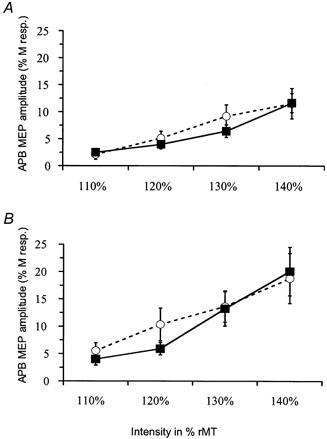
A, the amplitude of MEPs (mean ±s.e.m.) recorded at TMS intensities 10, 20, 30 and 40 % above motor threshold from APB were not significantly changed by the 2-h period of electrical stimulation of the ulnar nerve (○….○: before intervention; ▪–▪: after 2-h period of somatosensory stimulation; n = 10 subjects). All amplitudes are expressed as a percentage of the supramaximal M-response. B, a control period consisting of a 2-h idle time (without somatosensory stimulation) did not significantly change the amplitude of MEPs (mean ±s.e.m.) recorded from the APB at TMS intensities 10, 20, 30 and 40 % above motor threshold (○….○: before the 2-h idle time; ▪–▪: after 2-h period of idle time; n = 6).
Figure 3. Comparison of the effect of a 2-h period of somatosensory stimulation on motor evoked potential (MEP) amplitudes simultaneously recorded from the abductor digiti minimi (ADM), abductor pollicis brevis (APB) and first dorsal interosseus (FDI).
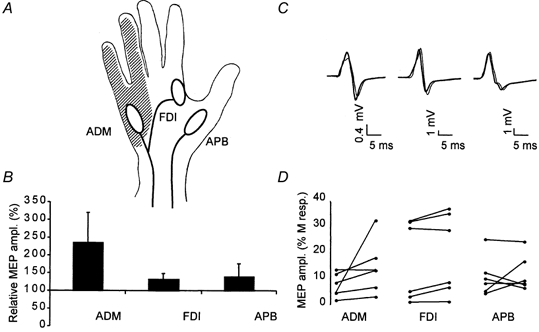
A, the 2-h period of electrical stimulation of the ulnar nerve typically induced sensation in a region (hatched area) overlapping the ulnar nerve-innervated ADM but not the ulnar nerve-innervated FDI and the median nerve-innervated APB. B, grand average across all subjects (n = 6) of the individually normalized increase in MEP amplitude (MEP peak-to-peak amplitude before intervention set to 100 %) after a 2-h period of somatosensory stimulation. Only MEP amplitude recorded from the ADM was significantly (P < 0.05) larger after the 2-h period of electrical stimulation. C, representative 3-MEP averages from a typical experiment before the intervention (thin line) and after the intervention (thick line) simultaneously recorded from the ADM, FDI (middle trace) and APB (traces on the right-hand side). D, MEP amplitudes (expressed as percentages of the maximal peripheral M-response) recorded from the ADM, FDI and APB, before (dots on the left of each line) and after (dots on the right of each line) a 2-h period of somatosensory stimulation in all six subjects (each line is one experiment).
Stimulation resulted in a highly significant increase in MEP amplitude (factor ‘time’, d.f. = 1, F = 16.5, P < 0.001). This effect was significantly different between muscles (interaction between factor ‘time’ and ‘muscle’: d.f = 2, F = 4.16, P < 0.05). The increase in amplitude of MEP recorded from the ulnar nerve-innervated ADM (by +136 ± 84.1 % of the M-response), while variable (Fig. 3D), was significantly higher than the increase in MEP amplitude recorded from both the APB and FDI (which receives motor innervation from the ulnar nerve but lies in a hand region with median and radial nerve-mediated somatosensory innervation) (Fig. 3).
Duration of excitability changes elicited by somatosensory stimulation
The duration of this effect was investigated in six subjects. Twenty TMS stimuli (interstimulus intervals 5–7 s) were delivered at an intensity of 40 % above rMT before and at three different time intervals (separated by approximately 10 min) following somatosensory stimulation. The precise time intervals varied across individuals because of different times required to determine optimal scalp positions, relaxation, and perform TMS measurements. To account for these interindividual differences, we grouped the data into three time intervals: 8–20, 21–35 and 36–50 min. rMT remained unchanged. Factor ‘time’ was significant (ANOVA, d.f. = 3, F = 3, P < 0.01). Post-hoc pair-wise comparisons revealed that MEPs recorded during the first period were significantly larger than baseline (+173 ± 51%, Fig. 4) while MEP amplitudes in the later time intervals only showed a non-significant trend towards increase (+55 ± 15 and +42 ± 21%, respectively; see Fig. 4).
Figure 4. Time course of the increase in the amplitude of motor-evoked potentials (MEP) recorded from the abductor digiti minimi (ADM) induced by a 2-h period of somatosensory stimulation (mean ±s.e.m., n = 6).
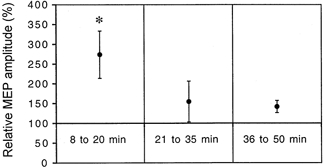
The individually normalized MEP amplitude (as a percentage of pre-intervention values: MEP peak-to-peak amplitude before intervention set to 100 %) was only significantly larger than baseline in the 8- to 20-min period following the intervention. *P < 0.05.
Site of changes in motor excitability
A 2-h period of somatosensory stimulation that resulted in increases in TMS-evoked MEP amplitudes did not change amplitudes and areas of the MEPs to BES (Fig. 5) or maximal peripheral M responses (17.9 ± 3.4 mV before and 18.2 ± 3.7 mV after stimulation, n = 10).
Figure 5. Comparison of the effects of a 2-h period of somatosensory stimulation on motor-evoked potential (MEPs) evoked by transcranial magnetic stimulation (TMS) and brainstem electrical stimulation (BES) recorded from the abductor digiti minimi (ADM).
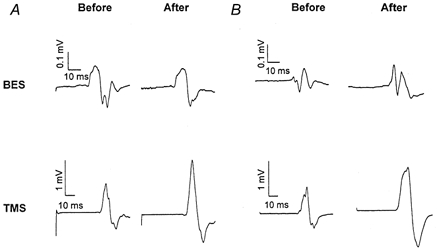
A and B, each trace represents the mean of five consecutive MEPs recorded before and after the 2-h period of somatosensory stimulation from two subjects. The increase in amplitude of TMS-evoked MEPs induced by a 2-h period of somatosensory stimulation was significant whereas the amplitude of potentials evoked by BES was not significantly changed by the intervention.
Effects of LZ and DM
Administration of a single oral dose of LZ significantly blocked the enhancing effects of a 2-h period of somatosensory stimulation on ADM MEP amplitude (ratio of ADM amplitudes before and after stimulation under LZ: 91.4 ± 12.4 %, n = 5; Fig. 6) while placebo did not modify the enhancing effect seen in the drug-naive sessions (ratio of ADM amplitudes before and after stimulation: 185.1 ± 37.8; Fig. 6; see Figs 1–3 for comparison). MEP amplitudes recorded from APB were similar under LZ before and after the 2-h period of somatosensory stimulation (ratio of APB amplitudes before and after stimulation: 97 ± 5.0 %), suggesting stability of corticomotoneuronal excitability under LZ.
Figure 6. Effects of dextromethorphan (DM) and lorazepam (LZ) on the change in amplitude induced by a 2-h period of somatosensory stimulation.
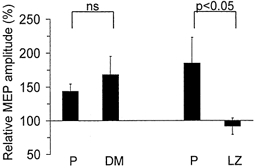
MEP amplitude changes relative to pre-intervention values (mean ±s.e.m.) in abductor digiti minimi (ADM; TMS intensity 40 % above rMT; n = 5). Note that LZ blocked the effects of SS stimulation relative to the placebo session. The effect of a 2-h period of somatosensory stimulation was not significantly different under the effects of DM than under the effects of placebo (P, on the left). In contrast, LZ significantly (P < 0.05) blocked the effects of a 2-h period of somatosensory stimulation compared with the placebo session (P, on the right).
In contrast, the enhancing effects of a 2-h period of somatosensory stimulation on ADM MEP were unchanged by DM. There was no significant difference between the DM (ratio of ADM amplitudes before and after stimulation under DM: 168.3 ± 26.8 %; Fig. 6) and the corresponding placebo session (ratio of ADM amplitudes before and after stimulation: 143.9 ± 10.8 %; Fig. 6). Because one subject, experiencing side-effects after DM, was unable to relax, electrophysiological data from only five subjects were analysed.
The amplitude of SEP components N20-P25 and P25-N33 recorded during somatosensory stimulation was similar during DM, LZ and placebo sessions, indicating a stable input into somatosensory cortical regions during each intervention (Fig. 7). Moreover, SEP amplitudes remained stable within each session: in both placebo sessions (N20-P25 early/late: 3.12 ± 0.42 mV/3.77 ± 0.36 mV; P25- N30: 3.44 ± 0.68 mV/3.58 ± 0.43 mV), DM session (N20- P25 early/late: 3.27 ± 1 mV/3.63 ± 0.8 mV.; P25-N30: 3.47 ± 1 mV/2.4 ± 0.4 mV) and LZ session (N20-P25 early/late: 2.79 ± 0.5 mV/3.39 ± 0.4 mV; P25-N30: 3.26 ± 0.8 mV/3.35 ± 0.9 mV).
Figure 7. Amplitude (in mV) of the early components (N1:N20, P1:P25, N2:N30) of somatosensory-evoked potentials (SEP) recorded during the 2-h period of somatosensory stimulation under the action of dextromethorphan (DM), lorazepam (LZ), and the corresponding placebo (P) sessions.
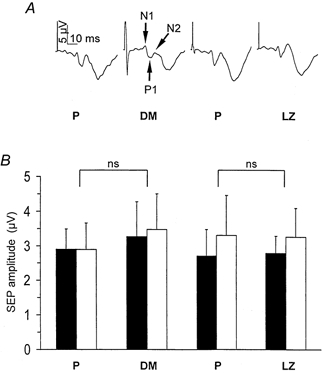
A, each trace is the mean of 300–400 trials recorded in the same representative subject during the 2-h period of somatosensory stimulation (arrows indicate the early components N1, P1, N2 used for the analysis). B, grand average across all subjects (n = 5, mean ±s.e.m.) of the N1-P1 amplitude (▪) and P1-N2 amplitude (□). Neither DM nor LZ significantly modified SEP amplitude compared with placebo.
Drowsiness was reported under LZ in all five subjects tested (three minimal, one mild, one moderate), under DM in 3/6 subjects (two minimal, one mild) and under placebo in 2/10 subjects (both minimal). Additionally, DM elicited dizziness in 3/6 subjects (one minimal, one mild, one moderate) and nausea in 2/6 subjects (one minimal, one mild).
DISCUSSION
The new findings of this study are that changes in corticomotoneuronal excitability elicited by a period of somatosensory stimulation occur at supraspinal sites and are markedly influenced by GABAergic mechanisms.
It has been proposed that administration of peripheral somatosensory stimulation is a useful adjuvant therapy to promote recovery of motor function in stroke patients (Johansson et al. 1993; Hamdy & Rothwell, 1998; Powell et al. 1999; Wong et al. 1999; Conforto et al. 2002). This idea led to studies that demonstrated and characterized changes in corticospinal excitability associated with this form of stimulation in healthy subjects (Hamdy et al. 1998; Ridding et al. 2000; Stefan et al. 2000). However, the mechanisms underlying this phenomenon are incompletely understood. To address this issue, we utilized a previously described protocol in which measures of corticomotoneuronal excitability are tested before and after a 2-h period of electrical stimulation of the ulnar nerve leading to increased MEP amplitudes (Ridding et al. 2000). Consistent with this previous report, we identified an increased MEP amplitude in response to TMS elicited by a 2-h period of somatosensory stimulation in the absence of changes in the unstimulated control condition (2 h idle time). A more detailed analysis of the input-output curves (Devanne et al. 1997), a sensitive measure of corticospinal excitability (Ridding & Rothwell, 1997; Boroojerdi et al. 2001), further substantiated this finding. The factors influencing the interindividual and intersession variability demonstrated in this study remain to be determined.
Additionally, we found no changes in rMT, aMT, ICI or ICF. While our study was powered to identify small changes in rMT and aMT, we could only expect to detect changes larger than 35 % in ICI and 115 % in ICF. Therefore, more subtle modifications in ICI and ICF as a consequence of somatosensory stimulation would not be apparent.
While MEP amplitudes from the ulnar nerve-innervated ADM increased, those recorded from the median nerve-innervated APB did not. Interestingly, MEP amplitudes from the FDI remained unaffected by ulnar nerve stimulation. Motor output and muscle afferents to and from FDI are conducted through the ulnar nerve, while cutaneous and joint afferents are carried through the median and radial nerves (see Rossini et al. 1996). Therefore, electrical stimulation of the ulnar nerve stimulated muscle afferents from the FDI. This stimulation failed to elicit significant changes in MEP amplitudes from this muscle. These findings suggest a focal somatotopic effect in which somatosensory inputs other than muscle afferents are important for mediating the corticomotoneuronal excitability changes observed in our study, an observation consistent with previous reports (Rossini et al. 1996; Rossi et al. 1998).
Site of the corticospinal excitability changes
Excitability changes mediating these results can occur at cortical and/or subcortical sites. To address this issue, we recorded MEPs in response to TMS and to BES, as well as maximal peripheral M responses before and after the 2-h stimulation period. This intervention did not modify the amplitude of maximal peripheral M responses or MEPs in response to BES, suggesting the lack of significant excitability changes at muscle, neuromuscular junction or spinal cord structures below the brainstem level, an interpretation consistent with the previously reported stability of F-waves (Ridding et al. 2000). In contrast, somatosensory stimulation resulted in substantial amplitude increase in MEPs in response to TMS. TMS stimulates predominantly corticocortical connections targeting pyramidal tract neurons (Day et al. 1989; Ridding & Rothwell, 1997; Cracco et al. 1999) whereas BES excites (eliciting only one descending volley) descending motor axons directly at the brainstem level (Ugawa et al. 1991). Taken together, these findings indicate that a sustained period of somatosensory stimulation exerts its modulatory effect on motor excitability predominantly in the motor cortex. However, we cannot exclude weaker concomitant changes in excitability at the spinal level.
The sensorimotor interactions leading to this change in motor cortical excitability could occur in different cortical and/or subcortical structures and only secondarily influence the motor cortex excitability. First, it is conceivable that the stimulation period elicited increased excitability in the somatosensory ‘ventrolateral pars oralis’ thalamic nucleus or in the primary somatosensory cortex. However, the stability of SEP amplitudes during the stimulation period argues against this hypothesis. It is also unlikely that the ‘ventrolateral pars caudalis’ thalamic nucleus which also receives somatosensory information and is linked by direct projections to the primary motor cortex, is the site for such interaction because the connections between this thalamic nucleus and the primary motor cortex are diffuse (Asanuma et al. 1980) and therefore cannot explain the focality of the effect described here. It is more plausible that the site of this interaction is the motor cortex itself which receives somatotopically organized projections from the primary somatosensory cortex in animals (Kaneko et al. 1994a, b) and humans (Terao et al. 1999) that participate in learning new motor skills (Pavlides et al. 1993). It is also possible that other structures of the motor system which receive somatotopically organized somatosensory inputs (e.g. cerebellum or premotor cortical areas) are involved in this sensorimotor interaction.
Candidate mechanisms
GABA, the main inhibitory neurotransmitter in the brain, is actively involved in experience-dependent cerebral reorganization (Zheng & Knudsen, 1999; Feldman, 2000). As an example, changes in somatosensory input elicited by nerve transection result in rapid modifications in cortical maps that are associated with reduced GABA levels (Garraghty et al. 1991; Myers et al. 2000). In the motor cortex, similarly rapid changes in motor maps are mimicked by injection of the GABA antagonist bicucculine (Jacobs & Donoghue, 1991). In humans, deafferentation-induced changes in motor cortex excitability (Ziemann et al. 1998) are also associated with decreased cortical GABA (Levy et al. 1999). Overall, it is conceivable that a modulation of cortical GABAergic neurotransmission mediates the changes described in this study. Our results demonstrated that a pharmacological manipulation that enhances GABAergic function (Macdonald & Kelly, 1995) blocked changes in corticomotoneuronal excitability elicited by somatosensory stimulation, providing support for this hypothesis. The same pharmacological approach has been successfully utilized to identify the involvement of GABAergic influences on deafferentation-induced plasticity (Ziemann et al. 1998) and use-dependent plasticity (Butefisch et al. 2000).
In contrast, our results showed that DM did not modify excitability changes elicited by a 2-h period of somatosensory stimulation. At the given doses, DM results in brain concentrations (Hollander et al. 1994; Steinberg et al. 1996) similar to those that induce NMDA receptor block in vitro (Apland & Braitman, 1990), and elicits side-effects similar to those observed in our study which are consistent with active NMDA receptor block action (Hollander et al. 1994; Steinberg et al. 1996). The lack of effect of DM observed in this study contrasts with the strong antagonistic effects of identical doses of DM on use-dependent plasticity induced by training in humans (Butefisch et al. 2000). These results suggest that long- or short-term potentiation-like mechanisms thought to be operational in the setting of use-dependent plasticity (Butefisch et al. 2000) are less involved in excitability changes elicited by somatosensory stimulation. Experiments in animal models are required to gain additional insight on this issue.
The amplitude and latency of early cortical components of SEP to ulnar nerve stimulation under the effects of LZ, did not differ from those obtained under placebo or DM, suggesting stable somatosensory input across conditions. Additionally, attentional levels across conditions were comparable, a conclusion also supported by the lack of amplitude changes in the N30 component of SEP, known to be modulated by mental activity (Cheron & Borenstein, 1992). Pre- (baseline) and post-intervention MEPs were recorded at a time when the pharmacokinetic computer simulation demonstrated stable therapeutic concentrations of LZ (see Methods). Finally, it is unlikely that the effect of LZ was mediated by nonspecific sedative effects only, since both DM and LZ produced qualitatively similar drowsiness but only LZ blocked motor excitability changes. Hence, the changes in motor cortical excitability induced by a 2-h period of somatosensory stimulation are predominantly influenced by GABAergic function, and much less affected, if at all, by NMDA receptor function. This finding is consistent with the hypothesis that a 2-h period of somatosensory stimulation may modulate GABAergic cortical function, decreasing cortical GABAergic inhibition. Such a decrease is known to facilitate plasticity in animals (Jacobs & Donoghue, 1991) and in humans (Ziemann et al. 2001) and may be a factor contributing to better functional recovery observed when physical therapy is performed in association with somatosensory stimulation after stroke (Johansson et al. 1993).
In conclusion, this study demonstrates that a sustained period of nonpainful peripheral electrical stimulation increases corticomotoneuronal excitability, most likely by acting somatotopically in the motor cortex, and is significantly influenced by GABAergic function.
Acknowledgments
This work was supported by a grant from the National Center for Complementary and Alternative Medicine, National Institutes of Health, USA. Alain Kaelin-Lang was partially supported by a grant from the Swiss Parkinson Foundation. Andreas Luft was supported by a fellowship grant from ‘Deutsche Forschungsgemeinschaft’ (Lu748/2). We wish to thank Aqeel Yassen for his help during some of the experiments, and Devera Schoenberg for skilful editing.
REFERENCES
- Allison T, McCarthy G, Wood CC, Jones SJ. Potentials evoked in human and monkey cerebral cortex by stimulation of the median nerve. A review of scalp and intracranial recordings. Brain. 1991;114:2465–2503. doi: 10.1093/brain/114.6.2465. [DOI] [PubMed] [Google Scholar]
- Apland JP, Braitman DJ. Effects of non-opioid antitussives on epileptiform activity and NMDA responses in hippocampal and olfactory cortex slices. Brain Research. 1990;529:277–285. doi: 10.1016/0006-8993(90)90838-3. [DOI] [PubMed] [Google Scholar]
- Asanuma H, Larsen K, Yumiya H. Peripheral input pathways to the monkey motor cortex. Experimental Brain Research. 1980;38:349–355. doi: 10.1007/BF00236655. [DOI] [PubMed] [Google Scholar]
- Aschersleben G, Gehrke J, Prinz W. Tapping with peripheral nerve block. a role for tactile feedback in the timing of movements. Experimental Brain Research. 2001;136:331–339. doi: 10.1007/s002210000562. [DOI] [PubMed] [Google Scholar]
- Bastian HC. The ‘muscular sense’; its nature and cortical localisation. Brain. 1887;10:1–137. [Google Scholar]
- Boroojerdi B, Battaglia F, Muellbacher W, Cohen LG. Mechanisms influencing stimulus-response properties of the human corticospinal system. Clinical Neurophysiology. 2001;112:931–937. doi: 10.1016/s1388-2457(01)00523-5. [DOI] [PubMed] [Google Scholar]
- Brasil-Neto JP, Cohen LG, Panizza M, Nilsson J, Roth BJ, Hallett M. Optimal focal transcranial magnetic activation of the human motor cortex: effects of coil orientation, shape of the induced current pulse, and stimulus intensity. Journal of Clinical Neurophysiology. 1992;9:132–136. [PubMed] [Google Scholar]
- Butefisch CM, Davis BC, Wise SP, Sawaki L, Kopylev L, Classen J, Cohen LG. Mechanisms of use-dependent plasticity in the human motor cortex. Proceedings of the National Academy of Sciences of the USA. 2000;97:3661–3665. doi: 10.1073/pnas.050350297. [DOI] [PMC free article] [PubMed] [Google Scholar]
- Capaday C, Lavoie BA, Barbeau H, Schneider C, Bonnard M. Studies on the corticospinal control of human walking. I. Responses to focal transcranial magnetic stimulation of the motor cortex. Journal of Neurophysiology. 1999;81:129–139. doi: 10.1152/jn.1999.81.1.129. [DOI] [PubMed] [Google Scholar]
- Cheron G, Borenstein S. Mental movement simulation affects the N30 frontal component of the somatosensory evoked potential. Electroencephalography and Clinical Neurophysiology. 1992;84:288–292. doi: 10.1016/0168-5597(92)90010-9. [DOI] [PubMed] [Google Scholar]
- Cheron G, Dan B, Borenstein S. Sensory and motor interfering influences on somatosensory evoked potentials. Journal of Clinical Neurophysiology. 2000;17:280–294. doi: 10.1097/00004691-200005000-00006. [DOI] [PubMed] [Google Scholar]
- Conforto AB, Kaelin-Lang A, Cohen LG. Increase in hand muscle strength of stroke patients after somatosensory stimulation. Annals of Neurology. 2002;51:122–125. doi: 10.1002/ana.10070. [DOI] [PubMed] [Google Scholar]
- Cracco RQ, Cracco JB, Maccabee PJ, Amassian VE. Cerebral function revealed by transcranial magnetic stimulation. Journal of Neuroscience Methods. 1999;86:209–219. doi: 10.1016/s0165-0270(98)00167-8. [DOI] [PubMed] [Google Scholar]
- Day BL, Dressler D, Maertens de Noordhout A, Marsden CD, Nakashima K, Rothwell JC, Thompson PD. Electric and magnetic stimulation of human motor cortex: surface EMG and single motor unit responses. Journal of Physiology. 1989;412:449–473. doi: 10.1113/jphysiol.1989.sp017626. [DOI] [PMC free article] [PubMed] [Google Scholar]
- Devanne H, Lavoie BA, Capaday C. Input-output properties and gain changes in the human corticospinal pathway. Experimental Brain Research. 1997;114:329–338. doi: 10.1007/pl00005641. [DOI] [PubMed] [Google Scholar]
- Edin BB, Johansson N. Skin strain patterns provide kinaesthetic information to the human central nervous system. Journal of Physiology. 1995;487:243–251. doi: 10.1113/jphysiol.1995.sp020875. [DOI] [PMC free article] [PubMed] [Google Scholar]
- Feldman DE. Inhibition and plasticity (news) Nature Neuroscience. 2000;3:303–304. doi: 10.1038/73849. [DOI] [PubMed] [Google Scholar]
- Garraghty PE, Lachica EA, Kaas JH. Injury-induced reorganization of somatosensory cortex is accompanied by reductions in GABA staining. Somatosensory and Motor Research. 1991;8:347–354. doi: 10.3109/08990229109144757. [DOI] [PubMed] [Google Scholar]
- Gordon J, Ghilardi MF, Ghez C. Impairments of reaching movements in patients without proprioception. I. Spatial errors. Journal of Neurophysiology. 1995;73:347–360. doi: 10.1152/jn.1995.73.1.347. [DOI] [PubMed] [Google Scholar]
- Greenblatt DJ, Ehrenberg BL, Gunderman J, Scavone J M N T, Tai Harmatz JS, Shadea RI. Kinetic and dynamic study of intravenous lorazepam: comparison with intravenous diazepam. Journal of Pharmacology and Experimental Therapeutics. 1989;250:134–140. [PubMed] [Google Scholar]
- Greenblatt DJ, Scavone JM, Harmatz JS, Engelhardt N, Shader RI. Cognitive effects of beta-adrenergic antagonists after single doses: pharmacokinetics and pharmacodynamics of propranolol, atenolol, lorazepam, and placebo. Clinical Pharmacology and Therapeutics. 1993;53:577–584. doi: 10.1038/clpt.1993.73. [DOI] [PubMed] [Google Scholar]
- Gupta SK, Ellinwood EH, Nikaido AM, Heatherly DG. Simultaneous modeling of the pharmacokinetic and pharmacodynamic properties of benzodiazepines. I: Lorazepam. Journal of Pharmacokinetics and Biopharmaceutics. 1990;18:89–102. doi: 10.1007/BF01063553. [DOI] [PubMed] [Google Scholar]
- Hamdy S, Rothwell JC. Gut feelings about recovery after stroke: the organization and reorganization of human swallowing motor cortex. Trends in Neurosciences. 1998;21:278–282. doi: 10.1016/s0166-2236(97)01212-5. [DOI] [PubMed] [Google Scholar]
- Hamdy S, Rothwell JC, Aziz Q, Singh KD, Thompson DG. Long-term reorganization of human motor cortex driven by short-term sensory stimulation. Nature Neuroscience. 1998;1:64–68. doi: 10.1038/264. [DOI] [PubMed] [Google Scholar]
- Hollander D, Pradas J, Kaplan R, McLeod HL, Evans WE, Munsat TL. High-dose dextromethorphan in amyotrophic lateral sclerosis: phase I safety and pharmacokinetic studies. Annals of Neurology. 1994;36:920–924. doi: 10.1002/ana.410360619. [DOI] [PubMed] [Google Scholar]
- Jacobs KM, Donoghue JP. Reshaping the cortical motor map by unmasking latent intracortical connections. Science. 1991;251:944–947. doi: 10.1126/science.2000496. [DOI] [PubMed] [Google Scholar]
- Johansson K, Lindgrensur I, Widner H, Wiklund I, Johansson BB. Can sensory stimulation improve the functional outcome in stroke patients? Neurology. 1993;43:2189–2192. doi: 10.1212/wnl.43.11.2189. [DOI] [PubMed] [Google Scholar]
- Kaelin-Lang A, Cohen LG. Enhancing the quality ofstudies using transcranial magnetic and electrical stimulation witha new computer-controlled system. Journal of NeuroscienceMethods. 2000;102:81–89. doi: 10.1016/s0165-0270(00)00284-3. [DOI] [PubMed] [Google Scholar]
- Kaneko T, Caria MA, Asanuma H. Information processing within the motor cortex. I. Responses of morphologically identified motor cortical cells to stimulation of the somatosensory cortex. Journal of Comparative Neurology. 1994a;345:161–171. doi: 10.1002/cne.903450202. [DOI] [PubMed] [Google Scholar]
- Kaneko T, Caria MA, Asanuma H. Information processing within the motor cortex. II. Intracortical connections between neurons receiving somatosensory cortical input and motor output neurons of the cortex. Journal of Comparative Neurology. 1994b;345:172–184. doi: 10.1002/cne.903450203. [DOI] [PubMed] [Google Scholar]
- Kujirai T, Caramia MD, Rothwell JC, Day BL, Thompson PD, Ferbert A. Corticocortical inhibition in human motor cortex. Journal of Physiology. 1993;471:501–519. doi: 10.1113/jphysiol.1993.sp019912. [DOI] [PMC free article] [PubMed] [Google Scholar]
- Levy LM, Ziemann U, Chen R, Cohen LG. Rapid modulation of GABA in human cortical plasticity demonstrated by magnetic resonance spectroscopy (abstract) Neurology. 1999;52:A88. [Google Scholar]
- Macdonald RL, Kelly KM. Antiepileptic drug mechanisms of action. Epilepsia. 1995;36:S2–S12. doi: 10.1111/j.1528-1157.1995.tb05996.x. [DOI] [PubMed] [Google Scholar]
- Mills KR, Boniface SJ, Schubert M. Magnetic brain stimulation with a double coil: the importance of coil orientation. Electroencephalography and Clinical Neurophysiology. 1992;85:17–21. doi: 10.1016/0168-5597(92)90096-t. [DOI] [PubMed] [Google Scholar]
- Motulsky HJ, Ransnas LA. Fitting curves to data using nonlinear regression: a practical and nonmathematical review. FASEB Journal. 1987;1:365–374. [PubMed] [Google Scholar]
- Myers WA, Churchill JD, Muja N, Garraghty PE. Role of NMDA receptors in adult primate cortical somatosensory plasticity. Journal of Comparative Neurology. 2000;418:373–382. [PubMed] [Google Scholar]
- Oldfield RC. The assessment and analysis of handedness: the Edinburgh inventory. Neuropsychologia. 1971;9:97–113. doi: 10.1016/0028-3932(71)90067-4. [DOI] [PubMed] [Google Scholar]
- Panizza M, Nilsson J, Roth BJ, Basser PJ, Hallett M. Relevance of stimulus duration for activation of motor and sensory fibers: implications for the study of H-reflexes and magnetic stimulation. Electroencephalography and Clinical Neurophysiology. 1992;85:22–29. doi: 10.1016/0168-5597(92)90097-u. [DOI] [PubMed] [Google Scholar]
- Pavlides C, Miyashita E, Asanuma H. Projection from the sensory to the motor cortex is important in learning motor skills in the monkey. Journal of Neurophysiology. 1993;70:733–741. doi: 10.1152/jn.1993.70.2.733. [DOI] [PubMed] [Google Scholar]
- Pearson K. Motor systems. Current Opinion in Neurobiology. 2000;10:649–654. doi: 10.1016/s0959-4388(00)00130-6. [DOI] [PubMed] [Google Scholar]
- Powell J, Pandyan AD, Granat M, Cameron M, Stott DJ. Electrical stimulation of wrist extensors in poststroke hemiplegia. Stroke. 1999;30:1384–1389. doi: 10.1161/01.str.30.7.1384. [DOI] [PubMed] [Google Scholar]
- Reding MJ, Potes E. Rehabilitation outcome following initial unilateral hemispheric stroke. Life table analysis approach. Stroke. 1988;19:1354–1358. doi: 10.1161/01.str.19.11.1354. [DOI] [PubMed] [Google Scholar]
- Ridding MC, Brouwer B, Miles TS, Pitcher JB, Thompson PD. Changes in muscle responses to stimulation of the motor cortex induced by peripheral nerve stimulation in human subjects. Experimental Brain Research. 2000;131:135–143. doi: 10.1007/s002219900269. [DOI] [PubMed] [Google Scholar]
- Ridding MC, Rothwell JC. Stimulus/response curves as a method of measuring motor cortical excitability in man. Electroencephalography and Clinical Neurophysiology. 1997;105:340–344. doi: 10.1016/s0924-980x(97)00041-6. [DOI] [PubMed] [Google Scholar]
- Rosler KM, Etter C, Truffert A, Hess CW, Magistris MR. Rapid cortical motor output map changes assessed by the triple stimulation technique. NeuroReport. 1999;10:579–583. doi: 10.1097/00001756-199902250-00025. [DOI] [PubMed] [Google Scholar]
- Rossi S, Pasqualetti P, Tecchio F, Sabato A, Rossini PM. Modulation of corticospinal output to human hand muscles following deprivation of sensory feedback. NeuroImage. 1998;8:163–175. doi: 10.1006/nimg.1998.0352. [DOI] [PubMed] [Google Scholar]
- Rossini PM, Barker AT, Berardelli A, Caramia MD, Caruso G, Cracco RQ, Dimitrijevic MR, Hollett M, Kotayomo Y, Lucking CH. Non-invasive electrical and magnetic stimulation of the brain, spinal cord and roots: basic principles and procedures for routine clinical application. Report of an IFCN committee. Electroencephalography and Clinical Neurophysiology. 1994;91:79–92. doi: 10.1016/0013-4694(94)90029-9. [DOI] [PubMed] [Google Scholar]
- Rossini PM, Rossi S, Pasqualetti P, Tecchio F. Corticospinal excitability modulation to hand muscles during movement imagery. Cerebral Cortex. 1999;9:161–167. doi: 10.1093/cercor/9.2.161. [DOI] [PubMed] [Google Scholar]
- Rossini PM, Rossi S, Tecchio F, Pasqualetti P, Finazzi-Agro A, Sabato A. Focal brain stimulation in healthy humans: motor maps changes following partial hand sensory deprivation. Neuroscience Letters. 1996;214:191–195. doi: 10.1016/0304-3940(96)12940-2. [DOI] [PubMed] [Google Scholar]
- Rothwell JC, Traub MM, Day BL, Obeso JA, Thomas PK, Marsden CD. Manual motor performance in a deafferented man. Brain. 1982;105:515–542. doi: 10.1093/brain/105.3.515. [DOI] [PubMed] [Google Scholar]
- Stefan K, Kunesch E, Cohen LG, Benecke R, Classen J. Induction of plasticity in the human motor cortex by paired associative stimulation. Brain. 2000;123:572–584. doi: 10.1093/brain/123.3.572. [DOI] [PubMed] [Google Scholar]
- Steinberg GK, Bell TE, Yenari MA. Dose escalation safety and tolerance study of the N-methyl-D-aspartate antagonist dextromethorphan in neurosurgery patients. Journal of Neurosurgery. 1996;84:860–866. doi: 10.3171/jns.1996.84.5.0860. [DOI] [PubMed] [Google Scholar]
- Terao Y, Ugawa Y, Hanajima R, Furubayashi T, Machii K, Enomoto H, Shiio Y, Mochizuki H, Uesugi H, Kanazawa I. Air-puff-induced facilitation of motor cortical excitability studied in patients with discrete brain lesions. Brain. 1999;122:2259–2277. doi: 10.1093/brain/122.12.2259. [DOI] [PubMed] [Google Scholar]
- Ugawa Y, Rothwell JC, Day BL, Thompson PD, Marsden CD. Percutaneous electrical stimulation of corticospinal pathways at the level of the pyramidal decussation in humans. Annals of Neurology. 1991;29:418–427. doi: 10.1002/ana.410290413. [DOI] [PubMed] [Google Scholar]
- Wong AM, Su TY, Tang FT, Cheng PT, Liaw MY. Clinical trial of electrical acupuncture on hemiplegic stroke patients. American Journal of Physical Medicine and Rehabilitation. 1999;78:117–122. doi: 10.1097/00002060-199903000-00006. [DOI] [PubMed] [Google Scholar]
- Zheng W, Knudsen EI. Functional selection of adaptive auditory space map by GABAA-mediated inhibition. Science. 1999;284:962–965. doi: 10.1126/science.284.5416.962. [DOI] [PubMed] [Google Scholar]
- Ziemann U, Hallett M, Cohen L. Mechanisms of deafferentation-induced plasticity in human motor cortex. Journal of Neuroscience. 1998;18:7000–7007. doi: 10.1523/JNEUROSCI.18-17-07000.1998. [DOI] [PMC free article] [PubMed] [Google Scholar]
- Ziemann U, Muellbacher W, Hallett M, Cohen LG. Modulation of practice-dependent plasticity in human motor cortex. Brain. 2001;124:1171–1181. doi: 10.1093/brain/124.6.1171. [DOI] [PubMed] [Google Scholar]
- Ziemann U, Rothwell JC, Ridding MC. Interaction between intracortical inhibition and facilitation in human motor cortex. Journal of Physiology. 1996;496:873–881. doi: 10.1113/jphysiol.1996.sp021734. [DOI] [PMC free article] [PubMed] [Google Scholar]