

Abstract
The deafness (dn/dn) mutant mouse provides a valuable model of human congenital deafness. We investigated the properties of synaptic transmission in the anteroventral cochlear nucleus (AVCN) of normal and congenitally deaf dn/dn mice. Excitatory postsynaptic currents (EPSCs) were evoked by focal stimulation of single auditory nerve fibres, and measured by whole-cell recordings from neurones in AVCN slices (mean postnatal age = P13). Absolute amplitudes of both AMPA- and NMDA-mediated components of evoked EPSCs were greater (170 %) in deaf versus control animals. Enhanced transmission in deaf mice was due to a presynaptic mechanism. Variance-mean analysis revealed that the probability of transmitter release was significantly greater in deaf (Pr = 0.8) versus control animals (Pr = 0.5). Following high frequency stimulation, deaf mice showed a greater depression of evoked EPSCs, and a significant increase in the frequency of delayed-release (asynchronous) miniature EPSCs (aEPSCs) (deaf 100 Hz vs. control 7 Hz). The acetoxymethyl ester of EGTA (EGTA-AM) blocked the increase in miniature aEPSCs and returned tetanic depression to control values. In deaf mice, reduction of mean Pr using cadmium caused an expected increase in paired-pulse ratio (PPR). However, in the same cells, a similar reduction in release by EGTA-AM did not result in a change in PPR, demonstrating that a change may occur in Pr without a concomitant change in PPR. In many respects, transmission in deaf mice was found to be remarkably similar to control mice, implying that many parameters of synaptic transmission develop normally in these animals. The two significant differences (higher Pr and asynchronous release in deaf mice) could both be reversed by the addition of EGTA-AM, suggesting that endogenous calcium buffering may be impaired or undeveloped in the presynaptic terminals of the auditory nerve in deaf mice.
Many forms of hearing impairment are the result of abnormal development of the inner and outer hair cells of the cochlea, while the central auditory nerve connections remain intact (Keats & Berlin, 1999). Impulses generated in the auditory nerve (either naturally or artificially) propagate to the brainstem cochlear nucleus, where the auditory nerve branches and makes direct excitatory synaptic connections with different neuronal cell types (Brawer et al. 1974). An important question is whether central synaptic connections develop normally in congenital deafness, in the absence of auditory nerve activity. Mouse models of human hereditary deafness offer an opportunity to study this question at the detailed synaptic and molecular levels.
In the present study, we have examined synaptic transmission in the anteroventral cochlear nucleus (AVCN) of the deafness (dn/dn) mutant mouse, which has been widely used as a model of hereditary cochlear deafness, uncomplicated by other abnormalities (Bock et al. 1982; Keats & Berlin, 1999). Previous studies of deafness mice have shown these animals to be profoundly deaf from birth (Steel & Bock, 1980), with no evidence for spontaneous auditory nerve activity (Durham et al. 1989). Spontaneous firing of auditory nerves in normal animals occurs even in the absence of sound, and is driven by hair cell-spiral ganglion synapses. Central auditory pathways are functional in deafness mice and extracellular field potentials can be recorded in the inferior colliculus following electrical stimulation of the auditory nerve (Bock et al. 1982). Interestingly, these extracellular field potentials are larger in deafness mice than in controls, despite degeneration of auditory nerve fibres in the deaf mice (Bock et al. 1982).
We have used an in vitro slice preparation of the AVCN to record excitatory postsynaptic currents (EPSCs) generated by stimulation of single auditory nerves in AVCN neurons (Isaacson & Walmsley, 1995a, b; Bellingham et al. 1998; Oleskevich & Walmsley, 2000). Our experiments reveal many similarities and several significant differences in the properties of transmission in deaf and normal mice at a critical developmental period immediately following ear canal opening (11–16 days postnatal).
METHODS
Deafness (dn/dn) mutant mice were obtained from the MRC Institute of Hearing Research, Nottingham, UK. These mice had been recently crossed with CBA mice (to improve breeding), and subsequently bred to obtain homozygous dn/dn mice with a CBA background. CBA mice were used as wild-type normal mice in the present experiments.
Electrophysiology
Parasaggital slices (150 μm) were made of the anterior ventral cochlear nucleus (AVCN) of 11- to 16-day-old deafness mutant mice (dn/dn) and control CBA mice, following decapitation without anaesthetic in accordance with local guidelines (Isaacson & Walmsley, 1995a, b). This age range represents a time period immediately after the time of ear canal opening in both dn/dn and CBA mice (at approximately 11 days postnatal). The mean age of dn/dn mice was the same as the CBA controls (13 days). Whole-cell patch electrode recordings were performed at room temperature (22–25 °C) from AVCN neurons visualized in thin slices using infra-red differential interference contrast (DIC) optics. Slices were superfused with an artificial cerebro-spinal fluid (ACSF) containing (mm): 130 NaCl, 3.0 KCl, 1.3 Mg2SO4, 2.0 CaCl2, 1.25 NaH2PO4, 26.2 NaHCO3, 10 glucose, equilibrated with 95 % O2-5 % CO2. Patch electrodes (3–6 MΩ resistance) contained (mm): 120 CsCl, 4 NaCl, 4 MgCl2, 0.001 CaCl2, 10 Hepes, 2 Mg-ATP, 0.2 GTP-Tris, and 10 EGTA (pH 7.3; 300 mosmol kg−1). Series resistance, which was < 10 MΩ, was compensated by > 80 %.
Postsynaptic currents were evoked by focal stimulation of branches of the auditory nerve (0.1 ms; 20–90 V; 0.2 Hz), delivered via a glass microelectrode (5–10 μm tip) filled with ACSF. Trains of stimuli consisted of 15 pulses at 100 Hz, 30 s apart. The evoked currents were identified as single-fibre synaptic currents by their all-or-none response to graded stimulation intensities, and fast kinetics at a membrane potential of −60 mV (Isaacson & Walmsley, 1995a; Oleskevich et al. 2000). AVCN neurons did not exhibit slow mEPSCs (at −60 mV), as recorded in some types of neurons in other regions of the cochlear nucleus (Gardner et al. 1999). A wide range of mean amplitudes of single fibre evoked EPSCs was found for both dn/dn and control mice. Although the largest EPSCs are most likely to be generated by endbulb-bushy cell connections, it is possible that some of the cells were stellate cells with similar EPSC properties to bushy cells in the mouse AVCN (Gardner et al. 1999). (Endbulb connections are made with the soma of two types of bushy cells in the AVCN, with spherical bushy cells receiving the largest contacts, and globular bushy cells receiving smaller ‘modified’ endbulb contacts; Lenn & Reese, 1966; Cant & Morest, 1979; Ryugo & Fekete, 1982; Liberman, 1991; Ryugo & Sento, 1991; Redd et al. 2000.) The evoked currents remained stable for stimulation intensities two times the threshold. Stimulation intensity was set at 1.5 times threshold for all experiments. The synaptic currents were recorded and filtered at 10 kHz with an Axopatch 200B amplifier (Axon Instruments, Union City, CA, USA) before being digitized at 20 kHz. Mean peak amplitudes were measured as the mean of 30–150 single evoked responses. Excess variance in the amplitude of the synaptic currents was minimized by using a caesium chloride-based internal solution to block potassium conductances, and by adding QX-314 intracellularly to block sodium channels.
Spontaneous miniature excitatory postsynaptic currents (mEPSCs) were analysed off-line using a semi-automated detection procedure. The detection procedure uses a sliding template which detects all spontaneous events with amplitudes greater than 2.5 standard deviations of the background noise (Clements & Bekkers, 1997). Spontaneous events recorded in the absence of TTX were indistinguishable from miniature EPSCs recorded with TTX in terms of mean amplitude, frequency, rise time, half-width and, skewness and coefficient of variation of the event distribution (n = 6). Data acquisition and analysis was performed using Axograph 4.0 (Axon Instruments).
Bicuculline methochloride (10 μm; Tocris Cookson, Ellisville, MO, USA), (+)-2-amino-5-phosphonopentanoic acid (D-AP5; 30 μm; Tocris), tetrodotoxin (TTX, 1 μm; Alomone Labs, Jerusalem, Israel), tetra-acetoxymethyl ester (30 μm; EGTA-AM; Molecular Probes, Eugene, OR, USA), strychnine hydrochloride (1 μm; Sigma), ω-conotoxin GVIA (1 μm) and ω-agatoxin IVA (200 nm) were added, as indicated, to the Ringer solution and applied by bath perfusion. Measurements were made when drug activity reached steady state (5–15 min). Lidocaine N-ethyl bromide (QX-314; 2 mm RBI) was added to the patch electrode solution. Results are expressed as means ± standard error of the mean (s.e.m.) and statistical tests of significance were determined with parametric (Student's t test, factorial ANOVA with Fischer's PLSD post hoc test) and non-parametric tests (Kendall rank correlation).
Variance-mean analysis
The variance-mean technique was used to estimate three parameters of synaptic function: the average amplitude of the postsynaptic response to a vesicle of transmitter (Qav); the average probability of vesicle release from a release site (Pr); and the number of independent release sites (N). These three parameters can be estimated from the relationship between the variance and the mean of the synaptic amplitudes recorded under different release probability conditions (Reid & Clements, 1999; Clements & Silver, 2000). Pr was modulated by increasing or decreasing the extracellular calcium concentration (0.2–3 mm). The extracellular magnesium concentration was adjusted accordingly to maintain a consistent divalent cation ratio. The mean EPSC amplitude and variance were calculated over a stable epoch of 30–150 events after wash-in of each extracellular solution. Regular presynaptic stimulation continued during wash-in. After solution exchange was complete, the EPSC amplitude remained stable throughout the subsequent analysis epoch. The variance attributable to recording noise was estimated in the region prior to the test pulse, and was subtracted from the EPSC variance. A zero point was included in each variance-mean plot to indicate that the noise variance was subtracted. In approximately 15 % of epochs, the synaptic response decreased during the recording period, and the variance was calculated after subtracting a fitted regression line. This rundown adjustment was more likely to be required under conditions where Pr was high. If the decrease was > 25 %, the data was not used. The validity of the rundown correction procedure was previously tested (Oleskevich et al. 2000). Due to the asynchrony of release, the contribution of individual quanta to the peak amplitude of the evoked EPSC will be less than expected (Isaacson & Walmsley, 1995b; Bellingham et al. 1998), leading to an underestimate of mean quantal size. At the endbulb-bushy cell connection, this factor may be considerable, due to the fast kinetics of the AMPA receptor channels (Isaacson & Walmsley, 1995b; Bellingham et al. 1998). In order to compare the miniature EPSC amplitudes with quantal amplitude obtained from the variance-mean analysis, a correction factor has been calculated and applied to the quantal size from the variance-mean analysis, obtained directly from the peak amplitude to charge ratios of the evoked and miniature EPSCs (Isaacson & Walmsley, 1995b; Bellingham et al. 1998).
RESULTS
Single fibre synaptic transmission is enhanced in the AVCN of deaf mice
Whole cell patch recordings were made from 57 neurons in thin slices of mouse AVCN (average postnatal age P13 days). Following focal stimulation of single auditory nerve fibres, glutamatergic AMPA and NMDA excitatory post synaptic currents (EPSCs) were evoked at +50 mV in physiological calcium and magnesium conditions (Ca2+ 2 mm, Mg2+ 1 mm), and isolated by addition of strychnine and bicuculline to block glycinergic and GABAergic responses, respectively (Fig. 1A). Mean evoked EPSC (eEPSC) amplitudes were substantially greater for deaf versus control mice. At a membrane potential of +50 mV, the mean amplitude of the AMPA eEPSC was significantly greater (170 %) in deaf (2.92 ± 0.89 nA; n = 9) versus control animals (1.09 ± 0.26 nA; n = 12; P < 0.01; Fig. 1B). The mean amplitude of the NMDA eEPSC was also significantly greater (160 %) in deaf (0.46 ± 0.16 nA) versus control animals (0.17 ± 0.05 nA; P < 0.05; Fig. 1C). At a membrane potential of −60 mV, the AMPA eEPSCs observed for a larger sample of cells, were significantly greater (110 %) in deaf (5.89 ± 0.95 nA; n = 16) versus control animals (2.82 ± 0.63 nA; n = 14; P < 0.01). The ratio of the amplitude of the NMDA versus AMPA eEPSC was similar in deaf (15 ± 3 %; n = 9) and control animals (14 ± 2 %; n = 12).
Figure 1. Presynaptic locus for enhanced neurotransmission in the cochlear nucleus of congenitally deaf mice.
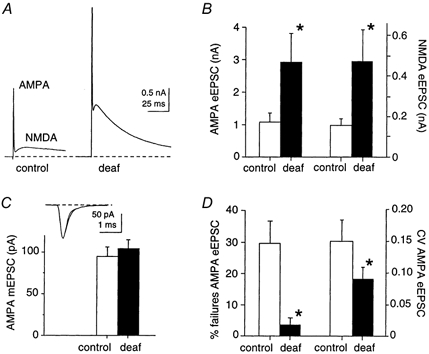
A, auditory nerve stimulation at +50 mV results in an evoked excitatory postsynaptic current (eEPSC) with a fast AMPA receptor-mediated response followed by a slower NMDA receptor-mediated response. Both AMPA and NMDA responses at P13 are significantly greater in deafness mutant mice compared to control animals. B, summary data showing that the mean amplitude of the AMPA eEPSC in deaf mice (filled bar) is significantly greater (170 %) than in control mice (open bar; P < 0.01). The mean amplitude of the NMDA eEPSC is also significantly greater in deaf versus control animals (160 %; P < 0.05). C, the mean amplitude of miniature EPSCs (mEPSCs) was unchanged between control and deafness mutant animals. Inset shows overlaid individual mEPSCs representing the two data groups. D, failure rate in low calcium (0.5 mm) and the coefficient of variation (CV = s.d./mean) of the eEPSC are significantly decreased in deaf mice (P < 0.05).
The decay times of the AMPA and NMDA eEPSCs were measured in deaf and control animals. The AMPA eEPSC decay times were similar between deaf (0.5 ± 0.06 ms; n = 7) and control mice (0.5 ± 0.04 ms; n = 7) as were the NMDA eEPSC decay times for deaf (57 ± 5 ms; n = 7) and control mice (54 ± 11 ms; n = 6).
Presynaptic mechanism underlies enhanced transmission
Several independent lines of evidence suggest a presynaptic difference in evoked transmission between deaf and control mice (Fig. 1C and D). Firstly, there is no difference between deaf and control mice in the amplitudes of spontaneous miniature (quantal) excitatory postsynaptic currents (mEPSCs) measured at −60 mV, in the presence of tetrodotoxin (TTX, 1 μm) to block presynaptic nerve impulses (Fig. 1C). The mean amplitude of AMPA mEPSCs was not significantly different in deaf (104 ± 10 pA; n = 14) and control (95 ± 10 pA; n = 14) animals. The mEPSC decay time constant and the coefficient of variation and skewness of the AMPA mEPSC distribution were similar in deaf and control animals (data not shown). The similarity in mEPSCs indicates that there is not a postsynaptic difference in the synaptic current generated by the release of a quantum of neurotransmitter.
Secondly, under low extracellular calcium concentration (0.5 mm), where it is possible to observe and directly count failures of evoked EPSCs, the percentage of failures of the AMPA-mediated eEPSC was significantly less in deaf animals (4 ± 2 %; n = 6) than in control animals (20 ± 7 %; n = 6; P < 0.05; Fig. 1D).
Thirdly, the coefficient of variation (CV = s.d./mean) of the AMPA and NMDA component of the eEPSC was significantly smaller in the deaf versus control animals. The CV of the AMPA component was 0.1 ± 0.02 in deaf mice (n = 7) and 0.2 ± 0.03 in control mice (n = 5; P < 0.05; Fig. 1D), while the CV of the NMDA component was 0.1 ± 0.02 in deaf mice (n = 7) and 0.2 ± 0.04 (n = 5; P < 0.05) in control animals (data not shown). Together, these three lines of evidence suggest that a presynaptic difference in transmitter release best explains the enhanced neurotransmission in deafness mutant mice.
Probability of transmitter release is greater in deaf mice
Variance-mean analysis was used to investigate the presynaptic mechanism underlying the increase in evoked EPSC amplitude in deaf mice (Fig. 2). This analysis can estimate the average quantal release probability at a release site (Pr), the number of independent release sites (N), and the average amplitude of the postsynaptic response to the transmitter contents of a vesicle (quantal amplitude, Qav), from the relationship of the variance and mean amplitude of the AMPA eEPSC recorded under different release probability conditions (see Methods). These conditions were achieved by varying the extracellular calcium concentration (Fig. 2A–B). Variance-mean plots were fitted with a simple parabola and the fitted function was used to estimate Pr, Qav and N in deaf and control animals. The variance-mean plot for an individual control mouse yielded a Pr of 0.3, a Qav of 70 pA and an N of 170 (Fig. 2A). The deaf mouse in Fig. 2B showed a Pr of 0.8, a Qav of 45 pA and an N of 100. Overall, the mean release probability Pr was 60 % greater in deafness mutant mice (0.8 ± 0.1; n = 6) than in control animals (0.5 ± 0.1; n = 5; P < 0.05) at physiological calcium concentrations (Fig. 2C). For the same population of cells, the mean eEPSC amplitude was 70 % greater in deaf (4.0 ± 0.9 nA) versus control mice (2.3 ± 0.7 nA). No significant difference was detected between the mean Qav (corrected for release asynchrony: see Methods) in control (105 ± 13 pA) and deaf mice (103 ± 13 pA; Fig. 2D), consistent with the mean amplitude measures of mEPSCs (Fig. 1D). The value of N (which possibly represents the number of active release sites) was not significantly different between control (91 ± 24) and deaf animals (97 ± 13; Fig. 2D).
Figure 2. Probability of neurotransmitter release is greater in deafness mutant mice.
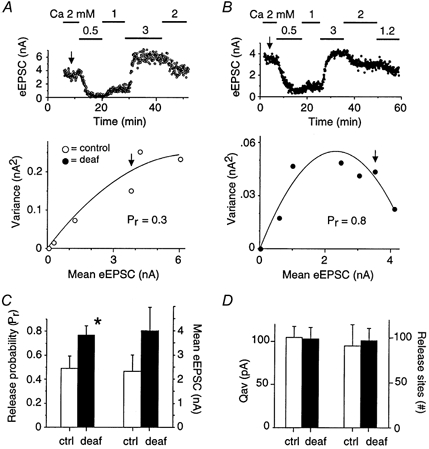
A-B, variance-mean analysis was used to estimate quantal parameters in control (A) and deafness mutant animals (B). The mean amplitude of the eEPSC was measured at −60 mV under different extracellular calcium (Ca) concentrations (top panel) and plotted against the variance (bottom panel). Arrows show the location for measurements in physiological calcium (2 mm). The variance-mean relationship was fitted with a simple parabola to estimate release probability (Pr), quantal amplitude (Qav) and the number of release sites (N). C, summary data showing that release probability is significantly greater in deafness mutant animals (Pr = 0.8; filled bar) than control animals (Pr = 0.5; P < 0.05; open bar). This 60 % increase in release probability is similar to a 70 % increase in mean eEPSC amplitude in the same population of deaf and control animals. D, the quantal amplitude and number of release sites was not different between control and deaf animals.
Both N and P/Q calcium channel subtypes contribute to release in the AVCN of deaf and normal mice
A greater release probability could result from presynaptic differences in calcium entry, calcium buffering or accumulation, and/or calcium sensitivity of the release machinery. There may also be differences in the readily releasable or reserve pool of vesicles, or an intrinsic difference in the molecular mechanisms underlying release. Previous studies in the auditory nucleus medial nucleus trapezoid body have shown there are developmental changes in the role of N-type and P/Q-type calcium channels (Iwasaki & Takahashi, 1998). The types of calcium channels responsible for evoked release were examined in deaf and control mice (Fig. 3A). The N-type calcium channel blocker ω-conotoxin GVIA (1 μm) reduced the eEPSC to 75 % in deaf mice (n = 6) and 62 % in control mice (n = 5). The P/Q-type calcium channel blocker ω-agatoxin IVA (200 nm) reduced the eEPSC to 15 % in deaf mice (n = 6) and 17 % in control mice (n = 4). These results show that there is no significant difference in the relative efficacy of N-type and P/Q-type channels in deaf versus control mice at this age, and that evoked release is more dependent on P/Q-type channels than N-type in both deaf and control mice. The effects of the toxins on asynchronous release following trains of stimuli was also similar for both deaf and control mice (see also Chuhma et al. 2001). Conotoxin reduced aEPSC frequency to 47 % in deaf mice (n = 5) and to 44 % in control mice (n = 6) while agatoxin reduced aEPSC frequency to 48 % in deaf mice (n = 4) and to 69 % in control mice (n = 6).
Figure 3. N and P/Q calcium channels support evoked and asynchronous release in normal and deaf mice.
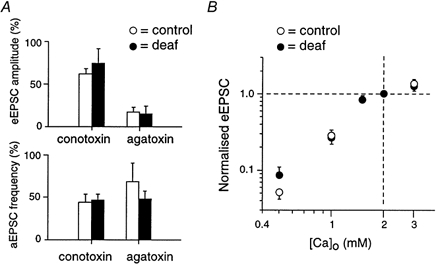
A, upper bar charts, calcium channel toxins reduced evoked EPSCs in control and deaf mice to a similar extent. Evoked release was due primarily to P/Q-type channels (approximately 85 %) in both deaf and control mice. Lower bar chart, Asynchronous release (see text for explanation) was reduced by toxins similarly in normal and deaf mice. B, deaf and control mice show a similar dependence on extracellular calcium concentration. Evoked EPSC amplitudes were normalized to the amplitude at physiological calcium (2 mm).
The relationship between eEPSC amplitude and extracellular calcium concentration was measured in control and deaf mice (Fig. 3B). Control (n = 5) and deaf mice (n = 6) were found to exhibit a very similar saturating relationship with increasing extracellular calcium concentration.
Release during tetanic stimulation
Since the auditory nerve commonly responds with trains of impulses in vivo, the response of AVCN neurons to high frequency presynaptic nerve stimulation was examined in deaf and control mice (Fig. 4). A train of 15 stimuli (100 Hz) was followed by two additional stimuli after a specific recovery period. Synaptic depression during a tetanus was defined as the ratio of the fifteenth response to the first response (S15:S1; Fig. 4A and B). The response was significantly depressed to a lower level in deaf (7 ± 1 %; n = 18) compared to control animals (12 ± 1 %; n = 6; P < 0.001; Fig. 4B). Recovery (S16:S1) was measured in deaf (n = 10) and control animals (n = 7). Recovery was similar at different recovery intervals (0.1, 0.5, 1, 5, 10 s) except at a 0.5 s interval, where recovery was greater for deaf versus control mice (P < 0.05; data not shown). The time constant of recovery was not different between control (0.9 s) and deaf animals (0.6 s; data not shown). The paired-pulse ratio following a period of recovery (S17:S16) was not different in control (0.6; n = 8) and deaf animals (0.6; n = 10; data not shown). In summary, the responses to tetanic stimuli and recovery were remarkably similar between deaf and control mice, the main difference being that deaf mice show a greater level of depression during a train of stimuli (Fig. 4B).
Figure 4. Tetanic depression is greater in deaf mice.
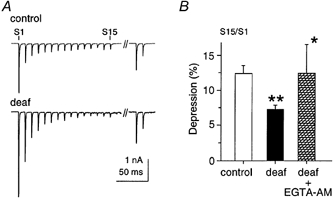
A, high frequency stimulation (S1-S15; 100 Hz) was followed by paired pulses after a 100 ms time interval. B, the eEPSC showed 70 % more tetanic depression in deaf versus control animals (P < 0.001). EGTA-AM (30 μm) relieved the amount of depression in deaf animals (P < 0.05).
Delayed asynchronous release is greater in deaf mice
Following high frequency stimulation, delayed asynchronous miniature EPSCs (aEPSCs) were observed in a 100 ms time period after the final stimulus (Fig. 5A). In control mice, the frequency of aEPSCs (7 ± 1 Hz, n = 6) was similar to baseline mEPSC frequency (5 ± 1 Hz). However, in deaf mice, the frequency of aEPSCs (98 ± 21 Hz, n = 18) was significantly greater than baseline mEPSC frequency (3 ± 1 Hz; n = 10) and considerably greater than the frequency of aEPSCs in control animals (P < 0.01; Fig. 5B). This dramatic difference in aEPSC frequency was observed between deaf and control animals with similar evoked EPSC amplitudes, and therefore appears to be an intrinsic difference, rather than an association with the amount of initial transmitter release. The distribution of aEPSC frequency for deaf mice, measured in 5 ms bins for a 100 ms time period starting 10 ms after the last stimulus, shows an exponential decline (time constant = 70 ms; Fig. 5C).
Figure 5. Asynchronous release is greater in deaf mice.
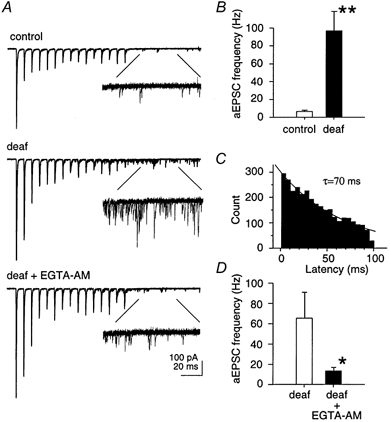
A, delayed (asynchronous) miniature events (aEPSCs) were measured in a 100 ms time period following high frequency stimulation. The frequency of aEPSCs was compared in control and deaf animals, and following bath application of EGTA-AM (30 μm). B, the frequency of aEPSCs is significantly greater in deaf animals (P < 0.01). C, distribution of aEPSCs in a 100 ms time period, starting 10 ms after the last stimulus. D, EGTA-AM significantly reduced the frequency of aEPSCs in deaf mice (P < 0.05).
To test whether an increase in the frequency of aEPSCs in deaf mice could be due to residual calcium in the presynaptic terminal, a membrane-permeant calcium buffer (EGTA-AM) was bath applied to brain slices from deaf mice (Fig. 5A). EGTA-AM (30 μm) did not affect the amplitude of the evoked EPSC following the first stimulus (S1), nor the paired-pulse ratio (S2:S1; data not shown). However, the frequency of aEPSCs was greatly decreased with EGTA-AM from 66 ± 25 Hz to 14 ± 3 Hz (n = 6; P < 0.05; Fig. 5D). Furthermore, EGTA-AM significantly relieved the depression of the eEPSC (S15:S1) to a value (12 ± 4 %; n = 6) comparable with control animals (12 ± 1 %; n = 6; P < 0.05; Fig. 4B; see Discussion).
Paired-pulse ratio and release probability in deaf and control mice
Our variance-mean results indicate that Pr is greater in deaf mice. Many previous studies have used the paired-pulse ratio of two consecutive responses to investigate a difference in Pr. Our previous experiments at the rat endbulb- bushy cell connection have shown that, for a particular cell, there is a strong inverse monotonic relationship between paired-pulse ratio and mean release probability (Oleskevich et al. 2000). This relationship holds as release probability is altered by changing extracellular calcium concentration or calcium channel block with cadmium. Figure 6A shows that this is also the case for the mean paired-pulse ratio versus Pr relationships of deaf and normal mice. However, the two relationships do not overlap (Fig. 6A). If the only difference between deaf and control mice is a difference in calcium entry, it would be expected that a greater release probability in the deaf mice would be associated with a lower paired-pulse ratio. In the present experiments, the greater mean Pr in deaf mice was not associated with a significant difference in the mean paired-pulse ratio between deaf animals (0.6 ± 0.1; n = 24) and control animals (0.6 ± 0.1; n = 12) at physiological calcium concentration (2 mm, Fig. 6A). This suggests that a mechanism other than simply the amount of calcium entry may be responsible for the difference in Pr. If release is decreased by another mechanism, then the effect on the paired-pulse ratio may be different from reducing calcium entry (see also discussion in Oleskevich et al. 2000). Figure 6B shows the effect of decreasing release from control value (normalized to 1.0) using two different mechanisms in the same cells in deaf animals (n = 5). As expected, decreasing release by reducing calcium entry with cadmium resulted in a substantial increase in the paired-pulse ratio (1.3 ± 0.1) compared to the paired-pulse ratio in physiological calcium (0.7 ± 0.03). However, significantly, addition of EGTA-AM in sufficient concentration to reduce initial evoked release to approximately the same amount as cadmium did not cause any significant change in the paired-pulse ratio (P > 0.05).
Figure 6. The relationship between Pr and PPR is different for control and deaf mice.
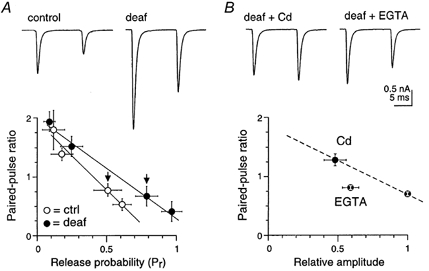
A, individual traces for control and deaf mice AMPA eEPSCs at −60 mV in physiological calcium following paired-pulse stimulation (10 ms interval). Control and deaf mice show paired-pulse depression independently of enhanced transmission in deaf mice. A linear relationship is evident between paired-pulse ratio (PPR) and release probability (Pr) for deaf (n = 5) and control (n = 6) mice. Control and deaf mice show a similar PPR (0.8 and 0.7, respectively) independently of enhanced Pr in deaf (0.8) versus control mice (0.5). Arrows indicate measurements in physiological calcium (2 mM). B, individual traces for same deaf mouse in A. Cadmium (Cd) and EGTA-AM (60 μm) cause a reduction in eEPSC amplitude yet Cd evokes paired-pulse facilitation while EGTA-AM evokes paired-pulse depression. Linear plot shows Cd increases PPR (n = 5; normalized to eEPSC amplitude in 2 mm calcium) while EGTA does not affect PPR (n = 5). EGTA mimics the relationship between control and deaf mice in A.
DISCUSSION
Our results show that, at a time shortly after ear canal opening (11–16 days postnatal, mean 13 days), the AMPA and NMDA receptor-mediated component of the auditory nerve evoked EPSC are greater in deafness mice, compared with normal mice. Greater AMPA neurotransmission can be explained by an increase in the probability of neurotransmitter release. The normal developmental reduction observed in the NMDA response (Isaacson & Walmsley, 1995b; Bellingham et al. 1998) appears to be offset by a greater release probability in the deafness mice. In previous studies, it has been suggested that homeostatic plasticity results in a postsynaptic up-regulation of receptors in response to reduced presynaptic activity (Craig, 1998; Turrigiano, 1999). Such a postsynaptic compensation does not seem to occur in deafness mice, as both the AMPA miniature EPSC amplitude and the ratio of evoked NMDA to AMPA components are similar for control and deafness mice. Homeostatic plasticity can also involve presynaptic modifications such as an increase or decrease in transmitter release probability (Turrigiano, 1999; Paradis et al. 2001). A greater presynaptic release probability in deaf mice may represent a compensatory mechanism to the absence of synaptic activity (Davis & Bezprozvanny, 2001). Alternatively, release probability may be high initially, and there may be a failure of the synapse to mature to a lower release probability. However, in the latter case, it is important to note that other parameters of transmission in the deaf mice are very similar to normal mice, including the amplitude and time course of mEPSCs, the NMDA/ AMPA ratio of the evoked EPSCs (which decreases during development), and the time course of the NMDA component of the evoked EPSC (which normally becomes briefer during development, Bellingham et al. 1998).
The variance-mean plots from the deafness mutant mice exhibited pronounced parabolic curvature (see Fig. 2B) consistent with high Pr (> 0.5). The variance-mean plots for the control animals systematically exhibited less curvature, consistent with low Pr, and in some cases they were almost linear (see Fig. 2A). Fitting a parabola to these near-linear plots may overestimate Pr, and therefore the difference between Pr estimates for deaf and control groups is likely to be even greater (Clements & Silver, 2000). While we are confident of a change in Pr, we cannot rule out a contribution from N which is a minimum estimate only. However, for the population of cells used in the variance-mean analysis, the difference in the evoked EPSC amplitudes between deaf and control mice (70 %) was well matched by the difference in the values of Pr (60 %). This indicates that the difference in evoked EPSC amplitudes is predominantly due to a change in Pr.
The auditory pathway experiences high frequency bursts of auditory nerve activity under physiological conditions. The deaf mice showed greater depression following a train of stimuli, consistent with previous studies showing that under conditions of low release probability, there is less depression following a train of stimuli (Brenowitz et al. 1998; Brenowitz & Trussell, 2001). However, it was also observed that the frequency of delayed-release asynchronous aEPSCs was much greater in deaf versus control mice, following trains of stimuli. The aEPSC frequency was greatly reduced by EGTA-AM, suggesting that residual calcium is responsible for the aEPSCs in deaf mice. This is consistent with previous studies showing that EGTA decreased the number of delayed miniature events in young animals (Chuhma et al. 2001) and in hippocampal cultures (Hagler & Goda, 2001). Significantly, the application of EGTA-AM at a low concentration, not sufficient to reduce the amplitude of the initial eEPSC (S1), resulted in an increase in the amplitude of the last eEPSC (S15) following a train of stimuli, with a resultant decrease in synaptic depression (S15:S1). This may be largely explained by an increase in the number of readily releasable vesicles at endbulb release sites in the presence of EGTA, due to a reduction in the number of vesicles normally lost via residual calcium-mediated delayed (asynchronous) release. Calculations based on the frequency of aEPSCs and the number of quanta underlying the evoked EPSC (S15) support this proposal. The frequency of aEPSCs estimates that three quanta are released between the second to last stimulus (S14) and the last stimulus (S15) while approximately four quanta underlie the eEPSC (S15) in the presence of EGTA. These results suggest that asynchronous release may interfere with stimulus evoked transmission during high frequency transmission.
A commonly used assay for a difference in Pr is a cross-population change in paired-pulse ratio, but such a difference was not seen in the present study of deaf and normal mice. We have previously shown that paired-pulse ratio is negatively correlated with release probability in the rat AVCN (Oleskevich et al. 2000), and this was confirmed in the present study for both deaf and normal mice. Although there are cell to cell differences in this relationship, in general it would be expected that cells with a greater release probability would be associated with a decreased paired-pulse ratio. However, in the present study, the overall population relationship between paired-pulse ratio and Pr was found to be different for deaf versus control mice, suggesting an intrinsic difference in release properties between these connections that is not explained simply by differences in calcium entry into the terminal. Our results using EGTA-AM (in contrast to cadmium, see Fig. 6) to decrease release probability in deaf mice show that a substantial change in release may occur without a concomitant change in the paired-pulse ratio. (This suggests that caution must be exercised when interpreting paired-pulse ratio as an indicator of release probability.)
A potential factor underlying the observed differences between deafness and control mice is the lack of normal synaptic activity in the deafness mice. Neural activity may influence a variety of pre- and postsynaptic factors which regulate synaptic strength (Rao & Craig, 1997; Kirsch & Betz, 1998; Kavalali et al. 1999). In the cochlear nucleus of hearing-impaired animals, both anatomical differences in the synaptic contacts (Ryugo et al. 1997), and physiological alterations in neuronal firing patterns have been reported (Shepherd & Javel, 1997). Our findings show that transmitter release probability is greater in the AVCN of deaf mice compared with normal mice. Thus, in normal hearing development, auditory nerve activity may act to suppress release probability, which may decrease synaptic depression and hence improve transmission through this high fidelity auditory pathway. Since the calcium buffer EGTA-AM was found to diminish all of the differences we observed between deaf and normal mice (deaf mice showing greater Pr with similar PPR, greater tetanic depression and greater asynchronous release), it is tempting to suggest that there may be impaired calcium buffering in the terminals of deaf versus normal mice.
Acknowledgments
The authors are grateful to K. Steel and N. Glenn (MRC Institute of Hearing Research, Nottingham, UK) for providing the dn/dn mice and to K. Matthaei (Gene Targeting Group, JCSMR, ANU) for his help and advice.
REFERENCES
- Bellingham MC, Lim R, Walmsley B. Developmental changes in EPSC quantal size and quantal content at a central glutamatergic synapse in rat. Journal of Physiology. 1998;511:861–869. doi: 10.1111/j.1469-7793.1998.861bg.x. [DOI] [PMC free article] [PubMed] [Google Scholar]
- Bock GR, Frank MP, Steel KP. Preservation of central auditory function in the deafness mouse. Brain Research. 1982;239:608–612. doi: 10.1016/0006-8993(82)90536-4. [DOI] [PubMed] [Google Scholar]
- Brawer JR, Morest DK, Kane EC. The neuronal architecture of the cochlear nucleus of the cat. Journal of Comparative Neurology. 1974;155:251–300. doi: 10.1002/cne.901550302. [DOI] [PubMed] [Google Scholar]
- Brenowitz S, David J, Trussell L. Enhancement of synaptic efficacy by presynaptic GABAB receptors. Neuron. 1998;20:135–141. doi: 10.1016/s0896-6273(00)80441-9. [DOI] [PubMed] [Google Scholar]
- Brenowitz S, Trussell L. Minimizing synaptic depression by control of release probability. Journal of Neuroscience. 2001;21:1857–1867. doi: 10.1523/JNEUROSCI.21-06-01857.2001. [DOI] [PMC free article] [PubMed] [Google Scholar]
- Cant NB, Morest DK. The bushy cells in the anteroventral cochlear nucleus of the cat. A study with the electron microscope. Neuroscience. 1979;4:1925–1945. doi: 10.1016/0306-4522(79)90066-6. [DOI] [PubMed] [Google Scholar]
- Chuhma N, Koyano K, Ohmori H. Synchronisation of neurotransmitter release during postnatal development in a calyceal presynaptic terminal or rat. Journal of Physiology. 2001;530:93–104. doi: 10.1111/j.1469-7793.2001.0093m.x. [DOI] [PMC free article] [PubMed] [Google Scholar]
- Clements JD, Bekkers JM. Detection of spontaneous synaptic events with an optimally scaled template. Biophysical Journal. 1997;73:220–229. doi: 10.1016/S0006-3495(97)78062-7. [DOI] [PMC free article] [PubMed] [Google Scholar]
- Clements JD, Silver RA. Unveiling synaptic plasticity: a new graphical and analytical approach. Trends in Neurosciences. 2000;23:105. doi: 10.1016/s0166-2236(99)01520-9. [DOI] [PubMed] [Google Scholar]
- Craig AM. Activity and synaptic receptor targeting: the long view. Neuron. 1998;21:459–462. doi: 10.1016/s0896-6273(00)80555-3. [DOI] [PubMed] [Google Scholar]
- Davis GW, Bezprozvanny I. Maintaining the stability of neural function: a homeostatic hypothesis. Annual Review of Physiology. 2001;63:847–869. doi: 10.1146/annurev.physiol.63.1.847. [DOI] [PubMed] [Google Scholar]
- Durham D, Rubel EW, Steel KP. Cochlear ablation in deafness mutant mice: 2-deoxyglucose analysis suggests no spontaneous activity of cochlear origin. Hearing Research. 1989;43:39–46. doi: 10.1016/0378-5955(89)90057-9. [DOI] [PubMed] [Google Scholar]
- Gardner SM, Trussell LO, Oertel D. Time course and permeation of Synaptic AMPA receptors in cochlear nuclear neurons correlate with input. Journal of Neuroscience. 1999;19:8721–8729. doi: 10.1523/JNEUROSCI.19-20-08721.1999. [DOI] [PMC free article] [PubMed] [Google Scholar]
- Hagler DJ, Goda Y. Properties of synchronous and asynchronous release during pulse train depression in cultured hippocampal neurons. Journal of Physiology. 2001;85:2324–2334. doi: 10.1152/jn.2001.85.6.2324. [DOI] [PubMed] [Google Scholar]
- Isaacson JS, Walmsley B. Receptors underlying excitatory synaptic transmission in slices of the rat anteroventral cochlear nucleus. Journal of Neurophysiology. 1995a;73:964–973. doi: 10.1152/jn.1995.73.3.964. [DOI] [PubMed] [Google Scholar]
- Isaacson JS, Walmsley B. Counting quanta: direct measurements of transmitter release at a central synapse. Neuron. 1995b;15:875–884. doi: 10.1016/0896-6273(95)90178-7. [DOI] [PubMed] [Google Scholar]
- Iwasaki S, Takahashi T. Developmental changes in calcium channel subtypes mediating synaptic transmission in rat auditory brainstem. Journal of Physiology. 1998;509:419–423. doi: 10.1111/j.1469-7793.1998.419bn.x. [DOI] [PMC free article] [PubMed] [Google Scholar]
- Kavalali ET, Klingauf J, Tsien RW. Activity-dependent regulation of synaptic clustering in a hippocampal culture system. Proceedings of the National Academy of Sciences of the USA. 1999;96:12893–12900. doi: 10.1073/pnas.96.22.12893. [DOI] [PMC free article] [PubMed] [Google Scholar]
- Keats BJ, Berlin CI. Genomics and hearing impairment. Genome Research. 1999;9:7–16. [PubMed] [Google Scholar]
- Kirsch J, Betz H. Glycine-receptor clustering in spinal neurons. Nature. 1998;392:717. doi: 10.1038/33694. [DOI] [PubMed] [Google Scholar]
- Lenn NJ, Reese TS. The fine structure of nerve endings in the nucleus of the trapezoid body and the ventral cochlear nucleus. American Journal of Anatomy. 1966;118:375–389. doi: 10.1002/aja.1001180205. [DOI] [PubMed] [Google Scholar]
- Liberman MC. Central projections of auditory-nerve fibers of differing spontaneous rate. I. Anteroventral cochlear nucleus. Journal of Comparative Neurology. 1991;313:240–258. doi: 10.1002/cne.903130205. [DOI] [PubMed] [Google Scholar]
- Oleskevich S, Walmsley B. Phosphorylation regulates spontaneous and evoked transmitter release at a giant terminal in the rat auditory brainstem. Journal of Physiology. 2000;526:349–357. doi: 10.1111/j.1469-7793.2000.t01-1-00349.x. [DOI] [PMC free article] [PubMed] [Google Scholar]
- Oleskevich S, Clements J, Walmsley B. Release probability modulates short-term plasticity at a rat giant terminal. Journal of Physiology. 2000;524:513–523. doi: 10.1111/j.1469-7793.2000.00513.x. [DOI] [PMC free article] [PubMed] [Google Scholar]
- Paradis S, Sweeney ST, Davis GW. Homeostatic control of presynaptic release is triggered by postsynaptic membrane depolarization. Neuron. 2001;30:737–749. doi: 10.1016/s0896-6273(01)00326-9. [DOI] [PubMed] [Google Scholar]
- Rao A, Craig AM. Activity regulates the synaptic localization of the NMDA receptor in hippocampal neurons. Neuron. 1997;19:801–812. doi: 10.1016/s0896-6273(00)80962-9. [DOI] [PubMed] [Google Scholar]
- Redd EE, Pongstaporn T, Ryugo DK. The effects of congenital deafness on auditory nerve synapses and globular bushy cells in cats. Hearing Research. 2000;147:160–174. doi: 10.1016/s0378-5955(00)00129-5. [DOI] [PubMed] [Google Scholar]
- Reid CA, Clements JD. Postsynaptic expression of long-term potentiation in the rat dentate gyrus demonstrated by variance-mean analysis. Journal of Physiology. 1999;518:121–130. doi: 10.1111/j.1469-7793.1999.0121r.x. [DOI] [PMC free article] [PubMed] [Google Scholar]
- Ryugo DK, Fekete DM. Morphology of primary axosomatic endings in the anteroventral cochlear nucleus of the cat: a study of the endbulbs of Held. Journal of Comparative Neurology. 1982;210:239–257. doi: 10.1002/cne.902100304. [DOI] [PubMed] [Google Scholar]
- Ryugo DK, Sento S. Synaptic connections of the auditory nerve in cats: relationship between endbulbs of held and spherical bushy cells. Journal of Comparative Neurology. 1991;305:35–48. doi: 10.1002/cne.903050105. [DOI] [PubMed] [Google Scholar]
- Ryugo DK, Pongstaporn T, Huchton DM, Niparko JK. Ultrastructural analysis of primary endings in deaf white cats: morphologic alterations in endbulbs of Held. Journal of Comparative Neurology. 1997;385:230–244. doi: 10.1002/(sici)1096-9861(19970825)385:2<230::aid-cne4>3.0.co;2-2. [DOI] [PubMed] [Google Scholar]
- Shepherd RK, Javel E. Electrical stimulation of the auditory nerve. I. Correlation of physiological responses with cochlear status. Hearing Research. 1997;108:112–144. doi: 10.1016/s0378-5955(97)00046-4. [DOI] [PubMed] [Google Scholar]
- Steel KP, Bock GR. The nature of inherited deafness in deafness mice. Nature. 1980;288:159–161. doi: 10.1038/288159a0. [DOI] [PubMed] [Google Scholar]
- Turrigiano GG. Homeostatic plasticity in neuronal networks: the more things change, the more they stay the same. Trends in Neurosciences. 1999;22:221–227. doi: 10.1016/s0166-2236(98)01341-1. [DOI] [PubMed] [Google Scholar]