

Abstract
Coincidence detection at the nucleus laminaris (NL) of a chicken was improved between embryos (embryonic days (E) 16 and 17) and chicks (post-hatch days (P) 2–7) in slice preparations. Electrical stimuli were applied bilaterally to the projection fibres to the NL at various intervals. The response window corresponding to the temporal separation of electrical stimuli that resulted in half-maximal firing probability was adopted as the measure of coincidence detection, and was narrower in chicks (1.4 ms) than in embryos (3.9 ms). Between these two ages, the membrane time constant of NL neurons was reduced from 18.4 to 3.2 ms and the membrane conductance was increased 5-fold, while no difference was measured in the input capacitance. Evoked EPSCs decayed slightly faster in chicks, while the size and the time course of miniature EPSCs were unchanged. Action potentials had lower thresholds and larger after-hyperpolarization in chicks than in embryos. Dendrotoxin-I depolarized cells and increased their input resistance significantly at both ages, eliminated the after-hyperpolarization, and delayed the decay phase of action potentials, indicative of the expression of low-threshold K+ channels. Cs+ hyperpolarized the cells, increased the input resistance and eliminated sags during hyperpolarization at both ages, while the hyperpolarization sag was affected by neither Ba2+ nor TEA. These data indicate the expression of hyperpolarization-activated cation channels. Between these two ages, the maximum conductance of low-threshold K+ channels increased 4-fold to about 16 nS, and hyperpolarization-activated channels increased 6-fold to about 10 nS. Improvement of coincidence detection correlated with the acceleration of the EPSP time course as a result of the increase of these conductances.
Interaural time difference of sound is detected with great accuracy in birds and in some mammals (owl: Moiseff & Konishi, 1981; dog: Goldberg & Brown, 1969; cat: Yin & Chan, 1990; human: Klumpp & Eady, 1956). In birds, the interaural time difference is proposed as a cue for localizing the sound source in the azimuth, and was first computed in the nucleus laminaris (NL) (Carr & Konishi, 1990). Neurons in the chicken NL receive systematic projections from the bilateral nucleus magnocellularis (NM). The ventral dendritic tuft is innervated by the contralateral NM, and the dorsal tuft by the ipsilateral NM (Parks & Rubel, 1975). The contralateral axonal projections from NM form a delay line (Young & Rubel, 1983; Overholt et al. 1992), which compensates for the slight difference in sound arrival time between the two ears. NL neurons generate action potentials at maximal probability when bilateral inputs arrive in coincidence, and thus encode the interaural time difference in the mediolateral location of the nucleus, as first proposed by Jeffress (1948).
In brainstem slice preparations of chick embryos and chicks, NL neurons generate action potentials in response to coincident or near-coincident bilateral inputs (Overholt et al. 1992; Joseph & Hyson, 1993; Funabiki et al. 1998; Bruckner & Hyson, 1998). The accuracy of coincidence detection improves towards the end of a stimulus train (Joseph & Hyson, 1993), and also by local application of low concentrations of GABA (Funabiki et al. 1998; Bruckner & Hyson, 1998). Voltage-sensitive outward conductances also contribute to the accuracy of coincidence detection (Reyes et al. 1996). The observations of hyperpolarization sag (Reyes et al. 1996; Funabiki et al. 1998) were indicative of the presence of currents activated by membrane hyperpolarization. All these conductances coupled with the rapid kinetics of EPSC (Raman et al. 1994) may contribute towards improving the binaural processing of sound in the NL neuron.
In our previous studies of coincidence detection in slice preparations of chick embryos (Funabiki et al. 1998), the accuracy of detecting the interaural time difference was defined as the time interval corresponding to the half-maximal spiking probability when near-coincident bilateral stimuli were applied. The accuracy was improved by local GABA application (Funabiki et al. 1998), but was still less than that reported in other in vitro studies performed on chicks after hatching (Overholt et al. 1992; Joseph & Hyson, 1993; Bruckner & Hyson, 1998). The difference in the results between these experiments and ours might be explained by the difference in the stages of development of the animals. In this paper we investigate the accuracy of coincidence detection of NL neurons in two stages of animal development, and attempt to identify the cellular mechanisms responsible for improving the detection of the interaural time differences.
METHODS
Slice preparation
Animals were kept and used according to the regulations of the Animal Research Committee, Graduate School of Medicine, Kyoto University. Brain slices were cut from chickens (Gallus domesticus) of two developmental stages (chicks of post-hatch days (P) 2–7 and embryonic days (E) 16 and 17). Chicks were deeply anaesthetized with halothane (Fluothan, Takeda, Osaka, Japan), and embryos were anaesthetized by cooling eggs with ice-cold water. After decapitation, the brainstem was isolated and submerged in ice-cold 35 mm glucose saline (composition in this and in subsequent solutions (mm): 130 NaCl, 4.5 KCl, 2 CaCl2, 5 Pipes-Na, and 35 glucose, pH 7.4) saturated with 100 % O2. The brainstem block was imbedded in a 4 % agarose gel (Low gelling temperature, Nacalai, Kyoto, Japan), and coronal slices (200-300 μm) were cut with a tissue slicer (Zero-1, Dosaka, Kyoto, Japan). The slices were incubated in 100 mm glucose artificial cerebrospinal fluid (75 NaCl, 2.5 KCl, 26 NaHCO3, 1.25 NaH2PO4, 1 CaCl2, 3 MgCl2, 100 glucose, pH 7.4) saturated with 95 % O2 and 5 % CO2 at 36 °C for at least 1 h before use. A slice was then mounted in a recording chamber on the stage of an upright microscope equipped with infrared differential interference contrast optics (BX50WI, Olympus, Tokyo, Japan), monitored through an infrared-sensitive charge-coupled device camera (IR-CCD, Hamamatsu Photonics, Hamamatsu, Japan) and was contrast enhanced (DVS-20, Hamamatsu Photonics). During experiments, slices were continuously perfused with normal artificial cerebrospinal fluid (125 NaCl, 2.5 KCl, 26 NaHCO3, 1.25 NaH2PO4, 2 CaCl2, 1 MgCl2, and 17 glucose, pH 7.4).
Electrophysiological recordings
Whole-cell recordings were made with a patch clamp amplifier (EPC-8, List). Patch pipettes were fabricated from thin-walled borosilicate glass capillaries (GC150TF-100, Harvard, USA) and had a resistance of 5–10 MΩ when filled with a KCl-based internal solution (160 KCl, 5 EGTA, 10 Hepes-KOH, pH 7.2). Voltage clamp experiments to record EPSCs were made with a CsCl-based internal solution (160 CsCl, 5 EGTA, 10 Hepes-KOH, pH 7.4), and QX-314 (5 mm, Alomone labs, Jerusalem, Israel) was added to the internal solution to block Na+ channels. Pipettes for voltage clamp experiments were coated with a silicone resin (Sylgard 184, Dow Corning Asia) and tips were fire polished before use. The electrode capacitance was compensated electronically, and the series resistance (7.5–20 MΩ) was estimated and compensated by 60–70 %. Current clamp experiments were performed with the KCl-based pipette solution. The liquid junction potential (2.1–3.1 mV) was measured between the patch electrode and the bath and was corrected after the experiments. These measured values were in agreement with those calculated from the equation derived from the Henderson assumption (see Hagiwara & Ohmori, 1982). The resting membrane potential was usually measured within 1 min after the whole-cell recording configuration was achieved. The change in resting membrane potential due to the block of ionic conductance was measured as the difference between the measurements before and nearly 3 min after application of the drugs. All experiments were performed at room temperature (∼20–25 °C).
In all the experiments, GABAA receptors were blocked by adding 20 μm bicuculline (Sigma) to the normal artificial cerebrospinal fluid in the bath. In some experiments, K+ channels were blocked by bath-applied DTX (40 nm dendrotoxin-I, Alomone labs), Cs+ (3 mm), Ba2+ (1–2 mm) and TEA (20–60 mm). TEA (Nacalai) was applied by substituting it for an equal concentration of NaCl in the normal artificial cerebrospinal fluid. Cs+ (3 mm) also blocked the hyperpolarization-activated channel. Miniature EPSCs (mEPSCs) were recorded in the presence of 1 μm TTX (Sankyo, Tokyo, Japan).
Most experiments were performed using the middle one or two slices from four coronal slices obtained serially, thus excluding those slices corresponding to the tonotopic regions that encode extremely low and high frequency. NL neurons used in these experiments are reported to have a characteristic frequency of 1.1–1.8 kHz in the chick and 0.8–1.4 kHz in embryos, respectively (Lippe & Rubel, 1985). As detailed in Results, there were no systematic variations in the biophysical characteristics of the chick NL neurons within the period examined (P2–7).
Measurement of cell capacitance
Membrane capacitance was measured in both chick and embryonic NL neurons. Under current clamp conditions, the membrane capacitance was calculated from the membrane resistance and the membrane time constant; both were measured by single-exponential curve fittings to the voltage responses induced by injecting 0.02–0.05 nA of hyperpolarizing current of 70–200 ms duration from the membrane potential of about −65 mV. Under voltage clamp the input capacitance (Cm) was calculated from the electronic charge (Q) carried by the capacitative current (ΔIc) generated in response to a 5 mV voltage step (ΔV) of 20 ms duration from the holding potential of −70 mV. The capacitative current was time integrated to give the electronic charge; Q = ∫ΔIc dt = CmΔV. In integration, the steady-state current component was subtracted. Measurements were made from three or four recordings in each cell and were averaged. The input capacitance obtained by the voltage clamp was systematically smaller than that by the current clamp (Table 1), and this was attributed to the limited frequency response of the patch amplifier. The estimation error of the capacitance in the electronic cell, composed of the parallel resistor- capacitor network, was 30 % under voltage clamp conditions, of which the cut-off frequency was set at 10 kHz, while the error was within 5 % under fast-mode current clamp conditions. The estimate of capacitance approached the actual value at higher cut-off frequencies under voltage clamp conditions; 0.66 of the actual capacitance at 1 kHz; and 0.75 at 30 kHz.
Table 1.
Postsynaptic membrane properties
| Chick | Embryo | |
|---|---|---|
| Resting membrane potential (mV) | −58.9 ± 0.5 | −58.7 ± 0.6 |
| Membrane time constant (ms) † | 3.2 ± 0.3 (61) | 18.4 ± 1.2 ** (62) |
| Input resistance (MΩ) † | 49.1 ± 3.0 (61) | 282.6 ± 17.9 ** (62) |
| Input capacitance (pF) † | 62.8 ± 2.7 (61) | 65.3 ± 1.6 (62) |
| Input capacitance (pF) ‡ | 45.9 ± 1.9 (18) | 48.2 ± 1.9 (24) |
| Rectification index | 1.9 ± 0.1 | 3.2 ± 0.1 ** |
| Threshold current (nA) | 0.64 ± 0.02 | 0.62 ± 0.02 |
| Threshold potential (mV) | −49.4 ± 0.5 | −44.3 ± 0.7 ** |
| Maximum rate of rise (V s−1) | 71.8 ± 3.0 | 59.2 ± 1.9 ** |
| AHP amplitude (mV) | 7.4 ± 0.3 [49] | 3.2 ± 0.2 ** [6] |
| AHP 90 % duration (ms) | 14.5 ± 0.7 [49] | 19.1 ± 4.5 * [6] |
Membrane time constant, input resistance and input capacitance were measured by injecting a hyperpolarizing current of 0.02–0.05 nA under current clamp conditions.
Input capacitance was measured under voltage clamp conditions from the capacitative transient induced by a −5 mV voltage step. AHP, afterhyperpolarization. Significant differences between the chick and the embryo are indicated
P < 0.01 (Student's unpaired t test)
P < 0.05 (Student's unpaired t test). The number of cells tested is indicated in parentheses where the number is different from 50 in the chick and 41 in the embryo. The number of cells that showed after-hyperpolarization among 50 cells in the chick and 41 cells in the embryo is indicated in square brackets.
Electrical stimulation of presynaptic fibres and coincidence detection
Electrical stimulation was applied either bilaterally or unilaterally to presynaptic fibres from NM. Stimuli were applied through bipolar tungsten electrodes insulated except for 50 μm at the tip, and were biphasic square-wave voltage pulses of 0.1–60 V amplitude and 0.1 ms duration. One electrode to stimulate the ipsilateral projection was placed on the lateral edge of the ipsilateral NM (∼50 μm away from the lateral edge of NL). The other electrode to stimulate the contralateral fibres was placed half-way between the midline of the slice and the NL (∼50 μm away from the medial edge of NL). In experiments to measure coincidence detection, a train of four electrical stimuli at 10 ms interstimulus intervals was applied at each 3 s major interval (Fig. 1A). In these experiments, time separation (Δt) between the two sides of stimuli was systematically changed under computer control with a step of 0.4 ms between ±2.0 ms (positive and negative values mean contralateral and ipsilateral leading stimuli, respectively). Firing probability was defined as the total number of spikes divided by the total stimulus number (4 times the number of the train) at each Δt, and was calculated from 10–30 trials made on individual neurons (40–120 stimuli for each Δt). The maximum firing probability was obtained at the coincident stimuli (Δt = 0) for all the neurons examined, suggesting that the conduction time difference between the two sides was less than the time resolution (0.4 ms) of the present experimental protocol. The firing probability at the respective stimuli during the train was calculated in some experiments (see Results).
Figure 1. Coincidence detection in the chick and the chick embryo.
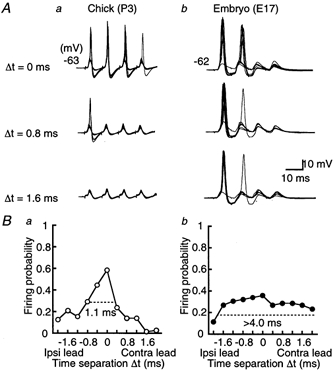
A, ten superimposed voltage traces of action potentials of the NL neuron generated by a pair of stimuli applied on both ipsilateral and contralateral projections from NM. Time differences (Δt) between the two sides of stimulation are indicated for the chick (a) and the embryo (b). Trains of four stimuli were applied repeatedly at 3 s intervals. Firing probability from the contra- and the ipsilateral stimuli alone was 0.13 (40 stimuli) and 0.18 (40 stimuli), respectively for the chick, and 0.06 (16 stimuli) and 0.06 (16 stimuli) for the embryo. Here and in subsequent figures, resting membrane potential is indicated to the left of each panel. B, firing probabilities as a function of Δt were calculated from the neurons in A. Note that the firing probability peaked at around Δt = 0 in both age groups, but had a more pointed peak in the chick (a) than in the embryo (b). The response windows are indicated by horizontal dashed lines. Ipsi, ipsilateral; Contra, contralateral.
The intensity of stimuli affected the accuracy of coincidence detection significantly (Joseph & Hyson, 1993). The stimulus intensity was set at the beginning of each experiment and was maintained throughout the experiment so that the unilateral stimuli alone always evoked EPSPs but the probability of spike generation was less than 0.25 (none or one spike during a train).
Data acquisition and analysis
Current and voltage output signals from the patch clamp amplifier were filtered at 10 kHz through a four-pole Butterworth low-pass filter (UF-BL2, NF, Japan), and sampled at 10 kHz by a 12-bit A/D converter (ADM-8298BPC, Micro Science, Tokyo, Japan) with a personally written data acquisition program. Off-line analysis of data was made on a personal computer (Power Mac G3) using commercially available software as detailed below (Axograph, Axon Instruments). Data are given as means ± standard error of the mean (n = number of cells).
Analysis of EPSP/Cs
Amplitude of EPSPs or EPSCs was measured by first setting the baseline as the average of 4–10 data points (0.4–1.0 ms) preceding the synaptic response and then by determining the peak from the data point of maximum amplitude. Rise time of EPSP/Cs was defined and measured as the time interval corresponding to the 10–90 % rise from the base to the peak amplitude. Half-amplitude width of EPSPs was measured as the time interval across the 50 % rise and fall of the EPSP. Exponential functions were fitted to the decay phase of EPSCs spanning 80–90 % of the amplitude; consequently, the data points corresponding to 0.5–0.8 ms from the peak time were excluded from the fitting. Measurements were made after taking ensemble averages of 5–20 records in each cell. mEPSCs were detected by eye and were extracted from traces. The mEPSCs were ensemble averaged from 12–172 recordings by aligning them to the 50 % rise time for each cell, and measurements were taken in a similar manner as they were for EPSCs.
Analysis of action potentials
The threshold potential and the threshold current were measured from action potentials generated by current injections of 3 ms pulse duration from a membrane potential of −65 mV. The voltage jump (2–7 mV) due to the series resistance was detected visually and corrected. The height of an action potential was defined as the peak amplitude from the threshold, and the half-amplitude width was measured as the time interval across the action potential at 50 % height, the action potential having been generated by the threshold current. The latency of the action potential was defined as the time interval between the start of current injection and the action potential peak when the action potential was evoked by 1.0 nA current injection (Fig. 6B), and was measured by setting the cursor manually. This current intensity was chosen to be the maximum current we used to generate action potentials. The fluctuation of action potential peak time was measured as the span of the peak time, in a series of measurements where action potentials were evoked from EPSPs (Fig. 1A). The maximum rate of rise and the after-hyperpolarization were measured from the action potentials generated by a 1.0 nA current injection. The amplitude of after-hyperpolarization was determined as the measure from the baseline membrane potential near −62 mV to the bottom of hyperpolarization response, and the 90 % duration of after-hyperpolarization was defined as the time interval across the 10 % amplitude from the baseline. The baseline potential was determined as the average of a 5 ms period preceding each current injection. All these measurements were made from single action potentials.
Figure 6. Development of excitability.

A, series of voltage responses to 200 ms current injections, from −0.4 nA to 1.0 nA, in 0.1 nA increments. In A-C, the chick is a and the embryo, b. B, series of voltage responses to 3 ms current injections up to 1.0 nA, in 0.1 nA increments. C, spikes generated by a train of 15 stimuli, each of 3 ms duration and 1.0 nA intensity, applied at 7 ms intervals. In B the latency for the spike is indicated by the time elapsed between the open and filled triangles (see details in Methods), and the threshold by the horizontal arrow when the spike was generated by the threshold current injection. The level of after-hyperpolarization is indicated by a horizontal dashed line in C.
RESULTS
Coincidence detection in NL neurons
Electrical stimuli were applied to both ipsilateral and contralateral projection fibres from NM to NL while the membrane potential of NL neurons was maintained at around −62 mV. Figure 1A illustrates our experiments in the chick (Fig. 1Aa) and the embryo (Fig. 1Ab). In the chick, the action potential was generated in most stimuli during a train when two stimuli were applied simultaneously (Fig. 1Aa, Δt = 0 ms), and the peak time of the action potential did not fluctuate significantly (0.55 ± 0.11 ms, n = 9). However, in the embryo (Fig. 1Ab, Δt = 0 ms) the first two EPSPs induced action potentials but not the third or fourth EPSP, and the peak time fluctuated extensively (1.69 ± 0.33 ms, n = 6). For both ages, peak time fluctuation was measured from action potentials generated at the first stimulus during the train.
When two stimuli were applied with a small time separation in the chick (Δt = 0.8 ms, Fig. 1Aa), only the first EPSP generated the action potential. Most stimuli failed to generate action potentials when separated by 1.6 ms. In the case of the embryo (Fig. 1Ab), the dependence of spiking on the time separation was moderate, and action potentials were generated even when bilateral stimuli were separated by 1.6 ms.
Figure 1Ba plots the firing probability from the experiments of Fig. 1Aa. The firing probability was maximal at coincident stimuli (Δt = 0 ms) and decreased as Δt increased in both positive and negative directions. We therefore here define the response window (indicated by dashed horizontal lines in Fig. 1B) as the time interval corresponding to one-half of the maximal firing probability. The response window in this chick was 1.1 ms (Fig. 1Ba), and was narrower than that in the embryo, which was more than 4.0 ms (Fig. 1Bb). The firing probabilities calculated from nine chick experiments (open circles) and six embryo experiments (filled circles) are plotted in Fig. 2. The maximum firing probability was obtained at coincident stimuli, and was larger in the chick (0.70 ± 0.04) than in the embryo (0.35 ± 0.09). The response window was narrower in the chick (1.4 ms) than in the embryo (3.9 ms).
Figure 2. Improvement of coincidence detection by development.
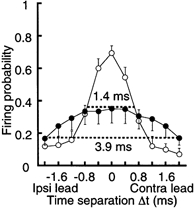
Firing probability as a function of Δt calculated from nine cells in the chick (open circles) and six cells in the embryo (filled circles). The response windows are indicated by horizontal dashed lines.
Figure 1A indicates that the probability of spike generation decreased towards the end of four stimuli in a train. The firing probability measured at coincident timing (Δt = 0 ms) at each stimulus during the train decreased in the embryo from 0.68 ± 0.10 for the first stimulus to 0.11 ± 0.06 for the fourth (n = 6, Fig. 1Ab), while the probability went from 0.77 ± 0.06 to 0.62 ± 0.08 in the chick (n = 9, Fig. 1Aa). The response window was narrowed during the train, but the extent was more moderate in the chick (from 1.5 to 1.3 ms, n = 9) than it was in the embryo (from more than 4 to 2.7 ms, n = 6). Joseph & Hyson (1993) reported similar results, in which the accuracy of coincidence detection in chick (P7–14) NL neurons was improved in the latter half of a train of 10 stimuli which were applied at 4 ms interstimulus intervals. They also demonstrated that the response window became narrower with weaker stimuli. In our experiments, we employed a train of four stimuli with 10 ms interstimulus intervals. In the chick, these conditions did not significantly depress the EPSP amplitude during the course of the train; the mean EPSP amplitude measured when action potentials failed was 5.7 ± 1.0 mV for the first stimulus and 5.3 ± 1.1 mV for the fourth (n = 9, P = 0.91, Student's paired t test). However, the EPSP amplitude reduced during the course of the stimulus train in the embryo, from 7.1 ± 0.9 mV for the first stimulus to 4.4 ± 0.3 mV for the fourth (n = 6, P < 0.05, Student's paired t test). These observations suggest the presence of a positive correlation between the amplitude of EPSP and the accuracy of coincidence detection.
As the firing probability was affected by the stimulus intensity, the intensity was adjusted as detailed in Methods. The average stimulus intensity was not significantly different between the ages, 4.4 ± 1.0 V (n = 6) for the chick and 4.7 ± 1.3 V (n = 5) for the embryo (P = 0.68, Student's unpaired t test). These stimulus intensities were the same as the threshold intensity needed to evoke EPSCs (P > 0.1, Student's unpaired t test) in both ages as described in ‘Evoked EPSCs and miniature EPSCs in NL neurons’. At this stimulus intensity, the firing probability from unilateral stimuli was not zero but was 0.11 ± 0.03 (n = 8, calculated from 16 to 80 stimuli for each cell) for the chick and 0.08 ± 0.03 (n = 5) for the embryo (P = 0.37, Student's unpaired t test). This might indicate that each response window presented here was not the minimum window that each neuron could attain. Even so, we could not obtain a response window in the embryo as narrow as the one in the chick.
Time course of EPSP in NL neurons
The time course of EPSP was compared between the two ages (Fig. 3). EPSPs were extracted from the fourth stimulus during the train of coincident timing (Δt = 0 ms), where most stimuli failed spiking (see Fig. 1A), and were ensemble averaged (Fig. 3A). EPSPs of the chick neurons were followed by an after-hyperpolarization of 1.5 ± 0.03 mV (n = 9, Fig. 3Aa). This suggests that subthreshold EPSPs activate a voltage-dependent outward conductance in chick neurons. This EPSP after-hyperpolarization was not observed in the embryo (Fig. 3Ab, 6 of 6 cells). The time course of EPSP was slower in the embryo (see the superimposed traces in Fig. 3Ac); the 10–90 % rise time was 1.5 times faster and the half-amplitude width was 3 times shorter in the chick than in the embryo (Fig. 3B and C). Figure 3D shows that the time course of EPSP was not affected by the stimulus intensity in either age. The amplitude of EPSP was 3.1 ± 0.5 mV at the threshold intensity to evoke the synaptic transmission and was 6.8 ± 0.3 mV at the intensity just below spiking in the chick (n = 3) and was 3.8 ± 0.3 and 7.4 ± 0.4 mV, respectively, in the embryo (n = 4). The half-amplitude width was 2.2 ± 0.4 and 2.1 ± 0.4 ms in the chick (n = 3, P = 0.85, Student's paired t test), and 5.4 ± 0.5 and 5.6 ± 0.5 ms in the embryo (n = 4, P = 0.79, Student's paired t test). These pairs of EPSP records almost superimposed each other after scaling (Fig. 3Da and b, bottom traces).
Figure 3. Acceleration of EPSPs by development.
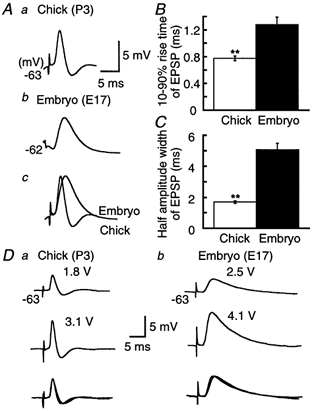
A, ensemble averages of EPSPs. Averaging was made of 16 traces for the chick (a), and 13 traces for the embryo (b), from the fourth EPSP of the train which failed spiking at coincident stimulation (Δt = 0 ms) in Fig. 1A. Time and amplitude calibrations are for a and b. c, traces in a and b were amplitude scaled and superimposed. Ten to ninety per cent rise time (B) and half-amplitude width (C) of EPSP in the chick and the embryo. Measurements were made after taking ensemble averages of 5–20 EPSPs in each cell at the fourth stimulus in the train evoked by coincident stimuli (9 chick neurons and 6 embryonic neurons, from the same set of cells as presented in Fig. 2). Here and in subsequent figures, **P < 0.01 (Student's unpaired t test). D, EPSPs induced by the threshold intensity to evoke the synaptic transmission (top) and the intensity just below generation of action potentials (middle) in the chick (a) and the embryo (b). Five records were averaged for each trace. The stimulus intensity is indicated above each trace. Each pair of traces has been amplitude scaled and superimposed (bottom).
Evoked EPSCs and miniature EPSCs in NL neurons
We have previously demonstrated that the width of the response window correlated with the decay time course of the EPSP (Funabiki et al. 1998). This is in agreement with the observations of the present study (Figs 1–3). Since the decay time course of the EPSP is correlated with the input resistance of the postsynaptic neuron (Funabiki et al. 1998) and is also affected by the size and decay time course of EPSCs, we proceeded to compare the EPSCs between embryonic and chick neurons (Fig. 4). EPSCs were generated at −82 mV by a single stimulus to either ipsilateral or contralateral projection fibres (Fig. 4A and B), and started to be evoked at 4.6 ± 1.4 V (n = 10) for the chick and 4.7 ± 1.0 V (n = 10) for the embryo (threshold intensity). The size was saturated at 32.0 ± 4.0 V (n = 10) in the chick and 31.2 ± 4.6 V (n = 10) in the embryo (saturating intensity). The amplitude of EPSCs generated at the threshold intensity was 0.48 ± 0.08 nA (n = 10) for the chick and 0.53 ± 0.04 nA (n = 10) for the embryo (Fig. 4A, upper traces), both increased with the stimulus intensity and were saturated at 4.4 ± 0.3 nA (n = 10) in the chick and 4.5 ± 0.5 nA (n = 10) in the embryo (Fig. 4A, lower traces). Neither the smallest nor the saturated EPSC amplitudes were significantly different between the two ages (P > 0.1, Student's unpaired t test). Since the stimulus intensity with which the saturated EPSC amplitude was obtained was different from cell to cell, as was the smallest EPSC, we normalized the stimulus intensity by taking the saturating stimulus intensity as 1 (Fig. 4B). The mean EPSC amplitude was calculated and plotted against the normalized stimulus intensity with a bin width of 0.2. The intensity vs. amplitude plots of EPSCs thus created for the embryo and the chick almost superimposed each other (Fig. 4B, P > 0.1 at each bin, Student's unpaired t test).
Figure 4. Development of evoked EPSCs.

A, ensemble averages of EPSCs generated by a stimulus of threshold intensity (upper traces) and saturating intensity (lower traces) in the chick (a) and the embryo (b). Averaging was conducted for 5–10 traces at each intensity. The decay phase of EPSCs was fitted by an exponential function, thin traces. A single exponential function was used for the threshold EPSCs, and the sum of two exponential functions for the saturating EPSCs. The stimulus intensity and the time constant of the exponential functions are indicated above and to the right of each trace, respectively. The relative amplitude of the second exponential function to the first was 0.04 for the chick and 0.08 for the embryo. B, relationship between amplitude and stimulus intensity (scaled) of EPSCs for the chick (open circles) and the embryo (filled circles). Stimulus intensity was normalized for each neuron with a reference to the saturating intensity, 11–54 V. Amplitudes of EPSCs were averaged over the normalized stimulus intensities within a bin width of 0.2 and have been plotted at the centre of each bin indicated on the abscissa. EPSCs at a stimulus intensity of > 1.0 were evoked by the supramaximal intensity for each neuron, 14–59 V. The threshold intensity was between 0.5 and 13 V. The number of EPSCs within a bin width of 0.2 is indicated in parentheses in B. Ten to ninety per cent rise time (C) and decay time constant (D) of EPSCs measured from the EPSCs generated by the threshold intensity. B-D are from 10 chick neurons and 10 embryonic neurons.
The EPSC rising phase (10–90 % rise time) was not different between the two ages (Fig. 4C). The EPSC decay time course was fitted by exponential functions in both chicks and embryos (Fig. 4A, thin traces, time constants as indicated). EPSCs took a single exponential decay time course at the threshold stimulus intensity (Fig. 4A, upper traces); however, the decay time course became a double exponential at the saturating intensity (Fig. 4A, lower traces). The EPSCs induced by the threshold intensity stimuli decayed with a time constant of 0.7 ms in the chick and 1.1 ms in the embryo (Fig. 4A and D). The first EPSC decay time constant generated at the saturating intensity stimulus was the same as that generated at the threshold intensity, and they were smaller in the chick than in the embryo (Fig. 4A). The relative amplitude of the second exponential function to the first was 11.4 ± 2.3 % (n = 10) in the chick and 12.1 ± 1.8 % (n = 10) in the embryo (P = 0.82, Student's unpaired t test).
The lower traces of Fig. 5A represent the ensemble averaged mEPSCs. These two mEPSCs were quantitatively the same in terms of amplitude, 10–90 % rise time, and the time constant of decay (Fig. 5C-E). The frequencies of the mEPSCs were different, being lower in the chick than in the embryo (Fig. 5A, upper traces and B).
Figure 5. Miniature EPSCs in the chick and the embryo.
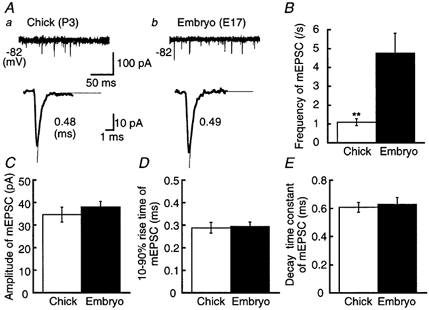
A, mEPSCs in the chick (a) and the embryo (b). Upper traces illustrate four superimposed records to show the frequency of occurrence of mEPSCs. Lower traces show the ensemble averaged mEPSC from 44 records for the chick and 31 records for the embryo. Decay time constants for mEPSCs were measured by fitting a single exponential function (thin traces), and are indicated to the right. Frequency of occurrence (B), amplitude (C), 10–90 % rise time (D) and decay time constant (E) of mEPSCs from 10 chick neurons and 11 embryonic neurons.
As described above, the sizes and the time courses of the EPSCs and mEPSCs were basically the same at the two ages, except for the small differences in the decay time course of the EPSCs, and the frequencies of occurrence of the mEPSCs. This indicates that the nature of synaptic transmission including the sensitivity of postsynaptic receptors may not be very different within the period we investigated. The faster EPSP time course in the chick NL neurons over the embryo (Fig. 3) suggests the possibility of drastic changes in the electrical properties of the postsynaptic membrane during this period.
Membrane properties of NL neurons
The membrane impedance of postsynaptic neurons determines the time course of EPSPs and affects the accuracy of coincidence detection (Reyes et al. 1996; Funabiki et al. 1998). We thus next examined the parameters of membrane excitability and the firing behaviour of NL neurons. Figure 6A illustrates a series of voltage traces recorded at the membrane potential of −65 mV by injecting pulses of constant current. Depolarizing currents generated a single action potential at the onset of current injection in both ages. However, the membrane potential responses were augmented in the embryonic neurons. The input resistance and time constant were about 5 times larger in the embryo than in the chick (Table 1).
The input capacitance was not significantly different between the chick and the embryo in both current clamp and voltage clamp experiments (Table 1). As detailed in Methods, the input capacitance was probably underestimated under voltage clamp conditions. However, comparisons within the same method of measurement revealed that the input capacitance was basically the same between the two ages (P = 0.40 for voltage clamp, and P = 0.43 for current clamp, Student's unpaired t test).
The input resistance was different between the two ages (Table 1), and marked rectification was observed in the embryo (Fig. 6A). By applying a long current pulse of 70–200 ms duration, we defined the rectification index as the ratio of membrane potential changes at the end of a hyperpolarizing current pulse (−0.2 nA) with respect to the depolarizing current pulse of the same intensity (+0.2 nA). The indices were smaller in the chick than in the embryo (Table 1), indicating stronger rectification in the embryo.
The resting membrane potential was the same between the two ages (Table 1), but there were differences in the firing properties. The threshold potential was lower (Fig. 6B, arrows and Table 1), the latency was shorter (Fig. 6B, the time interval between open and filled triangles, 3.2 ms in the chick and 4.3 ms in the embryo), and the maximum rate of rise was larger in the chick than in the embryo (Table 1). Furthermore, a marked after-hyperpolarization followed action potentials in the chick but was negligible in the embryo (Fig. 6B and Table 1). Even subthreshold depolarization was followed by a small after-hyperpolarization in the chick (Fig. 6Ba, see also Fig. 3Aa, EPSP). During the post-hatch period that we examined (P2–7), these membrane properties did not differ; the membrane time constant was 3.5 ± 0.5 ms (n = 11) in P2–3, and 3.2 ± 0.6 ms (n = 10) in P6–7 (P = 0.70, Student's unpaired t test). The maximum rate of rise was 69.8 ± 7.6 and 73.4 ± 10.9 V s−1, and the amplitude of after-hyperpolarization was −8.6 ± 0.7 and −8.4 ± 0.4 mV in P2–3 (n = 11) and P6–7 (n = 10), respectively (P = 0.79 and 0.50, Student's unpaired t test, respectively).
Voltage responses to a train of current pulses were different at the two ages (Fig. 6C). When a train of 15 stimuli at 7 ms intervals was applied, each stimulus generated an action potential and each action potential was followed by an after-hyperpolarization in chick neurons (4 of 4 cells) (Fig. 6Ca). The level of after-hyperpolarization was the same throughout the train. The absence of enhancement of the after-hyperpolarization during a train of stimuli can be explained as being due to the absence of Ca2+-activated K+ conductance (Engel et al. 1999). Consistent with this idea, apamine (1 μm) and iberiotoxin (0.1 μm) did not affect the decay phase of action potentials (data not shown). In contrast to the results obtained with the chick, action potentials in embryonic neurons failed frequently during the stimulus trains (9 of 10 cells), and were not followed by the after-hyperpolarization (all 10 cells examined, Fig. 6Cb). One neuron at E17 generated action potentials at all the stimuli in the train; however, the spike size was reduced significantly to ∼50 % of the first one from the second spike, and remained at that level down the train. After-hyperpolarization was not observed, even when the membrane potential was set at a depolarized level (−56 mV, data not shown).
Contributions of K+ currents to the firing properties of NL neurons
Among the differences found between the two ages, a prominent one was the decrease in the input resistance (Table 1). The small decrease in the rectification index and the increased amplitude of after-hyperpolarization most probably reflect the increased membrane conductance near the resting membrane potentials. In the timing coding auditory neurons, significant expression of both the DTX-sensitive low-threshold K+ channel and the hyperpolarization-activated channel is known (Trussell, 1999), and the TEA-sensitive Kv3.1 K+ channel is proposed to play a critical role in the burst generation of action potentials (Wang et al. 1998). The activities of these ionic channels seem crucial in determining the excitability of NL neurons, and thus were investigated in the following sections.
In the chick, DTX (40 nm) increased the input resistance to approximately twice that of control, from 31.6 ± 4.7 to 61.8 ± 5.3 MΩ (n = 7, P < 0.01, Student's paired t test) (Fig. 7Ab and E). Input resistance was measured at the end of a +0.1 nA current pulse with a duration of 70 ms in these experiments. When action potentials were generated by injection of a shorter current pulse (3 ms), a smaller current was required in DTX (Fig. 7Ab; threshold current intensity was 0.49 ± 0.04 nA in control and 0.28 ± 0.03 nA in the presence of DTX (n = 7, P < 0.01, Student's paired t test). Furthermore, DTX increased the spike peak amplitude, slowed the decay phase of action potentials and eliminated the after-hyperpolarization (Fig. 7Ab); the half-amplitude width of action potentials was 0.85 ± 0.05 ms in control and 1.83 ± 0.10 ms in DTX (n = 7, P < 0.01, Student's paired t test). The resting membrane potential was depolarized by 8.0 ± 2.5 mV (n = 5, P < 0.05, Student's paired t test) by DTX. These results are consistent with the activation of a DTX-sensitive, low-threshold K+ channel at the resting potential. In contrast, high doses of TEA (60 mm) had only small effects on membrane properties (Fig. 7Bb and E); the input resistance was 29.0 ± 3.8 MΩ in control and 39.6 ± 3.8 MΩ in the presence of 60 mm TEA (n = 7, P < 0.05, Student's paired t test). No significant difference in input resistance was observed at 20 mm or lower concentrations of TEA (n = 8, P = 0.23, Student's paired t test).
Figure 7. Effects of K+ channel blockers on action potentials.
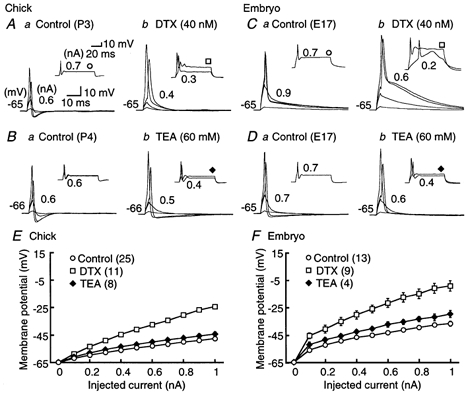
A-D, four superimposed voltage records in response to the short 3 ms current injection in the chick (A and B) and the embryo (C and D); voltage responses generated by 0.1 nA current injection, just below threshold intensity, threshold intensity (indicated in each panel), and 1.0 nA. The insets show two superimposed voltage records in response to the long 70 ms current injection of the threshold intensity and 0.7 nA. The threshold current is indicated near the inset. Here and in Fig. 8A-F, the membrane potential was maintained at around −65 mV by current injection. A and C show the chick and embryo responses to control (a) and DTX (40 nm, b); B and D show the chick and embryo responses to control (a) and TEA (60 mm, b). DTX eliminated after-hyperpolarization, augmented the peak and decelerated the falling phase of action potentials. E and F, current-voltage relations measured at the pulse end of a 70 ms current injection in the chick (E) and the embryo (F). Open circles, control; open squares, DTX; filled diamonds, TEA. The input resistance was significantly increased by DTX in both age groups. The number of cells tested is indicated in parentheses in this figure and in Fig. 8I-J. In the chick the symbol size exceeds the size of the error bars (s.e.m.).
In the embryo, the input resistance was 107.6 ± 9.8 MΩ in control and 198.9 ± 12.9 MΩ in the presence of 40 nm DTX (n = 6, P < 0.05, Student's paired t test) (Fig. 7Cb and F). The threshold current was 0.67 ± 0.07 nA in control and 0.50 ± 0.03 nA in DTX (n = 6, P < 0.05), and the half-amplitude width of the action potential was 1.04 ± 0.06 ms in control and 2.62 ± 0.04 ms in DTX (n = 6, P < 0.01) (Fig. 7Cb). The resting membrane potential was depolarized by 4.3 ± 0.7 mV (n = 5, P < 0.05). The input resistance was 91.0 ± 6.3 MΩ in the control and 130.2 ± 18.7 MΩ in the presence of 60 mm TEA (n = 4, P = 0.11, Student's paired t test) (Fig. 7Db and F). No significant difference in input resistance was observed here either, at 20 mm or lower concentrations of TEA (n = 9, P = 0.30, Student's paired t test).
Contributions of hyperpolarization-activated cation current to the firing properties of NL neurons
The marked sag of the membrane potential during large hyperpolarization is consistent with the activation of a hyperpolarization-activated channel (Fig. 6A and 8). The sag emerged when the membrane potential was hyperpolarized to −85 mV or more at both ages (Fig. 8I and J). Application of Cs+ (3 mm) removed the sag (Fig. 8A and D). Ba2+ (2 mm for chicks and 1 mm for embryos) slightly increased the input resistance but the voltage sag remained (Fig. 8C and F). TEA (20 mm) did not affect the voltage sag (Fig. 8B and E). Figure 8G and H show a series of slowly developing inward currents under voltage clamp conditions. Currents were activated by hyperpolarizing voltage steps from a holding potential of −42 mV, and the activation kinetics became faster at more negative membrane potentials. These slowly developing currents were blocked by application of 3 mm Cs+. These observations are consistent with the expression of hyperpolarization-activated cation channels in NL neurons.
Figure 8. Hyperpolarization-activated current-induced potential sags.
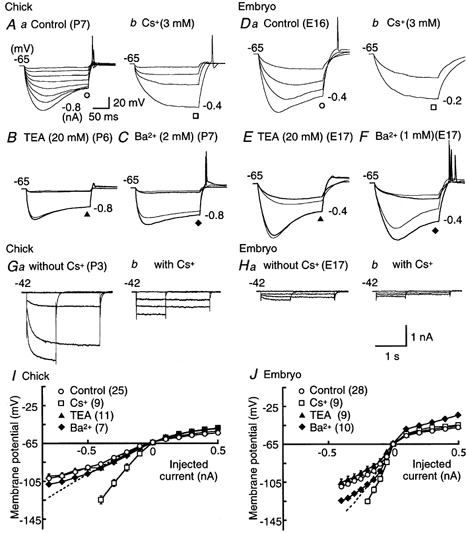
A and D, control (a) and effects of Cs+ (3 mm, b) on voltage responses. Membrane hyperpolarization was induced by 200 ms current injections administered in 0.1 nA increments to the current level indicated in each panel, in the chick (A) and the embryo (D). B and E, control (thin traces) and effects of TEA (20 mm, thick traces) on hyperpolarizing responses in the chick and the embryo, respectively. Membrane hyperpolarization was induced by 200 ms current injections of −0.1 nA at the intensity indicated to the right of each panel. C and F, control (thin traces) and effects of Ba2+ (2 mm in the chick and 1 mm in the embryo, thick traces) on hyperpolarizing responses induced as in B and E. G and H, series of current traces recorded under voltage clamp conditions, in response to hyperpolarizing voltage pulses before and after application of 3 mm Cs+, in the chick and the embryo, respectively. Recordings were made in the artificial cerebrospinal fluid supplemented with 1 mm Ba2+, 0.5 mm 4-aminopyridine, 1 mm TEA, 200 μm Cd2+, and 1 μm TTX. Hyperpolarizing voltage pulses of either 2.5 or 1 s duration were applied from the holding potential of −42 mV in 30 mV steps. A 1 s pulse was applied to −132 mV because a 2.5 s pulse frequently killed the cells. The amplitude of Cs+-sensitive current was about 5 times larger in the chick than in the embryo (1.23 ± 0.10 nA (n = 11) and 0.24 ± 0.03 nA (n = 4), respectively, when measured at the pulse end to −132 mV; P < 0.01, Student's unpaired t test). I and J, current-voltage relations measured at the pulse end of a 200 ms current injection under current clamp conditions, in the chick and the embryo, respectively. Open circles, control; open squares, Cs+; filled triangles, TEA; filled diamonds, Ba2+. Dashed lines indicate peak voltage responses in control. Note that Cs+ removed the sags and increased the input resistance at hyperpolarization, while the sags were not affected by TEA and Ba2+ in either age group.
Ba2+ seemed to affect embryonic neurons (Fig. 8J) more than chick neurons (Fig. 8I), although the effects were not significant. The input resistance was increased by 28 ± 6 % by 2 mm Ba2+ in the chick (n = 5), while the increase by 1 mm Ba2+ in the embryo was 39 ± 14 % (n = 3) (P = 0.5, Student's unpaired t test).
In both age groups, application of Cs+ increased the input resistance to about twice that of the controls (Fig. 8A, D, I and J), from 55.8 ± 8.4 to 130.8 ± 15.1 MΩ in the chick (n = 6); and from 257.0 ± 21.2 to 431.2 ± 13.0 MΩ in the embryo (n = 5) (P < 0.01 and 0.05, Student's paired t test, respectively). The threshold current intensity for generating action potentials was reduced by application of Cs+ in the chick, from 0.75 ± 0.03 to 0.51 ± 0.04 nA (n = 6, P < 0.01, Student's paired t test). This did not occur in the embryo, in which application of Cs+ did not significantly shift the threshold current; under control conditions the threshold current was 0.61 ± 0.06 nA, while in the presence of Cs+ it was 0.60 ± 0.06 nA (n = 8, P = 0.68, Student's paired t test). These effects of Cs+ indicate that a conductance related to the hyperpolarization-activated cation channel is activated at the resting potential, and that it contributes to the firing behaviour of NL neurons, especially in the chick. The hyperpolarization-activated cation channel has weak selectivity among cations; its reversal potential is between −50 and −20 mV (Pape, 1996). This is also consistent with the small hyperpolarization of the resting membrane potential after application of Cs+ for the chick (−6.4 ± 1.4 mV, n = 5, P < 0.05, Student's paired t test), while the voltage change was not significant for the embryo (−1.5 ± 0.5 mV, n = 10, P = 0.11, Student's paired t test).
DISCUSSION
Developmental changes of membrane conductance in NL neurons and coincidence detection
In this paper, we have investigated the mechanism to improve the coincidence detection in the NL neuron of the chicken. Between the embryonic and the early post-hatch days, the response window was improved significantly (Fig. 2). Between these two ages, the nature of synaptic transmission was not very different (Fig. 4 and Fig. 5). However, several drastic changes occurred in the action potentials and in the conductance around the resting membrane potential. Action potentials became faster, possessed a shorter delay and a marked after-hyperpolarization, and could be fired at higher rates in the chick than in the embryo (Fig. 6 and Table 1). The threshold of action potential was shifted toward the negative direction and the maximum rate of rise was increased. These changes probably suggest an increase in the voltage-sensitive Na+ current (Table 1). The input resistance was reduced, and this reduction was mainly due to the increase of two voltage-dependent conductances activated at around the resting potential, the low-threshold K+ current and the hyperpolarization-activated cation current (Fig. 7 and 8). The increase of these conductances during development would make coincidence detection more accurate by shortening the EPSP time course and narrowing the time window for the summation of bilateral EPSPs in the chick (Fig. 3 and Fig. 6–8, and Table 1).
Development of auditory neurons in the chicken
The development of the auditory system in the chicken around the day of hatching has been described. Auditory brainstem responses emerge at E11 and show an adult-like pattern by E21 at low frequency (< 0.8 kHz), and by P2 at middle to high frequency (0.8–2.0 kHz) (Saunders et al. 1973). These observations are consistent with behavioural studies which indicate that the threshold for behavioural responses is frequency dependent and that the mature thresholds are reached by P0 for low frequencies (0.25–0.5 kHz), and by P4 for high frequencies (1–2 kHz) (Gray & Rubel, 1985). The spontaneous firing of NL neurons in vivo is reported to change from an immature rhythmic bursting pattern into an adult-like steady firing between E14 and E19 (Lippe, 1995). Morphological development of NL neurons is also reported to occur during this period. Although dendrites attained the mature configuration at E17–19, the growth of dendritic trees and loss of primary dendrites still continue at a decelerated rate with progressing age, and after P11 the overall appearance of the dendrites became similar to that seen at P25 (Smith, 1981). These observations indicate that the basic developmental changes of the auditory neuron are nearly completed in the days around hatching. A decrease in the input resistance was reported during development in auditory neurons (chickens NM E18-P6: Brenowitz & Trussell, 2001; mice cochlear nucleus P4–38: Wu & Oertel, 1987). The lowering of input resistance in these neurons is accompanied by an increase in the input capacitance. Our present observation that the input capacitance did not change over the period studied (E16-P7, Table 1) might be a consequence of the limited period of observation, but alternatively suggests that the growth and loss of dendrites are balanced over this period in the chicken NL.
Synaptic transmission between NM and NL
Rich expression of AMPA receptors of GluR3 flop and GluR4 flop have been reported in avian auditory neurons (Ravindranathan et al. 2000). Flop-type receptors mediate rapid EPSCs (Mosbacher et al. 1994). The time course of AMPA receptor-mediated EPSC was accelerated around the day of hatching in the NM neurons, mEPSC was shortened and the size was increased, suggesting alterations in postsynaptic receptor subunit composition and faster time course of presynaptic action potentials in the chick (Brenowitz & Trussell, 2001). In the present study in NL neurons, the EPSC time course was accelerated (Fig. 4); however, the time course and the size of the mEPSCs were not different between embryos and chicks (Fig. 5). The latter may indicate that synaptic transmission in the NL is mediated by AMPA receptors that are already indistinguishable in these two age groups. The slower decay of the evoked EPSCs in the embryo (Fig. 4) could be a consequence of non-uniform conduction velocity of presynaptic fibres due to immature myelination (owl: Kubke & Carr, 2000), or of asynchronous transmitter release from immature presynaptic terminals (rat: Chuhma & Ohmori, 1998). However, as the acceleration was so small, its contribution to the acceleration of EPSP time course should be small. At both ages, the decay time course of the saturating EPSCs was fitted by the summation of two exponential functions (Fig. 4A). This second slow component may reflect the delayed clearance of neurotransmitters (Otis et al. 1996), since the EPSCs were completely blocked by 20 μm DNQX, and NMDA components were not present (Funabiki et al. 1998).
The number and the composition of fibres innervating NL neurons may not be very different between the two ages we studied; there was no significant difference in the amplitudes of the smallest and the maximum EPSCs (Fig. 4A), nor in the relationships between the EPSC amplitude and the normalized stimulus intensity (Fig. 4B). From the smallest and the maximum amplitudes of EPSCs, the dynamic range of synaptic transmission was 10.8 ± 1.7 (n = 10) in the chick and 9.4 ± 2.1 (n = 10) in the embryo (P = 0.61, Student's unpaired t test). These numbers should be smaller than the actual number of innervations (20–50 cited as a personal communication from Young & Rubel in Reyes et al. 1996), due to the fact that slice preparations tend to disrupt innervations, and that the estimation of the minimum EPSC size is dependent considerably on the effectiveness of stimulation of individual neurons. We could not estimate the exact number of innervations; however, these results suggest that synaptic transmission between NM and NL is not quantitatively different between the late embryo (E16–17) and the chick (P2–7).
Conductance activated near the resting potential
The DTX-sensitive low-threshold K+ current and the Ba2+-sensitive inward-rectifier K+ current increased 4-fold with development when calculated from the input resistance changes according to each drug. The conductance of the DTX-sensitive current was 4.2 nS in the embryo and 15.6 nS in the chick, and that of the inward-rectifier current was 1.1 and 4.8 nS in the embryo and in the chick, respectively. Since the input capacitance did not differ significantly between these two ages, the increase in conductance would reflect the increase in channel densities during development. The low-threshold K+ current became one of the major conductances activated near the resting potential in the chick, and seems to contribute to the narrowing of the response window. Consistently, the application of low doses of 4-aminopyridine (7 μm, Nacalai), a non-specific antagonist of low-threshold K+ channels, broadened the response window to more than 4 ms in the chick (data not shown). The effects of DTX on the firing properties of NL neurons seem a little different from those of neurons in NM (Rathouz & Trussell, 1998) and in the medial nucleus of the trapezoid body (Brew & Forsythe, 1995). In NM but not in NL, application of DTX induced burst firing, but the decay phase of action potentials was not much affected (Rathouz & Trussell, 1998) (Fig. 7). These differences in the effects of DTX between NM and NL can be explained by the relative paucity of TEA-sensitive, high-threshold K+ current in the NL neurons, because this current would contribute to the rapid repolarization and removal of inactivation of the Na+ channels during action potentials in NM when DTX is applied. Contributions of the TEA-sensitive, high-threshold K+ current to shaping burst firing have been demonstrated in the medial nucleus of the trapezoid body (Brew & Forsythe, 1995; Wang et al. 1998). Recently, immunoreactivity to Kv3.1 was demonstrated in the chick auditory brainstem (Parameshwaran et al. 2001). Kv3.1 is a K+ channel blocked by a low concentration of TEA (1 mm), and this channel is proposed to account for the TEA-sensitive K+ current in auditory neurons (Brew & Forsythe, 1995; Wang et al. 1998). However, consistent with our present observations, the expression of Kv3.1 was less intense in NL somata than in NM.
Membrane hyperpolarization activates the hyperpolarization-activated cation current (Pape, 1996) and the inward-rectifier K+ current (Rudy, 1988). The hyperpolarization-activated cation current is sensitive to Cs+ but insensitive to TEA and Ba2+ (Pape, 1996), while the inward-rectifier K+ current is sensitive to all (Ohmori, 1980; Rudy, 1988; Herok et al. 1998). The hyperpolarization-activated cation current is prominent in the auditory brainstem in both chickens (NM: Zhang & Trussel, 1994; NL: Reyes et al. 1996; Funabiki et al. 1998) and mammals (cochlear nucleus: Oertel, 1983; Golding et al. 1995; superior olivary complex: Banks et al. 1993; Smith, 1995; Cuttle et al. 2001). In our study, Cs+ (3 mm) suppressed the sag during membrane hyperpolarization (Fig. 8A and D), however the sag remained after application of Ba2+ and TEA (Fig. 8B, C, E and F). Cs+ suppressed the slowly developing inward currents which were activated by hyperpolarizing voltage steps (Fig. 8G and H). Between the two age groups studied, the conductance of the hyperpolarization-activated cation current estimated under current clamp conditions increased about 6-fold, from 1.6 to 10.3 nS, and the hyperpolarization-activated cation current becomes another major current activated at around the resting potential in the chick.
In this report, we have shown that the accuracy of coincidence detection was improved significantly from the late embryonic to the early post-hatching days of the chicken, and that the improvement was mainly due to the increased conductance of both low-threshold K+ channels and hyperpolarization-activated cation channels. The accuracy of coincidence detection we observed here was still broad (1 ms in the chick) in comparison to the physiological expectation of the chicken (less than 0.2 ms, see Hyson et al. 1994). However, we believe that our present observations provide a clue to the understanding of fundamental neuronal mechanisms to achieve the temporal acuity of binaural hearing in birds.
Acknowledgments
We thank Professor K. Kuba for valuable suggestions and careful reading of this manuscript, Mr M. Fukao for technical support in preparing the equipment, and Drs T. M. Ishii and N. Chuhma for discussions. This study was supported by a Grant-in-aid from the Ministry of Education to H.O. (12053233).
REFERENCES
- Banks MI, Pearce RA, Smith PH. Hyperpolarization-activated current (Ih) in neurons of the medial nucleus of the trapezoid body: voltage-clamp analysis and enhancement by norepinephrine and cAMP suggest a modulatory mechanism in the auditory brain stem. Journal of Neurophysiology. 1993;70:1420–1432. doi: 10.1152/jn.1993.70.4.1420. [DOI] [PubMed] [Google Scholar]
- Brenowitz S, Trussell LO. Maturation of synaptic transmission at end-bulb synapses of the cochlear nucleus. Journal of Neuroscience. 2001;21:9487–9498. doi: 10.1523/JNEUROSCI.21-23-09487.2001. [DOI] [PMC free article] [PubMed] [Google Scholar]
- Brew HM, Forsythe ID. Two voltage-dependent K+ conductances with complementary functions in postsynaptic integration at a central auditory synapse. Journal of Neuroscience. 1995;15:8011–8022. doi: 10.1523/JNEUROSCI.15-12-08011.1995. [DOI] [PMC free article] [PubMed] [Google Scholar]
- Bruckner S, Hyson RL. Effect of GABA on the processing of interaural time differences in nucleus laminaris neurons in the chick. European Journal of Neuroscience. 1998;10:3438–3450. doi: 10.1046/j.1460-9568.1998.00353.x. [DOI] [PubMed] [Google Scholar]
- Carr CE, Konishi M. A circuit for detection of interaural time differences in the brain stem of the barn owl. Journal of Neuroscience. 1990;10:3227–3246. doi: 10.1523/JNEUROSCI.10-10-03227.1990. [DOI] [PMC free article] [PubMed] [Google Scholar]
- Chuhma N, Ohmori H. Postnatal development of phase-locked high-fidelity synaptic transmission in the medial nucleus of the trapezoid body of the rat. Journal of Neuroscience. 1998;18:512–520. doi: 10.1523/JNEUROSCI.18-01-00512.1998. [DOI] [PMC free article] [PubMed] [Google Scholar]
- Cuttle MF, Rusznak Z, Wong AYC, Owens S, Forsythe ID. Modulation of a presynaptic hyperpolarization-activated cationic current (Ih) at an excitatory synaptic terminal in the rat auditory brainstem. Journal of Physiology. 2001;534:733–744. doi: 10.1111/j.1469-7793.2001.00733.x. [DOI] [PMC free article] [PubMed] [Google Scholar]
- Engel J, Schultens HA, Schild D. Small conductance potassium channels cause an activity-dependent spike frequency adaptation and make the transfer function of neurons logarithmic. Biophysical Journal. 1999;76:1310–1319. doi: 10.1016/S0006-3495(99)77293-0. [DOI] [PMC free article] [PubMed] [Google Scholar]
- Funabiki K, Koyano K, Ohmori H. The role of GABAergic inputs for coincidence detection in the neurones of nucleus laminaris of the chick. Journal of Physiology. 1998;508:851–869. doi: 10.1111/j.1469-7793.1998.851bp.x. [DOI] [PMC free article] [PubMed] [Google Scholar]
- Goldberg JM, Brown PB. Response of binaural neurons of dog superior olivary complex to dichotic tonal stimuli: some physiological mechanisms of sound localization. Journal of Neurophysiology. 1969;32:613–636. doi: 10.1152/jn.1969.32.4.613. [DOI] [PubMed] [Google Scholar]
- Golding NL, Robertson D, Oertel D. Recordings from slices indicate that octopus cells of the cochlear nucleus detect coincident firing of the auditory nerve fibers with temporal precision. Journal of Neuroscience. 1995;15:3138–3153. doi: 10.1523/JNEUROSCI.15-04-03138.1995. [DOI] [PMC free article] [PubMed] [Google Scholar]
- Gray L, Rubel EW. Development of absolute threshold in chickens. Journal of the Acoustical Society of America. 1985;77:1162–1172. doi: 10.1121/1.392180. [DOI] [PubMed] [Google Scholar]
- Hagiwara S, Ohmori H. Studies of calcium channels in rat clonal pituitary cells with patch electrode voltage clamp. Journal of Physiology. 1982;331:231–252. doi: 10.1113/jphysiol.1982.sp014371. [DOI] [PMC free article] [PubMed] [Google Scholar]
- Herok GH, Millar TJ, Anderton PJ, Martin DK. Characterization of an inwardly rectifying potassium channel in the rabbit superior lacrimal gland. Investigative Ophthalmology and Visual Science. 1998;39:308–314. [PubMed] [Google Scholar]
- Hyson RL, Overholt EM, Lippe WR. Chochlear microphonic measurements of interaural time differences in the chick. Hearing Research. 1994;81:109–118. doi: 10.1016/0378-5955(94)90158-9. [DOI] [PubMed] [Google Scholar]
- Jeffress LA. A place theory of sound localization. Journal of Comparative and Physiological Psychology. 1948;41:35–39. doi: 10.1037/h0061495. [DOI] [PubMed] [Google Scholar]
- Joseph AW, Hyson RL. Coincidence detection by binaural neurons in the chick brain stem. Journal of Neurophysiology. 1993;69:1197–1211. doi: 10.1152/jn.1993.69.4.1197. [DOI] [PubMed] [Google Scholar]
- Klumpp RG, Eady HR. Some measurements of interaural time difference thresholds. Journal of the Acoustical Society of America. 1956;28:859–860. [Google Scholar]
- Kubke MF, Carr CE. Development of the auditory brainstem of birds: comparison between barn owls and chickens. Hearing Research. 2000;147:1–20. doi: 10.1016/s0378-5955(00)00116-7. [DOI] [PubMed] [Google Scholar]
- Lippe WR. Relationship between frequency of spontaneous bursting and tonotopic position in the developing avian auditory system. Brain Research. 1995;703:205–213. doi: 10.1016/0006-8993(95)01096-3. [DOI] [PubMed] [Google Scholar]
- Lippe WR, Rubel EW. Ontogeny of tonotopic organization of brain stem auditory nuclei in the chicken: implications for development of the place principle. Journal of Comparative Neurology. 1985;237:273–289. doi: 10.1002/cne.902370211. [DOI] [PubMed] [Google Scholar]
- Moiseff A, Konishi M. Neuronal and behavioral sensitivity to binaural time differences in the owl. Journal of Neuroscience. 1981;1:40–48. doi: 10.1523/JNEUROSCI.01-01-00040.1981. [DOI] [PMC free article] [PubMed] [Google Scholar]
- Mosbacher J, Schoepfer R, Monyer H, Burnashev N, Seeburg PH, Ruppersberg JP. A molecular determinant for submillisecond desensitization in glutamate receptors. Science. 1994;266:1059–1062. doi: 10.1126/science.7973663. [DOI] [PubMed] [Google Scholar]
- Oertel D. Synaptic responses and electrical properties of cells in brain slices of the mouse anteroventral cochlear nucleus. Journal of Neuroscience. 1983;3:2043–2053. doi: 10.1523/JNEUROSCI.03-10-02043.1983. [DOI] [PMC free article] [PubMed] [Google Scholar]
- Ohmori H. Dual effects of K ions upon the inactivation of the anomalous rectifier of the tunicate egg cell membrane. Journal of Membrane Biology. 1980;53:143–156. [Google Scholar]
- Otis TS, Wu YC, Trussell LO. Delayed clearance of transmitter and the role of glutamate transporters at synapses with multiple release sites. Journal of Neuroscience. 1996;16:1634–1644. doi: 10.1523/JNEUROSCI.16-05-01634.1996. [DOI] [PMC free article] [PubMed] [Google Scholar]
- Overholt EM, Rubel EW, Hyson RL. A circuit for coding interaural time differences in the chick brainstem. Journal of Neuroscience. 1992;12:1698–1708. doi: 10.1523/JNEUROSCI.12-05-01698.1992. [DOI] [PMC free article] [PubMed] [Google Scholar]
- Pape HC. Queer current and pacemaker: the hyperpolarization-activated cation current in neurons. Annual Review of Physiology. 1996;58:299–327. doi: 10.1146/annurev.ph.58.030196.001503. [DOI] [PubMed] [Google Scholar]
- Parameshwaran S, Carr CE, Perney TM. Expression of the Kv3. 1 potassium channel in the avian auditory brainstem. Journal of Neuroscience. 2001;21:485–494. doi: 10.1523/JNEUROSCI.21-02-00485.2001. [DOI] [PMC free article] [PubMed] [Google Scholar]
- Parks TN, Rubel EW. Organization and development of brain stem auditory nuclei of the chicken: organization of projections from N. magnocellularis to N. laminaris. Journal of Comparative Neurology. 1975;164:435–448. doi: 10.1002/cne.901640404. [DOI] [PubMed] [Google Scholar]
- Raman IM, Zhang S, Trussell LO. Pathway-specific variants of AMPA receptors and their contribution to neuronal signaling. Journal of Neuroscience. 1994;14:4998–5010. doi: 10.1523/JNEUROSCI.14-08-04998.1994. [DOI] [PMC free article] [PubMed] [Google Scholar]
- Rathouz M, Trussell LO. Characterization of outward currents in neurons of the avian nucleus magnocellularis. Journal of Neurophysiology. 1998;80:2824–2835. doi: 10.1152/jn.1998.80.6.2824. [DOI] [PubMed] [Google Scholar]
- Ravindranathan A, Donevan SD, Sugden SG, Greig A, Rao MS, Parks TN. Contrasting molecular composition and channel properties of AMPA receptors on chick auditory and brainstem motor neurons. Journal of Physiology. 2000;523:667–684. doi: 10.1111/j.1469-7793.2000.00667.x. [DOI] [PMC free article] [PubMed] [Google Scholar]
- Reyes AD, Rubel EW, Spain WJ. In vitro analysis of optimal stimuli for phase-locking and time-delayed modulation of firing in avian nucleus laminaris neurons. Journal of Neuroscience. 1996;16:993–1007. doi: 10.1523/JNEUROSCI.16-03-00993.1996. [DOI] [PMC free article] [PubMed] [Google Scholar]
- Rudy B. Diversity and ubiquity of K channels. Neuroscience. 1988;25:729–749. doi: 10.1016/0306-4522(88)90033-4. [DOI] [PubMed] [Google Scholar]
- Saunders JC, Coles RB, Gates GR. The development of auditory evoked responses in the cochlea and cochlear nuclei of the chick. Brain Research. 1973;63:59–74. doi: 10.1016/0006-8993(73)90076-0. [DOI] [PubMed] [Google Scholar]
- Smith PH. Structural and functional differences distinguish principal from nonprincipal cells in the guinea pig MSO slice. Journal of Neurophysiology. 1995;73:1653–1667. doi: 10.1152/jn.1995.73.4.1653. [DOI] [PubMed] [Google Scholar]
- Smith ZDJ. Organization and development of brain stem auditory nuclei of the chicken: dendritic development in N. laminaris. Journal of Comparative Neurology. 1981;203:309–333. doi: 10.1002/cne.902030302. [DOI] [PubMed] [Google Scholar]
- Trussell LO. Synaptic mechanisms for coding timing in auditory neurons. Annual Review of Physiology. 1999;61:477–496. doi: 10.1146/annurev.physiol.61.1.477. [DOI] [PubMed] [Google Scholar]
- Wang LY, Gan L, Forsythe ID, Kaczmarek LK. Contribution of the Kv3. 1 potassium channel to high-frequency firing in mouse auditory neurones. Journal of Physiology. 1998;509:183–194. doi: 10.1111/j.1469-7793.1998.183bo.x. [DOI] [PMC free article] [PubMed] [Google Scholar]
- Wu SH, Oertel D. Maturation of synapses and electrical properties of cells in the cochlear nuclei. Hearing Research. 1987;30:99–110. doi: 10.1016/0378-5955(87)90187-0. [DOI] [PubMed] [Google Scholar]
- Yin TCT, Chan JCK. Interaural time sensitivity in medial superior olive of cat. Journal of Neurophysiology. 1990;64:465–488. doi: 10.1152/jn.1990.64.2.465. [DOI] [PubMed] [Google Scholar]
- Young SR, Rubel EW. Frequency-specific projections of individual neurons in chick brainstem auditory nuclei. Journal of Neuroscience. 1983;3:1373–1378. doi: 10.1523/JNEUROSCI.03-07-01373.1983. [DOI] [PMC free article] [PubMed] [Google Scholar]
- Zhang S, Trussell LO. A characterization of excitatory postsynaptic potentials in the avian nucleus magnocellularis. Journal of Neurophysiology. 1994;72:705–718. doi: 10.1152/jn.1994.72.2.705. [DOI] [PubMed] [Google Scholar]