Abstract
Insulin-secreting MIN6 cells overexpressing uncoupling protein-1 (UCP1) were studied regarding insulin secretion in response to various secretagogues. Overexpression of UCP1 prevented an increase of cytosolic ATP levels induced by glucose. In contrast, glucose utilization was not affected, nor was glycerol phosphate flux. The UCP1-expressing cells showed an inability to increase cytosolic Ca2+ concentration ([Ca2+]i) in response to glucose or α ketoisocaproate and this resulted in less insulin secretion, whereas initial reduction in [Ca2+]i occurring upon either nutrient addition was not affected. Moreover, the effectiveness of tolbutamide on [Ca2+]i increase was reduced and the dose-response relations for insulin secretion induced by the agent was shifted toward the right in the UCP1-expressing cells. The resting membrane potential of the UCP1-expressing cells was significantly hyperpolarized by 6.2 mV compared with control cells. In the perforated and conventional whole-cell patch-clamp configurations, the conductance density of ATP-sensitive K+ (KATP) channels of the UCP1-expressing cells was 6-fold and 1.7-fold greater than that of the control cells, respectively. The sensitivity of KATP channels for tolbutamide was not different between two groups, indicating that in intact cells more than 6-fold higher concentrations of tolbutamide were required to reduce the KATP channel currents of UCP1-expressing cells to the same levels as of the control cells. The current density of the voltage-dependent Ca2+ channels was not influenced. In conclusion, UCP1-expressing cells showed a refractoriness to respond to tolbutamide as well as nutrients. An upregulated activity of KATP channels was associated with unresponsiveness to the agent in the cells with impaired mitochondrial function.
Several mitochondrial disorders linked to mutations in the mitochondrial genome, such as myoclonic epilepsy with ragged-red fibres, mitochondrial myopathy, encephalopathy, lactic-acidosis and stroke-like episodes, and maternally inherited diabetes and deafness (MIDD), are associated with diabetes mellitus (Reardon et al. 1992; van den Ouweland et al. 1992; Gerbitz et al. 1993; and see reviews in Maassen & Kadowaki, 1996; Simon & Johns, 1999). Mitochondrial oxidative phosphorylation plays a crucial role in glucose-induced insulin secretion in pancreatic β cells. Energy supply in mitochondrial metabolism accounts for 98 % of the total ATP production of islets when challenged with high glucose (Erecinska et al. 1992). Increase in ATP/ADP as a consequence of glucose metabolism blocks ATP-sensitive K+ (KATP) channels followed by plasma membrane depolarization. This results in activation of voltage-dependent Ca2+ channels (VDCCs) and an increase in the cytosolic Ca2+ concentration ([Ca2+]i), which is a key regulator of insulin secretion (Ashcroft & Rorsman, 1989). There have been several lines of in vitro experiments revealing impaired glucose-stimulated insulin secretion associated with mitochondrial dysfunction by depleting mitochondrial DNA of β cell lines with chemicals (Soejima et al. 1996; Hayakawa et al. 1998; Kennedy et al. 1998; Tsuruzoe et al. 1998) or overexpressing uncoupling proteins (Chan et al. 1999; Hong et al. 2001). More recently, a mouse model for mitochondrial diabetes was created by tissue-specific disruption of mitochondrial transcription factor A (Silva et al. 2000). The refractoriness of insulin secretion to glucose was reported to be due to compromised ATP production via a mitochondrial oxidative phosphorylation pathway (Kennedy et al. 1998; Tsuruzoe et al. 1998; Hong et al. 2001). Likewise, the reduced increase in [Ca2+]i in response to glibencramide, a potent sulphonylurea, has been reported in a β cell line losing mitochondrial DNA (Tsuruzoe et al. 1998). The mechanisms of impaired [Ca2+]i increase in the cells with mitochondrial dysfunction, however, remain to be elucidated.
The pancreatic β cell line MIN6 retains the ability to secrete insulin in response to the physiological glucose concentration (Miyazaki et al. 1990). Furthermore, the characteristics of glucose transport and metabolism in MIN6 cells closely resemble those of isolated islets (Ishihara et al. 1993) and the increase in [Ca2+]i depends on glucose metabolism (Sakurada et al. 1993). Taken together, the features of this cell line make it a suitable model for studying regulation of [Ca2+]i and ionic currents induced by glucose or other secretagogues.
In the present study, we overexpressed uncoupling protein 1 (UCP1) using gene transduction with adenovirus and switched the energy produced by oxidation of substrates from the phosphorylation of ADP to the formation of heat (Casteilla et al. 1990). The effects of mitochondrial dysfunction were studied on ionic currents, regulation of [Ca2+]i and insulin secretion stimulated by several secreta-gogues in MIN6 cells. The UCP1-expressing cells showed refractoriness not only to nutrients but also to tolbutamide, although the effects of KCl were preserved. The possible mechanisms of the refractoriness to these secretagogues are discussed.
METHODS
Reagents and solutions
Dulbecco's modified Eagle's medium (DMEM), tolbutamide and amphotericin B were from Sigma Chemical Co. (St Louis, MO, USA). Fura-2 acetoxymethyl ester was purchased from Dojindo (Kumamoto, Japan). Adenosine-5′-triphosphate (ATP-2Na), adenosine-5′-diphosphate (ADP-Na) and guanosine-5′-triphosphate (GTP-2Na) were obtained from Boehringer Mannheim GmbH (Mannheim, Germany). Krebs-Ringer-bicarbonate buffer solution (KRBB) was composed of (mm): 109 NaCl, 4.7 KCl, 2 CaCl2, 1.2 MgCl2, 1.2 KH2PO4 and 25 NaHCO3 (pH 7.4, adjusted with 10 mm Hepes-NaOH). In the patch-clamp experiment, the pipette solution for measurements of Ca2+ channel current was composed of the following to keep potassium channel currents as minimal as possible (mm): 75 aspartate, 30 tetraethylammonium chloride, 1 CaCl2, 3 MgCl2, 11 EGTA, 3 ATP-2Na, 0.1 GTP-2Na and 11 Hepes (pH 7.2, adjusted with CsOH; final Cs+ concentration was 102 mm with an osmolarity of 250 mosmol l−1). The external solution contained (mm): 120 Tris-Cl, 2 CaCl2 and 10 Hepes (pH 7.3, adjusted with HCl; 245 mosmol l−1). KATP channel current was measured using perforated and conventional whole-cell clamp configurations. In the perforated mode, the pipette solution contained (mm): 40 K2SO4, 50 KCl, 2 MgCl2, 0.5 EGTA and 10 Hepes (pH 7.2, adjusted with KOH; K+ concentration of 135 mm and 235 mosmol l−1). The solution also contained amphotericin B (dissolved in DMSO as 6 mg (100 μl)−1) at a final concentration of 240 μg ml−1. In the conventional whole-cell mode, the internal solution contained (mm): 50 KCl, 35 K2SO4, 2 MgCl2, 11 EGTA, 1 CaCl2, 0.1 ATP-2Na, 0.1 ADP-Na and 11 Hepes (pH 7.2, adjusted with KOH; 150 mm K+ and 238 mosmol l−1).
Generation of recombinant adenoviruses
Murine UCP1 cDNA (Kozak et al. 1988) was from Professor Leslie P. Kozak (Pennington Biomedical Research Center, Baton Rouge, LA, USA). Recombinant adenoviruses bearing murine UCP1 cDNA were generated as described previously (Niwa et al. 1991; Miyake et al. 1996). As a control, a recombinant adenovirus bearing the bacterial β-galactosidase gene (Adex1CAlacZ) was used (Kanegae et al. 1995).
Culture and adenovirus infection of MIN6 cells
MIN6 cells were from Professor J.-I. Miyazaki (Osaka University, Osaka, Japan). The cells at passage 23–30 were cultured in DMEM supplemented with 25 mm glucose, 50 mg l−1 streptomycin, 75 mg l−1 penicillin and 15 % fetal calf serum under the condition of 5 % CO2 and 95 % air at 37 °C as described previously (Ishihara et al. 1996). The cells were incubated in media containing the adenoviruses for 1 h at 37 °C, and the growth medium was then added. Recombinant adenoviruses were used with a mutiplicity of infection (m.o.i.) of between 30 and 50. Three days later, the cells were seeded in a 24-well multiwell plate or a 25 cm2 culture bottle. Two days later, the assays were performed.
Western blotting
The MIN6 cell lysates (10 μg per protein lane) were subjected to SDS-PAGE (10 %) and then probed with anti-UCP1 antiserum (Casteilla et al. 1990), from Professor D. Ricquier (CNRS, Meudon, France). Blots were developed using ECL reagents (Amersham, Buckinghamshire, UK).
Measurement of ATP
Two hundred thousand cells in each group of the controls or UCP1-expressing MIN6 cells were incubated in 1 ml of DMEM in 24-well plates at 37 °C. Following preincubation with KRBB containing 3 mm glucose and 0.1 % bovine serum albumin (BSA) for 30 min, the cells were washed twice with KRBB and incubated in 1 ml of KRBB with the indicated concentrations of glucose (3 and 30 mm) for 90 min. Incubations were stopped by cooling the plate on ice and addition of 77 μl of 70 % perchloric acid (v/v), then the cells were scraped and disrupted by sonication. Cell extracts were subsequently neutralized to pH 7.0–7.5 with 96 μl of 10 m NaOH. ATP content of the islets was then determined using an ATP determinant kit (Molecular Probes, Eugene, OR, USA) on an LKB luminometer. Protein content of the same sample was determined using a Bio-Rad protein assay kit (Bio-Rad, Hercules, CA, USA).
Measurement of [5-3H]glucose utilization and [2-3H]glycerol metabolism
Glucose utilization estimated by conversion of [5-3H]glucose into 3H2O and glycerol metabolism estimated by conversion of [2-3H]glycerol into 3H2O were measured as described previously (Ishihara et al. 1993; Ishihara et al. 1996).
Measurement of [Ca2+]i
Cytosolic [Ca2+]i was measured by dual-wavelength fura-2 microfluorometry as has been reported (Yaekura et al. 1996). Single cells on coverslips were incubated with 1 μm fura-2 acetoxymethyl ester for 30 min at 37 °C in KRBB containing 3 mm glucose and 0.1 % BSA. The fura-2-loaded cells were excited at 340 and 380 nm alternately, the emission signals at 510 nm were detected every 2.5 s by an intensified charge-coupled device (ICCD) camera, and the ratio was produced by an Argus-50 system (Hamamatsu Photonix, Hamamatsu, Japan). Ratio values were converted to [Ca2+]i according to calibration curves obtained from the relationship between the free Ca2+ concentration and the ratio determined in a cytosol-mimicking solution using calcium-EGTA buffer and fura-2 free acid.
Measurement of insulin secretion
Insulin secretion was determined using a static incubation method (60 min) as described previously (Ishihara et al. 1996). Briefly, 2 × 10⁵ MIN6 cells were incubated for 30 min in KRBB containing 3 mm glucose and 0.1 % BSA for stabilization. The cells were then incubated at 37 °C for 60 min in 1 ml test solutions. Incubations were stopped by cooling on ice and after centrifugation aliquots were collected for insulin assay using an enzyme immunoassay kit (Morinaga, Yokohama, Japan).
Electrophysiology
A standard patch-clamp technique (Hamill et al. 1981) was used to record KATP channel or VDCC currents. The current was recorded using an amplifier (Axopatch 200B, Axon Instruments, Inc., Union City, CA, USA) and stored on a PCM digital data recorder (TEAC, RD-125T, Tokyo, Japan). Replayed data were then processed using a low-pass filter (24 dB octave−1, NF E-3201A, Tokyo, Japan) at a cut-off frequency of 1 kHz, and stored for later analysis in a computer (IBM, Tokyo, Japan) with pCLAMP6 software. The experiments were performed at room temperature (22–25 °C).
Statistical analysis
All values were presented as mean ± s.e.m. Student's unpaired t test was used to analyse the significance of measurements between two groups. In the case of more than three groups, one-way analysis of variance was used to evaluate the significance. The Scheffé post test was used to compare pairs of group means. The value of P < 0.05 was taken as a significant difference.
RESULTS
Expression of UCP1 protein in MIN6 cells
We initially compared UCP1 protein levels to confirm that the transfection using adenovirus had succeeded (Fig. 1A). In Western blot analysis, UCP1 protein was undetectable in the control MIN6 cells in accordance with the finding that only UCP2 is expressed in pancreatic islets (Fleury et al. 1997; Shimabukuro et al. 1997). However, a large amount of protein at the position of 32 kDa was successfully found in the cells infected with murine UCP1 cDNA.
Figure 1. Expression of UCP1 and its influence upon glucose metabolism.
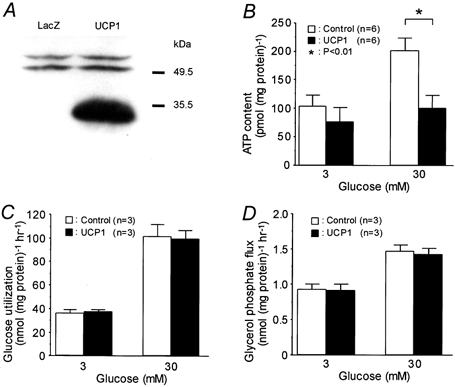
A, Western blot analysis of UCP1 protein in MIN6 cells infected with a recombinant adenovirus with Escherichia coli lacZ or with murine UCP1 cDNA. B, ATP content in MIN6 cells using static incubation for 90 min at the indicated glucose concentrations. C and D, glucose utilization and glycerol phosphate flux were measured at the indicated glucose concentrations.
Overexpression of UCP1 abolishes glucose-induced increase in cytosolic ATP levels
Intracellular ATP levels were measured after static incubation with different concentrations of glucose (Fig. 1B). There was no significant difference in the ATP contents under 3 mm glucose between the controls and UCP1-expressing cells (105 ± 20 and 79 ± 25 pmol (mg protein)−1, respectively; P = 0.70). The ATP content was significantly increased by treating with 30 mm glucose in the control (P < 0.01), but not in UCP1-expressing cells. The values were 203 ± 22 and 103 ± 21 pmol (mg protein)−1 in the control and UCP1 groups, respectively, and significantly different (P < 0.01). 3H2O production from [5-3H]glucose was not different between the controls and UCP1-expressing cells, nor was 3H2O production from [2-3H]glycerol (Fig. 1C and D). These findings suggest that overexpression of UCP1 neither influenced glycolytic flux nor glycerol phosphate shuttle activity, although the amount of 3H2O production from [2-3H]glycerol may not have precisely reflected the H2O originating from the glycerol phosphate shuttle (Giroix et al. 1992).
UCP1-expressing cells show an inability to increase [Ca2+]i and insulin secretion in response to nutrients
The [Ca2+]i levels in response to 30 mm glucose were compared between the controls and UCP1-expressing cells (Fig. 2A). The peak [Ca2+]i levels measured during exposure to glucose were significantly lower in UCP1-expressing cells than in the control cells (258 ± 7 and 138 ± 6 nm in the control and UCP1 groups, respectively; P < 0.01). We then compared insulin secretion in response to various concentrations of glucose using static incubation between the two groups (Fig. 2B). Insulin release was significantly increased at glucose concentrations ≥ 10 mm in the control compared with that at 1 mm glucose (P < 0.05 at 10 mm and P < 0.01 at 15 and 25 mm glucose). Furthermore, it was also significantly increased at glucose concentrations ≥ 15 mm in the UCP1-expressing group (P < 0.01 at 15 and 25 mm glucose). The insulin secretion of the UCP1 group was significantly lower at 15 and 25 mm glucose compared with those of the control in each corresponding condition (in the control vs. UCP1 groups, 454 ± 33 and 299 ± 34 ng (mg protein)−1 h−1 at 15 mm glucose, P < 0.01; 759 ± 33 and 368 ± 23 ng (mg protein)−1 h−1 at 25 mm glucose, P < 0.01).
Figure 2. UCP1-expressing cells showed reduced responsiveness to glucose.
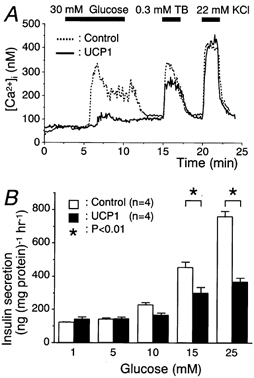
A, the cells were superfused with KRBB containing 3 mm glucose for 5 min before changing to KRBB supplemented with 30 mm glucose. Tracings are representative in controls (n = 100) or UCP1-expressing cells (n = 102). B, insulin secretions stimulated by the indicated glucose concentrations for 60 min are shown.
A similar analysis was performed with respect to 20 mm α-ketoisocaproate (KIC; Fig. 3A). Consistent with the findings of glucose stimulation, the peak [Ca2+]i levels induced by KIC was significantly lower in the UCP1-expressing cells than in the control cells (307 ± 14 and 193 ± 8 nm in the control and UCP1 groups, respectively; P < 0.01). The UCP1-expressing cells lost the ability to release insulin in response to α ketoisocaproate at concentrations ≥ 5 mm, whereas glucose greater than 10 mm retained some stimulatory action (Fig. 2B and Fig. 3B). This may be due to the ATP-producing effect of glucose metabolism to some extent through glycolysis as compared to the KIC, which is exclusively a mitochondrial substrate.
Figure 3. UCP1-expressing cells exhibited low responsiveness to α-ketoisocaproate (KIC).
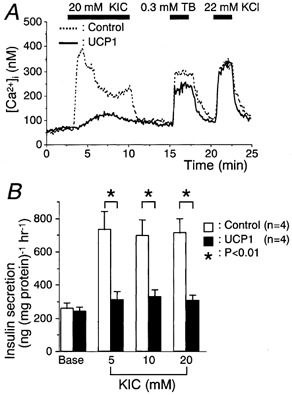
A, the same protocols as in Fig. 2 were used except for exposure to 20 mm KIC instead of glucose. Tracings are representative in controls (n = 82) or UCP1-expressing cells (n = 82). B, insulin secretions stimulated by 3 mm glucose and the indicated concentrations of KIC for 60 min are shown.
The frequency of initial reduction in [Ca2+]i levels between two groups was not different in either glucose stimulation (80 and 83 % in the control and UCP1 groups, respectively; P = 0.58, chi-square test for independence) or KIC stimulation (71 and 81 % in the control and UCP1 groups, respectively; P = 0.07). The initial lowering of [Ca2+]i levels is reportedly due to ATP-dependent activation of Ca2+-ATPase (Chow et al. 1995). Therefore, UCP-1-independent ATP production may be involved in the Ca2+ lowering effect or a minimum increase of ATP may be enough to sequestrate intracellular Ca2+.
Effects of tolbutamide and KCl on both [Ca2+]i and insulin release
The [Ca2+]i levels in response to 0.3 mm tolbutamide or 22 mm KCl (Fig. 2A and Fig. 3A) were compared between the controls (n = 182) and UCP1-expressing cells (n = 184). The [Ca2+]i levels at the basal state (3 mm glucose) were not significantly different between the control (65 ± 2 nm) and UCP1 groups (68 ± 2 nm; P = 0.36). The peak [Ca2+]i levels induced by tolbutamide were significantly different between the two groups (329 ± 6 and 287 ± 6 nm in the control and UCP1 groups, respectively; P < 0.01). In contrast, the peak [Ca2+]i levels of the two groups were comparable in the case of KCl stimulation (445 ± 5 and 435 ± 5 nm in the control and UCP1 groups, respectively; P = 0.14).
The [Ca2+]i levels in response to tolbutamide was dose-dependently elevated by increasing the concentration in both groups, although the [Ca2+]i response at each concentration in the UCP1-expressing cells was lower (Fig. 4A). In the dose-response relations for tolbutamide concentrations, the line representing the percentage of cells revealing a [Ca2+]i increase ≥ 3-fold the basal levels was shifted to 2.5-fold higher concentrations of tolbutamide in the UCP1 group (Fig. 4B).
Figure 4. UCP1-expressing cells showed low response to tolbutamide in both [Ca2+]i increases and insulin secretion.
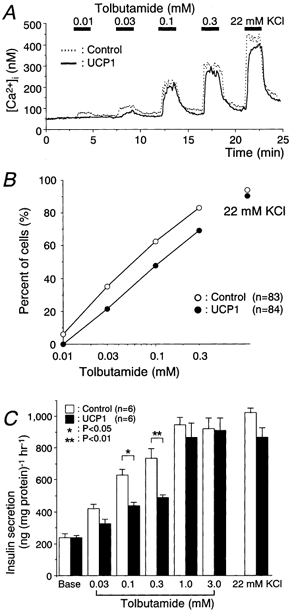
A, [Ca2+]i in response to tolbutamide at the indicated concentrations was measured. Tracings are representative in controls (n = 83) or UCP1-expressing cells (n = 84). The glucose concentration was 3 mm throughout these experiments. B, percentage of cells showing an increase in the peak [Ca2+]i levels ≥ 3-fold basal levels was plotted against the indicated concentration of tolbutamide. C, insulin secretion at the indicated concentrations of tolbutamide or 22 mm KCl under static incubation for 60 min.
Dose-response relations for insulin secretion stimulated by tolbutamide were shifted toward the right, showing less secretion at the concentrations of 0.1 and 0.3 mm in the UCP1-expressing cells (Fig. 4C). There was no difference in insulin secretion by 22 mm KCl between the two groups.
UCP1-expressing cells show upregulated activity of KATP channels
It is suggested that downregulation of VDCCs or upregulated activity of KATP channels may be a cause of impaired [Ca2+]i increase in response to tolbutamide in the UCP1-expressing cells. Therefore, we measured the activity of these channel currents. The current-voltage relations of VDCCs plotted as current densities against the membrane potentials showed no difference in the activity of VDCCs between the two groups (Fig. 5).
Figure 5. Current-voltage relations of VDCC current density.
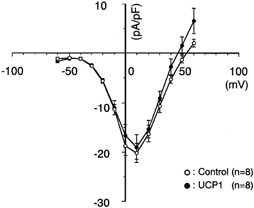
The cells were whole-cell clamped at the holding potential of −70 mV and depolarized to various potentials with a pulse duration of 100 ms at 0.2 Hz. The peak amplitude of Ca2+ channel current was measured and it was divided by the cell capacitance determined by the amplifier. The cell capacitance of controls and UCP1-expressing cells was 5.4 ± 0.5 (n = 8) and 5.7 ± 0.4 pF (n = 8), respectively.
KATP channel currents were recorded using the perforated whole-cell clamp mode during exposure to various concentrations of tolbutamide in the controls and UCP1-expressing cells (Fig. 6A). In UCP1-expressing cells, a significantly greater conductance density of the KATP channels was observed under the condition without tolbutamide (385 ± 153 and 2300 ± 520 pS pF−1 in the control and UCP1 groups, respectively; P < 0.01). The UCP1-expressing cells were significantly hyperpolarized at the basal state. The resting membrane potentials measured in the controls and UCP1-expressing cells were −64.6 ± 0.9 (n = 8) and −70.8 ± 0.4 mV (n = 6), respectively (P < 0.01). KATP channel currents were dose-dependently inhibited by tolbutamide in both groups. The conductance density of the UCP1-expressing cells was approximately 6-fold greater at each concentration, although only the difference for 0.001 mm tolbutamide was significant (327 ± 137 and 1790 ± 442 pS pF−1 in the control and UCP1 groups, respectively; P < 0.01). However, the blocking efficacies of tolbutamide between the two groups were equivalent when the conductance density was normalized to that without tolbutamide (Fig. 6B). The values of half-maximal inhibition of KATP channel conductance density for tolbutamide concentration (IC50) and the 95 % confidence intervals (shown in parentheses) in controls and UCP1-expressing cells were 6.6 (3.4, 8.9) and 4.2 (2.5, 5.9) μm, respectively. The concentration of tolbutamide required to reduce the KATP channel currents of UCP1-expressing cells to the same levels as of the control cells was calculated to be 27 ± 6.0 × [TB]controlμ m, assuming that the IC50 values in both groups were equal to 5.4 μm, where [TB]control was tolbutamide concentration applied to the control cells. We then measured the conductance density under the conventional whole-cell mode condition where cytosolic nucleotide concentrations were nearly fixed to that of the pipette solution (Fig. 7A). The conductance density was also greater in the UCP1 group than the control at the basal state (2240 ± 248 and 3800 ± 633 pS pF−1 in the control and UCP1 groups, respectively; P < 0.05). IC50 values and the 95 % confidence intervals for the inhibitory action of tolbutamide in the control and UCP1-expressing cells were 3.4 [2.4, 4.3] and 4.7 [2.6, 6.8] μm, respectively. The blocking effects of tolbutamide in the two groups were comparable (Fig. 7B). Under these conditions, KATP channel conductance of the UCP1 group at each concentration was approximately 1.7-fold increased compared with the control.
Figure 6. UCP1-expressing cells exhibited upregulated activity of the KATP channel.
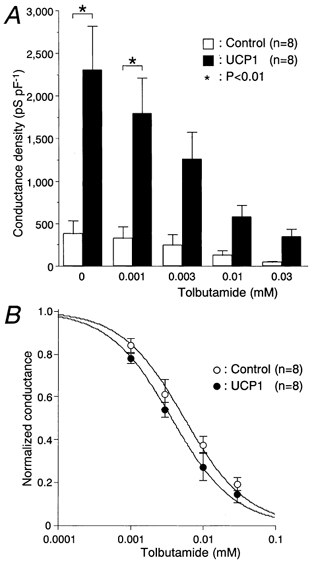
A, dose-response relations for tolbutamide-induced conductance reduction in the KATP channel. Values were obtained in the perforated whole-cell clamp mode. The KATP channel current was measured at the holding potential of −70 mV with repetitive depolarization to −60 mV at 0.2 Hz. Conductance density was calculated from the slope conductance between these potentials and the cell capacitance. The cell capacitance of controls and UCP1-expressing cells was 4.9 ± 0.5 (n = 8) and 4.6 ± 0.3 pF (n = 8), respectively. The glucose concentration was 3 mm throughout these experiments. B, conductance density was normalized to that obtained in the absence of tolbutamide. The curves were drawn according to the following equation, normalized conductance = 1/(1 + [TB]/IC50), where [TB] is tolbutamide concentration.
Figure 7. Conductance density of the KATP channel in the conventional whole-cell clamp mode.
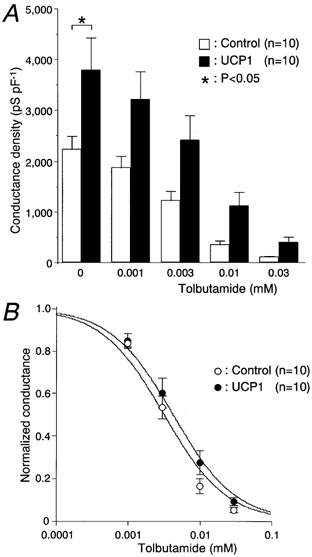
A and B, the same protocol and analysis as in Fig. 6 were performed, except for the use of the conventional whole-cell clamp mode instead of the perforated whole-cell clamp mode. The glucose concentration was 3 mm throughout these experiments. The values of cell capacitance of controls and UCP1-expressing cells were 4.6 ± 0.3 (n = 10) and 4.4 ± 0.2 pF (n = 10).
Difference of the efficacy of tolbutamide between [Ca2+]i or insulin measurements and patch-clamp experiments
The efficacy of tolbutamide appeared to be lower in [Ca2+]i and insulin measurements than in patch-clamp experiments. This was due to the difference in compositions of KRBB used in these experiments. KRBB containing 0.1 % BSA was used in the experiments of [Ca2+]i and insulin measurements, whereas KRBB without BSA was used in patch-clamp experiments. Tolbutamide has the character to bind extensively to albumin in the solution and the extent of tolbutamide binding was reported to range from 80 to 99 % of total concentrations (Wishinsky et al. 1962; Judis 1972; Crooks & Brown, 1974; Zini et al. 1976). Therefore the free fraction of tolbutamide may be up to two orders of magnitude lower in the presence of BSA than in its absence. We tested the effect of BSA on tolbutamide sensitivity using conventional whole-cell configuration in the control cells. When the conductance density was normalized and fitted to the same equation in Fig. 6B, blocking efficacy of tolbutamide in the KRBB with 0.1 % BSA was decreased to 1/10 compared with the KRBB without BSA. The IC50 value and 95 % confidence interval for the inhibitory action of tolbutamide in the presence of 0.1 % BSA were 36 (24, 51) μm (n = 5).
DISCUSSION
In the present study, UCP1-expressing MIN6 cells were studied with respect to insulin secretion and [Ca2+]i in response to several secretagogues, and the current density of VDCCs and the conductance density of KATP channels were evaluated. Overexpression of UCP1 abolished the increase in ATP content induced by glucose but neither glucose utilization nor glycerol phosphate flux was affected (Fig. 1). These findings are consistent with those of a recent study where both UCP2- and UCP3-expressing INS-1 cells did not have an effect on glucose oxidation but did affect lipid oxidation (Hong et al. 2001). Similarly, the ability of mitochondrial DNA-depleted cells to produce ATP in response to glucose was completely abolished (Kennedy et al. 1998; Tsuruzoe et al. 1998).
UCP1-expressing cells did not respond to nutrients, as is consistent with previous findings compromising mitochondrial function using chemicals (Soejima et al. 1996; Hayakawa et al. 1998; Kennedy et al. 1998; Tsuruzoe et al. 1998), cell-engineering technique (Chan et al. 1999; Hong et al. 2001) or gene targeting (Silva et al. 2000). The impairment of glucose- or KIC-stimulated insulin secretion in UCP1-expressing cells may be due to a disturbance somewhere in the process from the metabolism of these nutrients up to the increase in [Ca2+]i (Fig. 2 and Fig. 3). Loss of responsiveness in the [Ca2+]i increase to glucose has also been observed in mitochondrial DNA-depleted cells (Tsuruzoe et al. 1998) and in the islets of mitochondrial transcription factor A knockout mice (Silva et al. 2000). The mitochondrial metabolism plays a crucial role in ATP production stimulated by glucose in pancreatic β cells (Erecinska et al. 1992). Therefore, the cells with dysfunction of mitochondrial oxidative phosphorylation may fail to shut KATP channels and may be unable to depolarize the plasma membrane potential upon nutrient challenge. This results in less activation of VDCCs associated with an impaired increase in [Ca2+]i. Overexpression of UCP1 was suggested to induce dissipation of the mitochondrial membrane potential and reduce the electromotive force of H+ influx across the inner membrane for conversion of ADP to ATP (Casteilla et al. 1990). Glucose hyperpolarized mitochondrial membrane potential, which oscillates in parallel with [Ca2+]i (Krippeit-Drews et al. 2000). Likewise, intra-mitochondrial Ca2+ oscillation has been suggested to synchronize with cytosolic Ca2+ oscillation (Nakazaki et al. 1998). Taken together, the decrease in nutrient-induced insulin secretion in UCP1-expressing cells may result from inability to produce ATP.
UCP1-expressing cells showed refractoriness not only to nutrients but also to tolbutamide (Fig. 4). Dose-response relations for insulin secretion stimulated by tolbutamide were shifted toward the right and the [Ca2+]i elevation in response to tolbutamide was decreased compared with the control cells. This was not due to abnormalities in VDCCs concerning either the channel density or voltage sensitivity (Fig. 5). In addition, depolarization induced by 22 mm KCl showed comparable effects on both [Ca2+]i increase and insulin secretion between the two groups, indicating Ca2+-induced insulin secretion was preserved in the UCP1-expressing cells. The primary cause of tolbutamide insensitivity in the UCP1-expressing cells may lie at a site proximal to VDCCs. The present findings suggest that upregulated activity of the KATP channels may, therefore, cause the refractoriness to tolbutamide in UCP1-expressing cells. In the perforated whole-cell clamp mode, the increased KATP channel conductance resulted in significantly more hyperpolarization of the resting membrane potential in UCP1-expressing cells and more than 6-fold higher concentrations of tolbutamide were required to reduce the KATP channel currents of UCP1-expressing cells to the same levels as the control cells (Fig. 6). Thus, the increase in the resting membrane conductance may result in less depolarization during exposure to tolbutamide. In a transgenic mouse having KATP channels insensitive to elevated cytoplasmic ATP/ADP in β cells, increased KATP channel activity led to decreased insulin secretion and development of diabetes mellitus (Koster et al. 2000).
It is not known why the KATP channel conductance density is higher in the UCP1-expressing cells. The channel was reportedly modulated by various factors such as ADP, H+ and divalent cations at the cytoplasmic side (Kakei et al. 1986; Ashcroft & Rorsman, 1989; Koyano et al. 1992). When KATP channel conductance was compared between the two groups in the absence of tolbutamide, the magnitude of the increase in the UCP1 group against the control was much greater in the perforated whole-cell mode than that in the conventional whole-cell mode (6-fold and 1.7-fold in the perforated and conventional whole-cell mode, respectively; Fig. 6A and Fig. 7A). Cytosolic nucleotide concentrations may be kept in a near-physiological condition in the perforated whole-cell mode whereas these ought to be determined by the composition of the pipette solution in the conventional whole-cell mode. These findings suggest that cytoplasmic ATP levels and/or the ratio of ATP to ADP underneath the plasma membrane may be lower and the activity of the KATP channels may be consequently enhanced in intact UCP1-expressing cells, although the bulk ATP levels at the basal state were not different between the two groups (Fig. 1B).
The other possibility is that the number of KATP channels at the plasma membrane may be increased in the UCP1-expressing cells. It was reported that glucose metabolism inhibited the expression of KATP channel subunits in INS-1 cells, although the mechanisms were unknown (Moritz et al. 2001). Some glucose metabolites may suppress the expression of the KATP channel subunits and this does not appear to contradict the present observations. Further experiments are needed to clarify the mechanisms of upregulation of KATP channels in metabolically impaired cells.
In conclusion, UCP1-expressing cells showed a refractoriness to respond to tolbutamide as well as nutrients. Upregulated activity of KATP channels in the UCP1-expressing cells was associated with the unresponsiveness to tolbutamide that resulted in impaired [Ca2+]i increase. Insufficient inhibition of KATP channels by sulphonylureas and nutrient may underlie the early-onset sulphonylurea failures and development of mitochondrial diabetes.
Acknowledgments
We wish to thank Professor J.-I. Miyazaki (Osaka University, Osaka, Japan), Professor L. P. Kozak (Pennington Biomedical Research Center, Baton Rouge, LA, USA) and Professor D. Ricquier (CNRS, Meudon, France) for generously donating MIN6 cells, murine UCP1 cDNA and anti-UCP1 antiserum, respectively. This work was supported in part by a Grant-in-Aid for Scientific Research (C) from Japan Society for the Promotion of Science (to M.K.).
REFERENCES
- Ashcroft FM, Rorsman P. Electrophysiology of the pancreatic β-cells. Progress in Biophysics and Molecular Biology. 1989;54:87–143. doi: 10.1016/0079-6107(89)90013-8. [DOI] [PubMed] [Google Scholar]
- Casteilla L, Blondel O, Klaus S, Raimbault S, Diolez P, Moreau F, Bouillaud F, Ricquier D. Stable expression of functional mitochondrial uncoupling protein in Chinese hamster ovary cells. Proceedings of the National Academy of Sciences of the USA. 1990;87:5124–5128. doi: 10.1073/pnas.87.13.5124. [DOI] [PMC free article] [PubMed] [Google Scholar]
- Chan CB, MacDonald PE, Saleh MC, Johns DC, Marban E, Wheeler MB. Overexpression of uncoupling protein 2 inhibits glucose-stimulated insulin secretion from rat islets. Diabetes. 1999;48:1482–1486. doi: 10.2337/diabetes.48.7.1482. [DOI] [PubMed] [Google Scholar]
- Chow RH, Lund PE, Loser S, Panten U, Gylfe E. Coincidence of early glucose-induced depolarization with lowe ring of cytoplasmic Ca2+ in mouse pancreatic β-cells. Journal of Physiology. 1995;485:607–617. doi: 10.1113/jphysiol.1995.sp020756. [DOI] [PMC free article] [PubMed] [Google Scholar]
- Crooks MJ, Brown KF. The binding of sulfonylureas to serum albumin. Journal of Pharmacy and Pharmacology. 1974;26:304–311. doi: 10.1111/j.2042-7158.1974.tb09280.x. [DOI] [PubMed] [Google Scholar]
- Erecinska M, Bryla J, Michalik M, Meglasson MD, Nelson D. Energy metabolism in islets of Langerhans. Biochimica et Biophysica Acta. 1992;1101:273–295. doi: 10.1016/0005-2728(92)90084-f. [DOI] [PubMed] [Google Scholar]
- Fleury C, Neverova M, Collins S, Raimbault S, Champigny O, Levi-meyrueis C, Bouillaud F, Seldin MF, Surwit RS, Ricquier D, Warden CH. Uncoupling protein-2: a novel gene linked to obesity and hyperinsulinemia. Nature Genetics. 1997;15:269–272. doi: 10.1038/ng0397-269. [DOI] [PubMed] [Google Scholar]
- Gerbitz KD, Paprotta A, Jaksch M, Zierz S, Drechsel J. Diabetes mellitus is one of the heterogeneous phenotypic features of a mitochondrial DNA point mutation within the tRNALeu(UUR) gene. FEBS Letters. 1993;321:194–196. doi: 10.1016/0014-5793(93)80106-5. [DOI] [PubMed] [Google Scholar]
- Giroix MH, Baetens D, Rasschaert J, Leclercq-Meyer V, Sener A, Portha B, Malaisse WJ. Enzymic and metabolic anomalies in islets of diabetic rats: relationship to B cell mass. Endocrinology. 1992;130:2634–2640. doi: 10.1210/endo.130.5.1315252. [DOI] [PubMed] [Google Scholar]
- Hamill OP, Marty A, Neher E, Sakmann B, Sigworth FJ. Improved patch-clamp techniques for high-resolution current recording from cells and cell-free membrane patches. Pflügers Archiv. 1981;391:85–100. doi: 10.1007/BF00656997. [DOI] [PubMed] [Google Scholar]
- Hayakawa T, Noda M, Yasuda K, Yorifuji H, Taniguchi S, Miwa I, Sakura H, Terauchi Y, Hayashi J, Sharp GW, Kanazawa Y, Akanuma Y, Yazaki Y, Kadowaki T. Ethidium bromide-induced inhibition of mitochondrial gene transcription suppresses glucose-stimulated insulin release in the mouse pancreatic β-cell line β HC9. Journal of Biological Chemistry. 1998;273:20300–20307. doi: 10.1074/jbc.273.32.20300. [DOI] [PubMed] [Google Scholar]
- Hong Y, Fink BD, Dillon JS, Sivitz WI. Effects of adenoviral overexpression of uncoupling protein-2 and −3 on mitochondrial respiration in insulinoma cells. Endocrinology. 2001;142:249–256. doi: 10.1210/endo.142.1.7889. [DOI] [PubMed] [Google Scholar]
- Ishihara H, Asano T, Tsukuda K, Katagiri H, Inukai K, Anai M, Kikuchi M, Yazaki Y, Miyazaki J-I, Oka Y. Pancreatic beta cell line MIN6 exhibits characteristics of glucose metabolism and glucose-stimulated insulin secretion similar to those normal islets. Diabetologia. 1993;36:1139–1145. doi: 10.1007/BF00401058. [DOI] [PubMed] [Google Scholar]
- Ishihara H, Nakazaki M, Kanegae Y, Inukai K, Asano T, Katagiri H, Yazaki Y, Kikuchi M, Miyazaki J-I, Saito I, Oka Y. Effect of mitochondrial and/or cytosolic glycerol 3-phosphate dehydrogenase overexpression on glucose-stimulated insulin secretion from MIN6 and HIT cells. Diabetes. 1996;45:1238–1244. doi: 10.2337/diab.45.9.1238. [DOI] [PubMed] [Google Scholar]
- Judis J. Binding of sulfonylureas to serum proteins. Journal of Pharmaceutical Sciences. 1972;61:89–93. doi: 10.1002/jps.2600610116. [DOI] [PubMed] [Google Scholar]
- Kakei M, Kelly RP, Ashcroft SJH, Ashcroft FM. The ATP-sensitivity of K+ channels in rat pancreatic B-cells is modulated by ADP. FEBS Letters. 1986;208:63–66. doi: 10.1016/0014-5793(86)81533-2. [DOI] [PubMed] [Google Scholar]
- Kanegae Y, Lee G, Sato Y, Tanaka M, Nakai M, Sakai T, Sugano S, Saito I. Efficient gene activation in mammalian cells by using recombinant adenovirus expressing site-specific Cre recombinase. Nucleic Acids Research. 1995;23:816–821. doi: 10.1093/nar/23.19.3816. [DOI] [PMC free article] [PubMed] [Google Scholar]
- Kennedy ED, Maechler P, Wollheim CB. Effects of depletion of mitochondrial DNA in metabolism secretion coupling in INS-1 cells. Diabetes. 1998;47:374–380. doi: 10.2337/diabetes.47.3.374. [DOI] [PubMed] [Google Scholar]
- Koster JC, Marshall BA, Ensor N, Corbett JA, Nichols CG. Targeted overactivity of β cell KATP channels induces profound neonatal diabetes. Cell. 2000;100:645–654. doi: 10.1016/s0092-8674(00)80701-1. [DOI] [PubMed] [Google Scholar]
- Koyano T, Kakei M, Nakashima H, Yoshinaga M, Matsuoka T, Tanaka H. ATP-regulated K+ channels are modulated by intracellular H+ in guinea-pig ventricular cells. Journal of Physiology. 1992;463:747–767. doi: 10.1113/jphysiol.1993.sp019620. [DOI] [PMC free article] [PubMed] [Google Scholar]
- Kozak LP, Britton JH, Kozak UC, Wells JM. The mitochondrial uncoupling protein gene. Correlation of exon structure to transmembrane domains. Journal of Biological Chemistry. 1988;263:12274–12277. [PubMed] [Google Scholar]
- Krippeit-Drews P, Düfer M, Drews G. Parallel oscillations of intracellular calcium activity and mitochondrial membrane potential in mouse pancreatic B-cells. Biochemical and Biophysical Research Communications. 2000;267:179–183. doi: 10.1006/bbrc.1999.1921. [DOI] [PubMed] [Google Scholar]
- Maassen JA, Kadowaki T. Maternally inherited diabetes and deafness: a new diabetes subtype. Diabetologia. 1996;39:375–382. doi: 10.1007/BF00400668. [DOI] [PubMed] [Google Scholar]
- Miyake S, Makimura M, Kanegae Y, Harada S, Sato Y, Takamori K, Tokuda C, Saito I. Efficient generation of recombinant adenoviruses using adenovirus DNA-terminal protein complex and a cosmid bearing the full-length virus genome. Proceedings of the National Academy of Sciences of the USA. 1996;93:1320–1324. doi: 10.1073/pnas.93.3.1320. [DOI] [PMC free article] [PubMed] [Google Scholar]
- Miyazaki J-I, Araki K, Yamato E, Ikegami H, Asano T, Shibasaki Y, Oka Y, Yamamura K. Establishment of a pancreatic beta cell line that retains glucose-inducible insulin secretion: special reference to expression of glucose transporter isoforms. Endocrinology. 1990;127:126–132. doi: 10.1210/endo-127-1-126. [DOI] [PubMed] [Google Scholar]
- Moritz W, Leech CA, Ferrer J, Habener JF. Regulated expression of adenosine triphosphate-sensitive potassium channel subunits in pancreatic β-cells. Endocrinology. 2001;142:129–138. doi: 10.1210/endo.142.1.7885. [DOI] [PubMed] [Google Scholar]
- Nakazaki M, Ishihara H, Kakei M, Inukai K, Asano T, Miyazaki J-I, Tanaka H, Kikuchi M, Yada T, Oka Y. Repetitive mitochondrial Ca2+ signals synchronize with cytosolic Ca2+ oscillations in the pancreatic β-cell line, MIN6. Diabetologia. 1998;41:279–286. doi: 10.1007/s001250050904. [DOI] [PubMed] [Google Scholar]
- Niwa H, Yamamura K, Miyazaki J-I. Efficient selection for high-expression transfectants with a novel eukaryotic vector. Gene. 1991;108:193–200. doi: 10.1016/0378-1119(91)90434-d. [DOI] [PubMed] [Google Scholar]
- Reardon W, Ross RJ, Sweeney MG, Luxon LM, Pembrey ME, Harding AE, Trembath RC. Diabetes mellitus associated with a pathogenic point mutation in mitochondrial DNA. Lancet. 1992;340:1376–1379. doi: 10.1016/0140-6736(92)92560-3. [DOI] [PubMed] [Google Scholar]
- Sakurada M, Kanatsuka A, Saitoh T, Makino H, Yamamura K, Miyazaki J-I, Kikuchi M, Yoshida S. Relation between glucose-stimulated insulin secretion and intracellular calcium accumulation studied with a superfusion system of a glucose-responsive pancreatic beta-cell line MIN6. Endocrinology. 1993;132:2659–2665. doi: 10.1210/endo.132.6.8504766. [DOI] [PubMed] [Google Scholar]
- Shimabukuro M, Zhou YT, Lee Y, Unger RH. Induction of uncoupling protein-2 mRNA by troglitazone in the pancreatic islets of Zucker diabetic fatty rats. Biochemical and Biophysical Research Communications. 1997;237:359–361. doi: 10.1006/bbrc.1997.7140. [DOI] [PubMed] [Google Scholar]
- Silva JP, Köahler M, Graff C, Oldfors A, Magnuson MA, Berggren PO, Larsson NG. Impaired insulin secretion and β-cell loss in tissue-specific knockout mice with mitochondrial diabetes. Nature Genetics. 2000;26:336–340. doi: 10.1038/81649. [DOI] [PubMed] [Google Scholar]
- Simon DK, Johns DR. Mitochondrial disorders: clinical and genetic features. Annual Review of Medicine. 1999;50:111–127. doi: 10.1146/annurev.med.50.1.111. [DOI] [PubMed] [Google Scholar]
- Soejima A, Inoue K, Takai D, Kaneko M, Ishihara H, Oka Y, Hayashi J. Mitochondrial DNA is required for regulation of glucose-stimulated insulin secretion in a mouse pancreatic beta cell line, MIN6. Journal of Biological Chemistry. 1996;271:26194–26199. doi: 10.1074/jbc.271.42.26194. [DOI] [PubMed] [Google Scholar]
- Tsuruzoe K, Araki E, Furukawa N, Shirotani T, Matsumoto K, Kaneko K, Motoshima H, Yoshizato K, Shirakami A, Kishikawa H, Miyazaki J-I, Shichiri M. Creation and characterization of a mitochondrial DNA-depleted pancreatic β-cells line. Diabetes. 1998;47:621–631. doi: 10.2337/diabetes.47.4.621. [DOI] [PubMed] [Google Scholar]
- van den Ouweland JM, Lemkes HH, Ruitenbeek W, Sandkuijl LA, de Vijlder MF, Struyvenberg PA, van de Kamp JJ, Maassen JA. Mutation in mitochondrial tRNALeu(UUR) gene in a large pedigree with maternally transmitted type II diabetes mellitus and deafness. Nature Genetics. 1992;1:368–371. doi: 10.1038/ng0892-368. [DOI] [PubMed] [Google Scholar]
- Wishinsky H, Glasser EJ, Perkal S. Protein interactions of sulfonylurea compounds. Diabetes. 1962;11(suppl.):18–25. [PubMed] [Google Scholar]
- Yaekura K, Kakei M, Yada T. cAMP-signaling pathway acts in selective synergism with glucose or tolbutamide to increase cytosolic Ca2+ in rat pancreatic β-cells. Diabetes. 1996;45:295–301. doi: 10.2337/diab.45.3.295. [DOI] [PubMed] [Google Scholar]
- Zini R, Hoareau A, d'Athis P, Tillement JP. Binding of four sulphonamides to human albumin. European Journal of Clinical Pharmacology. 1976;10:139–145. doi: 10.1007/BF00609473. [DOI] [PubMed] [Google Scholar]


