Abstract
When intracellular recordings were made from the antral region of murine stomach, cells with three different patterns of electrical activity were detected. One group of cells generated follower potentials, the second group generated pacemaker potentials and the third group generated slow waves that consisted of primary and secondary components. Slow waves recorded in different regions of the gastric antrum had similar amplitudes but different characteristic shapes. At the greater curvature, slow waves had large initial components. Midway between the greater and lesser curvature, the amplitude of the initial component was reduced and at the lesser curvature an initial component was difficult to detect. When the distributions of myenteric (ICC-MY) and intramuscular interstitial cells of Cajal (ICC-IM) were determined, using an antibody to Kit, ICC-MY were found to be present at the greater curvature but were greatly reduced in density at the lesser curvature. In contrast, ICC-IM were found in the circular layer of each region. When recordings were made from the antrum of W/WV mice, which lack ICC-IM, incomplete slow waves were detected and their amplitudes fell from the greater to the lesser curvature. Again, a corresponding fall in the density of ICC-MY was detected. The observations indicate that the contribution of ICC-MY and ICC-IM to the generation of slow waves varies in different regions of the mouse gastric antrum.
Most regions of the gastrointestinal tract generate an ongoing discharge of rhythmical electrical activity in the absence of neuronal or hormonal stimulation (Tomita, 1981; Sanders, 1992). In the gastrointestinal tract, rhythmical electrical activity is initiated by interstitial cells of Cajal (ICC) rather than by smooth muscle cells (Sanders, 1996). Thus preparations taken from mutant mice which lack myenteric ICC (ICC-MY) (Ward et al. 1994; Huizinga et al. 1995) or ones in which the development of ICC has been impaired (Ward et al. 1997, 1999; Ordog et al. 1999) fail to generate slow waves. In the guinea-pig gastric antrum, ICC-MY generate large amplitude driving potentials or pacemaker potentials which spread passively to both the longitudinal and circular muscle layers. In the circular muscle layer, the depolarisation produced by each driving potential gives rise to the initial phase of each slow wave. This depolarisation triggers a regenerative response in the circular muscle layer, so giving rise to a complete slow wave (Dickens et al. 1999; Suzuki & Hirst, 1999; Edwards et al. 1999; van Helden et al. 2000). The circular muscle layer contains both smooth muscle cells and intramuscular interstitial cells of Cajal (ICC-IM) (Burns et al. 1996). Circular muscles from mutant mice that are devoid of ICC-IM generate slow waves that lack a secondary component (Dickens et al. 2001). Similarly, the depolarisations produced by current flow from ICC-MY pacemaker potentials fail to trigger a regenerative component in the longitudinal muscle layer of guinea-pig antrum and this layer also lacks ICC-IM (Hirst & Edwards, 2001). Together, these observations suggest that ICC-IM generate the regenerative component of slow waves in gastric muscle.
The experiments described in this report were aimed at identifying why conflicting observations have been made of the properties of slow waves recorded from the antrum of mutant mice that lack ICC-IM. The initial report on these tissues found that the slow waves had amplitudes similar to those detected in control animals (Burns et al. 1996). The subsequent study found that slow waves recorded from the same tissues had smaller amplitudes and lacked a secondary component (Dickens et al. 2001). The differences between the two sets of observations could have arisen if the there were regional variations in the way in which slow waves are generated, with each group recording slow waves from different regions. This study has addressed this possibility. It has been found that, at the greater curvature, the contribution made by ICC-MY to the membrane potential changes during each slow wave is large. Away from the greater curvature, the contribution made by ICC-MY is reduced and that of ICC-IM relatively increased. At the lesser curvature, the contribution made by ICC-MY is greatly reduced and that of ICC-IM is further enhanced.
METHODS
The animal experimentation ethics committee at the University of Nevada in Reno approved the procedures described. Experiments were carried out on Balb/C mice bred at the University of Nevada and on C57BL/6 wild-type and W/WV mutant mice obtained from Jackson Laboratory (Bar Harbor, ME, USA). Mice of either sex were killed by cervical dislocation and exsanguination. The stomach was exposed and transferred to a dissecting chamber filled with oxygenated (97 % O2-3 % CO2) physiological saline (composition, mm: NaCl, 120.7; NaHCO3, 15.5; NaH2PO4, 1.2; KCl, 5.9; MgCl2, 1.2; CaCl2, 2.5; and dextrose, 11.5). The stomach was cut on one side mid way between the greater and lower curvatures and the mucosa dissected away. The preparations were pinned out in a recording chamber with the serosal surface upper most and viewed with an Zeiss Axiovert inverted microscope. The greater curvature of the antrum was identified by the location of mesenteric blood vessels entering the stomach wall. Initially, recordings were made along the greater curvature, some 4 mm from the gastro-duodenual junction. Subsequently, the orientation of circular muscle bundles was identified and recordings were made midway between the greater and lesser curvature and at the lesser curvature, following the same circular muscle bundle from which the greater curvature recordings had been made. Intracellular recordings were made using sharp microelectrodes (90–150 MΩ) filled with 3 m KCl. Signals were amplified with an Axoclamp-2A amplifier, low pass filtered (cut-off frequency 1 kHz) digitised and stored on computer for later analysis. Preparations were constantly perfused with physiological saline solution warmed to 37 °C. In most experiments, nifedipine, 1–10 μm, (Sigma Chemical Co., St Louis, MO, USA), which has been shown not to significantly affect the waveform of gastric slow waves (Suzuki & Hirst, 1999) was added to the physiological saline to suppress muscle movements.
To identify cells expressing the proto-oncogene Kit, preparations were fixed in acetone for 10 min, washed in phosphate buffered saline (PBS, 0.05 m) before incubating with a rat anti-Kit monoclonal antibody (ACK-2; 5 μg ml−1; Gibco BRL, Gaithsberg, MD, USA) for 24–48 h at 4 °C. Tissues were washed and then incubated for a further 1 h in phosphate buffered saline (PBS, 0.01 m, pH 7.2). Non-specific antibody binding was reduced by incubating tissues in 1 % bovine serum albumin (BSA) for 1 h at room temperature before addition of primary Kit antibody (ACK-2;). ACK-2 was diluted with 0.3 % Triton X 100 in 0.01 m PBS (pH 7.4). Alexa Fluor 488 goat anti-rat IgG (1:200; Molecular Probes, Eugene, OR, USA) was used as a secondary antibody to detect Kit labelling. It was made up in PBS and tissues were incubated for 1 h at room temperature in the secondary antibody. Control tissues were prepared by omitting either primary or secondary antibodies from the incubation solutions. Tissues were examined with a Biorad MRC 600 confocal microscope (Hercules, CA, USA) with an excitation wavelength appropriate for Alexa Fluor 488. The distributions of ICC-MY and ICC-IM were determined by optically sectioning through the entire muscle wall, followed by construction of Z-stacks from the myenteric and circular muscle regions. Confocal micrographs shown in this paper are digital composites of Z-series scans of five to 15 optical sections through a depth of 20 μm. Final images were constructed with Bio-Rad Comos software.
All data are expressed as means ± standard error of the means (s.e.m.). Student's t tests were used to determine if data sets differed, P values of less than 0.05 were taken to indicate significant differences between sets of observations.
RESULTS
General observations
When intracellular recordings were made from the antral region of the mouse stomach three distinct patterns of rhythmical electrical activity were detected (Fig. 1). As the observations were qualitatively similar to those made on guinea-pig gastric antrum (Dickens et al. 1999), the same terminology will be used in this paper. Rhythmical potential changes, similar to those recorded from the longitudinal layer of guinea-pig antrum, which lack a secondary component will be termed follower potentials. Large amplitude, rapidly rising potentials changes, similar to those recorded from ICC-MY of guinea-pig antrum, will be termed driving or pacemaker potentials. All signals recorded from the circular layer will be termed slow waves (Dickens et al. 1999). In the mouse antrum, approaching from the serosal surface, the first cells impaled generated follower potentials (Fig. 1A). Follower potentials had peak amplitudes of 28 to 37 mV, maximum rates of rise (dV/dtmax) of less than 100 mV s−1 (Fig. 1B) and half- widths, measured at 50 % peak amplitude of about 6 s (Table 1). These were superimposed on peak negative potentials in the range −57 to −68 mV (Table 1); for convenience the peak negative potential will be referred to below as the resting potential. After passing through this layer, cells were occasionally impaled which generated large amplitude pacemaker or driving potentials (Fig. 1C). Pacemaker potentials had amplitudes in the range 44 to 56 mV (Table 1); each had a dV/dtmax in excess of 100 mV s−1 (Fig. 1D) and were superimposed on resting membrane potentials of about −70 mV (Table 1). Like the pacemaker potentials recorded from ICC-MY of the guinea-pig antrum, the plateau region of those recorded in the mouse antrum was dominated by discharges of membrane noise (Fig. 1D); during the interval between pacemaker potentials, discharges of unitary potentials were often detected (Hirst & Edwards, 2001). After passing through this thin layer of cells, an ongoing discharge of slow waves was detected (Fig. 1E). Slow waves had peak amplitudes of 28 to 32 mV, dV/dtmax less than 100 mV s−1 (Fig. 1F) and were superimposed on resting membrane potentials of about −70 mV (Table 1). Using paired t tests, the amplitudes of pacemaker potentials differed significantly from those of slow waves and follower cells but the resting membrane potential detected in each cell type was not different. Similarly, dV/dtmax measured from pacemaker potentials differed significantly from that of either follower potentials or slow waves. In the six preparations taken from Balb/C mice, the mean frequency of slow waves was 4.4 slow waves min−1; in each preparation, slow waves, follower potentials and pacemaker potentials occurred at the same frequency.
Figure 1. Different sequences of membrane potential change recorded from cells lying in the mouse gastric antrum.
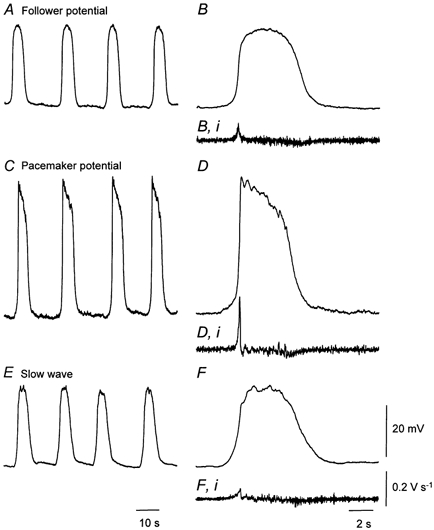
A and B, recordings of follower potentials, displayed on two different time bases. The resting membrane potential was −65 mV. C and D, pacemaker potentials recorded from the same preparation again displayed on two different time bases. The resting membrane potential was −68 mV. E and F, slow waves, again recorded from the same preparation and again displayed at two scan speeds. The differentiated membrane potential change, dV/dt is shown below each of the expanded responses, The resting membrane potential was −67 mV. The physiological saline contained nifedipine, 1 μm. The left-hand time calibration bar applies to the column of recordings shown on the left; the right-hand time calibration bar applies to the column on the right. The voltage calibration bar applies to all voltage recordings and the dV/dt calibration bar to each differentiated recording.
Table 1.
Electrical properties of rhythmically active cells recorded from the gastric antral regions of Balb/C, C57BL/6 wild-type and W/WV mice
| Amplitude (mV) | dV/dtmax (mV s−1) | Half-width (s) | Resting membrane potential (mV) | |
|---|---|---|---|---|
| Balb/C mice (n = 6) | ||||
| Follower cell | 33.1 ± 1.1 | 72 ± 6 | 5.93 ± 0.52 | −64.2 ± 1.6 |
| Pacemaker cell | 51.6 ± 1.8 | 203 ± 24 | 5.85 ± 0.29 | −69.5 ± 2.8 |
| Slow wave cell | 31.3 ± 1.3 | 36 ± 6 | 5.75 ± 0.57 | −67.5 ± 1.8 |
| C57BL/6 wild-type mice (n = 5) | ||||
| Follower cell | 30.2 ± 1.1 | 85 ± 7 | 5.80 ± 0.28 | −67.0 ± 3.6 |
| Pacemaker cell | 49.6 ± 3.3 | 270 ± 44 | 5.58 ± 0.48 | −70.0 ± 2.9 |
| Slow wave cell | 29.4 ± 2.1 | 44 ± 14 | 4.88 ± 0.37 | −66.2 ± 1.7 |
| W/WV mice (n = 5) | ||||
| Follower cell | 27.4 ± 2.1 | 64 ± 12 | 3.86 ± 0.28 | −62.4 ± 1.2 |
| Pacemaker cell | 48.8 ± 1.2 | 204 ± 19 | 4.38 ± 0.68 | −69.2 ± 2.9 |
| Slow wave cell | 19.6 ± 1.7 | 28 ± 4 | 4.50 ± 0.50 | −62.5 ± 1.7 |
Regional variations in the shape of slow waves recorded from different regions of the mouse antrum
When slow waves were recorded from different regions of the antrum, although their peak amplitudes showed little variation, their shapes varied in a systematic manner. In the antral region, near the greater curvature, slow waves with the largest initial component were detected (Fig. 2A and B). Subsequently, when recordings were made along the same circular muscle bundle as it progressed towards the lesser curvature, the amplitude of the initial component was found to decrease. At the lesser curvature it was invariably difficult to detect an initial component, rather the upstroke of the slow wave was interrupted by noise fluctuations. These presumably result from the occurrence of unitary potentials which make up the secondary component of the slow wave (Edwards et al. 1999). For convenience recordings were made three sites, the first at the greater curvature, the second midway between the greater and lesser curvature and the third at the lesser curvature. At each site slow waves occurred at similar frequencies (Fig. 2A). The resting membrane potentials showed no significant regional variation, and the amplitude of the slow waves from the greater curvature, midway and the lesser curvature were not significantly different. When the rising phases of slow waves were examined on an expanded time scale, the point of inflexion at the end of the initial component, which indicates the threshold of the secondary component, was found to vary with location (Fig. 2B). At the greater curvature, the threshold occurred at a depolarisation of 18.8 ± 3.0 mV and midway the threshold occurred at a depolarisation of 9.6 ± 2.7 mV. As stated above, a clearly defined initial component was not detected at the lesser curvature; threshold in this region was determined as being the lowest point at which any inflexion in the rising phase could be observed, giving a threshold depolarisation of 3.4 ± 1.5 mV. Thus it is likely that the amplitude of the initial component is overestimated. Using a paired t test, the difference between thresholds measured at the greater curvature and midway was found to be significant. Similarly, those measured midway differed from those determined at the lesser curvature. The grouped observations are shown graphically in Fig. 2C.
Figure 2. Slow waves recorded from the greater curvature, midway between greater and lesser curvature and from the lesser curvature.
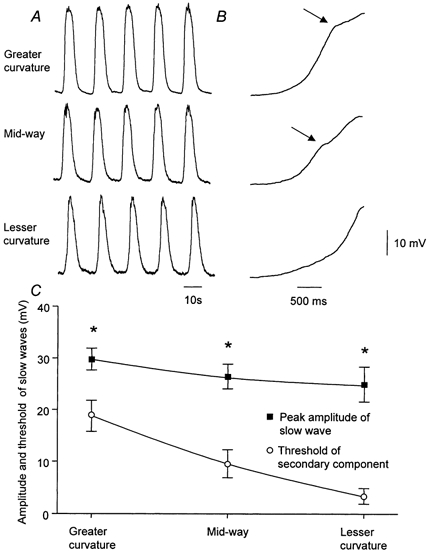
A, slow waves recorded from the greater curvature, midway and lesser curvature of the mouse gastric antrum. The resting membrane potentials were −68 mV, −65 mV and −69 mV respectively. B, the rising phases, displayed on rapid time base, of sample slow waves recorded at each location. The voltage calibration bar applies to all traces, the left-hand time calibration bar applies to A, the right-hand time calibration bar to B. The grouped observations from the experimental series are shown in C. * Experimental observations differed significantly.
Distribution of ICC-MY and ICC-IM in mouse gastric antrum
One explanation for the observations reported above is that the wave of depolarisation produced by ICC-MY varies in a systematic way from the greater to lesser curvature. This might occur if the amplitudes of pacemaker potentials varied from region to region or, alternatively, if the density of ICC-MY fell between the greater and lesser curvature. The second possibility was examined by determining the distribution of ICC-MY in 10 preparations, made up of five preparations taken from Balb/C mice and five from C57BL/6 mice, using an antibody to Kit (Burns et al. 1997). The density of ICC-MY was found to be highest at the greater curvature in both types of animal (Fig. 3A). Midway between the greater and lesser curvature the density was reduced (Fig. 3B). At the lesser curvature ICC-MY were either absent or very sparse, with ICC-MY being detected in only one of the five Balb/C mice and in none of the C57BL/6 mice (Fig. 3C). In contrast, there was little variation in density of ICC-IM across the region (Fig. 3D, E and F). In passing, it was noted that, as in the guinea-pig antral region (Hirst & Edwards, 2001), ICC-IM could not be detected in the longitudinal layer of the corresponding region in the mouse stomach. They were, however, readily detected in the longitudinal layer of the corpus of the mouse stomach.
Figure 3. Distribution of Kit-positive cells in C57BL/6 mouse antrum at the greater curvature, midway between greater and lesser curvature and at the lesser curvature.
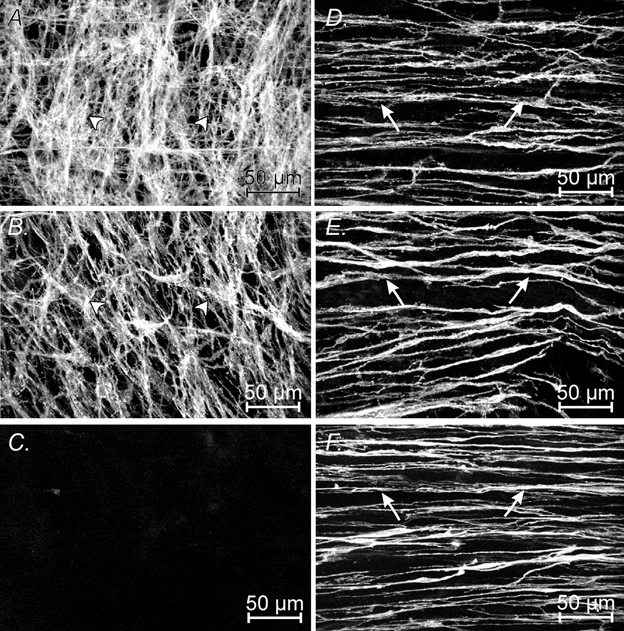
Kit-positive ICC at the level of the myenteric plexus at the greater curvature (A), midway between the greater and lesser curvature (B) and at the lesser curvature (C). Note the decrease in the distribution of ICC-MY (arrowheads) from the greater until they were not detectable at the lesser curvature. Distribution of ICC-IM (arrows) within the circular muscle layer at the greater curvature (D), midway between the greater and lesser curvature (E) and at the lesser curvature (F). A and D, B and E and C and F are confocal digital composites at the same site in the stomach. A, B and C are composites of 5 × 1 μm steps through the myenteric plexus region and D, E and F are composites of 15 × 1 μm steps within the circular muscle layer. Scale bar = 50 μm in all images.
Properties of rhythmical potentials recorded from the antral regions of wild-type and W/WV mice
The previous observations suggest that as the density of ICC-MY falls then amplitude of the wave of depolarisation reaching the circular muscle layer falls but the fall in amplitude of the initial component is compensated by a larger contribution from ICC-IM. To test this idea, rhythmical potentials were recorded from the antral regions of strain-matched C57BL/6 and W/WV mice. When recordings were made from the greater curvature of strain-matched C57BL/6 mice (n = 5), three distinct patterns of electrical activity were again recorded. At the serosal surface, follower potentials were detected (Fig. 4A); these had similar electrical properties to those detected in Balb/C mice (Table 1). Below this cell layer, pacemaker potentials were detected (Fig. 4B, Table 1). Advancing the electrode to deeper cells resulted in the recording of slow waves (Fig. 4C), again similar to those detected in Balb/C mice (Table 1). When recordings were made from the corresponding antral region of W/WV mice (n = 5), follower potentials (Fig. 4D) and pacemaker potentials, with similar properties to those detected in Balb/C and strain-matched C57BL/6 mice, were detected (Fig. 4E, Table 1). After pushing the electrode through the cells from which pacemaker potentials could be detected, slow waves were detected (Fig. 4F) but, unlike the slow waves recorded from matched C57BL/6 mice, those recorded from W/WV mice lacked an obvious secondary component (Fig. 4C and F). Since these waves were recorded deep in the tissue, they represent recordings from the circular layer. These slow waves had peak amplitudes of about 20 mV (Table 1), a value significantly different to those detected in Balb/C and strain-matched C57BL/6 mice. In three of the experiments, recordings were made from the circular layer of the antrum before the addition of nifedipine to the physiological saline. In these preparations the rhythmical potential changes, recorded at the greater curvature, caused discharges of action potentials that were abolished by nifedipine, 1–10 μm.
Figure 4. Different sequences of membrane potential change recorded from cells lying in the gastric antrum of C57BL/6 and W/WV mice.
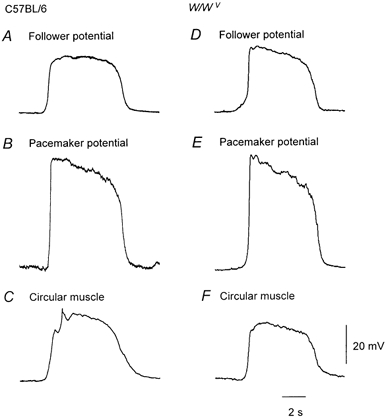
A, B and C, recordings of a follower potential, pacemaker potential and a slow wave recorded from the antrum of a wild-type mouse. The resting membrane potentials were −65 mV, −71 mV and −70 mV respectively. D, E and F, the corresponding recordings obtained from the antrum of a wild-type mouse. The resting membrane potentials were −60 mV, −72 mV and −68 mV respectively. The physiological saline contained nifedipine, 1 μm. The time calibration and voltage bars apply to all recordings.
In summary, the amplitudes of antral pacemaker potentials and their dV/dtmax recorded at the greater curvature of strain-matched C57BL/6 and W/WV mice did not differ significantly. Similarly, the amplitudes and dV/dtmax of follower potentials recorded from either group did not differ significantly. However, the peak amplitudes of slow waves recorded at the greater curvature from strain-matched C57BL/6 mice differed significantly from those recorded from W/WV mice.
Slow waves recorded from different regions of the gastric antrum of strain-matched C57BL/6 mice had similar amplitudes (Fig. 5A). Again, the resting membrane potential detected at the three regions was the same. In contrast, when recordings were made from the circular layer of the same three regions of antrum in W/WV mice, the amplitudes of slow waves fell as the recording sites approached the lesser curvature (Fig. 5B). In each experiment, care had to be taken to ensure that the recordings were being made from the circular layer as slow waves resembled the recordings made from the longitudinal layer in that they lacked the characteristic second component. This was done either by accepting recordings on the same track made after a pacemaker potential had been detected or by disregarding the first three examples of rhythmical activity recorded on a given track. At the greater curvature the peak amplitude of slow waves was 22.7 ± 1.7 mV, midway between the lesser and greater curvature their amplitude was 7.3 ± 1.0 mV and at the lesser curvature their amplitude was 1.0 ± 0.6 mV (n = 5). The resting membrane potential did not vary in the three regions. The grouped observations from strain-matched C57BL/6 and W/WV mice are shown graphically in Fig. 5C.
Figure 5. Rhythmical potential changes recorded from the greater curvature, midway between greater and lesser curvature and from the lesser curvature of the antral regions of the gastric antrum of aged matched C57BL/6 and W/WV mice.
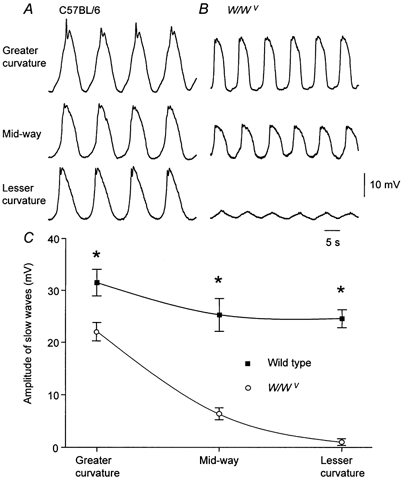
A, slow waves recorded from the greater curvature, midway and lesser curvature of the gastric antrum of a C57BL/6 mouse. The resting membrane potentials were −64 mV, −65 mV and −66 mV respectively. B, rhythmical potential changes recorded from the same regions of the gastric antrum of a W/WV mouse. The resting membrane potentials were −66 mV, −68 mV and −68 mV respectively. The time and voltage calibration bars apply to all traces. The grouped observations from the experimental series are shown in C. * Experimental observations differed significantly.
Distribution of ICC-MY and ICC-MY in antral regions of W/WV mice
When the distributions of ICC-MY and ICC-IM were examined in the antral region of W/WV mice, n = 5, ICC-IM were absent in all regions (Fig. 6D, E and F). At the greater curvature, a network of ICC-MY was detected (Fig. 6A); the density of ICC-MY was reduced midway between the greater and lesser curvature (Fig. 6B). Again ICC-MY were not detected at the lesser curvature (Fig. 6C), giving rise to regions of antrum totally devoid of both ICC-MY and ICC-IM (Fig. 6C and F). When the density of ICC-MY in age matched pairs of wild-type and W/WV mice were compared, the density of ICC-MY appeared to be less in W/WV mice than that found in wild-type mice.
Figure 6. Distribution of Kit-positive cells in W/WV mice at the greater curvature and at the lesser curvature.
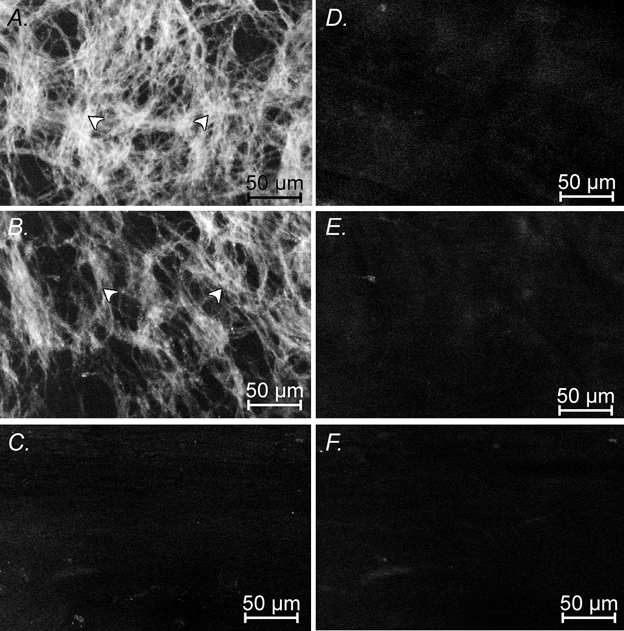
Kit-positive ICC at the level of the myenteric plexus at the greater curvature (A), midway between the greater and lesser curvature (B) and at the lesser curvature (C). There is a decrease in the distribution of ICC-MY (arrowheads) from the greater to the lesser curvature, such that at the lesser curvature few or no ICC-MY were observed. The intensity of labelling of ICC-MY in W/WV mutant animals was less than that of wild-type controls. ICC-IM were absent in the circular muscle layers of W/WV mutants at the greater curvature (D), between the greater and lesser curvature (E), and at the lesser curvature (F). These illustrations are to be compared with those in Fig. 3 which were obtained from an age-matched C57BL/6 mouse. A, B and C, composites of 5 × 1 μm steps through the myenteric plexus region and D, E and F, composites of 15 × 1 μm steps within the circular muscle layer. Scale bar = 50 μm in all images.
DISCUSSION
These experiments have shown that the contributions made by different sets of ICCs to the generation of slow waves vary depending upon location in the mouse antrum. When recordings were made from the antral region of control mice, Balb/C and C57BL/6, three distinct patterns of electrical activity, follower potentials, pacemaker potentials and slow waves, were detected (Fig. 1 and Fig. 4). These responses were very similar to those detected from longitudinal muscle cells, ICC-MY and circular smooth muscle cells in guinea-pig antrum (Dickens et al. 1999). However, slow waves, recorded from the mouse antrum, had different shapes depending upon location. Near the greater curvature, each slow wave had a large initial component (Fig. 2). The histological studies indicated that there was a dense network of ICC-MY in this region (Fig. 3). Since the initial component of each slow wave is produced the passive flow of pacemaker current generated by ICC-MY (Dickens et al. 1999), the high number of ICC-MY would be expected to generate large, passive waves of depolarisation in the circular layer. Midway between the greater and lesser curvature, the amplitude of the initial phase was reduced (Fig. 2). In this region, the density of ICC-MY was less than at the greater curvature (Fig. 3). Presumably, the amount of depolarising current flow produced by ICC-MY in this region is reduced, so giving rise to a smaller amplitude initial component in each slow wave. At the lesser curvature it was often difficult to detect an initial component (Fig. 2). In this region ICC-MY were found to be greatly reduced in density (Fig. 3). As the amplitude of the slow waves showed little variation from greater to lesser curvature, the secondary regenerative component, which is generated by ICC-IM in the circular layer (Dickens et al. 2001), must become more dominant as the contribution made by ICC-MY falls. This could occur if the amount of depolarisation required to activate ICC-IM varied in a systematic way, with the threshold for initiation of the secondary component falling as the lesser curvature was approached. Alternatively, at the greater curvature, the initial depolarisation might carry the membrane potential to a depolarised level before the regenerative potential had sufficient time to be initiated (Suzuki & Hirst, 1999). Thus a similar conductance increase would produce a smaller increment in voltage than it would if initiated by a smaller initial depolarisation.
When recordings were made from the greater curvature of the antral region of W/WV mice, pacemaker potentials were detected which had similar properties to those recorded in control and wild-type mice (Fig. 5). These tissues contained a dense network of ICC-MY but lacked ICC-IM (Fig. 6). These observations indicate that the generation of pacemaker potentials is not impaired in W/WV mice. As reported previously, the rhythmical potential changes from this region lacked a secondary response (Dickens et al. 2001). However, when these experiments were carried out (Dickens et al. 2001), it was not appreciated that responses from the circular layer varied depending upon location (Fig. 5). The present study has found, as reported previously (Burns et al. 1996), that large amplitude rhythmical potential changes can be detected in the antral circular layer of W/WV mice. These, in the absence of nifedipine, had amplitudes similar to those recorded in control tissues. When rhythmical potential changes were recorded from the antral region of W/WV mice, their amplitudes fell in a manner that was consistent with the fall in density of ICC-MY (Fig. 6). Thus this report supports the suggestion that ICC-IM augment the amplitudes of depolarisations reaching the circular layer from pacemaker potentials generated by ICC-MY (Dickens et al. 2001). Furthermore, these observations indicate that the contribution of ICC-MY to the potential change occurring during each slow wave falls as the density of ICC-MY falls and that made by ICC-IM increases as the amplitude of the initial depolarisation falls.
In summary, firstly, these results demonstrate a relationship between the density of ICC-MY and the amplitude of the initial component of slow waves. This is consistent with the view that the initial component of each slow wave is generated passively by pacemaker currents generated by ICC-MY (Dickens et al. 1999). Secondly, the results suggest that the nature of the cells responsible for generating slow waves varies with location in the gastric antrum. Thirdly, the results support the view that at least two sets of ICC combine to generate slow waves, with smooth muscle cells making little contribution to their generation (Dickens et al. 2001). Clearly, however, opening of L-type calcium channels in smooth muscle cells is ultimately responsible for the generation of gastric contractions but this is a response to slow wave depolarisation not a prerequisite for pacemaker activity.
Acknowledgments
This project was supported by a grant from the Australian NH and MRC and by grants from the National Institutes of Health (Grants DK40569 to K.M.S. and DK57236 to S.M.W.). We also wish to thank Yulia Bayguinov for her excellent technical assistance and Dr N. J. Bramich for her careful reading of the manuscript.
REFERENCES
- Burns AJ, Herbert TM, Ward SM, Sanders KM. Interstitial cells of Cajal in the guinea-pig gastrointestinal tract as revealed by c-Kit immunohistochemistry. Cell and Tissue Research. 1997;290:11–20. doi: 10.1007/s004410050902. [DOI] [PubMed] [Google Scholar]
- Burns AJ, Lomax AE, Torihashi S, Sanders KM, Ward SM. Interstitial cells of Cajal mediate inhibitory neurotransmission in the stomach. Proceedings of the National Academy of Sciences of the USA. 1996;93:12008–12013. doi: 10.1073/pnas.93.21.12008. [DOI] [PMC free article] [PubMed] [Google Scholar]
- Dickens EJ, Edwards FR, Hirst GDS. Selective knockout of intramuscular interstitial cells reveals their role in the generation of slow waves in mouse stomach. Journal of Physiology. 2001;531:827–833. doi: 10.1111/j.1469-7793.2001.0827h.x. [DOI] [PMC free article] [PubMed] [Google Scholar]
- Dickens EJ, Hirst GDS, Tomita T. Identification of rhythmically active cells in guinea-pig stomach. Journal of Physiology. 1999;514:515–531. doi: 10.1111/j.1469-7793.1999.515ae.x. [DOI] [PMC free article] [PubMed] [Google Scholar]
- Edwards FR, Hirst GDS, Suzuki H. Unitary nature of regenerative potentials recorded from circular smooth muscle of guinea-pig antrum. Journal of Physiology. 1999;519:235–250. doi: 10.1111/j.1469-7793.1999.0235o.x. [DOI] [PMC free article] [PubMed] [Google Scholar]
- Hirst GDS, Edwards FR. Generation of slow waves in the antral region of guinea-pig stomach - a stochastic process. Journal of Physiology. 2001;535:165–180. doi: 10.1111/j.1469-7793.2001.00165.x. [DOI] [PMC free article] [PubMed] [Google Scholar]
- Huizinga JD, Thuneberg L, Kluppel M, Malysz J, Mikkelsen HB, Bernstein A. W/kit gene required for interstitial cells of Cajal and for intestinal pacemaker activity. Nature. 1995;373:347–349. doi: 10.1038/373347a0. [DOI] [PubMed] [Google Scholar]
- Ordog T, Ward SM, Sanders KM. Interstitial cells of Cajal generate electrical slow waves in the murine stomach. Journal of Physiology. 1999;518:257–269. doi: 10.1111/j.1469-7793.1999.0257r.x. [DOI] [PMC free article] [PubMed] [Google Scholar]
- Sanders KM. Ionic mechanisms of electrical rhythmicity in gastrointestinal smooth muscles. Annual Review of Physiology. 1992;54:439–453. doi: 10.1146/annurev.ph.54.030192.002255. [DOI] [PubMed] [Google Scholar]
- Sanders KM. A case for interstitial cells of Cajal as pacemakers and mediators of neurotransmission in the gastrointestinal tract. Gastroenterology. 1996;111:492–515. doi: 10.1053/gast.1996.v111.pm8690216. [DOI] [PubMed] [Google Scholar]
- Suzuki H, Hirst GDS. Regenerative potentials evoked in circular smooth muscle of the antral region of guinea-pig stomach. Journal of Physiology. 1999;517:563–573. doi: 10.1111/j.1469-7793.1999.0563t.x. [DOI] [PMC free article] [PubMed] [Google Scholar]
- Tomita T. Electrical activity (spikes and slow waves) in gastrointestinal smooth muscles. In: Bülbring E, Brading AF, Jones AW, Tomita T, editors. Smooth Muscle: An Assessment of Current Knowledge. London: Edward Arnold; 1981. pp. 127–156. [Google Scholar]
- van Helden DF, Imtiaz MS, Nurgaliyeva K, von der Weid P, Dosen PJ. Role of calcium stores and membrane voltage in the generation of slow wave action potentials in guinea-pig gastric pylorus. Journal of Physiology. 2000;524:245–265. doi: 10.1111/j.1469-7793.2000.00245.x. [DOI] [PMC free article] [PubMed] [Google Scholar]
- Ward SM, Brennan MF, Jackson VM, Sanders KM. Role of PI3-kinase in the development of interstitial cells and pacemaking in murine gastrointestinal smooth muscle. Journal of Physiology. 1999;516:835–846. doi: 10.1111/j.1469-7793.1999.0835u.x. [DOI] [PMC free article] [PubMed] [Google Scholar]
- Ward SM, Burns AJ, Torihashi S, Sanders KM. Mutation of the proto-oncogene c-kit blocks development of interstitial cells and electrical rhythmicity in murine intestine. Journal of Physiology. 1994;480:91–97. doi: 10.1113/jphysiol.1994.sp020343. [DOI] [PMC free article] [PubMed] [Google Scholar]
- Ward SM, Harney SC, Bayguinov JR, McLaren GJ, Sanders KM. Development of electrical rhythmicity in the murine gastrointestinal tract is specifically encoded in the tunica muscularis. Journal of Physiology. 1997;505:241–258. doi: 10.1111/j.1469-7793.1997.241bc.x. [DOI] [PMC free article] [PubMed] [Google Scholar]


