

Abstract
Adipose tissue blood flow (ATBF) rises after nutrient ingestion. It is not clear whether this is due to insulin. The aim of this study was to investigate the role of insulin in the regulation of subcutaneous ATBF. We have investigated the role of insulin in the regulation of ATBF in normal, healthy subjects in a three-step procedure to determine the functional level at which insulin may potentially exert its effect. Fifteen subjects were studied on two occasions. On the first visit, 75 g oral glucose was given. In the second, similar plasma concentrations of insulin and glucose were achieved by dynamic intravenous infusions of insulin and glucose. The increase in ATBF after oral glucose (4.2 ± 1.4 ml min−1 (100 g tissue)−1, P = 0.01) was significantly greater (P < 0.05) than that after intravenous infusions (1.5 ± 0.6 ml min−1 (100 g tissue)−1 P < 0.05). For the local delivery of potentially vasoactive substances and simultaneous measurement of ATBF, we describe a novel combination of methods, which we have called ‘microinfusion’. We have used this technique to show that locally infused insulin, even at pharmacological concentrations, had no demonstrable effect on ATBF in nine subjects. We conclude that whilst insulin does not have a direct effect on ATBF, it is likely to be an important mediator, possibly acting via sympathetic activation. In the postprandial state, other candidate peptides and hormones are also likely to play important roles.
Adipose tissue is highly vascularised. It has long been recognised that adipose tissue blood flow (ATBF) is not constant, and that it increases during times of stress when the need for lipid mobilisation is increased. A major role for the sympathetic innervation of adipose tissue in regulation of ATBF has long been established (Rosell, 1969), thus co-ordinating increases in lipolysis with perfusion. More recently, it has also been recognised that ATBF increases in response to nutritional stimuli. Thus, ATBF increases in response to oral glucose ingestion (Bülow et al. 1987; Karpe et al. 2002) and mixed meals (Coppack et al. 1992; Summers et al. 1998). The increase in ATBF in the postprandial period does not seem to be temporally co-ordinated with increase in lipaemia, lipoprotein lipase action or adipose tissue fat deposition but more with increase in insulin concentration and suppression of non-esterified fatty acids (NEFAs) (Coppack et al. 1992). The actual stimulus for this nutrient-related increase in ATBF is, however, not clear. The effect of hyperinsulinaemia per se has not been consistent, with some observations of an increase in ATBF under conditions of euglycaemia (Henry et al. 1996; Rosdahl et al. 1998) and hypoglycaemia (Hagström-Toft et al. 1997; Moberg et al. 1997) but other findings of no effect in conditions of euglycaemia (Hagström-Toft et al. 1997; Stallknecht et al. 2000). Insulin has been advocated to be a vasodilator in skeletal muscle, at least under pharmacological conditions (Yki-Järvinen & Utriainen, 1998). Very high concentrations of insulin seem to induce a nitric oxide-mediated vasodilatation (Steinberg et al. 1994), possibly through an insulin-mediated increase of endothelial nitric oxide synthase expression. On the other hand, insulin also suppresses NEFAs, which have been shown to impair the vasodilatory response (Steinberg et al. 1997). Obviously, compared with skeletal muscle, the environment within adipose tissue is subject to much larger fluctuations in NEFA concentration. Thus, if the physiological relationship between fluctuation in NEFA concentrations and blood flow exists, adipose tissue would be the primary organ for such regulation.
Because of the potential importance of the relationship between insulin action, NEFA concentration and ATBF in the postprandial period, we have sought to define more clearly the role of insulin in the regulation of ATBF in normal, healthy subjects.
METHODS
The Central Oxford Research Ethics Committee approved the studies, which conformed to the Declaration of Helsinki, and all subjects gave informed consent. Some of the data in response to oral glucose have been published previously as part of a study on the methodology for the measurement of ATBF (Karpe et al. 2002).
Oral versus intravenous glucose administration
For the main study, 15 healthy subjects (10 male, 5 female) participated; their median age was 32 (23–52) years and median body mass index (BMI) was 23.6 (19.4–29.6) kg m−2. They were studied at rest, following an overnight fast and asked to refrain from strenuous exercise, smoking or alcohol for 24 h beforehand. They attended on two occasions; on the first, 75 g oral glucose was given and on the second, similar plasma concentrations of insulin and glucose were achieved by dynamic intravenous infusions (i.v. insulin–glucose).
A cannula was inserted retrogradely into a distal forearm vein and kept patent by a continuous slow infusion of saline (NaCl, 9 g l−1). The lower part of the forearm was heated to provide arterialised blood samples. Samples were taken at 10 min intervals throughout the study into heparinised tubes. At time zero, 75 g glucose, dissolved in 200 ml water and flavoured with fresh lemon, was ingested.
ATBF was measured by the 133Xe washout technique (Larsen et al. 1966). A dose of 2 MBq 133Xe in 0.9 % saline was injected into the para-umbilical area of the subcutaneous adipose tissue, approximately 10 mm deep. After an equilibration period of 30 min, ATBF was monitored by collecting continuous 20 s readings from a γ-counter probe placed over the exact site of injection and taped firmly in place (Samra et al. 1995). Blood flow was calculated from a semilog plot of disappearance of counts versus time in 10 min intervals. ATBF was then calculated according to the equation ATBF = slope of semilog plot of partition coefficient × 100 (Larsen et al. 1966). The partition coefficient between adipose tissue and blood was taken as 10 ml g−1.
Plasma glucose was measured the same day on samples stored at 4 °C using an enzymatic method (Clark et al. 1990). Plasma insulin (Pharmacia and Upjohn, Milton Keynes, UK) and C-peptide (Linco kit, Biogenesis, Poole, UK) were measured by radioimmunoassay. Plasma noradrenaline was measured by high performance liquid chromatography with electrochemical detection (Forster & Macdonald, 1999) on samples stored at −70 °C. Plasma non-esterified fatty acids (NEFAs) were measured using the WAKO NEFA C kit (Alpha Laboratories, Eastleigh, UK). These analyses were performed on samples stored at −20 °C.
The second visit involved intravenous administration of glucose (200 mg ml−1) and insulin (10 U of insulin in 58 ml of saline plus 2 ml of homologous blood) to achieve plasma glucose and insulin concentrations mimicking the first study. Insulin infusion was modified from algorithms developed by Kearney et al. (1996), and 0.6 mU kg−1 min−1 was infused from time 0 to +30 min. The subsequent infusion rates were 0.4 (30–45 min), 0.3 (45–60 min), 0.2 (60–90 min) and 0.1 mU kg−1 min−1 (90–150 min), respectively. Glucose infusion was varied to match the pattern after oral ingestion of glucose and blood glucose concentration monitored every 5 min to adjust the glucose infusion rate using a reflectometer (Hemocue, Sheffield, UK).
Hyperinsulinaemic, euglycaemic regimen
Four subjects (3 male, 1 female) who showed a high ATBF response from the oral visit were invited back to participate in a further study in which euglycaemia was maintained at 5 mmol l−1 during the same dynamic insulin infusion as the hyperglycaemic clamp visit of the respective subjects (i.v.eu insulin–glucose). This protocol was designed to eliminate the potential effect of high glucose concentrations on ATBF, which has been observed in muscle blood flow.
Microinfusion studies
For the delivery of potentially vasoactive substances and simultaneous measurement of ATBF, a novel combination of techniques was used, which we refer to as ‘microinfusion’. In principle, infusion of the vasoactive substance is made directly into the exact location into which 133Xe has been deposited, allowing the recording of 133Xe disappearance in relation to changes in local tissue environment. To achieve this, we used a small cannula, 9 mm long, with internal diameter 0.38 mm and outer diameter 1.5 mm, designed for the continuous delivery of insulin in diabetic subjects (‘Quick-set’ infusion set, MiniMed, Applied Medical Technology Ltd, Cambridge, UK). It was inserted into the abdominal subcutaneous tissue, and the insertion needle removed. After allowing 20 min for the tissue to recover, whilst infusing with saline at 2 μl min−1, 133Xe was injected directly through the hub of the device. The cannula was then perfused for 2 min at a rate of 50 μl min−1 with saline to allow wash through of the 133Xe, and for a further 40 min at 2 μl min−1 to allow equilibration.
We tested the adipose tissue local response to the known vasodilator isoprenaline, in order to validate the microinfusion technique. Four healthy volunteers participated in the experiments, and they were instructed to fast overnight, as in the previous procedures. After the 40 min equilibration period with saline, baseline ATBF was recorded for 30 min. Then the infusion was switched to isoprenaline (10−5 m) at 2 μl min−1 for 60 min. These conditions correspond to those used for the study of adipose tissue vasodilation using microdialysis (Enocksson et al. 1995). ATBF responded to isoprenaline (Fig. 1) with a median increase of 185 % (range 115 to 375 %); overall there was a significant change with time (P < 0.05). This indicated that the technique was successful for the local delivery of vasoactive agents and it was therefore used in subsequent experiments for the local administration of insulin to adipose tissue.
Figure 1. Use of the technique of microinfusion to induce a local increase in adipose tissue blood flow.
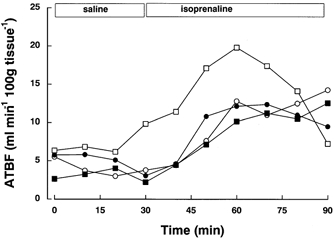
Adipose tissue blood flow (ATBF) in 4 subjects during saline and isoprenaline microinfusion (10−5 mol l−1) at 2 μl min−1.
A further nine subjects (4 male, 5 female) took part in a separate study to investigate the effect of locally administered insulin by microinfusion on ATBF. Their median age was 26 (19–53) years and BMI was 21.0 (19.7–24.0) kg m−2. Two sites were studied simultaneously on each subject, to allow direct comparison of the effects of insulin with a control infusion. The sites were 5 cm either side of the umbilicus. A stock solution of 100 U ml−1 human recombinant insulin (Sigma, Poole, UK) in HCl (30 mmol l−1) was prepared and sterilised by filtration. Working solutions of insulin were prepared by dilution of the stock solution in saline containing 10 % homologous plasma to prevent adherence of insulin to the infusion system. The appropriate diluent was used for the control infusion.
After the 40 min equilibration period insulin diluent was infused for 30 min at both sites, and baseline 133Xe removal from the tissue was continuously recorded as before. At time zero, on one site, chosen at random, the diluent was switched to a low concentration insulin infusion (4 mU ml−1) at a rate of 2 μl min−1, which was maintained for 60 min. At the other site, the diluent infusion was continued. Then, the insulin infusion was increased to a high concentration (400 mU ml−1) at the same site for another 60 min and the contralateral site was changed to the appropriate diluent. Then, the subject was given a 75 g oral glucose drink, as described above, whilst the infusions were maintained.
The local infusion concentrations and pump rate chosen were based on the following assumptions: the tissue volume exposed to insulin was 1 ml and the half-life of insulin within that volume was 10 min. Theoretically, the low insulin infusion rate would achieve tissue concentrations corresponding to a very high physiological insulin exposure. The total dose of insulin given during the 4 h exposure was 1.9 mU for the low dose insulin, and 0.19 U for the high dose insulin.
Calculations and statistics
Changes in concentrations with time were assessed by repeated-measures analysis of variance (RM-ANOVA) using time and treatment as within-subjects factors. Calculations were done with SPSS for Windows v. 8.0 (SPSS Inc., Chicago, IL, USA).
Peak values for ATBF were calculated as the mean of three selected points between 0 and 100 min as follows: peak ATBF = the three contiguous points (including the maximum) that give the highest mean value. Absolute change in ATBF was calculated as peak minus mean baseline. The Spearman rank correlation coefficient (rs) was used to test for associations between variables.
Data were analysed as area under the curve (AUC) and incremental area under the curve (iAUC). Data are expressed as means ± standard error of the mean (s.e.m.) or median and range. Comparison of differences between subjects was assessed by the Mann-Whitney U test, and between treatments was assessed by Student's paired t test.
RESULTS
Oral glucose and intravenous insulin–glucose administration
Plasma glucose and insulin concentrations increased after oral glucose as expected, whereas the NEFA concentration decreased rapidly (Fig. 2). The intravenous administration of glucose and insulin achieved similar plasma concentrations of these metabolites. Plasma insulin concentrations (Fig. 2A), tended to be higher after i.v. insulin–glucose early in the time course, although there was no significant difference in AUC (33400 ± 3100 after oral and 39600 ± 3700 pmol l−1 (180 min)−1 after i.v. glucose). Plasma glucose concentrations were however, marginally higher after i.v. insulin–glucose (Fig. 2C) (AUC after oral glucose was 1361 ± 36 and 1419 ± 35 mmol l−1 (180 min)−1 after i.v. insulin–glucose, P < 0.05). Plasma C-peptide concentrations (Fig. 2B) increased rapidly after oral glucose, and also increased slightly after the intravenous regimen. There was a significant difference in AUC (289 ± 27 and 212 ± 24 nmol l−1 (180 min)−1 after oral and i.v. insulin–glucose respectively, P = 0.001). Plasma NEFA concentrations were lower after i.v. insulin–glucose administration (Fig. 2D); AUCs were 24500 ± 3000 and 17900 ± 1600 μmol l−1 (180 min)−1 after oral and i.v. insulin–glucose respectively, P = 0.002.
Figure 2. Plasma hormone and metabolic responses to oral and intravenous insulin–glucose.

Plasma responses to 75 g oral glucose (•) and intravenous insulin–glucose (○) in 15 subjects. Results are shown as means and m. Subjects attended the oral glucose experiment first. The intravenous insulin–glucose regimen was then devised on an individual basis to mimic the plasma glucose and insulin concentrations measured on the first visit. Full details are given in the text.
ATBF increased after oral glucose as expected and also in response to i.v. insulin–glucose (Fig. 3). ATBF was greater after oral glucose, shown by RM-ANOVA (P < 0.005) and there was also a time-treatment interaction (P < 0.001). ATBF AUC (ml min−1 (100 g tissue)−1 (180 min)−1) was also greater after oral (556 ± 144) than i.v. insulin–glucose (327 ± 84), P < 0.005. Moreover, the individual ATBF responses (AUC) to oral and i.v. glucose/insulin were significantly correlated (rs = 0.87, P < 0.0001), indicating that the relative response was similar on both occasions. ATBF absolute increase was 4.2 ± 1.4 ml min−1 (100 g tissue)−1 after oral glucose and 1.5 ± 0.6 ml min−1 (100 g tissue)−1 after i.v. insulin–glucose (P < 0.05).
Figure 3. Adipose tissue blood flow in response to oral and intravenous insulin–glucose regimens.
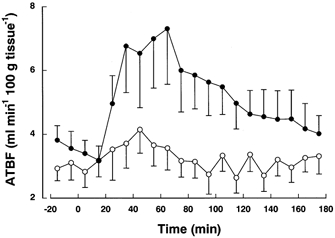
Adipose tissue blood flow (ATBF) in response to oral glucose (•) and intravenous insulin–glucose (○) in 15 subjects. Results are shown as means and m. Subjects attended the oral glucose experiment first. The intravenous insulin–glucose regimen was then devised on an individual basis to mimic the plasma glucose and insulin concentrations measured on the first visit. Full details are given in the text.
Baseline (overnight fasting) ATBF did not differ between visits (3.69 ± 0.46 and 3.02 ± 0.42 ml min−1 (100 g tissue)−1 after oral and i.v. glucose/insulin respectively). Peak ATBF after oral glucose, 7.89 ± 1.65 ml min−1 (100 g tissue)−1 was significantly higher than baseline (P < 0.01). Peak ATBF after i.v. insulin–glucose (4.53 ± 0.78 was also significantly higher than baseline (P < 0.05), but significantly lower than after oral glucose (P < 0.05).
Hyperinsulinaemic, euglycaemic regimen
Plasma insulin concentrations achieved by i.v.eu insulin–glucose were virtually identical to those with i.v. insulin–glucose administration. There was a decrease in C-peptide concentrations during the euglycaemic clamp; values were 0.53 ± 0.11, 0.24 ± 0.04, 0.19 ± 0.02 and 0.20 ± 0.02 nmol l−1, at 0, 60, 120 and 180 min, respectively, indicating limited endogenous insulin production. Plasma glucose concentrations were kept euglycaemic (mean fasting glucose was 5.13 ± 0.04 mmol l−1 and the value during the infusions was 4.63 ± 0.05 mmol l−1). There was a significant change in ATBF (P < 0.001) in response to i.v.eu insulin–glucose (Fig. 4), with a mean increase of 7.8 ± 2.3 ml min−1 (100 g tissue)−1. In comparison, the increase was 11.3 ± 3.1 after oral and 4.1 ± 1.2 after i.v. insulin–glucose in the same four subjects.
Figure 4. Adipose tissue blood flow in response to euglycaemic insulin–glucose regimen.
Adipose tissue blood flow (ATBF) after oral glucose (•), i.v. insulin–glucose (○) and i.v.eu insulin–glucose (▴) in 4 subjects.
Plasma noradrenaline concentrations, which were available for all subjects from i.v.eu insulin–glucose administration, were combined with results from five subjects from the oral glucose and i.v. insulin–glucose experiments (n = 14 in total). Overall, mean plasma noradrenaline concentrations tended to increase from 0.86 ± 0.08 pmol l−1 at baseline to 0.93 ± 0.07 pmol l−1 30 min after treatment. The increase in noradrenaline from baseline to 30 min after oral or intravenous insulin–glucose was correlated with absolute increase in ATBF (rs = 0.53, P = 0.05) but not with increase in plasma insulin (rs = −0.17, P =0.56).
Microinfusion
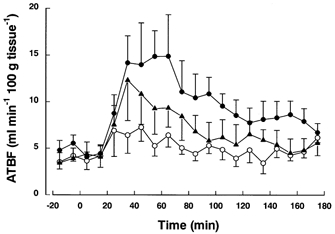
ATBF during microinfusion of insulin is shown in Fig. 5. Calculation of iAUC of ATBF showed that there were no significant differences between the infusion of either low- or high-dose subcutaneous insulin infusion, compared with infusion of diluent on the control site, indicating that local administration of physiological and supra-physiological concentrations of insulin did not change the blood flow. The magnitude of increase after oral glucose was also not significantly different (iAUC was 93.7 ± 37.6 and 99.6 ± 23.9 ml min−1 (100 g tissue)−1 (60 min)−1 for insulin and control sites, respectively); thus, the response to the oral glucose was not dependent on the local insulin concentration.
Figure 5. Adipose tissue blood flow in response to oral glucose, and the effects of local administration of insulin by microinfusion.

Adipose tissue blood flow (ATBF) in response to low- (4 mU ml−1) and high-dose (400 mU ml−1) insulin infusion and oral glucose (•) in nine subjects. For the control (○), diluent was infused. Full details are given in the text. Results are shown as mean and s.e.m.
DISCUSSION
In this study, we designed a series of experiments to investigate the role of insulin as a mediator of increased ATBF after the ingestion of nutrients. We used oral ingestion of glucose to represent a meal containing carbohydrate. Then we used an i.v. insulin–glucose regimen, which was successful in replicating the plasma glucose and insulin concentrations achieved after the ingestion of oral glucose. It therefore provided a useful model for the oral ingestion of glucose whilst by-passing any effects of the gut. Nevertheless, we demonstrated an increase in ATBF during the intravenous insulin–glucose regimen, in this novel study design. Despite achieving slightly higher plasma glucose and insulin concentrations during the i.v. insulin–glucose regimen, the ATBF response was markedly lower compared with oral glucose. These results show that in the postprandial state, factors in addition to the increase in plasma insulin concentration must facilitate increased ATBF. One major difference between the oral and intravenous glucose administration in the present study is the exposure of the splanchnic bed to glucose. Links between splanchnic bed glucoreceptors and the sympathoadrenal system have been hypothesised in mammals and may therefore account for a difference in blood flow response between the experimental procedures (Donovan et al. 1991). In addition, gut hormones may play a role here, but little is known of any specific vasodilatory actions. The increase in ATBF after a meal may be compared with increase in intestinal blood flow. For example, splanchnic blood flow also increases sharply in response to oral but not intravenous glucose (Brundin et al. 1996). In contrast, extra-splanchnic tissues showed no significant increase in blood flow. The potential mechanisms for this hyperaemia have been discussed recently (Matheson et al. 2000) and are clearly complex and not fully understood. For example, a number of gut hormones have vasoactive properties but their involvement is not clear. GLP-1 has recently been shown to have no effect on human ATBF (Bertin et al. 2001). C-peptide, a hormone which has been shown to have some vasodilatory properties in cutaneous tissue (Wahren et al. 2000), is not likely to be a candidate for the post-prandial increase in ATBF since its plasma concentration decreased during the i.v.eu insulin–glucose regimen in the present study.
We found a pronounced absolute increase in ATBF during the i.v.eu insulin–glucose regimen, showing that there was no additional effect of hyperglycaemia. Other groups have also reported increased ATBF in response to euglycaemic protocols (Henry et al. 1996; Rosdahl et al. 1998) whereas others have not (Hagström-Toft et al. 1997; Stallknecht et al. 2000). Our findings are in agreement with a previous study in which hyperglycaemia at basal insulin concentrations produced no change in ATBF in six healthy men (Henry et al. 1996). The reasons for these discrepancies are not obvious, but may reflect differences in methodology for the determination of ATBF, as the currently employed xenon washout technique is likely to be more sensitive than microdialysis ethanol inflow/ outflow ratios (Karpe et al. 2002) or variability in response between subjects. Using our sensitive technique of measuring ATBF over 10 min intervals, we have also observed that the ATBF seen after institution of hyperinsulinaemia is sometimes short-lived, lasting from 20 to 40 min.
In these studies, we have clearly shown that increased systemic concentrations of insulin mediate an increase in ATBF that is independent of the gut and we therefore designed protocols to determine if insulin exerts its effect locally, when infused directly into the subcutaneous adipose tissue depot. We used a novel procedure, which combined the well-established technique of 133Xe washout with continuous subcutaneous infusion. We used this technique, which we refer to as microinfusion, to show that locally infused insulin, even at pharmacological concentrations, had no demonstrable effect on ATBF. However, with this technique, it is not possible to know the exact ‘sphere of influence’ of the target molecule in comparison with xenon. On one hand, large molecules will diffuse more slowly through the extracellular space as the molecular radius is inversely proportional to the diffusivity (Stokes-Einstein's diffusivity equation). On the other hand lipophilic molecules, such as xenon, will be taken up by the adipocytes more quickly than hydrophilic molecules. Clearly, the technique can only give qualitative estimates of function. When using insulin (large hydrophilic molecule), and comparing it with the physiological response of isoprenaline, we were aware of this concern and therefore we used, on a tissue level, a high dose of insulin. Our finding challenges the hypothesis that insulin has a direct effect on ATBF.
Locally infused insulin is likely to decrease adipose tissue lipolysis via inhibition of hormone-sensitive lipase leading to decreased release of NEFAs. We therefore hypothesise that suppression of NEFA release from adipose tissue in the post-prandial period is not likely to be a key mediator of the increase in ATBF.
It is well known that food intake (Patel et al. 1999) or imposed hyperinsulinaemia (Anderson et al. 1991; Vollenweider et al. 1993) induces sympathetic activation. A sign of that is an increased plasma concentration of noradrenaline, which is likely to derive from spillover in muscle and adipose tissue (Patel et al. 1999). In agreement with the idea of increased sympathetic activation induced by an imposed hyperinsulinaemia, we found correlation between the increase of plasma noradrenaline and the increase in ATBF, but not between increase in plasma insulin concentrations and increase in noradrenaline. We speculate that this is due to the non-linear relationship between hyperinsulinaemia (Anderson et al. 1991; Berne et al. 1992) and degree of sympathetic action or the relative status of adipose tissue adrenergic receptor expression, the latter possibly down-regulated by repeated activation of the sympathetic nervous system by constant hyperinsulinaemia.
In summary, we have shown that insulin per se does not seem to affect ATBF; rather that insulin is likely to stimulate ATBF via other mechanisms such as sympathetic activation. This indirect mechanism may involve insulin sensitivity and could have implications for adipose tissue function in obesity, insulin resistance syndrome and type 2 diabetes (Summers et al. 1999). The role of intestinal hormones in regulating ATBF remains to be established.
Acknowledgments
This work was funded by the Wellcome Trust. We thank Mrs Sandy Humphreys for invaluable help.
REFERENCES
- Anderson EA, Hoffman RP, Balon TW, Sinkey CA, Mark AL. Hyperinsulinemia produces both sympathetic neural activation and vasodilation in normal humans. Journal of Clinical Investigation. 1991;87:2246–2252. doi: 10.1172/JCI115260. [DOI] [PMC free article] [PubMed] [Google Scholar]
- Berne C, Fagius J, Pollare T, Hjemdahl P. The sympathetic response to euglycaemic hyperinsulinaemia. Evidence from microelectrode nerve recordings in healthy subjects. Diabetologia. 1992;35:873–879. doi: 10.1007/BF00399935. [DOI] [PubMed] [Google Scholar]
- Bertin E, Arner P, Bolinder J, Hagström-Toft E. Action of glucagon and glucagon-like peptide-1-(7–36) amide on lipolysis in human subcutaneous adipose tissue and skeletal muscle in vivo. Journal of Clinical Endocrinology and Metabolism. 2001;86:1229–1234. doi: 10.1210/jcem.86.3.7330. [DOI] [PubMed] [Google Scholar]
- Brundin T, Branström R, Wahren J. Effects of oral vs. i.v. glucose administration on splanchnic and extrasplanchnic O2 uptake and blood flow. American Journal of Physiology. 1996;271:E496–504. doi: 10.1152/ajpendo.1996.271.3.E496. [DOI] [PubMed] [Google Scholar]
- Bülow J, Astrup A, Christensen NJ, Kastrup J. Blood flow in skin, subcutaneous adipose tissue and skeletal muscle in the forearm of normal man during an oral glucose load. Acta Physiologica Scandinavica. 1987;130:657–661. doi: 10.1111/j.1748-1716.1987.tb08189.x. [DOI] [PubMed] [Google Scholar]
- Clark ML, Humphreys SM, Frayn KN. Stability of plasma glucose during storage. Annals of Clinical Biochemistry. 1990;27:373–377. doi: 10.1177/000456329002700415. [DOI] [PubMed] [Google Scholar]
- Coppack SW, Evans RD, Fisher RM, Frayn KN, Gibbons GF, Humphreys SM, Kirk ML, Potts JL, Hockaday TDR. Adipose tissue metabolism in obesity: lipase action in vivo before and after a mixed meal. Metabolism. 1992;41:264–272. doi: 10.1016/0026-0495(92)90269-g. [DOI] [PubMed] [Google Scholar]
- Donovan CM, Cane P, Bergman RN. Search for the hypoglycemia receptor using the local irrigation approach. Advances in Experimental Medicine and Biology. 1991;291:185–196. doi: 10.1007/978-1-4684-5931-9_14. [DOI] [PubMed] [Google Scholar]
- Enocksson S, Shimizu M, Lönnqvist F, Nordenström J, Arner P. Demonstration of an in vivo functional β3-adrenoceptor in man. Journal of Clinical Investigation. 1995;95:2239–2245. doi: 10.1172/JCI117914. [DOI] [PMC free article] [PubMed] [Google Scholar]
- Forster C, Macdonald I. The assay of the catecholamine content of small volumes of human plasma. Biomedical Chromatography. 1999;13:209–215. doi: 10.1002/(SICI)1099-0801(199905)13:3<209::AID-BMC820>3.0.CO;2-Z. [DOI] [PubMed] [Google Scholar]
- Hagström-Toft E, Enoksson S, Moberg E, Bolinder J, Arner P. Absolute concentrations of glycerol and lactate in human skeletal muscle, adipose tissue, and blood. American Journal of Physiology. 1997;273:E584–592. doi: 10.1152/ajpendo.1997.273.3.E584. [DOI] [PubMed] [Google Scholar]
- Henry S, Schneiter P, Jéquier E, Tappy L. Effects of hyperinsulinemia and hyperglycemia on lactate release and local blood flow in subcutaneous adipose tissue of healthy humans. Journal of Clinical Endocrinology and Metabolism. 1996;81:2891–2895. doi: 10.1210/jcem.81.8.8768847. [DOI] [PubMed] [Google Scholar]
- Karpe F, Fielding BA, Ilic V, Humphreys SM, Frayn KN. Monitoring adipose tissue blood flow in man: a comparison between the 133xenon washout method and microdialysis. International Journal of Obesity. 2002;26:1–5. doi: 10.1038/sj.ijo.0801843. [DOI] [PubMed] [Google Scholar]
- Kearney MT, Cowley AJ, Stubbs TA, Macdonald IA. Effect of a physiological insulin infusion on the cardiovascular responses to a high fat meal: evidence supporting a role for insulin in modulating postprandial cardiovascular homoeostasis in man. Clinical Science. 1996;91:415–423. doi: 10.1042/cs0910415. [DOI] [PubMed] [Google Scholar]
- Larsen OA, Lassen NA, Quaade F. Blood flow through human adipose tissue determined with radioactive xenon. Acta Physiologica Scandinavica. 1966;66:337–345. doi: 10.1111/j.1748-1716.1966.tb03208.x. [DOI] [PubMed] [Google Scholar]
- Matheson PJ, Wilson MA, Garrison RN. Regulation of intestinal blood flow. Journal of Surgical Research. 2000;93:182–196. doi: 10.1006/jsre.2000.5862. [DOI] [PubMed] [Google Scholar]
- Moberg E, Hagström-Toft E, Arner P, Bolinder J. Protracted glucose fall in subcutaneous adipose tissue and skeletal muscle compared with blood during insulin-induced hypoglycaemia. Diabetologia. 1997;40:1320–1326. doi: 10.1007/s001250050827. [DOI] [PubMed] [Google Scholar]
- Patel JN, Eisenhofer G, Coppack SW, Miles JM. Norepinephrine spillover in forearm and subcutaneous adipose tissue before and after eating. Journal of Clinical Endocrinology and Metabolism. 1999;84:2815–2819. doi: 10.1210/jcem.84.8.5882. [DOI] [PubMed] [Google Scholar]
- Rosdahl H, Lind L, Millgard J, Lithell H, Ungerstedt U, Henriksson J. Effect of physiological hyperinsulinemia on blood flow and interstitial glucose concentration in human skeletal muscle and adipose tissue studied by microdialysis. Diabetes. 1998;47:1296–1301. doi: 10.2337/diab.47.8.1296. [DOI] [PubMed] [Google Scholar]
- Rosell S. Nervous and pharmacological regulation of vascular reactions in adipose tissue. Advances in Experimental and Medical Biology. 1969;4:25–34. [Google Scholar]
- Samra JS, Frayn KN, Giddings JA, Clark ML, Macdonald IA. Modification and validation of a commercially available portable detector for measurement of adipose tissue blood flow. Clinical Physiology. 1995;15:241–248. doi: 10.1111/j.1475-097x.1995.tb00515.x. [DOI] [PubMed] [Google Scholar]
- Stallknecht B, Larsen JJ, Mikines KJ, Simonsen L, Bülow J, Galbo H. Effect of training on insulin sensitivity of glucose uptake and lipolysis in human adipose tissue. American Journal of Physiology - Endocrinology and Metabolism. 2000;279:E376–385. doi: 10.1152/ajpendo.2000.279.2.E376. [DOI] [PubMed] [Google Scholar]
- Steinberg HO, Brechtel G, Johnson A, Fineberg N, Baron AD. Insulin-mediated skeletal muscle vasodilation is nitric oxide dependent. A novel action of insulin to increase nitric oxide release. Journal of Clinical Investigation. 1994;94:1172–1179. doi: 10.1172/JCI117433. [DOI] [PMC free article] [PubMed] [Google Scholar]
- Steinberg HO, Tarshoby M, Monestel R, Hook G, Cronin J, Johnson A, Bayazeed B, Baron AD. Elevated circulating free fatty acid levels impair endothelium-dependent vasodilation. Journal of Clinical Investigation. 1997;100:1230–1239. doi: 10.1172/JCI119636. [DOI] [PMC free article] [PubMed] [Google Scholar]
- Summers LKM, Fielding BA, Ilic V, Quinlan PT, Frayn KN. The effect of triacylglycerol-fatty acid positional distribution on postprandial metabolism in subcutaneous adipose tissue. British Journal of Nutrition. 1998;79:141–147. doi: 10.1079/bjn19980025. [DOI] [PubMed] [Google Scholar]
- Summers LKM, Samra JS, Frayn KN. Impaired postprandial tissue regulation of blood flow in insulin resistance: a determinant of cardiovascular risk? Atherosclerosis. 1999;147:11–15. doi: 10.1016/s0021-9150(99)00172-0. [DOI] [PubMed] [Google Scholar]
- Vollenweider P, Tappy L, Randin D, Schneiter P, Jéquier E, Nicod P, Scherrer U. Differential effects of hyperinsulinemia and carbohydrate metabolism on sympathetic nerve activity and muscle blood flow in humans. Journal of Clinical Investigation. 1993;92:147–154. doi: 10.1172/JCI116542. [DOI] [PMC free article] [PubMed] [Google Scholar]
- Wahren J, Ekberg K, Johansson J, Henriksson M, Pramanik A, Johansson BL, Rigler R, Jornvall H. Role of C-peptide in human physiology. American Journal of Physiology - Endocrinology and Metabolism. 2000;278:E759–768. doi: 10.1152/ajpendo.2000.278.5.E759. [DOI] [PubMed] [Google Scholar]
- Yki-Järvinen H, Utriainen T. Insulin-induced vasodilatation: physiology or pharmacology? Diabetologia. 1998;41:369–379. doi: 10.1007/s001250050919. [DOI] [PubMed] [Google Scholar]