

Abstract
The medullary raphe nuclei contain putative central respiratory chemoreceptor neurones that are highly sensitive to acidosis. To define the primary stimulus for chemosensitivity in these neurones, the response to hypercapnic acidosis was quantified and compared with the response to independent changes in PCO2 and extracellular pH (pHo). Neurones from the ventromedial medulla of neonatal rats (P0-P2) were dissociated and maintained in tissue culture for long enough to develop a mature response (up to 70 days). Perforated patch clamp recordings were used to record membrane potential and firing rate while changes were made in pHo, PCO2 and/or [NaHCO3]o from baseline values of 7.4, 5 % and 26 mm, respectively. Hypercapnic acidosis (PCO2 9 %; pHo 7.17) induced an increase in firing rate to 285 % of control in one subset of neurones (‘stimulated neurones’) and induced a decrease in firing rate to 21 % of control in a different subset of neurones (‘inhibited neurones’). Isocapnic acidosis (pHo 7.16; [NaHCO3]o 15 mm) induced an increase in firing rate of stimulated neurones to 309 % of control, and a decrease in firing rate of inhibited neurones to 38 % of control. In a different group of neurones, isohydric hypercapnia (9 % PCO2; [NaHCO3]o 40 mm) induced an increase in firing rate of stimulated neurones by the same amount (to 384 % of control) as in response to hypercapnic acidosis (to 327 % of control). Inhibited neurones also responded to isohydric hypercapnia in the same way as they did to hypercapnic acidosis. In Hepes-buffered solution, both types of neurone responded to changes in pHo in the same way as they responded to changes in pHo in bicarbonate-buffered Ringer solution. It has previously been shown that all acidosis-stimulated neurones in the medullary raphe are immunoreactive for tryptophan hydroxylase (TpOH-ir). Here it was found that TpOH-ir neurones in the medullary raphe were immunoreactive for carbonic anhydrase type II and type IV (CA II and CA IV). However, CA immunoreactivity was also common in neurones of the hypoglossal motor nucleus, inferior olive, hippocampus and cerebellum, indicating that its presence is not uniquely associated with chemosensitive neurones. In addition, under the conditions used here, acetazolamide (100 μm) did not have a significant effect on the response to hypercapnic acidosis. We conclude that chemosensitivity of raphe neurones can occur independently of changes in pHo, PCO2 or bicarbonate. The results suggest that a change in intracellular pH (pHi) may be the primary stimulus for chemosensitivity in these putative central respiratory chemoreceptor neurones.
There are few physiological variables that are controlled as tightly as the pH of blood and cerebrospinal fluid. One of the most important mechanisms for control of pH is regulation of blood PCO2 through changes in lung ventilation. Although the peripheral chemoreceptors play a well-defined role in this response, particularly during co-existing hypoxia, the majority of the response to changes in CO2 under normal and hyperoxic conditions is due to the central chemoreceptors.
A fundamental question regarding the cellular mechanisms by which the central chemoreceptors respond to blood PCO2, is whether the primary stimulus is molecular CO2, intracellular pH (pHi), extracellular pH (pHo), HCO3−, or a combination of some of these stimuli. This has been a difficult question to answer, primarily because the specific neurones responsible for central chemoreception have not been identified. The analogous question has been more soluble for the peripheral chemoreceptors, whose cellular identity is known. For carotid body glomus cells, electrophysiological recordings combined with pHi imaging during exposure to different acid and/or base stimuli has permitted definition of the stimulus for chemotransduction. In those neurones, an increase in PCO2 results in a decrease in pHi. This decrease in pHi induces a decrease in potassium conductance, which in turn leads to depolarization and an increase in firing rate (Peers & Buckler, 1995).
Since the specific neurones responsible for central respiratory chemoreception have not been identified, it has been necessary to use indirect means to define their primary stimulus. In unanaesthetized goats, the ventilatory response has been correlated with changes in cerebrospinal fluid (CSF) pH, whether induced by respiratory acidosis or metabolic acidosis (Fencl et al. 1966). Using ventriculo-cisternal perfusion in goats in vivo, Pappenheimer et al. (Pappenheimer et al. 1965) concluded that alveolar ventilation was a unique function of pHo in the medulla over a range of values of CSF [HCO3−] and PCO2. However, others have reported that ventilation is not always directly related to extracellular pH of the medulla (Teppema et al. 1983; Shams, 1985; Tojima et al. 1991). It is difficult to make conclusions about the underlying cellular mechanisms using this type of in vivo experiment. For example, it is not possible to determine whether the respiratory response is due to changes in pHi or pHo without measuring pHi in the specific cells involved. Changes in pH and CO2 can also alter local cerebral blood flow, which could contribute to results obtained in vivo. Thus, the most direct method for defining the primary stimulus for the central chemoreceptors would be to isolate the central chemoreceptor neurones, and then to use an approach similar to that used to study isolated peripheral chemoreceptors.
Based on classical experiments in vivo, it was once thought that the ventrolateral medulla (VLM) was the sole site of central chemoreception (Mitchell et al. 1963; Schlaefke et al. 1970). However, there are now several groups of neurones outside the VLM that are also considered strong candidates for central chemoreceptors. For example, neurones that respond to acid/base stimuli are located within many other brainstem regions associated with respiratory and autonomic control, including the medullary raphe (Richerson, 1995), nucleus tractus solitarius (NTS) (Dean et al. 1990), locus coeruleus (Pineda & Aghajanian, 1997), ventral respiratory group (Kawai et al. 1996) and hypothalamus (Dillon & Waldrop, 1992). Microinjections of acetazolamide into many of these same locations increases ventilation in vivo (Coates et al. 1993; Bernard et al. 1996; Nattie, 1999), probably by inducing focal acidosis. It remains unclear which of these chemosensitive neurones are responsible for the large increase in ventilation that occurs in vivo in response to a small change in CO2, in part because the response of most of these neurones to small physiologically relevant changes in pH has not been quantified. Despite this uncertainty, it is probable that one, some, or all the groups of chemosensitive neurones identified to date are central chemoreceptors. Thus, defining the mechanisms of chemosensitivity in these putative central chemoreceptor neurones is likely to provide insight into the mechanisms of central respiratory chemoreception in vivo.
Chemosensitive neurones in the medullary raphe have many properties expected of central respiratory chemoreceptors. There are two subsets of raphe neurones with opposite responses to changes in pH between 7.2 and 7.6: one that is stimulated by acidosis, and another that is inhibited (Richerson, 1995; Wang et al. 1998). These two types of chemosensitive neurone have been proposed to act in opposite ways to affect respiration and other pH-sensitive CNS functions (Richerson, 1995; Richerson et al. 2001). The subset that are stimulated by acidosis are a homogeneous phenotypic subset of neurones that are all serotonergic (Wang et al. 2001). Serotonergic neurones within this region project to the major respiratory nuclei (Steinbusch, 1981), and contain the neuropeptides thyrotropin releasing hormone (TRH) and substance P (Dean et al. 1993). All three neurotransmitters stimulate breathing (Millhorn et al. 1980; Mueller et al. 1984; Murakoshi et al. 1985; Lalley, 1986). Homologous serotonergic neurones are also located within the VLM, and may have contributed to the observation that acid stimuli applied to the rostral and caudal ventrolateral medullary surface induce an increase in ventilation in vivo (Mitchell et al. 1963; Schlaefke et al. 1970). The hypothesis that raphe neurones play an important role in respiratory chemoreception is supported by data from in vivo experiments (Mueller et al. 1984; Veasey et al. 1995; Bernard et al. 1996).
Here, we have quantified the response of medullary raphe neurones to changes in pHo, PCO2 and [NaHCO3]o to determine the primary stimulus for chemosensitivity at the cellular level. These experiments also provide the most complete quantification to date of the response to acid/ base changes of any of the putative central respiratory chemoreceptors. It was found that a response could occur in both stimulated and inhibited raphe neurones independently of changes in PCO2, pHo, or [NaHCO3]o. The results are most consistent with the conclusion that pHi is the primary stimulus for chemosensitivity. We have also determined that carbonic anhydrase is present in these neurones, but does not appear to be critical for a normal response to hypercapnic acidosis under the experimental conditions used here. A preliminary report of this work has previously been published (Wang et al. 1997).
METHODS
Cell culture
Cultures were prepared from neonatal (P0-P2) Sprague-Dawley rats using methods described previously (Wang et al. 1998, 2001; Wang & Richerson, 1999, 2000). All experiments were approved by the Yale University Animal Care and Use Committee. Briefly, rats were killed by decapitation. The rostral ventromedial medulla (VMM) containing the raphe pallidus, raphe magnus, a portion of the raphe obscurus and tissue immediately adjacent to these nuclei was microdissected. Dissected tissue was digested with papain, triturated, and plated onto poly-l-ornithine and laminin coated coverslips. Cells were fed with glial-conditioned medium (10 % FBS in 60 % MEM + 40 % Neurobasal Medium with B27 supplement; with penicillin/streptomycin; conditioned for 1 day by VMM cultures). Basic fibroblast growth factor (bFGF; 0.1–1 ng ml−1) and fibroblast growth factor 5 (FGF-5; 1–10 ng ml−1) were also added to the culture medium to enhance survival. Cells were first fed on days 4–7 with a one-half volume change of Neurobasal/B27, supplemented with cytosine α-d-arabino-furanoside hydrochloride (Ara-C; 3 μm) to inhibit glial growth. They were then fed every one to two weeks with a one-half volume change of Neurobasal/B27. This protocol leads to cultures that consist of a bed of glia, with neurones scattered on the surface. Other cell types may also be present (vascular endothelial cells, smooth muscle, ependymal cells, etc.), but these have not been characterized.
Recordings were made after cells were grown in culture for up to 70 days (mean, 28 days). In tissue culture, raphe neurones mature along a similar time course as in vivo (Wang & Richerson, 1999), and after 12 days in vitro have developed responses to CO2 that more closely resemble the responses of adult rat neurones than those of neurones from the neonatal rats that were used to obtain the tissue.
Electrophysiological recordings
Coverslips were transferred to a recording chamber (E.W. Wright, Guilford, CT, USA) on a fixed-stage upright microscope (Axioskop FS, Carl Zeiss, Inc.). Neurones were continuously superfused at a rate of 3–4 ml min−1 with one of the solutions described below. Bath pH was continuously measured with a pH electrode (MI-414; Microelectrodes, Inc., Londonderry, NH, USA) placed in the inflow to the recording chamber. All experiments were performed at room temperature.
Electrophysiological recordings were made using the amphotericin perforated-patch technique, since whole-cell recording results in loss of repetitive firing and chemosensitivity in raphe neurones (Richerson, 1995). Electrodes (4–10 MΩ) were made from borosilicate glass (Corning 7052) using a micropipette puller (P-97; Sutter Instrument Co., Novato, CA, USA), and filled with intracellular solution containing (mm): potassium methanesulphonate 135, KCl 10, Hepes 5 and EGTA 1; pH 7.2; osmolarity 275 ± 10 mosmol l−1. Input resistance was usually > 200 MΩ (seal resistance ≥ 1 GΩ; access resistance typically 10–40 MΩ). Neurones were considered healthy with a resting potential ≤ −45 mV, action potential height ≥ 60 mV, and maintenance of repetitive firing if present early in the recording. Recordings were amplified (Axopatch 1D, Axon Instruments, Foster City, CA, USA), filtered (10 kHz, low-pass), and acquired at 10 kilosamples per second with a computerized data acquisition system (AT-MIO-16F-5, National Instruments, Austin, TX, USA) using custom-written software. Data was stored simultaneously in original form on videotape (Neurocorder DR-484, Neuro Data Inst. Corp., New York, NY, USA) and after compression on the hard disk of an IBM-compatible computer.
Recordings were made in current-clamp mode. As described previously (Wang et al. 1998, 2001; Wang & Richerson, 1999, 2000) depolarizing current was given (in 76 % of neurones in the current set of experiments) to achieve a target firing rate of approximately 1 Hz under control conditions (5 % CO2 and pH 7.4). The appropriate amount of current injection was determined at the onset of the recording, and then was maintained constant from that point on, so that the effects of acid/base changes could be monitored without interference from changes in current injection. In some cases, normal variability led to divergence of the mean firing rate under control conditions from the target firing rate, so that the achieved firing rate was not actually 1 Hz. Raphe neurones normally fire near 1 Hz during wakefulness in vivo (Mason, 1997; Jacobs & Fornal, 1999). When isolated, they decrease their firing rate, in part due to a loss of noradrenergic synaptic inputs (Vandermaelen & Aghajanian, 1983). Thus, the depolarizing current served to return their firing rate towards normal for the awake state. It has previously been shown that current injection does not alter the magnitude of the response to acid/base changes (Wang et al. 2001). If a neurone required hyperpolarization to decrease firing rate or stabilize membrane potential, that neurone was not used to study chemosensitivity since this is often a sign of an unstable recording.
Solutions used to change pHo and PCO2
Under control conditions, neurones were superfused with Ringer solution that contained (mm): NaCl 124, KCl 3, CaCl2 2, MgCl2 2, NaH2PO4 1.3, NaHCO3 26, and Dextrose 10, bubbled with 95 % O2-5 % CO2 at pH 7.4. As described previously (Richerson, 1995; Wang et al. 1998, 2001; Wang & Richerson, 1999, 2000), it was of interest to only study neurones with intrinsic chemosensitivity. Since non-chemosensitive neurones can be synaptically driven by neurones that are chemosensitive (Fukuda et al. 1980), 6-cyano-7-nitroquinoxaline-2,3-dione (CNQX; 10 μm), (±)-2-amino-5-phosphonopentanoic acid (AP-5; 50 μm), and picrotoxin (PTX; 100 μm) were added to block fast synaptic transmission.
Changes in acid/base status were induced by changing the control solution to one of the following solutions.
Changes in pHo caused by changes in PCO2 (hypercapnic acidosis and hypocapnic alkalosis)
To simulate respiratory acidosis and respiratory alkalosis in vitro, neurones were exposed to a change in PCO2 at constant [NaHCO3]o. This led to either hypercapnic acidosis or hypocapnic alkalosis. For these experiments, the same Ringer solution was used as during control conditions, bubbled with either 91% PO2-9 % PCO2, or 97 % PO2-3 % PCO2. This led to a change in pH from 7.4 to 7.17 or 7.63, respectively.
Changes in pHo at constant PCO2 (isocapnic acidosis and isocapnic alkalosis)
To simulate metabolic acidosis and metabolic alkalosis, a change in pHo was induced by altering [NaHCO3]o at constant PCO2. The isocapnic acidosis solution contained (mm): NaCl 135, KCl 3, CaCl2 2, MgCl2 2, NaH2PO4 1.3, NaHCO3 15, Dextrose 10, CNQX 0.01, AP-5 0.05 and PTX 0.1. The isocapnic alkalosis solution contained (mm): NaCl 110, KCl 3, CaCl2 2, MgCl2 2, NaH2PO4 1.3, NaHCO3 40, Dextrose 10, CNQX 0.01, AP-5 0.05 and PTX 0.1. The isocapnic acidosis and isocapnic alkalosis solutions were both bubbled with 95 % PO2-5 % PCO2. The pH of the isocapnic acidosis solution was 7.16, and the pH of the isocapnic alkalosis solution was 7.6.
Changes in PCO2 at ‘constant’ pHo (isohydric hypercapnia and isohydric hypocapnia)
To raise PCO2 at ‘constant’ pHo, the same solution that was used for isocapnic alkalosis was bubbled with 91 % PO2-9 % PCO2. This resulted in an increase in CO2 with only a small decrease in pHo of 0.04 units. To lower PCO2 while maintaining a ‘constant’ pHo, the solution used for isocapnic acidosis was bubbled with 97 % PO2-3 % PCO2. This resulted in a decrease in CO2 with only a small decrease in pHo of 0.03 units. The use of the same solutions as were used for isocapnic acid/base changes simplified the experiments, while leading to changes in CO2 with only small changes in pHo. This approach also served as an important internal control, since only three different solutions were used to expose neurones to seven different conditions.
Changes in pHo in the absence of CO2 and bicarbonate (non-bicarbonate buffer)
To examine the effect of changes in pHo in solutions that did not contain any CO2 or bicarbonate, neurones were superfused with Hepes-buffered solution that contained (mm): NaCl 124, KCl 3, CaCl2 2, MgCl2 2, NaH2PO4 1.3, sodium Hepes 26, Dextrose 10, CNQX 0.01, AP-5 0.05 and PTX 0.1, bubbled with 100 % PO2. The control Hepes-buffered solution was adjusted to pH 7.4. Two other solutions were prepared with the same formula, but the pH was adjusted to either 7.2 or 7.6 by titration with HCl or NaOH.
Culture medium, including FBS, bFGF, Neurobasal Medium and B27 supplement were purchased from Life Technologies, Inc. (Rockville, MD, USA). Modified Eagle's medium (MEM; 56419) was purchased from JRH Biosciences (Lenexa, KS, USA). All other salts and chemicals were purchased from Sigma Chemical Co. (St Louis, MO, USA).
Data analysis
Neurones were evaluated to determine whether they were chemosensitive using criteria described previously (Richerson, 1995; Wang et al. 1998, 2001; Wang & Richerson, 1999, 2000). The definition of chemosensitivity was based on the response of a neurone to hypercapnic acidosis and hypocapnic alkalosis. Spikes were detected with a threshold detection software algorithm, and firing rate plots were generated using a moving average technique (bin size, 1–2 s; 20 bins per point). Neurones were defined as chemosensitive if their response to changes in pH induced by changes in PCO2 was all of the following. (1) Reproducible and reversible on four or more changes in pH/CO2 (at least two exposures to a change in pH/CO2, with washout each time). (2) Consistent in time course for each stimulus. (3) Opposite in sign if the neurone was exposed to both acidosis and alkalosis, and; (4) a statistically significant increase or decrease in mean firing rate of at least 20 % per change in pH of 0.2 units (P ≤ 0.05 level; Student's two-tail t test), for at least four separate transitions. Based on these criteria, neurones were categorized as acidosis stimulated, acidosis inhibited, or acidosis unresponsive.
After neurones were classified based on their response to acid/base changes induced by changes in PCO2, their response to other types of acid/base disturbances (e.g. isocapnic acidosis, isohydric hypercapnia, etc.) was determined using the same four criteria, except that a neurone could be defined as responsive on the basis of a single exposure to an acid/base disturbance (with washout). For isohydric changes in PCO2, the last criterion was modified to be a 20 % change in firing rate in response to either 3 or 9 % PCO2 (not to a pH change).
From the set of neurones that were defined as chemosensitive, a subset of neurones was selected for more detailed quantitative analysis to compare the magnitude of their response to different types of acid/base disturbance. These neurones were selected if the recording was stable for a suffucient length of time to permit exposure to multiple types of acid/base disturbance, and if the response to hypercapnic acidosis was stable until the end of the recording. One neurone was eliminated from the analysis because the response to hypercapnic acidosis was slow and there was a large amount of variability of the baseline firing rate. For these recordings, data were quantified using three different methods. For all three methods, the mean firing rate and pH were calculated from the last 60 s of each epoch at each pH or CO2 level, as described previously (Wang et al. 2001). For all epochs under a given test condition (e.g. isocapnic acidosis), the mean values for firing rate and pH were determined for each neurone under that test condition. The control epochs immediately preceding and following that test condition were averaged to reduce the effect of intrinsic variability of firing rate. As an example of the analysis, the mean absolute firing rate for the epoch shown during hypercapnic acidosis for the stimulated neurone in Fig. 1 was 2.50 Hz. The mean firing rate for the two adjacent epochs under control conditions was (1.36 + 2.00)/2 = 1.68 Hz. The absolute values of firing rate were calculated in this way for all neurones for each test condition, and these values were then further utilized to calculate: (1) the change in firing rate; and (2) the firing rate during the test condition as a percentage of control. The change in firing rate was determined by calculating the difference in mean firing rate under the test condition and the corresponding control epochs for each neurone. For example, the change in firing rate for the above neurone during the epoch in hypercapnic acidosis was 0.82 Hz. The firing rate during each of the test conditions was then calculated as a percentage of the firing rate during control conditions. For example, during the above epoch the firing rate increased to 149 % of the control firing rate (2.50/1.68 × 100). In most neurones, the firing rate under control conditions was 0.5–2 Hz. In those cases that the firing rate was < 0.2 Hz under control conditions, the percentage increase in firing rate would be artificially large because of the small denominator. For that reason, when the firing rate under control conditions was < 0.2 Hz, a value of 0.2 Hz was substituted. This method led to a more conservative estimate of the percentage increase in firing rate. In presenting the results, the ‘mean number of transitions per cell’ is defined as the mean number of times that neurones within a group were exposed to a change from control solution to a given test solution (e.g. isocapnic acidosis), or back to the control solution.
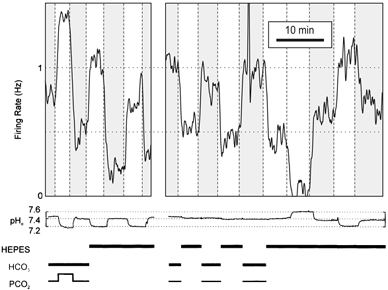
Figure 1. Acidosis-stimulated medullary raphe neurones responded to changes in pHo induced either by changes in PCO2 or in [NaHCO3]o.
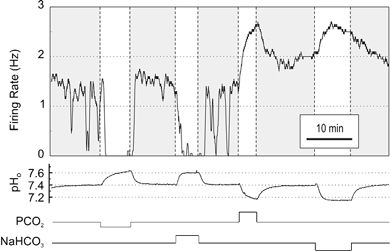
Shown is a neurone that increased its firing rate in response to both hypercapnic acidosis and isocapnic acidosis, and decreased its firing rate in response to both hypocapnic alkalosis and isocapnic alkalosis.
Each of the three methods used for quantification of chemosensitivity conveys different information. In addition, each one is also affected differently by neurones with different baseline firing rates. Therefore, all three were used in order to provide a more comprehensive description of the sensitivity of neurones to different acid/base disturbances.
The effect of acid/base stimuli on membrane potential was determined by measuring the maximum level of afterhyperpolarization and the spike threshold for 10–40 second epochs after a steady-state response had been reached during test conditions and during the control periods. Data presented in the form x ± y are means ± standard deviation (s.d.). Statistical significance was tested using a two-sample t test assuming unequal variance, unless otherwise noted. n.s. indicates the results were not statistically significant.
Immunohistochemistry
Adult rats were anaesthetized with pentobarbital (25–50 mg kg−1). A catheter was inserted into the ascending aorta, and animals were perfused with 10 cc saline, followed by 200 cc 4 % formalin in phosphate buffer over 15–30 min. The brain was removed and post-fixed with 4 % formalin for 4 h. Tissue slices (40 μm) were prepared with a vibratome, then incubated for 48–72 h at 4 °C with either: (1) a 1:200 dilution of rabbit antiserum to rat carbonic anhydrase II (CA II); or (2) a 1:500 dilution of rabbit antiserum to rat carbonic anhydrase IV (CA IV). Both antisera have previously been characterized (Ghandour et al. 1992), and were generously supplied by Dr William Sly. Slices were then incubated with a fluorescein tagged donkey anti-rabbit secondary antibody. Serotonergic neurones were stained using a mouse monoclonal antibody to tryptophan hydroxylase (TpOH) (Sigma, 1:2000), followed by a donkey anti-mouse secondary antibody tagged with rhodamine. As controls for each antibody, parallel slices were processed without addition of primary antiserum. These controls uniformly resulted in no staining. In addition, in each slice stained with primary antibodies, staining was only seen in a subset of neurones. The same protocol was used for immunohistochemistry of cultured cells, except that coverslips were fixed with 4 % formalin for 1 h. Fluorescent labelling was visualized on a Zeiss Axioskop FS2 microscope. Photographs were taken with a Kodak DC290 camera.
RESULTS
Effect of isocapnic acid/base changes on neurones stimulated by hypercapnic acidosis
Neurones cultured from the medullary raphe were exposed to both hypercapnic acidosis and isocapnic acidosis. Every neurone tested that was stimulated by hypercapnic acidosis was also stimulated by isocapnic acidosis and/or inhibited by isocapnic alkalosis (n = 21). In contrast, every neurone tested that was unresponsive to hypercapnic acidosis was also unresponsive to isocapnic acidosis, and if tested, was unresponsive to isocapnic alkalosis (n = 21).
Shown in Figure 1 is an example of a neurone that responded with an increase in firing rate to both hypercapnic acidosis and isocapnic acidosis. The firing rate increased when pHo decreased, whether acidosis was induced by an increase in PCO2 from 5 to 9 %, or a decrease in [NaHCO3]o from 26 to 15 mm. It has previously been shown that the relationship between the logarithm of the firing rate and pH is nearly linear in most neurones (Wang et al. 1998). The neurone shown here diverged from this pattern, since the firing rate of this neurone only increased to 149 % of control in response to hypercapnic acidosis, but almost completely stopped firing (to 2 % of control) during hypocapnic alkalosis.
A more detailed analysis was then made of the response of acidosis-stimulated neurones to these two different types of acid/base disturbance. Since acidosis-stimulated neurones are a homogeneous subset of neurones within the raphe (Wang et al. 1998, 2001), they were treated as a group in the subsequent quantitative analysis.
In the subset of stimulated neurones chosen for detailed quantitative analysis, the response to hypercapnic acidosis was compared to the response to isocapnic acidosis. For 11 neurones tested, an increase in PCO2 to 9 % (mean number of transitions per cell = 3.1) led to a decrease in pHo from 7.41 ± 0.02 to 7.17 ± 0.01, and the mean absolute firing rate increased from 1.07 ± 0.61 to 2.45 ± 0.74 Hz (P < 0.0005). The change in firing rate was 1.38 ± 0.19 Hz. When expressed as a percentage of control firing rate, these neurones responded with a mean increase in firing rate to 285 ± 151 % of control (median 247 %). In the same set of neurones during isocapnic acidosis (mean number of transitions per cell = 2.7), pHo dropped from 7.41 ± 0.02 to 7.16 ± 0.03 and firing rate increased from 1.24 ± 0.89 to 2.40 ± 0.86 Hz (P < 0.01). The change in firing rate was 1.15 ± 0.13 Hz. When expressed as percentage of control firing rate, these neurones responded with a mean increase in firing rate to 309 ± 231 % of control (median 194 %). The responses to isocapnic acidosis were not significantly different from those to hypercapnic acidosis.
A subset of acidosis-stimulated neurones was also exposed to both hypocapnic alkalosis and isocapnic alkalosis (n = 7). During hypocapnic alkalosis (mean number of transitions per cell = 3.4), pHo increased from 7.42 ± 0.02 to 7.63 ± 0.05, and the firing rate of these neurones decreased from 1.04 ± 0.63 to 0.38 ± 0.54 Hz (P < 0.05). The change in firing rate was −0.66 ± 0.09 Hz. When expressed as a percentage of control firing rate, these neurones responded with a mean decrease in firing rate to 25 ± 26 % of control (median 17 %). In response to isocapnic alkalosis (mean number of transitions per cell = 3.0), pHo increased from 7.41 ± 0.02 to 7.60 ± 0.03, and firing rate decreased from 0.80 ± 0.52 to 0.39 ± 0.43 Hz (n.s.). The change in firing rate was −0.41 ± 0.17 Hz. When expressed as a percentage of control firing rate, these neurones responded with a mean decrease in firing rate to 52 ± 30 % of control (median 51 %). The responses to isocapnic alkalosis were not statistically different from the responses to hypocapnic alkalosis.
Response of stimulated neurones to changes in PCO2 at constant pHo
To determine whether a change in pHo is required for a chemosensitive response, neurones were exposed to changes in PCO2 at constant pHo. Every neurone tested that was stimulated by hypercapnic acidosis was also stimulated by isohydric hypercapnia and/or inhibited by isohydric hypocapnia (n = 26). In contrast, neurones that were unresponsive to hypercapnic acidosis were also unresponsive to isohydric hypercapnia (n = 7).
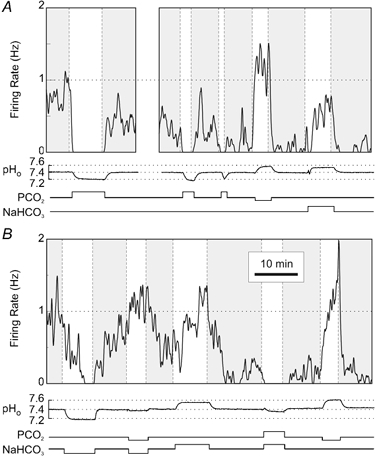
Three examples are shown of stimulated neurones exposed to changes of PCO2 at constant pHo (Fig. 2). Two of the neurones (Fig. 2A and B) were exposed to hypercapnic acidosis, isocapnic acidosis, and isohydric hypercapnia, and responded in each case with an increase in firing rate. These two neurones were also exposed to hypocapnic alkalosis, isocapnic alkalosis and isohydric hypocapnia, and responded in each case with a decrease in firing rate. A third neurone (Fig. 2C) was exposed repeatedly to both hypercapnic acidosis and isohydric hypercapnia, and responded each time with an increase in firing rate (note that the firing rate tended to rise rapidly, and then fall off in response to isohydric hypercapnia). Thus, chemosensitivity of acidosis-stimulated neurones could occur independently of either changes in PCO2 or pHo.
Figure 2. Acidosis-stimulated raphe neurones also responded to changes in PCO2 at constant pHo.
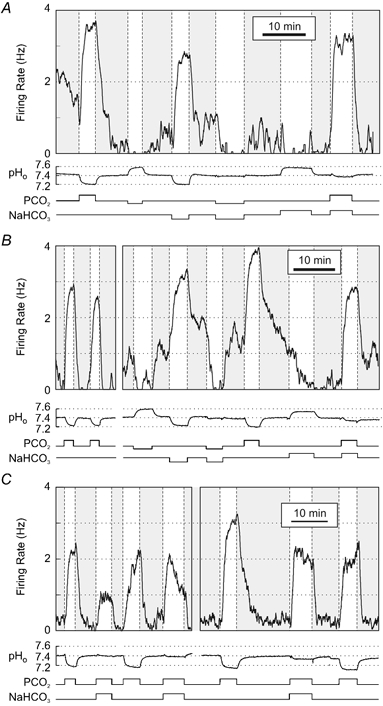
Three neurones are shown that responded to various combinations of hypercapnic acidosis, isocapnic acidosis, isohydric hypercapnia, hypocapnic alkalosis, isocapnic alkalosis and/or isohydric hypocapnia.
A subset of stimulated neurones (n = 12) was analysed in more detail, to quantify and compare their response to isohydric hypercapnia with their response to hypercapnic acidosis. For these neurones, hypercapnic acidosis induced by an increase in PCO2 to 9 % (mean number of transitions per cell = 4.0) led to a decrease in pHo from 7.39 ± 0.03 to 7.17 ± 0.03. The mean absolute firing rate increased from 0.96 ± 0.53 to 2.26 ± 0.67 Hz (P < 0.00005). The change in firing rate was 1.30 ± 0.21 Hz. When expressed as a percentage of control firing rate, these neurones responded with a mean increase in firing rate to 327 ± 251 % of control (median 221 %). In the same set of neurones during isohydric hypercapnia (mean number of transitions per cell = 3.3), despite a much smaller change in pHo from 7.39 ± 0.03 to 7.36 ± 0.04, the firing rate still increased significantly from 0.73 ± 0.62 to 1.74 ± 0.81 Hz (P < 0.005). The change in firing rate was 1.01 ± 0.21 Hz. When expressed as a percentage of control firing rate, these neurones responded with a mean increase in firing rate to 384 ± 415 % of control (median 247 %). The responses to isohydric hypercapnia were not statistically different from those to hypercapnic acidosis.
A subset of acidosis-stimulated neurones was also exposed to both hypocapnic alkalosis and isohydric hypocapnia (n = 13). During hypocapnic alkalosis (mean number of transitions per cell = 3.5), pHo increased from 7.41 ± 0.04 to 7.62 ± 0.06, and the firing rate of these neurones decreased from 1.08 ± 0.72 to 0.51 ± 0.55 Hz (P < 0.05). The change in firing rate was −0.57 ± 0.07 Hz. When expressed as a percentage of control firing rate, these neurones responded with a mean decrease in firing rate to 36 ± 26 % of control (median 33 %). For the same set of neurones in response to isohydric hypocapnia (mean number of transitions per cell = 4.1), pHo changed from 7.40 ± 0.04 to 7.40 ± 0.06, and firing rate decreased from 1.06 ± 0.63 to 0.47 ± 0.60 Hz (P < 0.05). The change in firing rate was −0.59 ± 0.11 Hz. When expressed as a percentage of control firing rate, these neurones responded with a mean decrease in firing rate to 35 ± 34 % of control (median 24 %). The responses to isohydric hypocapnia were not statistically different from those to hypocapnic alkalosis.
Rate of response of stimulated neurones to acid/base changes
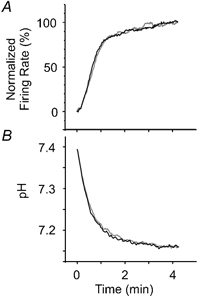
In those neurones exposed to both hypercapnic acidosis and isocapnic acidosis (n = 11), the response to the two stimuli were quantified and compared to determine whether there were differences in their time courses. For each neurone, the firing rate responses were first analysed for every transition from control bath solution to hypercapnic acidosis solution. For each of these transitions, the firing rate during 30 s prior to the change in solution was normalized to 0 %, while the firing rate during the period between 2.5 and 3 min after the change in solution was normalized to 100 %. The normalized response curve was calculated for each neurone, and these curves were then used to calculate the mean (±s.e.m.) normalized firing rate at each time point for all 11 neurones. The same methods were then used to analyse the firing rate responses for every transition from control bath solution to isocapnic acidosis solution, as well as the mean values of pHo. The results of this analysis are shown graphically in Figure 3A. Despite a close correlation in the time course of the change in pHo for the two stimuli, the firing rate response of neurones to isocapnic acidosis was significantly slower than the response to hypercapnic acidosis (P < 0.05).
Figure 3. Comparison of the time course of the responses to hypercapnic acidosis, isocapnic acidosis and isohydric hypercapnia.
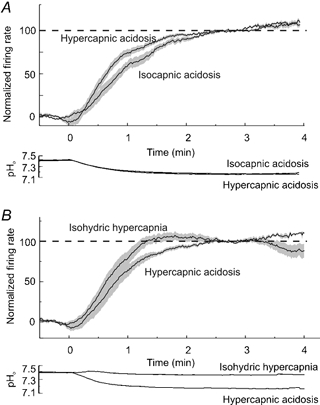
A, comparison of the time course of the firing-rate response to hypercapnic acidosis and isocapnic acidosis from 11 stimulated neurones. B, comparison of the time course of the firing rate response to hypercapnic acidosis and isohydric hypercapnia from 9 stimulated neurones. Top panels, continuous lines, mean firing rate for all neurones calculated at each time point and normalized to the baseline firing rate and to the firing rate between 2.5 to 3.0 s after the change in acid/base status. Grey area, s.e.m. for all neurones calculated at each time point. Bottom panels, mean pH values.
The same methods were used to analyse the time course of the response for nine neurones exposed to both hypercapnic acidosis and isohydric hypercapnia (Fig. 3B). For these neurones, the firing rate increased more rapidly in response to isohydric hypercapnia than for hypercapnic acidosis (P < 0.05). The response to isohydric hypercapnia also peaked within the first two min of exposure, and this was followed by recovery. The firing rate at the end of the period of exposure was significantly less than the peak response (P < 0.05). In contrast, the response to hypercapnic acidosis continued to increase until the end of the 4 min of exposure.
Effect of acid/base changes on membrane potential
The effect of hypercapnic acidosis and hypocapnic alkalosis on membrane potential of raphe neurones has previously been studied in brain slices (Richerson, 1995) and in culture (Wang et al. 1998). Those findings were extended here to include the effects of isocapnic acidosis/ alkalosis and isohydric hypercapnia/hypocapnia. All three stimuli resulted in changes in firing rate without a change in the highly regular pattern of firing characteristic of serotonergic neurones. Shown in Figure 4A–D is the membrane potential of a single neurone under control conditions, and during hypercapnic acidosis, isocapnic acidosis and isohydric hypercapnia. A similar response was seen in all acidosis-stimulated neurones tested.
Figure 4. The different acid/base stimuli had only small effects on mean membrane potential of acidosis-stimulated raphe neurones.
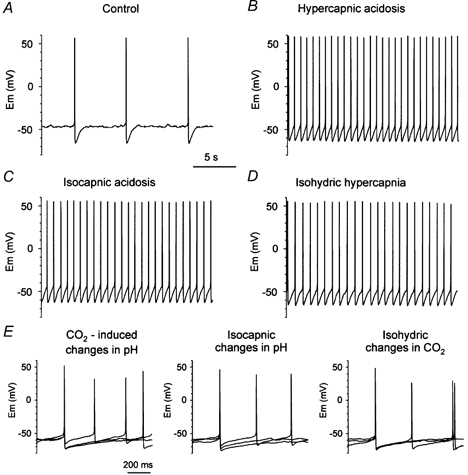
Traces in parts A–D are all from the same neuron. A, membrane potential under control conditions (5 % CO2, pH 7.4). B, membrane potential during hypercapnic acidosis. C, membrane potential during isocapnic acidosis. D, membrane potential during isohydric hypercapnia. E, expanded trace of the membrane potential of a second neurone during different acid/base stimuli. In each case, action potentials during three different acid/base conditions are superimposed. Left, control, hypercapnic acidosis and hypocapnic alkalosis. Middle, control, isocapnic acidosis and isocapnic alkalosis. Right, control, isohydric hypercapnia and isohydric hypocapnia.
The mean after-hyperpolarization (AHP) level and spike threshold were measured in nine neurones during different acid/base conditions. The mean AHP level was −59.1 ± 7.4 mV under control conditions (PCO2 5 %, pH 7.4), similar to that reported previously (−56.3 ± 8.7 mV; (Wang et al. 1998)). In response to hypercapnic acidosis and/or hypocapnic alkalosis there was a small change in the AHP level that averaged 2.13 ± 1.08 mV per −0.2 pH units (P < 0.05), and no change in the spike threshold (0.43 ± 1.78 per −0.2 pH units; n.s.). As described previously (Wang et al. 1998), the level of depolarization was dependent on the amount of tonic current injection. Thus, there was a depolarization of the AHP level by 1.50 ± 0.45 mV per −0.2 pH units for those neurones with current injection ≤ 100 pA (n = 6), and 3.38 ± 0.77 mV per −0.2 pH units for those neurones with current injection > 100 pA (n = 3), which was significantly different (P < 0.005; Student' s two tail t test).
Similar results were obtained in response to isocapnic acidosis and/or alkalosis. There was a small depolarization of the AHP level that averaged 3.54 ± 1.49 mV per −0.2 pH units (P < 0.05), and a small depolarization of the spike threshold that averaged 1.60 ± 1.22 mV per −0.2 pH units (P < 0.05). There was no change in the AHP level in response to an isohydric increase in CO2 from either 3 to 5 % or 5 to 9 % (0.48 ± 1.85 mV; n.s.), and a small hyperpolarization of the spike threshold that averaged 1.56 ± 1.35 in response to the same stimulus (P < 0.05). Examples of the effect of the three different types of acid/base disturbance on membrane potential are shown in Figure 4E, for a different neurone than that in Figure 4A–D. As reported previously for hypercapnic acidosis (Richerson, 1995; Wang et al. 1998), these changes in membrane potential were small compared to the changes in firing rate.
Response of stimulated neurones to pH changes in the absence of CO2 and bicarbonate
To determine whether CO2 and/or [HCO3−] are required for a chemosensitive response, stimulated neurones were exposed to changes in pHo in solutions that contained the non-bicarbonate buffer Hepes, and did not contain CO2 or bicarbonate.
Shown in Figure 5 is an example of an acidosis-stimulated neurone that responded to hypercapnic acidosis with an increase in firing rate. The neurone was then exposed to Hepes-buffered solution at pH 7.2. This resulted in a simultaneous decrease in pHo and a decrease in PCO2 from 5 to 0 %, which caused an increase in firing rate. When the pHo was subsequently changed repeatedly between 7.2 and 7.4 in Hepes-buffered solution, there was a reproducible increase in firing rate each time pHo decreased. The bath solution was then changed from Hepes-buffered solution to CO2/bicarbonate buffered Ringer solution (PCO2 5 %) and back three times, while maintaining pHo constant. This led to a decrease in firing rate each time the neurone was exposed to the Hepes-buffered solution and a decrease in PCO2 from 5 to 0 %. These results would be consistent with those already presented if there was an increase in pHi in response to the decrease in PCO2. Finally, the neurone was exposed to changes in pHo between 7.6 and 7.2 in Hepes-buffered solution, which led to an increase in firing rate in response to a decrease in pHo, and vice versa. The majority of neurones that were stimulated by hypercapnic acidosis in bicarbonate buffered Ringer solution (n = 5/6) were also stimulated by acidosis and/or inhibited by alkalosis in Hepes-buffered solution. All neurones tested that were unresponsive to hypercapnic acidosis in bicarbonate-buffered Ringer solution (n = 5) were also unresponsive to acidosis in Hepes-buffered solution. These results indicate that bicarbonate and CO2 are not required for chemosensitivity, and that changes in pH are sufficient for a response.
Figure 5. Acidosis-stimulated raphe neurones responded to changes in pH in the absence of CO2 and bicarbonate.
This neurone increased its firing rate in response to hypercapnic acidosis, and also responded to changes in pH in Hepes-buffered solution. When switching between normal Ringer solution (pH 7.4, PCO2 5 %) and Hepes-buffered solution (pH 7.4, PCO2 0 %), the neurone responded as other acidosis-stimulated neurones did to isohydric hypocapnia. Bars at bottom depict the presence or absence of Hepes, CO2 and bicarbonate.
Response of inhibited neurones to acid/base changes
Acidosis-stimulated neurones of the medullary raphe are a homogeneous phenotype that all contain serotonin (Wang et al. 1998, 2001). Their characteristic morphology often allows them to be identified in advance of recording (Wang et al. 1998), making it possible to obtain relatively large numbers of recordings from this subset of neurones. In contrast, less is known about the subset of neurones that are inhibited by acidosis, in part because it is more difficult to identify them in advance of recording. However, they may play an equally important role in the response to acidosis in vivo. Thus, it was of interest to define the primary stimulus for chemosensitivity in inhibited neurones.
Acidosis-inhibited neurones were exposed to the same acid/base disturbances as stimulated neurones. An example is shown of a neurone that was inhibited by hypercapnic acidosis, isocapnic acidosis and isohydric hypercapnia (Fig. 6A and B). The same neurone also increased its firing rate in response to hypocapnic alkalosis, isocapnic alkalosis and isohydric hypocapnia. Thus, the changes in firing rate of this neurone were opposite those of stimulated neurones in response to each of the different types of acid/base disturbance. As seen with stimulated neurones, a chemosensitive response could occur independently of changes in PCO2 or pHo.
Figure 6. Acidosis-inhibited raphe neurones also responded to hypercapnic acidosis, hypocapnic alkalosis, isocapnic acidosis/alkalosis and isohydric hypercapnia/hypocapnia.
A and B, continuous recording of a single acidosis-inhibited neurone. This neurone was inhibited by hypercapnic acidosis, isocapnic acidosis and isohydric hypercapnia. It was also stimulated by hypocapnic alkalosis, isocapnic alkalosis and isohydric hypocapnia.
Every neurone tested that was inhibited by hypercapnic acidosis was also inhibited by isocapnic acidosis and/or stimulated by isocapnic alkalosis (n = 20). Every neurone that was inhibited by hypercapnic acidosis was also inhibited by isohydric hypercapnia and/or stimulated by isohydric hypocapnia (n = 8). One neurone that was inhibited by hypercapnic acidosis was also inhibited by acidosis in Hepes-buffered solution.
A subset of inhibited neurones was chosen for detailed quantitative analysis of their response to hypercapnic acidosis and isocapnic acidosis using the same methods as were used for stimulated neurones. For 11 neurones tested, an increase in PCO2 to 9 % (mean number of transitions per cell = 3.9) led to a decrease in pHo from 7.40 ± 0.02 to 7.16 ± 0.02, and the mean absolute firing rate decreased from 0.90 ± 0.80 to 0.17 ± 0.16 Hz (P < 0.05). The change in firing rate was −0.73 ± 0.23 Hz. When expressed as a percentage of control firing rate, these neurones responded with a mean decrease in firing rate to 21 ± 16 % of control (median 15 %). In the same set of neurones during isocapnic acidosis (mean number of transitions per cell = 2.7), pHo dropped from 7.39 ± 0.02 to 7.13 ± 0.04 and firing rate decreased from 0.99 ± 0.82 to 0.46 ± 0.62 Hz. The change in absolute mean firing rates for the population did not reach statistical significance, but all 11 neurones decreased their firing rate in response to isocapnic acidosis. Thus, when expressed as a change in firing rate (mean decrease in firing rate was −0.53 ± 0.42 Hz), the response was statistically significant (P < 0.005). When expressed as a percentage of control firing rate, these neurones responded to isocapnic acidosis with a mean decrease in firing rate to 38 ± 30 % of control (median 36 %). The responses to isocapnic acidosis were not significantly different from those to hypercapnic acidosis.
A different subset of inhibited neurones was chosen for detailed analysis of their response to isohydric hypercapnia compared to hypercapnic acidosis. For these neurones (n = 6), hypercapnic acidosis induced by an increase in PCO2 to 9 % (mean number of transitions per cell = 4.3) led to a decrease in pHo from 7.40 ± 0.02 to 7.16 ± 0.03. The mean absolute firing rate decreased from 0.89 ± 0.64 to 0.22 ± 0.19 Hz (P < 0.05). The change in firing rate was −0.67 ± 0.21 Hz. When expressed as a percentage of control firing rate, these neurones responded with a mean decrease in firing rate to 22 ± 7 % of control (median 21 %). In the same set of neurones during isohydric hypercapnia (mean number of transitions per cell = 2.7), despite a much smaller change in pHo from 7.38 ± 0.02 to 7.32 ± 0.02, the firing rate still decreased from 0.83 ± 0.60 to 0.38 ± 0.60 (n.s.). Every neurone responded with a decrease in firing rate, with a change in mean firing rate of −0.45 ± 0.47 Hz (P < 0.05). When expressed as a percentage of control firing rate, these neurones responded with a mean decrease in firing rate to 35 ± 35 % of control (median 37 %). The responses to isohydric hypercapnia were not statistically different from those to hypercapnic acidosis.
Carbonic anhydrase immunoreactivity in rat CNS neurones
Carbonic anhydrase is present in carotid body glomus cells (Ridderstrale & Hanson, 1985; Nurse, 1990), where it catalyses conversion of the physiological stimulus (a rise in PCO2) to the primary stimulus (a decrease in pHi) (Buckler et al. 1991b). It has not yet been established whether carbonic anhydrase plays a similar role in central chemoreceptors (Neubauer, 1991).
The results presented here suggest that pHi is also the primary stimulus in raphe neurones, and thus carbonic anhydrase could be important for their response. To determine whether carbonic anhydrase is present within the medullary raphe, we performed immunohistochemistry for two isoforms of carbonic anhydrase, CA II and CA IV, in both tissue culture and adult rat brain slices. Since the majority of serotonergic neurones from the medullary raphe are stimulated by acidosis (Wang et al. 2001), we used double labelling for carbonic anhydrase and TpOH to determine whether carbonic anhydrase is associated with acidosis-stimulated neurones.
In cultures from the ventromedial medulla, many glia and a subset of neurones were immunoreactive (IR) for CA II and CA IV. Carbonic anhydrase II and CA IV immunoreactivity were both co-localized with TpOH immunoreactivity in cultured raphe neurones (Fig. 7A–D). However, many neurones that were not TpOH-IR were also CA II-IR or CA IV-IR, indicating that carbonic anhydrase was common in ventromedial medullary neurones in culture.
Figure 7. Immunoreactivity for carbonic anhydrase II and IV was co-localized with immunoreactivity for tryptophan hydroxylase in medullary raphe neurones in tissue culture and in the adult rat brain.

A, TpOH-IR medullary raphe neurone in tissue culture. B, CA II immunoreactivity was present in the same neurone, as well as in glia. C, TpOH-IR medullary raphe neurone in tissue culture. D, CA IV immunoreactivity was present in the same neurone. E, two TpOH-IR neurones in the raphe magnus in tissue slice from adult rat. F, CA II immunoreactivity was present in both neurones. However, the upper neurone was only lightly stained, and some neurones were CA II-IR but not TpOH-IR. G, TpOH-IR neurones in the raphe magnus in tissue slice from adult rat. H, CA IV immunoreactivity was present in all the TpOH-IR neurones, but with different amounts of staining. Many neurones were CA IV-IR but not TpOH-IR. Scale bars all 25 μm.
These results in tissue culture were then confirmed in the medulla of adult rats. Within the medullary raphe, there was diffuse CA II immunoreactivity within glia. Within the medulla relatively few neurones were CA II immunoreactive, and those that were stained, were not strongly stained. Some of the neurones that were lightly to moderately immunostained for CA II were within the medullary raphe, and were also TpOH-IR (Fig. 7E and F). However, many TpOH-IR raphe neurones were not CA II-IR, and there were non-serotonergic neurones in other regions of the medulla that were immunostained more darkly for CA II than many of the TpOH-IR neurones within the medullary raphe.
Immunostaining for CA IV revealed different results. As described previously (Ghandour et al. 1992), the most prominent immunostaining was on blood vessels, and glia were also strongly immunopositive. There were more neurones within the medulla that were CA IV-IR than were CA II-IR, including many TpOH-IR neurones within the medullary raphe that were lightly to moderately CA IV-IR (Fig. 7G and H). However, these TpOH-IR neurones were not the most prominently CA IV-IR neurones in the medulla. For example, neurones that were more prominently immunoreactive for CA IV-IR were present within the hypoglossal motor nucleus (Fig. 8A) and the inferior olive (Fig. 8B), two nuclei whose neurones are non-chemosensitive (Ritucci et al. 1997).
Figure 8. Carbonic anhydrase II and IV immunoreactivity was present in neurones not associated with central respiratory chemoreception.

A, CA IV-IR neurones in the hypoglossal motor nucleus. B, CA IV immunoreactivity in the inferior olive. C, CA II immunoreactivity in the CA 1 pyramidal cell layer of the hippocampus. D, CA II immunoreactivity in the CA 3 pyramidal cell layer of the hippocampus. E, CA IV immunoreactivity in the CA 1 pyramidal cell layer of the hippocampus. F, CA IV immunoreactivity in the CA 3 pyramidal cell layer of the hippocampus. G, CA II immunoreactivity in the cerebellum. H, CA IV immunoreactivity in the cerebellum. A – F, scale bars 50 μm. G and H, scale bars 300 μm.
Carbonic anhydrase immunoreactivity was also present in many other regions of the adult rat brain including the hippocampus and cerebellum, both of which contain only a small percentage of chemosensitive neurones (Wang & Richerson, 2000). Interestingly, there was a differential distribution of immunoreactivity for CA II and CA IV. For example, within the CA1 region there was prominent CA II immunoreactivity within the somata and proximal dendrites of pyramidal neurones, with little staining of glia (Fig. 8C). In contrast, within the CA3 region pyramidal neurones appeared as ghosts, surrounded by halos of CA II immunoreactivity (Fig. 8D). The pattern of CA IV immunoreactivity was different. As in the medulla and the rest of the brain, the most prominent CA IV immunoreactivity in the hippocampus was on blood vessels. There was moderate CA IV immunoreactivity within pyramidal neurones of both the CA1 and CA3 regions (Fig. 8E and F), but this was relatively greater within the CA3 region, the opposite of the pattern seen for CA II. There was also more CA IV immunoreactivity in glia in both regions compared to that seen for CA II.
Within the cerebellum, there was an even greater contrast in the pattern of immunoreactivity for CA II and CA IV (Fig. 8G and H). Purkinje cells were strongly CA II-IR, but were completely immunonegative for CA IV - appearing as dark holes surrounded by immunostained glia. There was prominent CA II immunoreactivity in the granular layer, with little CA II immunoreactivity in the molecular layer. The opposite was true for CA IV immunoreactivity, with strong CA IV immunoreactivity within the molecular layer, but less CA IV immunoreactivity in the granular layer. The white matter stained well for CA II, but not for CA IV.
Effect of acetazolamide on the response of stimulated neurones to hypercapnia
Although carbonic anhydrase is not uniquely localised to chemosensitive neurones, it is still possible that it plays an important role in chemosensitivity of central chemoreceptors. To determine whether carbonic anhydrase is critical for normal chemosensitivity of serotonergic medullary raphe neurones, we examined the effect of acetazolamide on the response to hypercapnic acidosis.
Shown is an example of a neurone whose firing rate increased rapidly and consistently on exposure to hypercapnic acidosis (Fig. 9). In control Ringer solution, changing PCO2 from 5 to 9 % induced an increase in firing rate whose time course closely followed that of the change in pH (including a transient inhibition in response to a small alkalosis at the onset of the first transition). The response was consistent on two subsequent exposures to 9 % PCO2. The bath solution was changed to Ringer solution containing 100 μm acetazolamide, and the neurone was exposed three more times to 9 % PCO2. After blockade of CA, this neurone responded with an increase in firing rate that was similar in time course and steady-state amplitude to the response in control Ringer solution. In this same neurone after washout of acetazolamide, the response to 9 % PCO2 remained unchanged. This remained true during a second exposure to acetazolamide (100 μm), and during a second washout period.
Figure 9. The response to hypercapnic acidosis was not affected by acetazolamide.

This neurone responded consistently to hypercapnic acidosis. Acetazolamide (100 μm) in the bath solution had no effect on the baseline firing rate or the amplitude of the response.
The highly consistent response to repeated exposures to PCO2 of the neurone in Fig. 9 provided an opportunity to compare the rate of change of the response with and without acetazolamide (Fig. 10). For each time this neurone was exposed to 9 % PCO2, the baseline firing rate at 5 % PCO2 was normalized to 0 %, and the steady-steady firing rate at 9 % PCO2 was normalized to 100 %. The normalized firing rate traces were then averaged for all responses to 9 % PCO2 in control solution and averaged separately for all responses to 9 % PCO2 in the presence of acetazolamide (Fig. 10A). The same analysis was also performed on pHo, except that the pHo was not normalized (Fig. 10B). There was not a significant effect of acetazolamide on the change in pHo, or the normalized firing rate at any time point. When the responses on returning to 5 % PCO2 were analysed using the same analysis, there were also no differences in pHo or normalized firing rate.
Figure 10. Effect of acetazolamide on the time course of the response to hypercapnic acidosis.
A, time course of the change in firing rate in response to hypercapnic acidosis for the neurone in Fig. 9. The mean normalized firing rate was calculated for each time point for the transitions from 5 to 9 % PCO2 in control solution (black line) and in acetazolamide (grey line). B, time course of the change in pH for the traces in part A.
To determine whether blockade of carbonic anhydrase blunts the magnitude of the steady-state response to changes in PCO2, the response to an increase in PCO2 was measured for five neurones in control Ringer solution and in Ringer solution containing acetazolamide (100 μm). There was no difference in absolute firing rate at 5 % PCO2 (control: 1.48 ± 1.16 Hz; acetazolamide: 1.53 ± 0.99 Hz; n.s.), in absolute firing rate at 9 % PCO2 (control: 2.83 ± 1.39 Hz; acetazolamide: 3.07 ± 1.24; n.s.), in the change in firing rate in response to an increase in PCO2 from 5 to 9 % (control: 1.35 ± 0.36 Hz; acetazolamide: 1.54 ± 0.39; n.s.), or in the firing rate at 9 % PCO2 expressed as a percentage of control firing rate (control: 238 ± 77 %; acetazolamide: 225 ± 58 %; n.s.). Although the washout periods were too short to permit complete elimination of all acetazolamide, the results were not different when only the initial control period and the first exposure to acetazolamide were included in the analysis. This was also true for analysis of the time course of the response (Fig. 10A) in these five neurones.
DISCUSSION
Here we have quantified changes in firing rate of cultured medullary raphe neurones induced by different types of acid/base stimuli. Chemosensitive raphe neurones responded similarly to hypercapnic acidosis, isocapnic acidosis, isohydric hypercapnia and a decrease in pHo in the absence of CO2 and bicarbonate. These results are most consistent with chemosensitivity being due to changes in pHi. We then examined the role of carbonic anhydrase in the response to hypercapnic acidosis. Carbonic anhydrase immunoreactivity was present in serotonergic medullary raphe neurones, but was also widely distributed in other brain regions. Blockade of carbonic anhydrase with acetazolamide did not have a major effect on the rate or magnitude of the response to hypercapnic acidosis under the current experimental conditions.
Quantification of response to acid/base disturbances
Chemosensitivity was quantified using three complementary methods, see Table 1. This is the most comprehensive description to date of the degree of chemosensitivity of putative central chemoreceptors. The response to hypercapnic acidosis of acidosis-stimulated raphe neurones expressed as a percentage of control firing rate (mean of 285 ± 151 % of the control firing rate) was approximately the same as that reported previously from three different sets of neurones (Wang et al. 1998, 2001; Wang & Richerson, 1999). The current results confirm that serotonergic medullary raphe neurones are highly sensitive to small acid/base changes, and more fully defines their response.
Table 1.
Response of acidosis−stimulated (top) and acidosis-inhibited (bottom) neurones to different types of acid/base stimuli
| pH | Absolute firing rate (Hz) | Change in firing rate (Hz) | Firing rate (% of control) | |
|---|---|---|---|---|
| Stimulated neurones | ||||
| Hypercapnic acidosis | 7.41 ± 0.02 | 1.07 ± 0.61 | ||
| 7.17 ± 0.01 | 2.45 ± 0.74 | 1.38 ± 0.19 | 285 ± 151 | |
| Isocapnic acidosis | 7.41 ± 0.02 | 1.24 ± 0.89 | ||
| 7.16 ± 0.03 | 2.40 ± 0.86 | 1.15 ± 0.13 | 309 ± 231 | |
| Hypocapnic alkalosis | 7.42 ± 0.02 | 1.04 ± 0.63 | ||
| 7.63 ± 0.05 | 0.38 ± 0.54 | −0.66 ± 0.09 | 25 ± 26 | |
| Isocapnic alkalosis | 7.41 ± 0.02 | 0.80 ± 0.52 | ||
| 7.60 ± 0.03 | 0.39 ± 0.43 | −0.41 ± 0.17 | 52 ± 30 | |
| Hypercapnic acidosis | 7.39 ± 0.03 | 0.96 ± 0.53 | ||
| 7.17 ± 0.03 | 2.26 ± 0.67 | 1.30 ± 0.21 | 327 ± 251 | |
| Isohydric hypercapnia | 7.39 ± 0.03 | 0.73 ± 0.62 | ||
| 7.36 ± 0.04 | 1.74 ± 0.81 | 1.01 ± 0.21 | 384 ± 415 | |
| Hypocapnic alkalosis | 7.41 ± 0.04 | 1.08 ± 0.72 | ||
| 7.62 ± 0.06 | 0.51 ± 0.55 | −0.57 ± 0.07 | 36 ± 26 | |
| Isohydric hypocapnia | 7.40 ± 0.04 | 1.06 ± 0.63 | ||
| 7.40 ± 0.06 | 0.47 ± 0.60 | −0.59 ± 0.11 | 35 ± 34 | |
| Inhibited neurones | ||||
| Hypercapnic acidosis | 7.40 ± 0.02 | 0.90 ± 0.80 | ||
| 7.16 ± 0.02 | 0.17 ± 0.16 | −0.73 ± 0.23 | 21 ± 16 | |
| Isocapnic acidosis | 7.39 ± 0.02 | 0.99 ± 0.82 | ||
| 7.13 ± 0.04 | 0.46 ± 0.62 | −0.53 ± 0.42 | 38 ± 30 | |
| Hypercapnic acidosis | 7.40 ± 0.02 | 0.89 ± 0.64 | ||
| 7.16 ± 0.03 | 0.22 ± 0.19 | −0.67 ± 0.21 | 22 ± 7 | |
| Isohydric hypercapnia | 7.38 ± 0.02 | 0.83 ± 0.60 | ||
| 7.32 ± 0.02 | 0.38 ± 0.60 | −0.45 ± 0.47 | 35 ± 35 | |
In some neurones (such as the one in Fig. 2B), the baseline firing rate varied from one control period to the next. In others (such as the one in Fig. 2C), there was variability in the size and shape of the responses to acid/base stimuli. This type of variability commonly occurs in recordings from most types of neurone, and in most preparations, and is one of the reasons why the quantitative approach used here is important. In order to accurately define the response of a group of neurones, it is important to expose each neurone to different solutions multiple times, and record from enough neurones to average out this variability so that an accurate estimate can be made of the mean response of the population.
Chemosensitivity is not an all-or-none property of neurones (Wang & Richerson, 2000). In addition, all chemoreceptors do not necessarily play an equal role in respiratory chemoreception (Nattie, 1999). The high degree of chemosensitivity of raphe neurones suggests that they might play an important role in the response of the respiratory network to small changes in pH within the physiological range. Using experiments in unanaesthetized goats in vivo, Pappenheimer et al. (Pappenheimer et al. 1965) predicted that ventilation would increase by 3- to 4-fold in response to a decrease in pHo of 0.08 units at the central chemoreceptors. The response of acidosis-stimulated neurones (a 3-fold increase in response to a decrease in pHo of 0.2 units) approaches one-half of this predicted whole-animal ventilatory response. Assuming that acidosis-stimulated and acidosis-inhibited raphe neurones are both chemoreceptors (Richerson, 1995, 2001), their combined contribution to the overall response in vivo might be substantial. It has not been determined how many of the other putative chemoreceptors also have such a high degree of chemosensitivity, and thus potentially make an equal contribution to respiratory chemoreception. Therefore, it will be important to quantify the response of neurones from each of the different putative chemoreceptor sites to provide insight into the relative contributions of each one to the overall response of the intact respiratory network.
Primary stimulus for chemosensitivity in raphe neurones
Previous studies have found that isocapnic acidosis induces changes in firing rate in chemosensitive neurones from other brainstem regions (Marino & Lamb, 1975; Miles, 1983; Kogo & Arita, 1990; Neubauer et al. 1991). In the current experiments, the use of a monolayer of cells in culture made it possible to tightly control pHo, and thus to demonstrate that a change in pHo is not necessary for a response. Isocapnic acidosis, isohydric hypercapnia and acidosis in the absence of CO2 and bicarbonate, each induced a qualitatively and quantitatively similar response as that induced by hypercapnic acidosis in both subtypes of chemosensitive neurone from the medullary raphe. Thus, chemosensitivity can occur in the absence of a change in PCO2, in the absence of a change in pHo, and in the complete absence of any CO2 or bicarbonate. The simplest interpretation of these results is that the primary stimulus is a decrease in pHi, because pHi is the only acid/base variable that each of these manipulations would be predicted to affect in common. Each of these stimuli have been found to induce a decrease in pHi in a variety of other cell types (Roos & Boron, 1981; Buckler et al. 1991a). Preliminary results indicate that this is also the case for raphe neurones in culture (Wang et al. 1997).
These results in putative central chemoreceptors are consistent with results obtained from peripheral chemoreceptors. In carotid body glomus cells, pHi is the primary stimulus for chemosensitivity (Peers & Buckler, 1995). In glomus cells and raphe neurones, the response to isocapnic acidosis was slower than the response to hypercapnic acidosis and there was a faster response to isohydric hypercapnia, with recovery (Buckler et al. 1991a). The differences in time course of the responses in raphe neurones were not as large as those seen in carotid body glomus cells, which is probably due to the relatively slow time constant of solution exchange in our recording chamber. However, the differences in time course in both cell types are consistent with pHi as the primary stimulus, since isocapnic acidosis would be predicted to induce a slower decrease in pHi than hypercapnic acidosis, and isohydric hypercapnia would be predicted to induce a rapid decrease in pHi followed by recovery (Buckler et al. 1991a).
The results from acidosis-inhibited neurones suggest that they also respond to pHi. Thus, the results presented here demonstrate that there are similarities in the mechanisms of chemosensitivity between the two subsets of raphe neurones and between chemosensitive raphe neurones and peripheral chemoreceptors.
The design of these experiments does not permit the definite conclusion that pHi alone is the primary stimulus in these neurones. The finding that hypercapnic acidosis, isocapnic acidosis and isohydric hypercapnia were equally potent in inducing a response suggests that changes in pHi could account entirely for the response. However, it remains possible that changes in pHo, PCO2 and/or HCO3− could produce a response when pHi is maintained constant, or that a response to pHi is augmented by a response to one of the other variables. For example, the transmembrane gradient of pH may be important. The differences seen here in the effect of the three different stimuli on AHP level, although very small, could result from an interaction between the different variables. The only way to prove which of these possibilities is true would be to simultaneously measure firing rate and pHi. It should also be noted that conclusions can not be made about the response of pHi to different stimuli on the basis of changes in firing rate, since they may not be directly correlated. For example, the recovery of firing rate during sustained isohydric hypercapnia does not necessarily mean that there is recovery of pHi, or alternatively it may underestimate the degree of recovery of pHi. Finally, these experiments were performed at room temperature, and it is possible that there may be differences at body temperature. However, in spite of these issues, it is still possible to conclude unequivocally that a chemosensitive response can occur in the absence of changes in PCO2, pHo or [HCO3−].
Distribution of carbonic anhydrase immunoreactivity in CNS neurones
Within the nervous system, carbonic anhydrase is most abundant in oligodendrocytes (Ghandour et al. 1992). Detection of carbonic anhydrase in peripheral chemoreceptor neurones of the carotid body (Ridderstrale & Hanson, 1985; Nurse, 1990), led to the suggestion that carbonic anhydrase might be a marker for central chemoreceptor neurones of the medulla (Neubauer, 1991). Although neurones that are not central chemoreceptors also contain carbonic anhydrase, including some in the retina, peripheral sensory ganglia, cerebellar Purkinje cell layer and parietal cortex (Ridderstrale & Hanson, 1985; Neubauer, 1991), it is possible that carbonic anhydrase is more abundant in central chemoreceptor neurones.
The identification of TpOH as a marker for a subset of putative central chemoreceptors (Wang et al. 2001), offers the opportunity to examine whether carbonic anhydrase is present in these neurones. We found that CA immunoreactivity was common in TpOH-IR neurones in cell culture and in brain slices from adult rats. However, CA immunoreactivity was also common in other neurones, so it cannot be considered a useful marker for chemoreceptors. As described previously (Ghandour et al. 1992), we confirmed that there was strong immunoreactivity for CA II and CA IV in oligodendrocytes, and intense CA IV immunoreactivity in blood vessels. However, CA-IR neurones were also present in many regions of the CNS, including the inferior olive, hypoglossal motor nucleus, cerebellum and hippocampus. Interestingly, there was a differential distribution of the two isozymes studied. Relatively few medullary neurones were CA II-IR, whereas medullary neurones in many different nuclei were CA IV-IR. Within the cerebellum, the contrast between the two isozymes was particularly striking, with a nearly opposite staining pattern for CA II and CA IV. The significance of the differences in distribution of these two isozymes is unclear. It will be interesting to examine the distribution of other isozymes of carbonic anhydrase, one of which might be more specific for central chemoreceptor neurones.
Role of carbonic anhydrase in the response to hypercapnic acidosis
The precise role of carbonic anhydrase in chemoreceptors remains unclear. In peripheral chemoreceptors, the existing data clearly indicate that carbonic anhydrase increases the rate of change of firing rate in response to a sudden increase in PCO2 and increases the response to transient changes in PCO2. However, there is conflicting evidence regarding whether carbonic anhydrase affects the steady-state response to a sustained increase in PCO2. For example, acetazolamide eliminates the rapid transient increase in firing rate of cat carotid sinus nerve afferents in response to a step increase in CO2, but does not reduce the steady-state response (Black et al. 1971). In contrast, cat laryngeal chemoreceptors respond to acetazolamide with a decrease in both the rate of change and the steady-state response to CO2 (Coates et al. 1996), and avian intrapulmonary chemoreceptors respond to acetazolamide with a decrease in both the phasic and steady-state response to an increase in CO2 (Hempleman et al. 2000). Other experiments have also found a consistent attenuation of phasic responses to hypercapnia, but were not designed to examine the steady-state response to a sustained increase in CO2 (Travis, 1971; Hanson et al. 1981). In response to a different stimulus, isohydric hypercapnia, acetazolamide blunts both the transient and the sustained increase in firing rate of carotid sinus nerve afferents in isolated superfused carotid bodies (Rigual et al. 1991).
In those cases in which acetazolamide induces a reduction in the steady-state response to sustained hypercapnic acidosis, the mechanism has not been defined. In avian intrapulmonary chemoreceptors, it has been proposed that the uncatalyzed hydration of CO2 cannot generate protons fast enough to counteract rapid H+ transport out of the cell (Hempleman et al. 2000). However, this does not seem to be the case in isolated carotid body glomus cells, because acetazolamide decreases the rate of change of pHi, but does not affect the steady-state pHi in response to a change from Hepes-buffered solution to 5 % CO2/HCO3− solution (Buckler et al. 1991b). Carotid body glomus cells also do not appear to have highly active pH regulating transporters (Buckler et al. 1991a), the lack of which has been proposed to facilitate their chemoreceptor function. Frog oocytes also do not have highly active H+ transporters, and blocking carbonic anhydrase in these cells decreases the rate of change of pHi in response to hypercapnic acidosis, but does not have a significant effect on the steady-state change in pHi (Nakhoul et al. 1998).
Less is known about the functional role of carbonic anhydrase in central chemoreceptors. Application of acetazolamide to the cat ventral medulla does not affect the steady-state response of the phrenic nerve to a step increase in inhaled CO2, although it does reduce the rate of change of phrenic nerve activity (Coates et al. 1991). Consistent with these findings, we found no effect of acetazolamide on the steady-state change in firing rate of isolated raphe neurones in response to hypercapnic acidosis. If the primary stimulus for raphe neurones is a decrease in pHi, then this would suggest that raphe neurones also do not have highly active pH regulatory mechanisms, as is true in carotid body glomus cells (Buckler et al. 1991a), as well as chemosensitive neurones in the NTS (Ritucci et al. 1997).
Acetazolamide reduces the transient ventilatory response of cats to bolus injections of 100 % CO2 into the vertebral artery (Hanson et al. 1981; Arita et al. 1988), and, as described above when applied to the ventral medulla, it reduces the rate of change of phrenic nerve activity in response to a step increase in CO2 (Coates et al. 1991). In contrast, we saw no effect of acetazolamide on the rate of change of firing rate in raphe neurones. The most likely explanation for this is simply that the exchange rate of the bath solution in our experiments was relatively slow. To clarify this point, and to further define the mechanisms of the effect of carbonic anhydrase in central chemoreception, it will be important to extend the results obtained here by directly measuring pHi while exposing neurones to more rapid changes in PCO2, and by using other inhibitors of carbonic anhydrase. It will also be important to examine the effect of changes in temperature on the activity of membrane transporters, which may influence the role of carbonic anhydrase.
Comparison to whole animal ventilatory response
The results presented here from putative central chemoreceptors in isolation have similarities to results obtained in vivo. Early results in unanaesthetized goats, indicated that acidosis can induce a ventilatory response in the absence of a change in PCO2, and that ventilation appeared to be uniquely dependent on pH of the extracellular fluid (Pappenheimer et al. 1965; Fencl et al. 1966). More recent experiments in anaesthetized cats have suggested that brain tissue acidosis induced by an increase in PCO2 may be a more effective stimulus for breathing than that induced by isocapnic acidosis (Teppema et al. 1983). In the same preparation, a large ventilatory response could be induced by changes in PCO2 while extracellular pH was held constant (Shams, 1985). These results indicate that ventilation can be stimulated in vivo by hypercapnic acidosis, isocapnic acidosis or isohydric hypercapnia. They are similar to the results we have obtained here from isolated raphe neurones, as well as results obtained from isolated carotid body glomus cells and are also consistent with the conclusion that the primary stimulus for the central chemoreceptors is a decrease in pHi.
The studies presented here on raphe neurones in vitro provide the first detailed quantitative analysis of the response of chemosensitive CNS neurones to different acid/base stimuli. Since serotonergic medullary raphe neurones are strong candidates for central respiratory chemoreceptors, it is probable that the mechanisms of chemosensitivity of these neurones in vitro are relevant to the mechanisms of central respiratory chemoreception in vivo.
Acknowledgments
Special thanks are given to Dr William Sly for generously providing antiserum for CA II and CA IV, and to Dr Walter Boron for his advice. This work was supported by NIH R01 HL 52539, and the Veterans Affairs Medical Center.
REFERENCES
- Arita H, Kogo N, Ichikawa K. Effect of cisternal administration of acetazolamide on rapid excitation of central chemoreceptors. Tohoku Journal of Experimental Medicine. 1988;156(suppl.):75–81. doi: 10.1620/tjem.156.suppl_75. [DOI] [PubMed] [Google Scholar]
- Bernard DG, Li A, Nattie EE. Evidence for central chemoreception in the midline raphe. Journal of Applied Physiology. 1996;80:108–115. doi: 10.1152/jappl.1996.80.1.108. [DOI] [PubMed] [Google Scholar]
- Black AM, McCloskey DI, Torrance RW. The responses of carotid body chemoreceptors in the cat to sudden changes of hypercapnic and hypoxic stimuli. Respiration Physiology. 1971;13:36–49. doi: 10.1016/0034-5687(71)90063-6. [DOI] [PubMed] [Google Scholar]
- Buckler KJ, Vaughan-jones RD, Peers C, Lagadic-gossmann D, Nye PC. Effects of extracellular pH, PCO2 and HCO3− on intracellular pH in isolated type-I cells of the neonatal rat carotid body. Journal of Physiology. 1991a;444:703–721. doi: 10.1113/jphysiol.1991.sp018902. [DOI] [PMC free article] [PubMed] [Google Scholar]
- Buckler KJ, Vaughan-jones RD, Peers C, Nye PC. Intracellular pH and its regulation in isolated type I carotid body cells of the neonatal rat. Journal of Physiology. 1991b;436:107–129. doi: 10.1113/jphysiol.1991.sp018542. [DOI] [PMC free article] [PubMed] [Google Scholar]
- Coates EL, Knuth SL, Bartlett D. Laryngeal CO2 receptors: influence of systemic PCO2 and carbonic anhydrase inhibition. Respiration Physiology. 1996;104:53–61. doi: 10.1016/0034-5687(96)00009-6. [DOI] [PubMed] [Google Scholar]
- Coates EL, Li AH, Nattie EE. Acetazolamide on the ventral medulla of the cat increases phrenic output and delays the ventilatory response to CO2. Journal of Physiology. 1991;441:433–451. doi: 10.1113/jphysiol.1991.sp018760. [DOI] [PMC free article] [PubMed] [Google Scholar]
- Coates EL, Li A, Nattie EE. Widespread sites of brain stem ventilatory chemoreceptors. Journal of Applied Physiology. 1993;75:5–14. doi: 10.1152/jappl.1993.75.1.5. [DOI] [PubMed] [Google Scholar]
- Dean C, Marson L, Kampine JP. Distribution and co-localization of 5-hydroxytryptamine, thyrotropin-releasing hormone and substance-P in the cat medulla. Neuroscience. 1993;57:811–822. doi: 10.1016/0306-4522(93)90026-c. [DOI] [PubMed] [Google Scholar]
- Dean JB, Bayliss DA, Erickson JT, Lawing WL, Millhorn DE. Depolarization and stimulation of neurons in nucleus tractus solitarii by carbon dioxide does not require chemical synaptic input. Neuroscience. 1990;36:207–216. doi: 10.1016/0306-4522(90)90363-9. [DOI] [PubMed] [Google Scholar]
- Dillon GH, Waldrop TG. In vitro responses of caudal hypothalamic neurons to hypoxia and hypercapnia. Neuroscience. 1992;51:941–950. doi: 10.1016/0306-4522(92)90531-6. [DOI] [PubMed] [Google Scholar]
- Fencl V, Miller TB, Pappenheimer JR. Studies on the respiratory response to disturbances of acid-base balance, with deductions concerning the ionic composition of cerebral interstitial fluid. American Journal of Physiology. 1966;210:459–472. doi: 10.1152/ajplegacy.1966.210.3.459. [DOI] [PubMed] [Google Scholar]
- Fukuda Y, See WR, Honda Y. H+-sensitivity and pattern of discharge of neurons in the chemosensitive areas of the ventral medulla oblongata of rats in vitro. Pflügers Archiv. 1980;388:53–61. doi: 10.1007/BF00582628. [DOI] [PubMed] [Google Scholar]
- Ghandour MS, Langley OK, Zhu XL, Waheed A, Sly WS. Carbonic anhydrase IV on brain capillary endothelial cells: a marker associated with the blood-brain barrier. Proceedings of the National Academy of Sciences of the USA. 1992;89:6823–6827. doi: 10.1073/pnas.89.15.6823. [DOI] [PMC free article] [PubMed] [Google Scholar]
- Hanson MA, Nye PC, Torrance RW. The location of carbonic anhydrase in relation to the blood-brain barrier at the medullary chemoreceptors of the cat. Journal of Physiology. 1981;320:113–125. doi: 10.1113/jphysiol.1981.sp013938. [DOI] [PMC free article] [PubMed] [Google Scholar]
- Hempleman SC, Rodriguez TA, Bhagat YA, Begay RS. Benzolamide, acetazolamide, and signal transduction in avian intrapulmonary chemoreceptors. American Journal of Physiology - Regulatory Integrative and Comparative Physiology. 2000;279:R1988–1995. doi: 10.1152/ajpregu.2000.279.6.R1988. [DOI] [PubMed] [Google Scholar]
- Jacobs BL, Fornal CA. Activity of serotonergic neurons in behaving animals. Neuropsychopharmacology. 1999;21:9S–15S. doi: 10.1016/S0893-133X(99)00012-3. [DOI] [PubMed] [Google Scholar]
- Kawai A, Ballantyne D, Muckenhoff K, Scheid P. Chemosensitive medullary neurones in the brainstem-spinal cord preparation of the neonatal rat. Journal of Physiology. 1996;492:277–292. doi: 10.1113/jphysiol.1996.sp021308. [DOI] [PMC free article] [PubMed] [Google Scholar]
- Kogo N, Arita H. In vivo study on medullary H+ sensitive neurons. Journal of Applied Physiology. 1990;69:1408–1412. doi: 10.1152/jappl.1990.69.4.1408. [DOI] [PubMed] [Google Scholar]
- Lalley PM. Serotoninergic and non-serotoninergic responses of phrenic motoneurones to raphe stimulation in the cat. Journal of Physiology. 1986;380:373–385. doi: 10.1113/jphysiol.1986.sp016291. [DOI] [PMC free article] [PubMed] [Google Scholar]
- Marino PL, Lamb TW. Effects of CO2 and extracellular H+ iontophoresis on single cell activity in the cat brainstem. Journal of Applied Physiology. 1975;38:688–695. doi: 10.1152/jappl.1975.38.4.688. [DOI] [PubMed] [Google Scholar]
- Mason P. Physiological identification of pontomedullary serotonergic neurons in the rat. Journal of Neurophysiology. 1997;77:1087–1098. doi: 10.1152/jn.1997.77.3.1087. [DOI] [PubMed] [Google Scholar]
- Miles R. Does low pH stimulate central chemoreceptors located near the ventral medullary surface? Brain Research. 1983;271:349–353. doi: 10.1016/0006-8993(83)90300-1. [DOI] [PubMed] [Google Scholar]
- Millhorn DE, Eldridge FL, Waldrop TG. Prolonged stimulation of respiration by endogenous central serotonin. Respiration Physiology. 1980;42:171–188. doi: 10.1016/0034-5687(80)90113-9. [DOI] [PubMed] [Google Scholar]
- Mitchell RA, Loeschcke HH, Massion WH, Severinghaus JW. Respiratory responses mediated through superficial chemosensitive areas on the medulla. Journal of Applied Physiology. 1963;18:523–533. doi: 10.1152/jappl.1963.18.3.523. [DOI] [PubMed] [Google Scholar]
- Mueller RA, Towle AC, Breese GR. Supersensitivity to the respiratory stimulatory effect of TRH in 5, 7-dihydroxytryptamine-treated rats. Brain Research. 1984;298:370–373. doi: 10.1016/0006-8993(84)91440-9. [DOI] [PubMed] [Google Scholar]
- Murakoshi T, Suzue T, Tamai S. A pharmacological study on respiratory rhythm in the isolated brainstem-spinal cord preparation of the newborn rat. British Journal of Pharmacology. 1985;86:95–104. doi: 10.1111/j.1476-5381.1985.tb09439.x. [DOI] [PMC free article] [PubMed] [Google Scholar]
- Nakhoul NL, Davis BA, Romero MF, Boron WF. Effect of expressing the water channel aquaporin-1 on the CO2 permeability of Xenopus oocytes. American Journal of Physiology. 1998;274:C543–548. doi: 10.1152/ajpcell.1998.274.2.C543. [DOI] [PubMed] [Google Scholar]
- Nattie EE. CO2, brainstem chemoreceptors and breathing. Progress in Neurobiology. 1999;59:299–331. doi: 10.1016/s0301-0082(99)00008-8. [DOI] [PubMed] [Google Scholar]
- Neubauer JA. Carbonic anhydrase and sensory function in the central nervous system. In: Dodgson S, editor. The Carbonic Anhydrases. New York: Plenum; 1991. pp. 319–323. [Google Scholar]
- Neubauer JA, Gonsalves SF, Chou W, Geller HM, Edelman NH. Chemosensitivity of medullary neurons in explant tissue cultures. Neuroscience. 1991;45:701–708. doi: 10.1016/0306-4522(91)90282-s. [DOI] [PubMed] [Google Scholar]
- Nurse CA. Carbonic anhydrase and neuronal enzymes in cultured glomus cells of the carotid body of the rat. Cell and Tissue Research. 1990;261:65–71. doi: 10.1007/BF00329439. [DOI] [PubMed] [Google Scholar]
- Pappenheimer JR, Fencl V, Heisey SR, Held D. Role of cerebral fluids in control of respiration as studied in unanesthetized goats. American Journal of Physiology. 1965;208:436–450. doi: 10.1152/ajplegacy.1965.208.3.436. [DOI] [PubMed] [Google Scholar]
- Peers C, Buckler KJ. Transduction of chemostimuli by the type I carotid body cell. Journal Of Membrane Biology. 1995;144:1–9. doi: 10.1007/BF00238411. [DOI] [PubMed] [Google Scholar]
- Pineda J, Aghajanian GK. Carbon dioxide regulates the tonic activity of locus coeruleus neurons by modulating a proton- and polyamine-sensitive inward rectifier potassium current. Neuroscience. 1997;77:723–743. doi: 10.1016/s0306-4522(96)00485-x. [DOI] [PubMed] [Google Scholar]
- Richerson GB. Response to CO2 of neurons in the rostral ventral medulla in vitro. Journal of Neurophysiology. 1995;73:933–944. doi: 10.1152/jn.1995.73.3.933. [DOI] [PubMed] [Google Scholar]
- Richerson GB, Wang W, Tiwari JK, Bradley SR. Chemosensitivity of serotonergic neurons in the rostral ventral medulla. Respiration Physiology. 2001;129:175–189. doi: 10.1016/s0034-5687(01)00289-4. [DOI] [PubMed] [Google Scholar]
- Ridderstrale Y, Hanson M. Histochemical study of the distribution of carbonic anhydrase in the cat brain. Acta Physiologica Scandinavica. 1985;124:557–564. doi: 10.1111/j.1748-1716.1985.tb00048.x. [DOI] [PubMed] [Google Scholar]
- Rigual R, Lopez-lopez JR, Gonzalez C. Release of dopamine and chemoreceptor discharge induced by low pH and high PCO2 stimulation of the cat carotid body. Journal of Physiology. 1991;433:519–531. doi: 10.1113/jphysiol.1991.sp018441. [DOI] [PMC free article] [PubMed] [Google Scholar]
- Ritucci NA, Dean JB, Putnam RW. Intracellular pH response to hypercapnia in neurons from chemosensitive areas of the medulla. American Journal of Physiology. 1997;273:R433–441. doi: 10.1152/ajpregu.1997.273.1.R433. [DOI] [PubMed] [Google Scholar]
- Roos A, Boron WF. Intracellular pH. Physiological Reviews. 1981;61:296–434. doi: 10.1152/physrev.1981.61.2.296. [DOI] [PubMed] [Google Scholar]
- Schlaefke ME, See WR, Loeschcke HH. Ventilatory response to alterations of H+ ion concentration in small areas of the ventral medullary surface. Respiration Physiology. 1970;10:198–212. doi: 10.1016/0034-5687(70)90083-6. [DOI] [PubMed] [Google Scholar]
- Shams H. Differential effects of CO2 and H+ as central stimuli of respiration in the cat. Journal of Applied Physiology. 1985;58:357–364. doi: 10.1152/jappl.1985.58.2.357. [DOI] [PubMed] [Google Scholar]
- Steinbusch HWM. Distribution of serotonin-immunoreactivity in the central nervous system of the rat-cell bodies and terminals. Neuroscience. 1981;6:557–618. doi: 10.1016/0306-4522(81)90146-9. [DOI] [PubMed] [Google Scholar]
- Teppema LJ, Barts PW, Folgering HT, Evers JA. Effects of respiratory and (isocapnic) metabolic arterial acid-base disturbances on medullary extracellular fluid pH and ventilation in cats. Respiration Physiology. 1983;53:379–395. doi: 10.1016/0034-5687(83)90127-5. [DOI] [PubMed] [Google Scholar]
- Tojima H, Kuriyama T, Fukuda Y. Differential respiratory effects of HCO3− and CO2 applied on ventral medullary surface of rats. Journal of Applied Physiology. 1991;70:2217–2225. doi: 10.1152/jappl.1991.70.5.2217. [DOI] [PubMed] [Google Scholar]
- Travis DM. Molecular CO2 is inert on carotid chemoreceptor: demonstration by inhibition of carbonic anhydrase. Journal of Pharmacology and Experimental Therapeutics. 1971;178:529–540. [PubMed] [Google Scholar]
- Vandermaelen CP, Aghajanian GK. Electrophysiological and pharmacological characterization of serotonergic dorsal raphe neurons recorded extracellularly and intracellularly in rat brain slices. Brain Research. 1983;289:109–119. doi: 10.1016/0006-8993(83)90011-2. [DOI] [PubMed] [Google Scholar]
- Veasey SC, Fornal CA, Metzler CW, Jacobs BL. Response of serotonergic caudal raphe neurons in relation to specific motor activities in freely moving cats. Journal of Neuroscience. 1995;15:5346–5359. doi: 10.1523/JNEUROSCI.15-07-05346.1995. [DOI] [PMC free article] [PubMed] [Google Scholar]
- Wang W, Pizzonia JH, Richerson GB. Chemosensitivity of rat medullary raphe neurones in primary tissue culture. Journal of Physiology. 1998;511:433–450. doi: 10.1111/j.1469-7793.1998.433bh.x. [DOI] [PMC free article] [PubMed] [Google Scholar]
- Wang W, Richerson GB. Development of chemosensitivity of rat medullary raphe neurons. Neuroscience. 1999;90:1001–1011. doi: 10.1016/s0306-4522(98)00505-3. [DOI] [PubMed] [Google Scholar]
- Wang W, Richerson GB. Chemosensitivity of non-respiratory rat CNS neurons in tissue culture. Brain Research. 2000;860:119–129. doi: 10.1016/s0006-8993(00)02033-3. [DOI] [PubMed] [Google Scholar]
- Wang W, Zaykin AV, Tiwari JK, Bradley SR, Richerson GB. Acidosis-stimulated neurons of the medullary raphe are serotonergic. Journal of Neurophysiology. 2001;85:2224–2235. doi: 10.1152/jn.2001.85.5.2224. [DOI] [PubMed] [Google Scholar]
- Wang W, Zhao J, Boron WF, Richerson GB. Effect of isocapnic acidosis and isohydric hypercapnea on firing rate and pHi of chemosensitive medullary neurons. Society for Neuroscience Abstracts. 1997;23:171.14. [Google Scholar]