Abstract
Single chemically permeabilized fibres from rabbit psoas muscle were activated maximally at 5–6 °C and then exposed to a rapid temperature increase (‘T-jump’) up to 37 °C by passing a high-voltage pulse (40 kHz AC, 0.15 ms duration) through the fibre length. Fibre cooling after the T-jump was compensated by applying a warming (40 kHz AC, 200 ms) pulse. Tension and changes in sarcomere length induced by the T-jumps and by fast length step perturbations of the fibres were monitored. In some experiments sarcomere length feedback control was used. After T-jumps tension increased from ∼55 kN m−2 at 5–6 °C to ∼270 kN m−2 at 36–37 °C, while stiffness rose by ∼15 %, suggesting that at a higher temperature the myosin head generates more force. The temperature-tension relation became less steep at temperatures above 25°C, but was not saturated even at near-physiological temperature. Comparison of tension transients induced by the T-jump and length steps showed that they are different. The T-jump transients were several times slower than fast partial tension recovery following length steps at low and high temperature (phase 2). The kinetics of the tension rise after the T-jumps was independent of the preceding length changes. When the length steps were applied during the tension rise induced by the T-jump, the observed complex tension transient was simply the sum of two separate responses to the mechanical and temperature perturbations. This demonstrates the absence of interaction between these processes. The data suggest that tension transients induced by the T-jumps and length steps are caused by different processes in myosin cross-bridges.
Force in actively contracting muscle is generated by cross-bridges, globular heads of myosin molecules protruding from the thick filaments and forming transient links with neighbouring actin filaments. It is generally assumed that the cross-bridges act independently and asynchronously (Huxley, 1957). Huxley & Simmons (1971) used sudden perturbation of the length of a single contracting muscle fibre to synchronize mechanical events in a significant fraction of the cross-bridges attached to the thin filaments. Fast partial tension recovery following a step release (Huxley-Simmons phase 2) was considered to result from a force-producing stepwise transition of the cross-bridges. This transition, taking place on a millisecond time scale, was assumed to be the universal mechanism of force generation in muscle. However, other independent evidence for stepwise transition is needed (Huxley, 1981).
A number of approaches were developed to perturb the steady-state equilibrium in contracting muscle fibres with the aim of investigating the mechanism of force generation. In the temperature jump (T-jump) method the temperature of a single muscle fibre is increased within a fraction of a millisecond using either a pulse of powerful IR laser (Davis & Harrington, 1987a, b, 1993; Goldman et al. 1987; Davis & Rodgers, 1995a, b; Ranatunga, 1996) or Joule heat (Bershitsky & Tsaturyan, 1985, 1995). A contracting muscle subjected to a sudden increase in temperature responds by a substantial increase in tension. The amplitude and the time course of the T-jump tension transient depend on the initial and final temperature. The time course of the tension increase above its initial level is usually fitted by the sum of two exponential components. The faster of these components was considered to be associated with phase 2 of the Huxley-Simmons transient (Goldman et al. 1987; Bershitsky & Tsaturyan, 1988, 1992; Davis & Harrington, 1993; Davis & Rodgers, 1995a; Ranatunga, 1996). The kinetics of phase 2 of the length step-induced transient was shown to be dependent on the amplitude of changes in sarcomere length (Ford et al. 1977; Linari et al. 1993), so it is essential to keep sarcomere length constant during the tension transients or at least to monitor changes in the sarcomere length. However, in previous studies exploiting the T-jump in muscle fibres, sarcomere length was not controlled.
Here we report the results of experiments with permeabilized muscle fibres from the rabbit, in which the T-jump-induced tension transients were recorded simultaneously with changes in sarcomere length and we compare these transients with those induced by the length steps. In some experiments, T-jump-induced tension transients were recorded under sarcomere length feedback control.
Our main findings are the difference in the rate constants of the tension transients induced by the length and temperature perturbations and the absence of interaction between these transients when they are applied rapidly one after another. These findings suggest that the molecular mechanisms involved in responses to the length and temperature changes are different. Some results presented here have been published in brief (Bershitsky & Tsaturyan, 1999).
METHODS
Muscle fibres
Dutch grey rabbits (3–3.5 kg) were killed in accordance with Schedule 1 of the Animals (Scientific Procedures) Act (1986) by intravenous injection of 100 mg kg−1 sodium pentobarbitone. Bundles of muscle fibres approximately 2 mm in diameter and 3 cm long were dissected from both the psoas major and psoas minor muscles and tied to wooden sticks at slack length. Each bundle was put into a 5 ml plastic tube filled with air-free storage solution (containing (mm): 5 ATP, 6 MgCl2, 5 EGTA, 40 potassium propionate, 80 imidazole and 50 % glycerol, pH 7.0 at 25 °C) and kept at −20 °C for 24 h. After replacement of the solution, bundles were stored at −20 °C for up to 2 months. The bundles used during the first week were additionally immersed in the storage solution with 0.5–1 % (v/v) Triton X-100 for 1–2 h before use.
Single muscle fibres were dissected in the dissecting solution (see Table 1) at 5–7 °C with fine forceps. A fibre was placed onto a piece of a coverslip with a drop of the same solution and transferred to the experimental trough. A 2 ± 0.2 mm long fibre segment was glued at 5 °C to the nickel tube ends of the length motor and of the force transducer with shellac dissolved in ethanol (∼50 % w/v purified with centrifugation). Then the coverslip was removed and the experimental trough was lifted up to immerse the fibre in the relaxing solution at ∼0 °C. Sarcomere length was adjusted by He–Ne laser diffraction (Fig. 1) to 2.4–2.5 μm and inspected along the fibre. Only fibres where the sarcomere length deviation was less than ± 0.1 μm of the mean value were used. Fibre width and length were then measured in both solution and air in two perpendicular directions with a dissecting microscope and right-angle prism (Bershitsky & Tsaturyan, 1992, 1995).
Table 1.
Composition of solutions (mm)
| Relaxing | Activating | Dissecting | |
|---|---|---|---|
| Na2ATP | 5 | 5 | 5 |
| EGTA | 5 | — | 5 |
| CaEGTA | — | 5 | — |
| MgCl2 | 7 | 7 | 7 |
| Creatine phosphate | 22 | 20 | — |
| CPK (mg ml−1) | 1 | 1 | — |
| Cacodilic acid | 100 | 100 | — |
| Imidazole | — | — | 20 |
| KCl | — | — | 110 |
The ionic strength of the relaxing and activating solutions was 200 mm. pH of all solutions was adjusted to 7.0 with KOH and HCl. CPK, creatine phosphokinase. All chemicals were from Sigma.
Figure 1. Block diagram of the experimental set-up.
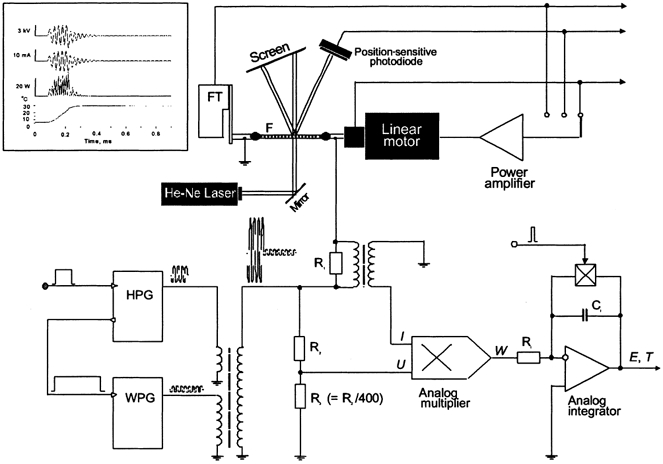
A segment of permeabilized single muscle fibre (F) was glued with shellac to the tips of nickel tube electrodes attached to the force transducer (FT) and linear motor. The fibre was illuminated by a beam of a 5 mW He-Ne laser for monitoring or feedback control of sarcomere length by detection of the position of the first-order diffraction peak with a position-sensitive photodiode (LSC/30D; United Detector Technology, Hawthorne, CA, USA). The other first-order peak was used for initial adjustment of sarcomere length by projection on a calibration screen and visual observation of diffraction quality. The force transducer end of the fibre was electrically connected to earth while the motor end was connected to the temperature jump apparatus. A heating pulse generator (HPG), triggered externally, produced a 0.15 ms 40 kHz current pulse and triggered the warming pulse generator (WPG). The warming pulse lasted up to 200 ms. The two pulses were transformed into a high-voltage pulse of the shape shown in the inset and applied to the fibre suspended in air. The amplitude of the T-jump was computed with a circuit consisting of an analog multiplier which gave the product (power, W) of heating pulse current (a voltage drop on a 200 Ω resistor, R1) and voltage (after 400-fold attenuation with R1/R2). The power of the heating pulse was integrated to obtain the temperature change (ΔT), proportional to energy (E) divided by the thermal capacity of the fibre. The integrator was zeroed 100 ms before the T-jump to avoid an error due to a residual charge in the capacitor (CI) and frozen immediately after the heating pulse was finished. Thus the energy of the warming pulse was not taken into account for calculating the amplitude of the T-jump.
Mechanical set-up
A thermocontrolled experimental trough designed for Joule temperature jump, a piezoelectric force transducer with a resonant frequency of ∼12 kHz, and a length motor providing ± 50 μm steps within 0.12 ms have been described previously (Bershitsky & Tsaturyan, 1992, 1995). Since the piezoelectric transducer is unable to register steady force, a slack test of ∼4 % fibre length was applied to the fibre in the end of each frame for recording the tension baseline. In some experiments, a force transducer based on AE801 (SensoNor a.s., Horten, Norway) strain gauge was used. Its resonant frequency was ∼4 kHz.
Temperature-jump apparatus
The Joule temperature jump (T-jump; see Fig. 1) was produced by a high-voltage 40 kHz AC pulse of 0.15 ms duration applied to a muscle fibre suspended in the moist air of the experimental trough at ∼5 °C as described previously (Bershitsky & Tsaturyan, 1992, 1995). This heated the fibre to a maximum of 40 °C. Continuous monitoring of the pulse voltage and current provides a measure of the pulse energy, which is proportional to the change in temperature achieved in the T-jump. The overall accuracy of the measurement was ∼10 %, as estimated from control experiments with thermosensitive dye (see below). In this study, the method was supplemented with a warming-up electronic circuit to maintain a nearly constant fibre temperature for 200 ms after the T-jump. A 0.2 s duration, 40 kHz AC pulse of a smaller amplitude was applied just after the T-jump pulse to compensate for heat loss, so that temperature remained constant within a range ± 10 % of the T-jump amplitude.
Adjustment of fibre warming
The amplitude of the warming pulse was adjusted by monitoring the temperature time course within a fibre. In a control experiment, absorption of He-Ne laser light was recorded in a muscle fibre immersed in relaxing solution containing 100 mm of the thermosensitive Tris buffer (temperature coefficient of pKa for the Tris buffer is ΔpKa/ΔT = −0.027 K−1; Bershitsky & Tsaturyan, 1992) and Bromthymol Blue pH-sensitive dye in saturated concentration (both from Sigma Chemical Co., St Louis, MO, USA). A linear relationship was found between light absorption of this solution measured with a photodiode and its temperature monitored in the trough by a miniature thermometer within a temperature range of 0–40 °C. The dye-relaxed fibre was suspended in air at ∼5 °C and T-jumps to 30–35 °C were applied. Records of changes in the fibre temperature obtained with this method were rather noisy because of the short optical path in the fibre and light scattering; however, the kinetics of cooling could be extracted from these records (Fig. 2). The amplitude of the warming pulse was adjusted to maintain the output light signal as constant as possible for 200 ms after the T-jumps. When the T-jump magnitude was changed, the warming pulse amplitude was scaled proportionately. As shown previously, heat and vapour diffusion from the fibre surface after a T-jump in air are the main cooling mechanisms and the apparent rate constant of the fibre cooling is in inverse proportion to the square of the fibre diameter (Bershitsky & Tsaturyan, 1992).
Figure 2. Effect of warming up on temperature kinetics in muscle fibre after temperature jump.
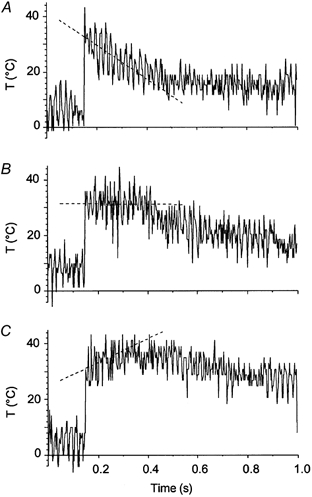
The fibre was filled with a saturated solution of Bromothymol Blue dye in relaxing solution with 100 mm of the highly thermosensitive Tris buffer at pH 7.8. The fibre was suspended in air at ∼6 °C and the temperature jump was applied. To record instantaneous temperature changes, the beam of a He-Ne laser illuminated the fibre and light transmission was monitored with a photodiode. Absorption of laser light by Bromothyol Blue in the fibre depends on pH, which in turn depended on temperature that induced a shift in the pKa of Tris buffer. Traces show the output voltage of the photodiode, which varies linearly with the temperature in the fibre. The T-jumps applied at 0.15 s of the records were followed by a warming-up pulse lasting for 0.2 s. A, without warming, T-jump 26.7 °C; B, optimal warming, T-jump 25.5 °C; C, over-warming, T-jump 25.1 °C. Dashed lines are linear regressions through the output signal during the warming pulse, i.e. in the range 0.15–0.35 s: −60.9 °C s−1 for A, −0.95 °C s−1 for B and 42.8 °C s−1 for C. Fibre dimensions: 1.9 mm × 5280 μm2; sarcomere length 2.4 μm.
Sarcomere length measurements and control
A laser diffractometer (Fig. 1) consisting of a 5 mW He-Ne laser and a position-sensitive photodiode (LSC/30D; United Detector Technology, Hawthorne, CA, USA) was used for sarcomere length monitoring and control as described previously by Burton & Huxley (1995) and Bershitsky & Tsaturyan (1995). The length of the central segment of the fibre illuminated by the laser beam was about 1 mm. A feedback switching circuit, kindly provided by Professors V. Lombardi and M. Irving, was used for the sarcomere length control.
Experimental protocols, solutions and data analysis
To activate the fibre, the relaxing solution surrounding it was sucked out and the trough was filled with activating solution. When fibre tension achieved a steady level at 0 °C, the trough was moved down and the fibre remained suspended in air between the tips of the electrodes attached to the motor and force transducer. The tension in the fibre slightly increased because the temperature of the surrounding moist air was ∼5 °C. After about 2 s, during which time fibre tension and temperature settled, the T-jump was applied. Then the trough was lifted and the fibre returned to the activating solution. In total, the fibre was kept in activating solution for 3–4 s in every activation. Finally, this solution was removed and the trough was washed twice with the relaxing solution (for solution compositions see Table 1).
Activation of rabbit muscle fibres at low temperature preserves their sarcomere structure and permits up to 30 activations (and T-jumps) in each fibre before 15 % of initial tension is lost.
Changes in fibre tension (P), motor position (L) and sarcomere length (SL), as well as amplitude of the T-jump were recorded with a four-channel data acquisition card, DAS-50 (Keithley MetraByte Corp., Taunton, MA, USA) and then transferred to the hard disk of a PC. Sampling rate was from 40 to 100 kHz per channel. The typical duration of the records was 200 ms.
Tension traces were analysed with GIM software kindly provided by Mr A. Drachev (A. N. Belozersky Institute of Physico-Chemical Biology, M. V. Lomonosov Moscow University, Moscow, Russia). This software incorporates the algorithm of multiexponential curve fitting developed by Provencher (1976).
Two estimates of fibre stiffness, STL = L × ΔP/ΔL and SSL = SL × ΔP/ΔSL, were obtained using changes in tension (ΔP), total fibre length (ΔL) and sarcomere length (ΔSL) induced by 1.5 kHz sinusoidal oscillations of fibre length imposed by the motor. Values of STL and SSL were obtained as follows. First, oscillatory components of P, L and SL were found by subtracting traces smoothed by a moving average over 0.67 ms, the period of length oscillation from the raw data. Then these oscillatory components were smoothed by calculating the square root of their squares. Finally, oscillatory components ΔL, ΔSL and ΔP, rectified with a moving average over a 0.33 ms period (i.e. a half-period of oscillation), were calculated and then used to plot STL and SSL traces.
RESULTS
Effect of sarcomere length change on tension transients induced by T-jump
First, the effect of sarcomere length feedback control on the characteristics of the T-jump-induced tension transients was investigated. Figure 3 shows two pairs of experimental records where tension transients were initiated by ∼30 °C T-jumps. In the case where the local changes in the sarcomere length were moderate and (rather importantly) slow, clamping of the sarcomere length hardly affected the amplitude and the time course of the tension rise compared to the transient obtained under control of the total fibre length, i.e. position of the moving part of the motor (Fig. 3A). On the contrary, the time course of the tension transient was very different from that at constant sarcomere length if changes in the sarcomere length were large and fast (Fig. 3B). These fast changes in sarcomere length in the central segment of the fibre indicate heterogeneity of its mechanical properties. They were probably induced by damage occurring in the end segments of the fibre after the T-jump. Note that, unlike the time course, the final tension achieved after the T-jump was practically insensitive to the changes in sarcomere length.
Figure 3. Examples of the effect of changes in sarcomere length on tension transients induced by the T-jumps.
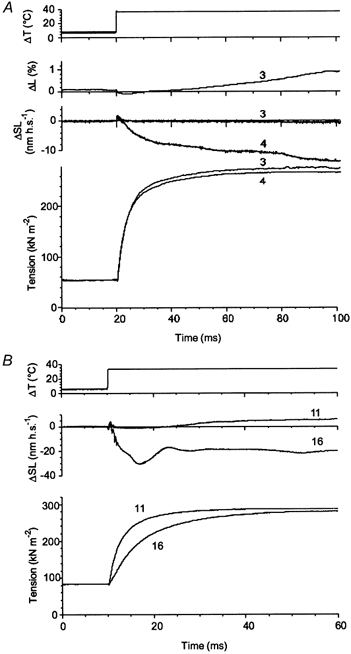
A, traces (from top to bottom) are: temperature, changes in total fibre length (in nanometres per half-sarcomere, nm h.s.−1), changes in sarcomere length in a central segment of the fibre, and tension. Transient 3 was recorded under sarcomere length feedback control, final temperature 36.3 °C; transient 4 was taken under total length feedback control, final temperature 36.1 °C. B, traces (from top to bottom) are: fibre temperature, changes in sarcomere length and tension. Both transients 11 and 16 were recorded without sarcomere length feedback control. Final temperature after the T-jumps was 33.9 °C. Fibre dimensions: A, 1.96 mm × 5030 μm2, sarcomere length 2.44 μm; B, 1.88 mm × 5130 μm2, sarcomere length 2.40 μm.
Only those muscle fibres in which changes in the half-sarcomere length after the T-jumps were less than 15 nm and no fast component was present were used in the experiments presented below.
T-jump-induced tension transients under sarcomere length control
Since local changes in the sarcomere length affect the tension responses to a fast increase in temperature (Fig. 3), a series of experiments was done where T-jumps of different amplitudes were applied to fully activated fibres under sarcomere length feedback control. The final tension and time course of the transients depended on the amplitude of the T-jump and were highly reproducible. Figure 4 shows a series of T-jump-induced transients obtained in a muscle fibre. Traces from the second and sixteenth activation, where final temperatures were 32.1 and 33.2 °C, respectively, are practically indistinguishable. A small fast tension drop during the T-jump itself (see also Fig. 10A) was due to thermal expansion of the fibre (Bershitsky & Tsaturyan, 1985, 1989, 1992; Goldman et al. 1987).
Figure 4. Tension transients induced by the T-jumps from ∼6 °C to different final temperatures under sarcomere length control.
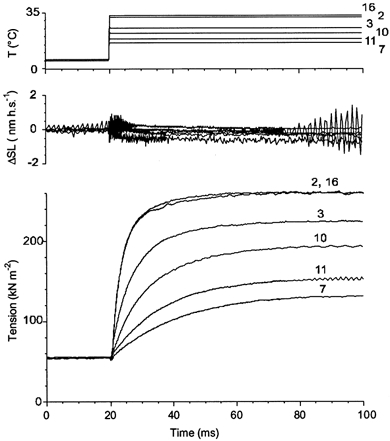
Temperature in the fibre (upper traces), changes in sarcomere length (middle traces) and tension (lower traces) in an experiment are shown. The numbers near the traces indicate the order in which they were obtained. Final temperature achieved by the T-jumps was 32.1 (trace 2), 25.4 (trace 3), 16.3 (trace 7), 21.9 (trace 10), 18.5 (trace 11) and 33.2 °C (trace 16). Fibre dimensions: 2.06 mm × 4420 μm2, sarcomere length 2.4 μm.
Figure 10.
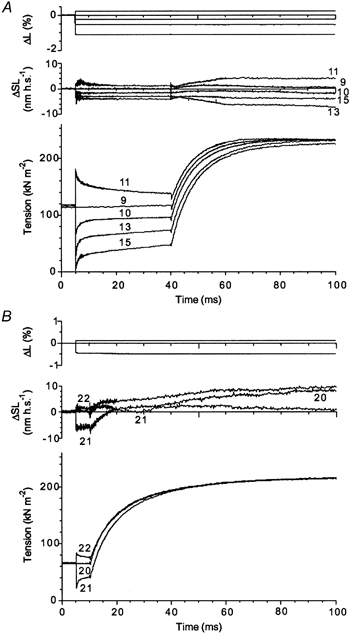
Tension transients (lower traces) and changes in total fibre length (upper traces) and in sarcomere length (middle traces) in two experiment where T-jumps of about constant amplitude were applied to muscle fibres 35 (A) and 5 ms (B) after length steps of different sign and amplitude. Initial temperature was ∼5.5 °C. A, final temperature 21.0 (trace 9), 22.1 (trace 10), 21.7 (trace 11), 21.8 (trace 13) and 21.9 °C (trace 15). Fibre dimensions: 1.80 mm × 4220 μm2, sarcomere length 2.50 μm. B, final temperature 26.3 (trace 20), 25.6 (trace 21) and 26.4 °C (trace 22). Fibre dimensions: 2.10 mm × 3340 μm2, sarcomere length 2.50 μm.
Temperature dependence of active tension in muscle fibres
The dependence of maximal tension achieved after T-jumps of different amplitudes on the final temperature is shown in Fig. 5. The data (n = 34) were obtained from tension records in three single muscle fibres under sarcomere length feedback control, including the fibre shown in Fig. 4. It is seen that, under isometric conditions, there was more than a fivefold tension increase when temperature changed from ∼5 °C to a physiological level. The slope of the relationship decreased slightly at higher temperatures; it was 8.4 kN m−2 K−1 at 6–25 °C and 6.8 kN m−2 K−1 at 25–37 °C. An apparent Q10 value for isometric tension was 2.16 in the temperature range of 6–25 °C and 1.34 in the range of 25–37 °C.
Figure 5. Temperature dependence of steady-state isometric tension achieved with the T-jumps from ∼6 °C to different final temperatures.
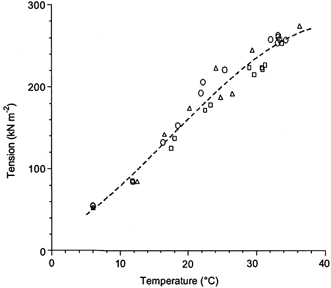
The data were obtained from 3 muscle fibres (shown by different symbols and including the fibre shown in Fig. 4) under sarcomere length feedback control. Amplitudes for 6 °C were obtained by averaging tension before the T-jump in each fibre. The line is a third-order polynomial fit through all data. Fibre dimensions: 2.06 mm × 4420 μm2, sarcomere length 2.4 μm; 1.96 mm × 5030 μm2, sarcomere length 2.44 μm; 2.16 mm × 5030 μm2, sarcomere length 2.42 μm.
Time course of tension responses to temperature jumps
Following the T-jump, tension rose more quickly at the higher final temperature (Fig. 4). This could be seen more clearly when each tension trace shown in Fig. 4 was normalized for the amplitude of the tension rise (Fig. 6A). The half-time of the tension rise decreased 6.5 times when final temperature increased from ∼16 to ∼33 °C, corresponding to an apparent Q10 of ∼3.
Figure 6. Normalized tension transients.
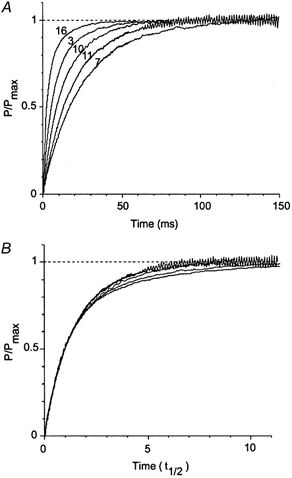
A, the five tension transients shown in Fig. 4 are normalized to the maximal amplitude of tension response at final temperature. B, same traces as in A with time scale renormalized for half-time (t0.5) of tension rise. Trace numbers are shown next to each record in A; t0.5 for traces 7, 11, 10, 3 and 16 was 16.9, 12.9, 8.6, 5.3 and 2.6 ms, respectively.
Further comparison of the transients was made by normalization of the half-time of tension rise for each trace shown in Fig. 4 (Fig. 6B). Now the transients differ only in the late slow phases while early phases coincide. It should be noted that this late phase is very sensitive to the accuracy of maintaining constant temperature after the T-jump, which was achieved in our experiments by adjustment of the warming-up pulse that compensated fibre cooling.
Following custom (Goldman et al. 1987; Tsaturyan & Bershitsky, 1988; Bershitsky & Tsaturyan, 1992; Davis & Harrington, 1993; Davis & Rogers, 1995b; Ranatunga, 1996, 1999), we tried to fit the time course with a sum of exponential components using the algorithm of Provencher (1976). This algorithm fits to find up to five exponential components and, unlike many other programs, it also provides a statistical estimation of the most probable number of components in a trace. For our data, the estimated number of exponential components varied from one to four in the different transients and did not correlate directly with the amplitude of the T-jump, although for small T-jumps the number of exponential components was usually fewer. This made it impossible to compare the kinetics of the transients and to determine how many processes underlie the tension rise. Occasionally, for two tension transients looking apparently identical, the amplitudes and rate constants of the exponential components obtained using this algorithm were significantly different. For instance, the most probable number of exponential components for traces 2 and 16 in Fig. 4, which look very similar, was three and two, respectively.
To avoid problems of curve fitting, a more pragmatic approach was used. The logarithm of the reciprocal values of the time intervals t0.25, t0.5 and t0.75 from the T-jump to the moment when tension increase achieved 25, 50 and 75 % of its full amplitude, respectively, were plotted against reciprocal absolute temperature. The results of this analysis of the time course of tension transients obtained under sarcomere length control from three muscle fibres are shown in Fig. 7. Linear regression lines for all three time intervals measured were parallel. This suggests that, for the whole set of pooled data, the time course of the tension rise accelerated with temperature but traces remained similar as is seen for an individual fibre (Fig. 6B).
Figure 7. Arrhenius plot for the rate constants of the tension transients induced by the T-jumps under sarcomere length control recorded from the three single muscle fibres used for the plot in Fig. 5.
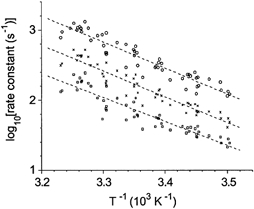
Apparent rate constants, 1/t0.25 (○), 1/t0.5 (×) and 1/t0.75 (□), correspond to reciprocal values of time intervals from the T-jump to the moment when tension increase achieved 0.25, 0.5 and 0.75 of its final level, respectively. Dashed lines are linear regression lines for −log10(ti) (where ti is time intervals, t0.25, t0.5 or t0.75) against reciprocal absolute temperature (T) with slopes of −3.7, −3.68 and −3.42 for t0.25, t0.5 and t0.75, respectively.
Fibre stiffness during tension transient initiated by the T-jump
Earlier, we found that a threefold tension rise induced by the T-jump was accompanied by about 30 % increase in fibre stiffness (Bershitsky & Tsaturyan, 1986, 1989). In the present experiments the stiffness change during the transient was measured in conditions where temperature after the T-jump was stabilized with a warming-up pulse, sarcomere length was monitored during the transient and the data were recorded using a high-frequency precision A–D converter (see Methods). For stiffness measurement, a contracting muscle fibre was subjected to small amplitude sinusoidal 1.5 kHz changes in length before and during the transient, and changes in fibre tension and sarcomere length were recorded. It was difficult to obtain a good sarcomere length signal from a muscle fibre suspended in air; only one in four fibres gave a reliable signal during length oscillations. In a record from this experiment, shown in Fig. 8, the T-jump was 23.5 °C. Tension (P) and changes in total length (L), and sarcomere length (SL) were recorded at a sampling rate of 40 kHz per channel; frequency of length oscillations was 1.5 kHz. The increase in average tension from ∼55 kN m−2 at ∼6 °C to ∼240 kN m−2 at ∼30 °C was accompanied by an increase in the amplitude of oscillations of sarcomere length (ΔSL) and tension (ΔP), while the amplitude of sinusoidal changes of the total fibre length (ΔL ≈ 0.25 % peak-to-peak) remained constant.
Figure 8. Stiffness changes in a muscle fibre during a tension transient induced by a 23.5 °C T-jump.
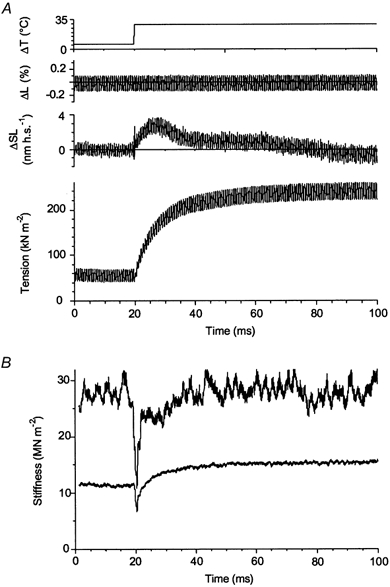
A, traces (from top to bottom) are: fibre temperature, changes in total fibre length, changes in sarcomere length and tension. Sinusoidal oscillations in fibre length had a frequency of 1.5 kHz. Sampling rate was 40 kHz per channel. B, upper and lower traces are time courses of fibre stiffness (SSL and STL) during the temperature-induced transient obtained with normalization for changes in sarcomere length and total fibre length, respectively. Procedure of stiffness measurement is described in the text. Fibre dimensions: 1.96 mm × 5030 μm2, sarcomere length 2.44 μm.
Stiffness, estimated from changes in total fibre length (STL) increased from 12 MN m−2 at ∼6 °C to 15.5 MN m−2 at a final temperature of ∼30 °C, that is by ∼30 %, during a 4.5-fold rise in average tension. Therefore, even if STL is considered to be an appropriate measure of fibre stiffness, its change after the T-jump was far too small compared to the change in tension. However, when stiffness was measured from the tension change normalized to the change in sarcomere length, it was ∼29 MN m−2 both before and after the tension transient and only dropped temporarily during and just after the T-jump itself (Fig. 8B). The nearly twofold difference between STL and SSL can be explained by compliance of the fibre ends, which reduces STL but does not effect SSL.
Despite the fact that the increase in tension following the T-jump is not accompanied by any significant change in SSL, one cannot a priori exclude the possibility that the amplitude of changes in tension (ΔP), especially at higher temperature, is underestimated due to a truncation of tension changes. Such truncation may occur during the oscillatory protocol if tension recovery is fast compared to the time scale of the applied length changes (Huxley & Simmons, 1971; Ford et al. 1977). Since recovery accelerates with increased temperature (Ford et al. 1977), the truncation can mask an increase in stiffness after the T-jump. To account for the truncation, instantaneous changes in tension (ΔP(t)) were plotted against changes in sarcomere length (ΔSL(t)) before and at the end of the transient induced by the T-jump. Since sarcomere length records were rather noisy, both ΔP(t) and ΔSL(t) traces at low and high temperature were fitted with sinusoidal functions, where their amplitudes and phases were free parameters while the frequency was that of the motor oscillations (Fig. 9A and B). The P(SL) Lissajous plots at different temperatures were drawn using the fitted amplitudes and phases (Fig. 9C).
Figure 9. Amplitude and phase analysis of the tension and sarcomere length traces shown in Fig. 8A.
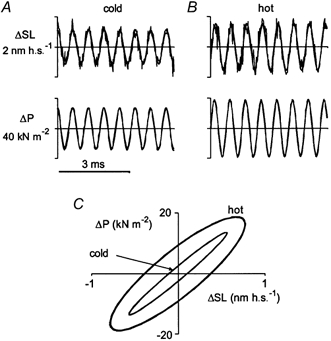
In A and B, 5 ms fragments of changes in sarcomere length and tension induced by 1.5 kHz sinusoidal oscillations in fibre length recorded during steady-state contraction at low (A, ∼6 °C; fourth to ninth millisecond) and high (B, ∼30 °C; nintieth to ninty-fifth millisecond) temperature were fitted with sinusoidal functions. Average tension was 55 kN m−2 in A and 240 kN m−2 in B. In C, Lissajous plots of the fitted changes in tension (ΔP) and in sarcomere length (ΔSL) at low and high temperature are drawn. Amplitudes of sinusoidal oscillations in sarcomere length were 0.57 and 0.78 nm h.s.−1 for A and B, respectively. Amplitudes of tension oscillations and apparent stiffness (SSL) were 13.7 kN m−2 and 28.7 MN m−2 at low temperature (A) and 18.8 kN m−2 and 29.6 MN m−2 at high temperature (B), respectively. The phase shift between changes in sarcomere length and tension was 0.19 rad for A and 0.51 rad for B.
After the T-jump, the amplitude of oscillations of both ΔP and ΔSL increased, while the slope of the Lissajous plot did not change significantly (Fig. 9). However, tension truncation due to partial tension recovery was indeed more pronounced at higher temperature, as seen from the increased width of the Lissajous plot (Fig. 9C) and in the phase shift (ΔΦ) between oscillations in sarcomere length and tension (Fig. 9). This shift was 0.19 rad at 6 °C and 0.51 rad at 30 °C. As the simplest approximation, tension truncation can be described by a process which is characterized by a single relaxation time constant (trel) of exponential tension relaxation. In this case, tan(ΔΦ) = 1/ωtrel, where ω is the angular frequency of the oscillations so that the stiffness measured at a certain value of frequency ω, SSL(ω) can be expressed as
where true instantaneous nontruncated stiffness SSL(∞) is the limit of SSL(ω) when ω approaches infinity. In this case, SSL(∞) = 1.018SSL(ω) at 6 °C and SSL(∞) = 1.123SSL(ω) at 30 °C or (see Fig. 9) 29.2 MN m−2 and 33.2 MN m−2, respectively. This means that, with the above approximation, fibre stiffness corrected for tension truncation due to fast tension recovery increased by ∼15 % when tension increased with temperature ∼4.5 times.
Comparison between length- and temperature-induced tension transients
If both sudden length steps and T-jump perturbations result in force generation by the same elementary process, it is probable that perturbation of one type will affect the amplitude and/or the time course of force generation induced by the other. According to Huxley & Simmons (1971), force generation after a length step is accompanied by a shift in equilibrium between those attached cross-bridges which do and do not generate force in favour of those that do. Therfore, the fraction of the cross-bridges capable of producing a power stroke has to decrease until the cross-bridge ability to make a new step after the transient is recovered. In intact frog muscle fibres, this delay for recovery, or ‘repriming’, was found to be ∼10 ms at 4 °C (Lombardi et al. 1992). In rabbit muscle fibres at 6 °C this process seems to be longer, judging by the fact that the duration of the Huxley-Simmons phases 3 and 4 is much longer (see, for example, Fig. 13) compared to frog muscle. If a T-jump is imposed soon after a length step, before the ‘repriming’ takes place, the amplitude of the tension transient induced by the T-jump should decrease compared to that in isometric conditions. On the other hand, since the T-jump leads to a rise of mean force produced by a cross-bridge, this rise also has to be accompanied by a transition of the cross-bridges to a force-generating state(s). According to the Huxley -Simmons theory (1971), this transition should reduce the number of cross-bridges able to participate in the tension response to the length step applied after the T-jump. Therefore, if a length step release (shortening) precedes the T-jump, the perturbation is expected to recruit more cross-bridges into force-generating states and lead to a reduction in the number of cross-bridges capable of generating force in response to the second perturbation. In a series of experiments with four muscle fibres, the length steps were applied shortly before the T-jumps. Tension transients induced by these double perturbations are shown in Fig. 10. In Fig. 10A, an activated fibre was subjected to step changes in total length by −1.37 to +0.21 % (minus and plus indicate fibre release or stretch, respectively) applied 35 ms before T-jumps of 15.0–16.1 °C leading to a final temperature of 21.0–22.1 °C under total length control. Figure 10B shows results of another experiment where the delay between the steps and the T-jumps of ∼20 °C was 5 ms. The final tension reached after the T-jump does not depend on the preceding length change, while tension just before the T-jump varies significantly. Therefore, during the tension transient induced by the T-jump, the cross-bridges ‘forget’ the state distribution induced by imposed length change. This demonstrates that at least the late phase(s) of the T-jump transient is accompanied by cross-bridge detachment and reattachment to ‘new’ actin sites.
Figure 13. Mechanical transients in muscle fibre induced by fast length releases at low and high temperature.
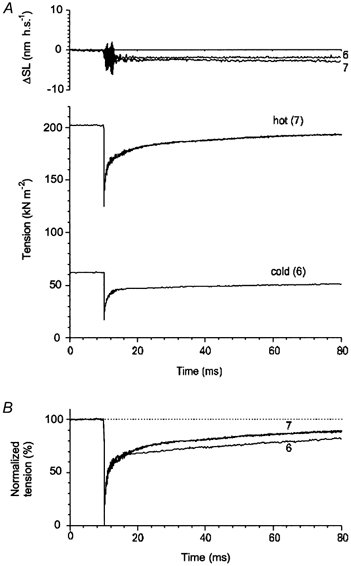
The fibre was the same as that in Fig. 12. The low-temperature transient was recorded when the fibre was in solution at 0 °C, the high-temperature transient was recorded 80 ms after the T-jump when temperature in the fibre was 29.3 °C and the tension achieved steady state (same trace 7 as in Fig. 12).
The strain dependence of the parameters describing the tension transients induced by the length steps and T-jumps in the experiment shown in Fig. 10 is illustrated in Fig. 11. Tension transients induced by the length steps were fitted either by one (⋄) or two (▿, ▵) exponentials. Independently of the number of exponential components used for the fitting, the rate constants increased with the amplitude of fibre release and decreased after stretch, as first found by Huxley & Simmons (1971). However, the time course of the transients initiated by the T-jump (expressed as the reciprocal of the time taken for tension to reach half its maximal increment, 1/t0.5) slowed down slightly with the amplitude of the release and thus differed from the mechanical transients. The time course of the tension transients induced by the T-jumps is about an order of magnitude slower than that induced by the length steps (Fig. 11). This difference in the rate constants and strain independence of the T-jump-induced transients demonstrates that the processes underlying these transients are probably different.
Figure 11. Strain dependence of the rate constants for the length step- and the T-jump-induced tension transients shown in Fig. 10A on the amplitude of the preceding length steps.
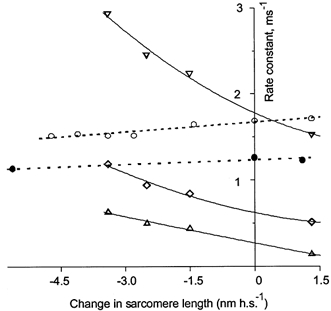
Rate constants k1 (▿) and k2 (▵) were extracted from two-exponential fit while apparent rate constant kapp (⋄) was obtained from monoexponential fit of the length step responses. The time course of the T-jump response is characterized by reciprocal halftime, 1/t0.5 (○, •), multiplied by 10 to see all points on the same plot. The open symbols relate to the fibre of Fig. 10A, while closed symbols relate to the fibre of Fig. 10B. The dashed lines are linear regressions through the data points for 1/t0.5. The continuous lines show parabolic regressions for k1, k2 and kapp.
The possible interaction of length step- and T-jump-induced tension transients was also checked with another protocol used in the experiments with three muscle fibres. In the experiment shown in Fig. 12, a 0.5 % release of the fibre length was applied to an activated muscle fibre at different moments before (Fig. 12A) and after (Fig. 12B) the T-jumps of 18.3–19.0 °C (final temperature of 24.3–25.0 °C). In trace 9, the T-jump was applied in isometric conditions.
Figure 12. Effect of the time of application of length steps on the T-jump-induced tension transients.
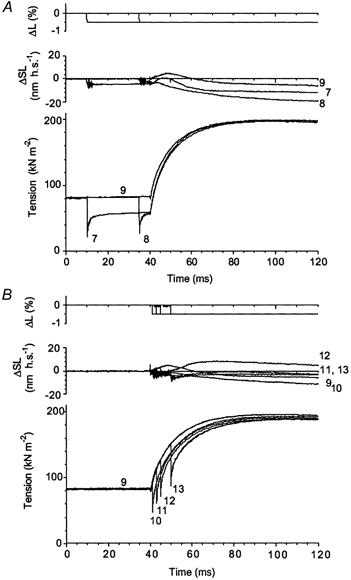
Step releases of 0.5 % fibre length were applied to a contracting muscle fibre at different times before (A, traces 7 and 8) and after (B, traces 10–13) the T-jumps. In A, the release was applied 30 ms (trace 7) and 5 ms (trace 8) before the T-jump. Final temperature was 25.0 °C in trace 7, 25.2 °C in trace 8 and 24.9 °C in isometric trace 9. B, the release was applied 1 (trace 10), 3 (trace 11), 5 (trace 12) and 10 ms (trace 13) after the T-jumps. Final temperature was 24.9 (trace 10), 24.7 (trace 11), 24.3 (trace 12) and 24.3 °C (trace 13). The trace numbers indicate the order in which they were recorded. Isometric trace 9 is shown in both A and B. Fibre dimensions: 2.12 mm × 5280 μm2, sarcomere length 2.50 μm.
To extract T-jump responses from complex transients, tension responses to 0.5 % decreases in fibre length were separately recorded at 0 and 25.0 °C in the same fibre (Fig. 13, ‘cold’ and ‘hot’ traces, 6 and 7, respectively). Then the ‘cold’ tension response to the step release was subtracted from tension traces 7 and 8 of Fig. 12A and the ‘hot’ response was subtracted from traces 10, 11, 12 and 13 of Fig. 13B to extract pure T-jump tension responses. The results of the subtraction are shown in Fig. 14.
Figure 14. T-jump-induced tension transients extracted from combined transients by subtraction of mechanical transients induced by length step release.
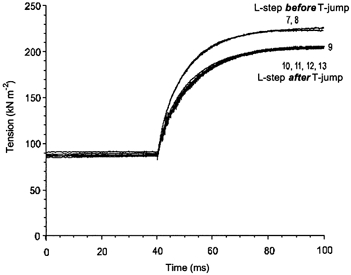
Three-exponential fittings of the tension transients induced by length step releases at low and high temperature shown in Fig. 14 were subtracted from the complex transients shown in Fig. 13 and offset up by the value of elastic response. The fits were used instead of the transients to reduce noise and to have extrapolations longer than the records. The fit of low-temperature mechanical transient (trace 6 in Fig. 13) was subtracted from traces 7 and 8 in Fig. 12, while the fit of high-temperature transient (trace 7 in Fig. 13) was subtracted from traces 10–13. Isometric trace 9 was not changed.
After these subtractions, traces split up into two distinct sets, one where the length steps preceded the T-jump (Fig. 14, traces 7 and 8) and another where the length steps were applied after the T-jump (traces 10–13). Note that the isometric trace 9 belongs to the second set, where the length step followed the T-jump. Within each group, the amplitude and time course of the trace are practically indistinguishable. The difference between the two sets of traces can probably be explained as follows. When the length steps were applied after the T-jumps (traces 10–13), temperature responses were extracted from combined transients by subtracting ‘hot’ mechanical responses obtained at the same post-T-jump temperature. In contrast, at lower temperatures ‘cold’ length step-induced responses were subtracted from complex tension transients (traces 7–8), where temperature changed after the length steps. Two other experiments, including one where a series of 6–7 and 21–22 °C T-jumps were applied, gave essentially the same results as that shown in Fig. 14. The experiments with length step changes applied after the T-jumps again demonstrate no interaction between processes initiated by fast perturbations in length and temperature of muscle fibre.
DISCUSSION
Ford et al. (1977) and Linari et al. (1993) showed that constancy in the sarcomere length after applying length steps is necessary for the correct determination of the time course of mechanical tension transients. The traces in Fig. 3 show how a constant sarcomere length is also essential for determining the time course of tension transients induced by T-jumps. Otherwise, shortening in the central part of the fibre due to end lengthening can significantly slow down the changes in force.
Temperature dependence of active isometric tension
Figure 5 shows the temperature-tension relation obtained with T-jumps of different amplitude under sarcomere length feedback control from three muscle fibres. Isometric tension increased from ∼55 kN m−2 at 5–6 °C to ∼270 kN m−2 at 32–36 °C, i.e. about fivefold. Taking into account that the cross-sectional area of muscle fibres increases during permeabilization by 44–50 % (Godt & Maughan, 1977; Linari et al. 1998), isometric tension at near-physiological temperature in our experiments (Fig. 4 and Fig. 5) would correspond to ∼400 kN m−2 (270 kN m−2 × 1.47) in intact muscle fibres. The slope of the temperature-tension curve decreases slightly at temperatures above 20–25 °C, but even at near-physiological temperatures the curve is far from saturation.
Although all fibres in our experiments produced similar tensions at 20–35 °C, there was a rather wide variety of pre-T-jump tension at 5–6 °C, from 50–60 (Fig. 4 and Fig. 8) to 100–120 kN m−2 (Fig. 10 and Fig. 12). This variation in low-temperature tension affects the tension-temperature relation, which for some fibres can be less steep than that shown in Fig. 5. However, even then, no saturation at higher temperatures was observed.
Although active tension is much less sensitive to disorder in sarcomere length than the time course of the T-jump-induced tension transients (Fig. 3), permeabilized rabbit muscle fibres may develop less tension if activated by addition of Ca2+ at high temperature. For example, tension at ∼30 °C reported by Goldman et al. (1987) and by Zhao & Kawai (1994) was 63 and 78 %, respectively, of that found in the present paper, while tension at 10–15 °C was very similar (Fig. 5). However, the high-temperature tension in our experiments was similar to that obtained from fibres activated at low temperature and then warmed up to 35–40 °C for 50–60 s (Ranatunga, 1990) or quickly transferred to a solution bath preheated to 30 °C (Pate et al. 1994).
Low isometric tension reported at higher temperatures is probably a consequence of heterogeneity in sarcomere length, which occurs during Ca2+ activation of the fibre. Sarcomeres into which Ca2+ diffuses quickly contract and stretch others where Ca2+ diffuses more slowly. The heterogeneity is more pronounced at higher temperatures because contraction velocity is much more sensitive to temperature than diffusion time. As a result of this heterogeneity, the length of many sarcomeres is either shorter or longer than the region where the thin and thick filaments fully overlap (Goldman & Simmons, 1984). Active tension in this case is less than that during true isometric contraction at optimal sarcomere length. Sarcomere disorder at higher temperatures was eliminated in our experiments by use of the sarcomere length feedback control and partially prevented in the experiments of Ranatunga (1990) and Pate et al. (1994), where fibres were activated at low temperatures and then quickly heated.
Tension loss during high-temperature activation leads to apparent saturation of the tension-temperature relation at higher temperatures due to underestimation of high-temperature tension. Our data presented in Fig. 5, as well as the data of Ranatunga (1990), show much less saturation than temperature-tension curves reported earlier (Stephenson & Willams, 1985: Goldman et al. 1987). However, some authors did not find significant saturation of the curve up to 30 °C, even using high-temperature activation (Zhao & Kawai, 1994).
Nature of tension-temperature relationship: number of attached cross-bridges or force per cross-bridge
A T-jump from 5–6 °C to near-physiological temperature leads to a fivefold tension rise (Fig. 4 and Fig. 5). This tension rise could result from an increase in the number of cross-bridges interacting with actin (as is the case during the onset of active contraction in an intact muscle) or from an increase in the average force produced by a cross-bridge, or both.
To estimate whether the number of attached cross-bridges changes when tension produced by a muscle fibre increases with temperature, fibre stiffness was monitored during the T-jump-induced tension rise. The use of stiffness for estimating the number of attached cross-bridges is not straightforward and a number of factors must be taken into account. There was an apparent increase in the amplitude of the tension oscillations after the T-jump and in stiffness (STL) estimated from the changes in total fibre length (Fig. 8). However, if the changes in sarcomere length in the central part of the fibre were used for the stiffness measurements, corresponding stiffness (SSL) remained practically constant despite the approximately fourfold increase in tension (Fig. 8). Goldman et al. (1987) also reported constancy or even a slight decrease of the in-phase stiffness detected by using 0.5 kHz length oscillations and white-light diffraction measurement of the sarcomere length following ∼5 °C T-jumps. In our experiments, sarcomere stiffness (SSL, ∼30 MN m−2) was about twice as great as that measured with changes in the total length (STL, 12–16 MN m−2, Fig. 8) and, in contrast to STL, did not increase with temperature. Some increase in STL with temperature was also observed in our earlier work (Bershitsky & Tsaturyan, 1989) and in the experiments of Zhao & Kawai (1994). This difference between SSL and STL shows that about half of the fibre compliance was in the end segments of the fibre, which were not illuminated by the beam of the He–Ne laser. This end compliance is probably nonlinear and decreases with increasing tension, so that at the higher temperature, when tension is higher, it contributes less to fibre compliance. As a result, STL (the reciprocal of the compliance) increases with temperature while true sarcomere stiffness (SSL) remains constant.
It was thought for a long time that instantaneous fibre stiffness was directly proportional to the number of cross-bridges attached to actin, since the thin and thick filaments appeared to be much stiffer than the cross-bridges (Huxley & Simmons, 1971; Ford et al. 1981). However, more recently compliance of the filaments was found to be about the same as that of the cross-bridges (Huxley et al. 1994; Wakabayashi et al. 1994; Higuchi et al. 1995; Linari et al. 1998; Bordas et al. 1999).
Assuming that during active isometric contraction filament compliance is equal to compliance of the cross-bridges and using the theory of Ford et al. (1981), one can estimate that a 15 % increase in instantaneous (corrected for truncation) stiffness (SSL) with temperature corresponds at most to ∼35 % increase in the number of attached cross-bridges. Even this upper estimate of the stiffness increase is, however, much too small to account for the approximately fourfold rise in tension following a 24 °C T-jump (Fig. 8). Therefore, when fibre tension increases by 4.4 times, force per attached cross-bridge increases by at least 4.4/1.35 = 3.3 times.
Recently, Kawai et al. (2000) found a constant force per cross-bridge in the temperature range of 20–35 °C using the optical trap technique with myosin S1. They observed that at elevated temperature the number of actin-myosin bonds per length of actin filament in the absence of nucleotide increased and that active force in the presence of ATP increased. However, it remains unclear whether the number of actively force-generating cross-bridges in the presence of ATP increases with temperature in the same proportion as the number of rigor cross-bridges. It is also difficult to compare these in vitro data with those obtained from single muscle fibres due to essential differences in the mechanical conditions. Since the bead attached to an actin filament was held by the optical trap 1–4 μm away from the myosin-coated surface, an unknown fraction of the total length of the actin filament was in contact with myosin. Besides, the experimental system unavoidably causes a significant transverse force pulling an actin filament away from the myosin-coated surface and thus breaking actin-myosin bonds. These factors may also explain the surprisingly low estimate of cross-bridge force (0.08–0.3 pN) obtained by Kawai et al. (2000).
On the basis of our observations and estimations shown above, we conclude that an increase in temperature shifts the equilibrium of attached cross-bridges in favour of force-generating states and significantly increases the average force produced by attached cross-bridges rather than recruiting more myosin heads into interaction with actin.
Time course of the T-jump transients
The tension response to the T-jumps shows an instantaneous tension drop due to thermal expansion followed by a tension rise above the pre-T-jump level. At constant fibre length its thermal expansion is equivalent to a step shortening that induces elastic tension drop. The tension transient after a T-jump is a superposition of the responses to the shortening and to the T-jump itself. It is important to estimate the contribution of the step shortening and T-jump components in this complex response. In our experiments, the amplitude of the tension drop was usually less than 5 % of pre-T-jump tension for ∼25 °C T-jumps. Even for small, 8–10 °C T-jumps the drop did not exceed 8 % of the amplitude of the tension rise. A more pronounced tension drop was found in laser T-jump experiments. Goldman et al. (1987) observed tension drop by 3–15 % of the pre-T-jump tension or by 15–50 % of the difference between the pre- and post-T-jump tension for 1.5–7.0 °C T-jumps. Estimations based on the records presented by Davis & Harrington (1993) show that the tension drop during ∼5 °C laser T-jumps in their experiments was 5–8 % of pre-T-jump tension or 15–17 % of the tension increment. The large tension drop during laser T-jumps may result from thermal expansion of the T-clips and hooks holding the fibre ends, while in the Joule T-jump only the fibre itself is heated (Bershitsky & Tsaturyan, 1992). For this reason, in our experiments the contribution of the mechanical response to thermal expansion was very small compared to the tension rise induced by the T-jump itself.
The time course of the tension rise following a T-jump is usually fitted by a sum of several exponential components. The number of components varies in different publications from two (Bershitsky & Tsaturyan, 1986, 1988, 1992; Goldman et al. 1987) to three (Davis & Rodgers, 1995a; Ranatunga, 1996) or four (Davis & Rodgers, 1995b). However, our data show that there is a question of reliability of exponential fitting of the T-jump-induced tension transients. It is not clear whether the rate constants and amplitudes are reproducible when the T-jumps are repeated several times. In our experiments, tension transients themselves were highly reproducible (Fig. 4), but the rate constants, amplitudes and even the most probable number of exponential components varied for transients that looked similar.
Since exponential fitting was not reliable, we measured the half-time of the tension rise induced by the T-jump. The half-time decreased with final temperature with a Q10 of ∼2.6 (Fig. 6). The time for the tension rise of the transient to achieve 25 and 75 % of its maximal value also accelerated with final temperature with a Q10 of ∼2.6 and ∼2.4, respectively. This shows that all phases of the tension rise induced by the T-jump (except perhaps for the very slow component) accelerate with temperature in approximately equal proportion, although the transient itself was not monoexponential. There are two possible sources of error in determining the kinetics of the late phases of the tension transients induced by Joule T-jumps. As we discussed previously (Bershitsky & Tsaturyan, 1992), fibre ends cool down after the T-jump due to heat diffusion towards the cold metal electrodes. At these cooled ends, sustainable isometric tension is less than in the warmer central part of the fibre so that the central part shortens, stretching the ends although the total fibre length is constant. In the experiments reported here, the sarcomere length feedback control provided constancy of sarcomere length in the central part of the fibre, eliminating the contribution of the cooling fibre ends. Accuracy in the maintenance of a constant temperature after the T-jump also affected the late phases of the tension transient.
Length step and T-jump transients
The tension transients induced by a sudden change in length of actively contracting muscle fibres are different from those induced by fast increases in temperature. The reciprocal half-time of the T-jump-induced tension transients was always severalfold less than the rate constants of the fast tension recovery following the length steps (Fig. 11). Also, the time course of the T-jump transients appears to be strain independent, while length step transients accelerate with the extent of fibre release (Fig. 11; Huxley & Simmons, 1971; Ford et al. 1977, 1985). All our attempts to reveal any interaction between the two transients have failed. Changes in amplitude of the length steps applied before the T-jump did not affect the time course of the response to the T-jump transients (Fig. 11). If length steps were applied after the T-jumps, the complex responses could be decomposed into pure mechanical and T-jump responses without any interaction between them (Fig. 14).
A distinct difference between transients induced by the length steps and T-jumps was also found in the time-resolved X-ray diffraction experiments with single permeabilized skeletal muscle fibres (Bershitsky et al. 1997). Length perturbations induce a decrease in the intensity of the M3 meridional X-ray reflection arising from ∼14.5 nm axial repeat of the crowns of myosin heads on the thick filaments, but not in the equatorial reflections or the first actin layer line (Huxley et al. 1981, 1983; Irving et al. 1992; Lombardi et al. 1995; Bershitsky et al. 1997) showing axial, but not radial or azimuthal motion of the myosin heads. In contrast, the T-jump induced a significant decrease in the intensity of the (1,0) equatorial reflection and increase in the intensity of the first actin layer line and M3 reflection (Bershitsky et al. 1997; Tsaturyan et al. 1999). This demonstrates that the tension rise after the T-jump is accompanied by a substantial azimuthal motion of the myosin heads.
The data presented here, together with the results of time-resolved X-ray diffraction experiments, demonstrate that tension transients induced by length steps and T-jumps are of different nature and that the molecular processes responsible are most probably also different.
Implications for mechanism of muscle contraction
It was suggested about 30 years ago that muscle force is produced by a tilting movement of the myosin heads attached to actin (Reedy et al. 1965; Huxley, 1969). On the basis of recent in vitro data, Holmes (1997) put forward a molecular version of the ‘swinging lever arm’ hypothesis. He assumed that force generation occurs by a tilting of the ‘lever arm’ (‘neck’ or light chain-binding domain of the head) with respect to its catalytic (and also actin-binding) domain while the actin-myosin interface does not change. Significant tilting of the lever arm upon nucleotide binding was shown using different experimental techniques (Burmeister-Getz et al. 1998; Suzuki et al. 1998; Houdusse et al. 1999, 2000; Shih et al. 2000). Axial displacement of the distal end of the ‘lever arm’ associated with the tilting was estimated to be in the range of 5–12 nm.
Evidence for change in the orientation of the myosin S1 catalytic domain with respect to actin during the actin-myosin interaction comes from several studies. Three-dimensional reconstruction of the electron micrographs of contracting asynchronous insect flight muscles (Taylor et al. 1999) shows that the myosin head can roll azimuthally and axially along the actin filament and may provide a ∼5 nm axial movement in addition to the lever arm tilting. Veigel et al. (1999) found that one-headed myosin I produces actin displacement in two distinct ∼5.5 nm steps, which are probably associated with two different conformational changes in the actin-S1 complex. Recently, Molloy et al. (2000) reported that in an in vitro assay myosin heads obtained by chymotryptic digestion of muscle myosin II produce a working stroke significantly longer than that predicted by the ‘swinging lever arm’ hypothesis. This suggests that some movement distinct from the neck tilting can take place (H. E. Huxley, 2000). Our finding that tension responses to step changes in muscle length and temperature have different properties and are therefore associated with different molecular processes also suggests that there are at least two different conformational changes which can affect force produced by myosin heads.
It is, however, not trivial to propose a molecular scheme that can explain the observed difference in the time course and strain dependence between tension transients induced by the length steps and T-jumps and the absence of any visible interaction of these transients. Recently, based on our T-jump data, A. F. Huxley (2000a, b) suggested a model where a myosin head can undergo two different force-generating transitions. The first transition is associated with a tilting of the lever arm with respect to the catalytic domain (A1 → A2 and B1 → B2 transitions). Another transition is associated with a rolling movement of the head along actin, from the A-states where the catalytic domain has rotational azimuthal degree of freedom around the fibre axis to the B-states where actin-myosin binding is stereospecific. These transitions, A1 → B1 and A2 → B2, are accompanied by a rolling movement of the head with a rigid body and also induce some axial movement of the distal end of the lever arm. If the 1 → 2 transitions are fast and temperature insensitive while the A → B transitions are slower and sensitive to temperature, this model can explain most of the results presented here, as well as the increase in the intensity of the first actin layer line upon increase in temperature found in the X-ray diffraction experiments (Bershitsky et al. 1997; Tsaturyan et al. 1999). However, it is still not quite clear whether the strain independence of the tension responses to the T-jumps found here (Fig. 11) can also be described by this model.
Acknowledgments
We are grateful to Professor Sir A. F. Huxley, Professor M. A. Ferenczi and Dr Natalia Koubassova for helpful discussions and comments on the manuscript. The work was supported by the Wellcome Trust, INTAS, HHMI and RFBR.
REFERENCES
- Bershitsky SY, Tsaturyan AK. Effect of sub-millisecond temperature jump on tension of permeabilised muscle fibres from the frog in rigor. Biofizika (in Russian) 1985;30:868–872. (English translation: Biophysics 30, 946–950) [Google Scholar]
- Bershitsky SY, Tsaturyan AK. Thermoelastic properties of the cross-bridges in permeabilized muscle fibers of the frog in rigor state. Biofizika (in Russian) 1986;31:532–533. (English translation: Biophysics 31, 582–583) [PubMed] [Google Scholar]
- Bershitsky SY, Tsaturyan AK. Biphasic tension response to the temperature jump in the Ca2+ activated frog skeletal muscle fibers. Biofizika (in Russian) 1988;33:156–158. (English translation: Biophysics 33, 184–186) [Google Scholar]
- Bershitsky SY, Tsaturyan AK. Effect of Joule temperature jump on tension and stiffness of permeabilized muscle fibers. Biophysical Journal. 1989;56:809–816. doi: 10.1016/S0006-3495(89)82727-4. [DOI] [PMC free article] [PubMed] [Google Scholar]
- Bershitsky SY, Tsaturyan AK. Tension responses to Joule temperature jump in skinned rabbit muscle fibres. Journal of Physiology. 1992;447:425–448. doi: 10.1113/jphysiol.1992.sp019010. [DOI] [PMC free article] [PubMed] [Google Scholar]
- Bershitsky SY, Tsaturyan AK. Force generation and work production by covalently cross-linked actin-myosin cross-bridges in rabbit muscle fibres. Biophysical Journal. 1995;69:1011–1021. doi: 10.1016/S0006-3495(95)79976-3. [DOI] [PMC free article] [PubMed] [Google Scholar]
- Bershitsky SY, Tsaturyan AK. Comparison of tension transients induced by fast changes in length and temperature in rabbit muscle fibres. Journal of Muscle Research and Cell Motility. 1999;20:819–820. [Google Scholar]
- Bershitsky SY, Tsaturyan AK, Bershitskaya ON, Mashanov GI, Brown P, Burns R, Ferenczi MA. Muscle force is generated by myosin heads stereospecifically attached to actin. Nature. 1997;388:186–190. doi: 10.1038/40651. [DOI] [PubMed] [Google Scholar]
- Bordas J, Svensson A, Rothery M, Lowy J, Diakun GP, Boesecke P. Extensibility and symmetry of actin filaments in contracting muscles. Biophysical Journal. 1999;77:3197–3207. doi: 10.1016/S0006-3495(99)77150-X. [DOI] [PMC free article] [PubMed] [Google Scholar]
- Burmeister-Getz E, Cooke R, Selvin PR. Luminescence resonance energy transfer measurements in myosin. Biophysical Journal. 1998;74:2451–2458. doi: 10.1016/s0006-3495(98)77953-6. [DOI] [PMC free article] [PubMed] [Google Scholar]
- Burton K, Huxley AF. Identification of source of oscillations in apparent sarcomere length measured by laser diffraction. Biophysical Journal. 1995;68:2429–2443. doi: 10.1016/S0006-3495(95)80425-X. [DOI] [PMC free article] [PubMed] [Google Scholar]
- Davis JS, Harrington WF. Laser temperature-jump apparatus for the study of force chnges in fibers. Analytical Biochemistry. 1987a;161:543–549. doi: 10.1016/0003-2697(87)90487-8. [DOI] [PubMed] [Google Scholar]
- Davis JS, Harrington WF. Force generation by muscle fibers in rigor: a laser temperature-jump study. Proceedings of the National Academy of Sciences of the USA. 1987b;84:975–979. doi: 10.1073/pnas.84.4.975. [DOI] [PMC free article] [PubMed] [Google Scholar]
- Davis JS, Harrington WF. A single order-disorder transition generates tension during the Huxley-Simmons phase 2 in muscle. Biophysical Journal. 1993;65:1886–1898. doi: 10.1016/S0006-3495(93)81259-1. [DOI] [PMC free article] [PubMed] [Google Scholar]
- Davis JS, Rodgers ME. Indirect coupling of phosphate release to de novo tension generation during muscle contraction. Proceedings of the National Academy of Sciences of the USA. 1995a;92:10 482–10 486. doi: 10.1073/pnas.92.23.10482. [DOI] [PMC free article] [PubMed] [Google Scholar]
- Davis JS, Rodgers ME. Force generation and temperature-jump and length-jump tension transients in muscle fibers. Biophysical Journal. 1995b;68:2032–2040. doi: 10.1016/S0006-3495(95)80380-2. [DOI] [PMC free article] [PubMed] [Google Scholar]
- Ford LE, Huxley AF, Simmons RM. Tension responses to sudden length change in stimulated frog muscle fibres near slack length. Journal of Physiology. 1977;269:441–515. doi: 10.1113/jphysiol.1977.sp011911. [DOI] [PMC free article] [PubMed] [Google Scholar]
- Ford LE, Huxley AF, Simmons RM. The relation between stiffness and filament overlap in stimulated frog muscle fibres. Journal of Physiology. 1981;311:219–249. doi: 10.1113/jphysiol.1981.sp013582. [DOI] [PMC free article] [PubMed] [Google Scholar]
- Ford LE, Huxley AF, Simmons RM. Tension transients during steady shortening of frog muscle fibres. Journal of Physiology. 1985;361:131–150. doi: 10.1113/jphysiol.1985.sp015637. [DOI] [PMC free article] [PubMed] [Google Scholar]
- Godt RE, Maughan DW. Swelling of skinned muscle fibers of the frog. Experimental observations. Biophysical Journal. 1977;19:103–116. doi: 10.1016/S0006-3495(77)85573-2. [DOI] [PMC free article] [PubMed] [Google Scholar]
- Goldman YE, McCray JA, Ranatunga KW. Transient tension changes initiated by laser temperature jump in rabbit psoas muscle fibres. Journal of Physiology. 1987;392:71–95. doi: 10.1113/jphysiol.1987.sp016770. [DOI] [PMC free article] [PubMed] [Google Scholar]
- Goldman YE, Simmons RM. Control of sarcomere length in skinned muscle fibres of Rana temporaria during mechanical transients. Journal of Physiology. 1984;350:497–518. doi: 10.1113/jphysiol.1984.sp015215. [DOI] [PMC free article] [PubMed] [Google Scholar]
- Higuchi H, Yanagida T, Goldman YE. Compliance of thin filaments in skinned fibers of rabbit skeletal muscle. Biophysical Journal. 1995;69:1000–1010. doi: 10.1016/S0006-3495(95)79975-1. [DOI] [PMC free article] [PubMed] [Google Scholar]
- Holmes KC. The swinging lever-arm hypothesis of muscle contraction. Current Biology. 1997;7:R112–118. doi: 10.1016/s0960-9822(06)00051-0. [DOI] [PubMed] [Google Scholar]
- Houdusse A, Kalabokis VN, Himmel D, Szent-Gyorgyi AG, Cohen C. Atomic structure of scallop myosin subfragment S1 complexed with MgADP: a novel conformation of the myosin head. Cell. 1999;97:459–470. doi: 10.1016/s0092-8674(00)80756-4. [DOI] [PubMed] [Google Scholar]
- Houdusse A, Szent-Gyorgyi AG, Cohen C. Three conformational states of scallop myosin S1. Proceedings of the National Academy of Sciences of the USA. 2000;97:11 238–11 243. doi: 10.1073/pnas.200376897. [DOI] [PMC free article] [PubMed] [Google Scholar]
- Huxley AF. Muscle structure and theories of contraction. Progress in Biophysics and Biophysical Chemistry. 1957;7:255–318. [PubMed] [Google Scholar]
- Huxley AF. Reflections on Muscle. (The Sherrington Lecture XIV) Liverpool, UK: Liverpool University Press; 1980. [Google Scholar]
- Huxley AF. The mechanical properties of cross-bridges and their relation to muscle contraction. In: Varga E, Kover A, Kovacs T, Kovacs L, editors. Adv. Physiol. Sci., Molecular and Cellular Aspects of Muscle Function. Vol. 5. Budpest: 1981. pp. 1–12. [Google Scholar]
- Huxley AF. Mechanics and models of the myosin motor. Philosophical Transactions of the Royal Society B. 2000a;355:433–440. doi: 10.1098/rstb.2000.0584. [DOI] [PMC free article] [PubMed] [Google Scholar]
- Huxley AF. Cross-bridge action: present views, prospects, and unknowns. Journal of Biomechanics. 2000b;33:1189–1195. doi: 10.1016/s0021-9290(00)00060-9. [DOI] [PubMed] [Google Scholar]
- Huxley AF, Simmons RM. Proposed mechanism of force generation in striated muscle. Nature. 1971;233:533–538. doi: 10.1038/233533a0. [DOI] [PubMed] [Google Scholar]
- Huxley HE. The mechanism of muscular contraction. Science. 1969;164:1356–1365. doi: 10.1126/science.164.3886.1356. [DOI] [PubMed] [Google Scholar]
- Huxley HE. Past, present and future experiments on muscle. Philosophical Transactions of the Royal Society B. 2000;355:539–543. doi: 10.1098/rstb.2000.0595. [DOI] [PMC free article] [PubMed] [Google Scholar]
- Huxley HE, Simmons RM, Faruqi AR, Kress M, Bordas J, Koch MH. Changes in the X-ray reflections from contracting muscle during rapid mechanical transients and their structural implications. Journal of Molecular Biology. 1981;169:469–506. doi: 10.1016/s0022-2836(83)80062-x. [DOI] [PubMed] [Google Scholar]
- Huxley HE, Simmons RM, Faruqi AR, Kress M, Bordas J, Koch MH. Changes in the X-ray reflections from contracting muscle during rapid mechanical transients and their structural implications. Journal of Molecular Biology. 1983;169:469–506. doi: 10.1016/s0022-2836(83)80062-x. [DOI] [PubMed] [Google Scholar]
- Huxley HE, Stewart A, Sosa H, Irving T. X-ray diffraction measurements of the extensibility of actin and myosin filaments in contracting muscle. Biophysical Journal. 1994;67:2411–2421. doi: 10.1016/S0006-3495(94)80728-3. [DOI] [PMC free article] [PubMed] [Google Scholar]
- Irving M, Lombardi V, Piazzesi G, Ferenczi MA. Myosin head movements are synchronous with the elementary force-generating process in muscle. Nature. 1992;357:156–158. doi: 10.1038/357156a0. [DOI] [PubMed] [Google Scholar]
- Kawai M, Kawaguchi K, Saito M, Ishiwata S. Temperature change does not affect force between single actin filaments and HMM from rabbit muscles. Biophysical Journal. 2000;78:3112–3119. doi: 10.1016/S0006-3495(00)76848-2. [DOI] [PMC free article] [PubMed] [Google Scholar]
- Linari M, Aiazzi A, Dolfi M, Piazzesi G, Lombardi V. A system for studying tension transients in segments of skinned muscle fibres from rabbit psoas. Journal of Physiology. 1993;473:8P. [Google Scholar]
- Linari M, Dobbie I, Reconditi M, Koubassova N, Irving M, Piazzesi G, Lombardi V. The stiffness of skeletal muscle in isometric contraction and rigor: the fraction of myosin heads bound to actin. Biophysical Journal. 1998;74:2459–2473. doi: 10.1016/S0006-3495(98)77954-8. [DOI] [PMC free article] [PubMed] [Google Scholar]
- Lombardi V, Piazzesi G, Ferenczi MA, Thirlwell H, Dobbie I, Irving M. Elastic distortion of myosin heads and repriming of the working stroke in muscle. Nature. 1995;374:553–555. doi: 10.1038/374553a0. [DOI] [PubMed] [Google Scholar]
- Lombardi V, Piazzesi G, Linari M. Rapid regeneration of the actin-myosin power stroke in contracting muscle. Nature. 1992;355:638–641. doi: 10.1038/355638a0. [DOI] [PubMed] [Google Scholar]
- Molloy JE, Kendrick-Jones J, Veigel C, Tregear RT. An unexpectedly large working stroke from chymotryptic fragments of myosin II. FEBS Letters. 2000;480:293–297. doi: 10.1016/s0014-5793(00)01937-2. [DOI] [PubMed] [Google Scholar]
- Pate E, Wilson GJ, Bhimani M, Cooke R. Temperature dependence of the inhibitory effects of orthovanadate on shortening velocity in fast skeletal muscle. Biophysical Journal. 1994;66:1554–1562. doi: 10.1016/S0006-3495(94)80947-6. [DOI] [PMC free article] [PubMed] [Google Scholar]
- Provencher SW. A fourier method for the analysis of exponential decay curves. Biophysical Journal. 1976;16:27–50. doi: 10.1016/S0006-3495(76)85660-3. [DOI] [PMC free article] [PubMed] [Google Scholar]
- Ranatunga KW. Temperature sensitivity of isometric tension in glycerinated mammalian muscle fibres. In: Marechal G, Carraro U, editors. Muscle and Motility. Vol. 2. Andover, Hants, UK: Intercept Ltd; 1990. pp. 271–276. [Google Scholar]
- Ranatunga KW. Endothermic force generation in fast and slow mammalian (rabbit) muscle fibers. Biophysical Journal. 1996;71:1905–1913. doi: 10.1016/S0006-3495(96)79389-X. [DOI] [PMC free article] [PubMed] [Google Scholar]
- Ranatunga KW. Effects of inorganic phosphate on endothermic force generation in muscle. Proceedings of the Royal Society B. 1999;266:1381–1385. doi: 10.1098/rspb.1999.0791. [DOI] [PMC free article] [PubMed] [Google Scholar]
- Reedy MK, Holmes KC, Tregear RT. Induced changes in orientation of the cross-bridges of glycerinated insect flight muscle. Nature. 1965;207:1276–1280. doi: 10.1038/2071276a0. [DOI] [PubMed] [Google Scholar]
- Shih WM, Gryczynski Z, Lakowicz JR, Spudich JA. A FRET-based sensor reveals large ATP hydrolysis-induced conformational changes and three distinct states of the molecular motor myosin. Cell. 2000;102:683–694. doi: 10.1016/s0092-8674(00)00090-8. [DOI] [PubMed] [Google Scholar]
- Stephenson DG, Williams DA. Temperature-dependent calcium sensitivity changes in skinned muscle fibres of rat and toad. Journal of Physiology. 1985;360:1–12. doi: 10.1113/jphysiol.1985.sp015600. [DOI] [PMC free article] [PubMed] [Google Scholar]
- Suzuki Y, Yasunaga T, Ohkura R, Wakabayashi T, Sutoh K. Swing of the lever arm of a myosin motor at the isomerization and phosphate-release steps. Nature. 1998;396:380–383. doi: 10.1038/24640. [DOI] [PubMed] [Google Scholar]
- Taylor KA, Schmitz H, Reedy MC, Goldman YE, Franzini-Armstrong C, Sasaki H, Tregear RT, Poole K, Lucaveche C, Edwards RJ, Chen LF, Winkler H, Reedy MK. Tomographic 3D reconstruction of quick-frozen, Ca2+-activated contracting insect flight muscle. Cell. 1999;99:421–431. doi: 10.1016/s0092-8674(00)81528-7. [DOI] [PubMed] [Google Scholar]
- Tsaturyan AK, Bershitsky SY. Tension responses to the temperature jump on skinned Ca2+-activated muscle fibers of the frog after the stepwise length change. Biofizika (in Russian) 1988;33:570–572. (English translation: Biophysics 33, 612–615) [Google Scholar]
- Tsaturyan AK, Bershitsky SY, Burns R, Ferenczi MA. Structural changes in the actin-myosin cross-bridges associated with force generation induced by temperature jump in permeabilized frog muscle fibers. Biophysical Journal. 1999;77:354–372. doi: 10.1016/S0006-3495(99)76895-5. [DOI] [PMC free article] [PubMed] [Google Scholar]
- Veigel C, Coluccio LM, Jontes JD, Sparrow JC, Milligan RA, Molloy JE. The motor protein myosin-I produces its working stroke in two steps. Nature. 1999;398:530–533. doi: 10.1038/19104. [DOI] [PubMed] [Google Scholar]
- Wakabayashi K, Sugimoto Y, Tanaka H, Ueno Y, Takezawa Y, Amemiya Y. X-ray diffraction evidence for the extensibility of actin and myosin filaments during muscle contraction. Biophysical Journal. 1994;67:2422–2435. doi: 10.1016/S0006-3495(94)80729-5. [DOI] [PMC free article] [PubMed] [Google Scholar]
- Zhao Y, Kawai M. Kinetic and thermodynamic studies of the cross-bridge cycle in rabbit psoas muscle fibers. Biophysical Journal. 1994;67:1655–1668. doi: 10.1016/S0006-3495(94)80638-1. [DOI] [PMC free article] [PubMed] [Google Scholar]


