

Abstract
Regenerative potentials were initiated by depolarizing short segments of single bundles of circular muscle isolated from the gastric antrum of guinea-pigs. When changes in [Ca2+]i and membrane potential were recorded simultaneously, regenerative potentials were found to be associated with an increase in [Ca2+]i, with the increase starting after a minimum latency of about 1 s. Although the increase in [Ca2+]i was reduced by nifedipine, the amplitudes of the regenerative responses were little changed. Regenerative responses and associated changes in [Ca2+]i were abolished by loading the preparations with the Ca2+ chelator MAPTA-AM. Regenerative potentials were abolished by 2-aminoethoxydiphenyl borate (2APB), an inhibitor of IP3 induced Ca2+ release, by N-ethylamaleimide (NEM), an alkylating agent which blocks activation of G-proteins and were reduced in amplitude by two agents which block chloride (Cl−)-selective channels in many tissues. The observations suggest that membrane depolarization triggers IP3 formation. This causes Ca2+ release from intracellular stores which activates Ca2+-dependent Cl− channels.
Slow waves, recorded from many regions of the gastrointestinal tract, are initiated by interstitial cells of Cajal (ICC) (Sanders, 1996). In most regions of the gastrointestinal tract, ICC lying in the myenteric region (ICCMY) are thought to generate pacemaker activity. Thus tissues devoid of ICCMY fail to generate slow waves (Ward et al. 1994; Ward et al. 1997, 1999; Ordog et al. 1999). Intracellular recordings from ICCMY of the guinea-pig antrum show that they generate large amplitude, long lasting pacemaker potentials (Dickens et al. 1999; Hirst & Edwards, 2001). In the antrum, pacemaker potentials spread passively to the circular muscle layer where they trigger the secondary regenerative component of the slow wave (Dickens et al. 1999). The secondary component of the slow wave can be abolished by membrane hyperpolarization (Ohba et al. 1975) and by caffeine (Dickens et al. 1999). The secondary component is also initiated by ICC, being absent in the antrum of mutant mice whose tissues contain ICCMY but lack intramuscular ICC (ICCIM) (Dickens et al. 2001; Hirst et al. 2002). When single bundles of circular muscle, devoid of ICCMY but containing ICCIM, are isolated and stimulated directly, they generate regenerative potentials with the same properties as the secondary component of slow waves (Suzuki & Hirst, 1999). Regenerative potentials appear to result from Ca2+ release from intracellular stores; they persist after blocking Ca2+ entry but are abolished when the internal storage of Ca2+ is disrupted (Suzuki & Hirst, 1999). Moreover, the spectral analysis of regenerative potentials suggests that they result from the clustered occurrence of many unitary potentials rather than from the opening of voltage-dependent channels (Edwards et al. 1999). These electrophysiological observations suggest that depolarization, in some way, releases Ca2+ from intracellular stores present in ICCIM. Since slow waves are absent in antral tissues devoid of type-1 IP3 receptors (Suzuki et al. 2000) and are abolished by 2APB (Hirst & Edwards, 2001), an inhibitor of IP3-induced Ca2+ release (Maruyama et al. 1997), it seems likely that Ca2+ release from internal stores results from the formation, activated by membrane depolarization, of IP3. In many excitable cells, increases in the internal concentration of calcium ions, [Ca2+]i, activate either anion-selective channels or cation-selective channels (Pacaud & Bolton, 1991; Large & Wang, 1996).
The present experiments have tested directly the idea that an increase in [Ca2+]i underlies each regenerative potential and have attempted to identify the nature of the conductance change associated with the detected increase in [Ca2+]i. It has been found that regenerative potentials are reduced in amplitude by a number of agents which block Cl−-selective channels in other tissues.
METHODS
The procedures described were approved by the animal experimentation ethics committee at the University of Melbourne. Guinea-pigs of either sex were stunned, exsanguinated and the stomach removed. Single bundles of circular muscle were isolated as described previously (Suzuki & Hirst, 1999). Briefly, the antral region was isolated and immersed in oxygenated physiological saline (composition in mm: NaCl, 120; NaHCO3, 25; NaH2PO4, 1.0; KCl, 5; MgCl2, 2; CaCl2, 2.5; and glucose, 11.1; bubbled with 95 % O2-5 % CO2). After removing the mucosa, followed by the longitudinal muscle layer, single bundles of circular muscle (diameter 150 to 200 μm, length 300 to 600 μm) were dissected free and pinned in a recording chamber. Preparations were impaled with two independently mounted sharp electrodes (90–150 MΩ) filled with 0.5 m KCl. Membrane potential changes and membrane currents were amplified using an Axoclamp-2B amplifier (Axon Instruments, Foster City, CA, USA), low pass filtered (cut-off frequency, 100 Hz) digitized and stored on computer for later analysis. Spectral density curves and theoretical curves were calculated as described previously (Edwards et al. 1999). In some experiments, preparations were loaded with fura PE3 to determine the time course of changes in [Ca2+]i as described previously (Bramich & Hirst, 1999). Briefly, preparations were incubated in physiological saline with reduced Ca2+ (0.25 mm) containing fura PE3-AM (5 μm), for 30 min at room temperature. After warming to 30 °C for 10 min, preparations were superfused with physiological saline (30 °C) until recordings were started. Preparations were illuminated with alternating wavelengths (340 and 380 nm, frequency 12 Hz). Emitted photons, wavelength 510 nm, were counted during each cycle to estimate the concentrations of fura PE3-Ca2+ complex and free fura PE3. All changes in [Ca2+]i are given as the ratio of these values; no attempt has been made to relate the ratio values to absolute changes in [Ca2+]i. The time course of [Ca2+]i changes associated with regenerative potentials, initiated at their minimum latency, was determined by averaging five to 30 successive individual [Ca2+]i measurements. All data are expressed as means ± standard error of the means (s.e.m.), each n value represents a measurement from a separate animal. Paired Student's t tests were used to determine if data sets differed and a P of < 0.05 was taken to indicate a significant difference.
Acetoxymethyl ester of bis-(2-amino-5-phenoxy)ethane-N,N,N′,N′-tetraacetic acid (MAPTA-AM) and 2-aminoethoxydiphenyl borate (2APB; Calbiochem, San Diego, CA, USA), N-ethylmaleimide, 4,4′-diisothiocyano-2,2′-stilbene disulphonic acid, anthracene-9-carboxylic acid, niflumic acid, gadolinium chloride and nifedipine (Sigma Chemical Co., St Louis, MO, USA) were used in these experiments. In some experiments, the sodium chloride present in control solutions was exchanged for equimolar amounts of sodium isethionate or sodium iodide. Some preparations were loaded using fura PE3-AM (Calbiochem) and pluronic F-127 (Sigma).
RESULTS
Regenerative potentials and associated changes in [Ca2+]i recorded from single bundles of circular muscle from guinea-pig antrum
In isolated bundles of circular muscle, membrane depolarization, or the break of a period of hyperpolarization evoked regenerative potentials (Suzuki & Hirst, 1999). In the absence of such stimulation, regenerative potentials were initiated spontaneously at frequencies of some 0.1 to 2 waves per min (Suzuki & Hirst, 1999; van Helden et al. 2000). When loaded with fura PE3, bundles had membrane potentials in the range −55 to −65 mV (−59.9 ± 0.7 mV; n = 12, where each n value on this and every other case represents a measurement from a separate animal). Membrane depolarization, or the break of a hyperpolarizing pulse, initiated regenerative potentials with peak amplitudes in the range 10.6 to 36.8 mV (25.6 ± 2.1 mV; n = 12). Each regenerative potential was associated with an increase in [Ca2+]i in the range 0.06 to 0.83 F340/380 (0.18 ± 0.03 F340/380; n = 12). Regenerative potentials have been shown to be little changed in amplitude when L-type Ca2+ channels are blocked by nifedipine (Suzuki & Hirst, 1999). In the present experiments, nifedipine (1 μm) did not alter the amplitude of regenerative potentials, control amplitude 30.7 ± 4.3 mV and in nifedipine 29.7 ± 2.5 mV (n = 4). However, the amplitude of the associated increase in [Ca2+]i fell significantly in amplitude to 24 ± 6 % of the control value (Fig. 1A and B) with a rise in [Ca2+]i being detected with each regenerative potential (Fig. 1Bb). The observations suggest that during a regenerative potential, L-type Ca2+ channels are activated but they are not essential for the generation of regenerative potentials.
Figure 1. Effect of nifedipine and MAPTA-AM on regenerative potentials and associated changes in [Ca2+]i recorded from a bundle of antral circular muscle.

A–D, regenerative potentials (a) and associated changes in [Ca2+]i (b) triggered by passing depolarizing current pulses (c) through the second intracellular electrode. A, responses recorded in control solution and (B) after adding nifedipine (1 μm) to the physiological saline. Note that the associated change in [Ca2+]i was reduced in amplitude by nifedipine. C and D, regenerative responses recorded from another preparation in the presence of nifedipine (1 μm), before (C) and 10 min after (D) adding MAPTA-AM (20 μm) to the physiological saline. Note that the associated change in [Ca2+]i was reduced in amplitude and the regenerative response was reduced to a pair of unitary potentials. The time calibration bar applies to all traces. The voltage, calcium ratio and current calibration bars apply to each membrane potential, [Ca2+]i and current recording respectively.
Rises in [Ca2+]i and regenerative potentials, recorded in the presence of nifedipine (1 μm), were reduced in amplitude when [Ca2+]i was buffered to low levels by loading preparations with the Ca2+ chelator MAPTA-AM (20 μm) for 10 min (Fig. 1). The peak amplitudes of regenerative potentials fell from 28.3 ± 4.4 mV to 7.8 ± 3.6 mV and the amplitudes of the associated increases in [Ca2+]i fell from 0.18 ± 0.05 F340/380 to 0.02 ± 0.01 F340/380 (n = 4). In both cases, the values differed significantly before and after the addition of MAPTA-AM.
When threshold currents, which produced depolarizations of some 5 to 7 mV, were applied, some failed to trigger a regenerative response. When a response was initiated, each regenerative potential was associate with an increase in [Ca2+]i and both started with a variable delay after the onset of applied depolarization (Fig. 2A). Increasing the amplitude of the depolarizing current caused regenerative potentials and increases in [Ca2+]i to be triggered by every stimulus. Both had constant amplitudes and occurred after a variable latency (Fig. 2B). Further increases shortened the latency towards a constant value of about 1 s without changing the amplitudes of individual responses (Suzuki & Hirst, 1999). The results from one experiment are illustrated graphically in Fig. 2C where the mean latency of each increase in [Ca2+]i, derived from 10 successive responses, are given. As the depolarization was increased, the latency before the increase in [Ca2+]i shortened towards a minimum of about 1 s.
Figure 2. Effect of stimulus strength on latency of regenerative potentials and changes in [Ca2+]i evoked in a single bundle of antral circular muscle.

A, B and D, regenerative potentials (a) and the associated changes in [Ca2+]i (b) triggered by passing depolarizing current pulses (c) through the second intracellular electrode. A, successive responses triggered by a threshold depolarizing current pulse. B, regenerative potentials triggered by a depolarizing current pulse of increased intensity. C, the relationship between current strength and mean latency of the increases in [Ca2+]i. Each ▪ denotes the mean of latency of onset of [Ca2+]i, the error bars represent ± 1 s.e.m (n = 10). Note that the latency shortens with increased strength and approaches a minimum value of about 1.1 s. The resting membrane potential was −61 mV. D, a regenerative potential of minimum latency with the time course of the associated change in [Ca2+]i obtained by averaging 30 successive responses. Note that the onset of the increase in [Ca2+]i lags behind the onset of applied depolarization by some 900 ms but corresponds with the start of the regenerative response. The resting membrane potential was −60 mV. The left hand voltage, calcium ratio, current and time calibration bars apply to the membrane potential, [Ca2+]i and current traces shown in A and B. The right hand calibration bars apply to traces shown in D.
The increase in [Ca2+]i associated with each regenerative potential did not appear to be preceded by a gradual rise in [Ca2+]i associated with the conditioning depolarization used to evoke the response (Fig. 2). To test whether small increases in [Ca2+]i occurred during the latent period, several successive Ca2+ responses, evoked at their minimum latency, were averaged. In the experiment shown in Fig. 2D, the time course of the increase in [Ca2+]i was determined from an average of 30 successive measurements. The increase in [Ca2+]i had a peak amplitude of 0.26 F340/380 and the response started 0.9 s after the onset of membrane depolarization (Fig. 2D). In a further six experiments, an increase in [Ca2+]i during the latent period was not detected. From this experimental series, the mean minimum latency, taken as the time from the start of depolarizing current to 10 % of the peak Ca2+ response, was 1.12 ± 0.09 s (n = 7). The latencies of the associated regenerative responses shortened in a similar way to a mean minimal latency of 1.06 ± 0.06 s; the two values were not significantly different. When initiated at minimum latency the increase in [Ca2+]i had a mean rise time (time from 10 % to 90 % peak amplitude) of 1.22 ± 0.24 s and a mean half width (time the increase in [Ca2+]i had an amplitude greater than 50 % peak response) of 2.22 ± 0.48 s (n = 7). In the four experiments where nifedipine was added to the physiological saline, the latency before the increase in [Ca2+]i was unchanged, indicating that entry of Ca2+ via L-type Ca2+ channels did not contribute to the initiation of responses.
Effect of 2APB and NEM on regenerative potentials recorded from single bundles of circular muscle from guinea-pig antrum
The previous experiments show that depolarization triggers an increase in [Ca2+]i about 1 s after the onset of the depolarization. An explanation for such a delay is that depolarization causes the production of a second messenger, perhaps IP3, which in turn releases Ca2+ from internal stores (Suzuki & Hirst, 1999; Edwards et al. 1999; van Helden et al. 2000; Suzuki et al. 2000). To examine this idea, the effects of 2APB, which blocks IP3-induced Ca2+ release (Maruyama et al. 1997), and NEM, which has been shown in some tissues to block the activation of G-proteins (Nakajima et al. 1990; Shapiro et al. 1994), were examined. Bundles of circular muscle had membrane potentials in the range −58 to −65 mV (−61.9 ± 0.7 mV; n = 13). In this group of experiments, regenerative potentials, recorded in the presence of nifedipine (1 μm), had amplitudes in the range 16 to 28 mV (23.2 ± 1.4 mV; n = 13). Regenerative potentials were reduced in amplitude by adding 2APB to the physiological saline (Fig. 3A and B). In five experiments, when 2APB (20 μm), was applied, the peak amplitude of regenerative potentials was reduced from 24.4 ± 2.0 mV to 6.2 ± 2.7 mV; in four experiments when 2APB (40 μm) was applied, the peak amplitude was reduced from 27.7 ± 20.7 mV to 1.2 ± 0.8 mV. 2APB transiently stimulated the preparations, causing the spontaneous discharge of regenerative potentials that lasted for 2 to 4 min, perhaps suggesting that 2APB acts as a partial agonist at IP3 receptors. The inhibitory effect of 2APB was reversed by washing with drug-free solution for 20 to 50 min. 2APB also abolished the discharge of membrane noise. In the experiment shown in Fig. 4, regenerative potentials had been previously abolished by NEM. The subsequent addition of 2APB abolished the discharge of membrane noise and the spectral density curves resembled those obtained when the electrode was outside the cell (Edwards et al. 1999). Similar observations were made on four preparations not treated with NEM, where 2APB reduced the amplitude of the regenerative response to less than 5 % of its control value. In each of these, the power spectral density curves calculated from membrane potential recordings obtained in 2APB lacked power at lower frequencies other than that attributable to the recording characteristics of the microelectrodes.
Figure 3. Effect of 2APB and NEM on regenerative potentials evoked in single bundles of circular muscle.
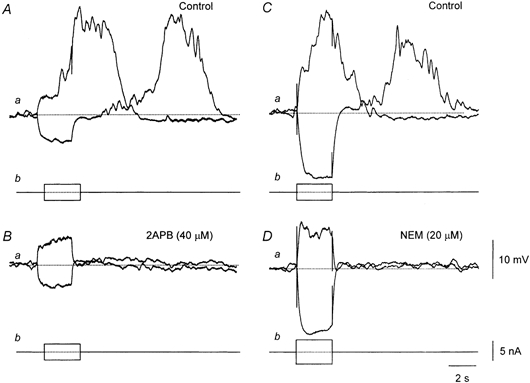
A and B, regenerative potentials initiated in control solution before (A) and 15 min after (B) adding 2APB (40 μm) to the physiological saline. The resting membrane potential was −62 mV. C and D, regenerative potentials initiated in control solution before (C) and 15 min after (D) adding NEM (20 μm) to the physiological saline. The resting membrane potential was −59 mV. The time, voltage and current calibration bars apply to all sets of traces.
Figure 4. Effect of 2APB and NEM on discharge of membrane noise recorded from a single bundle of circular muscle.

A–C, samples of membrane noise recorded in control solution (A), 5 min after the addition of NEM (20 μm; B) and 15 min after the further addition of 2APB (20 μm; C). D–F, the three power spectral density curves constructed from the membrane potential recordings. The resting membrane potential was −60 mV throughout. D was derived from the membrane potential recordings shown in A and fitted with a theoretical curve derived as described previously (Edwards et al. 1999). The two time constants required to derive the curve had values of 470 and 85 ms. An identical theoretical curve is plotted over the power spectral density curve in E, derived from membrane potential noise shown in B. The spectral density curve in F was derived from traces shown in C; it can be seen that 2APB abolished the power components seen at low frequencies. The time and voltage calibration bars apply to all traces.
Addition of NEM (20 μm) gradually reduced the amplitudes of regenerative potentials until after some 12 to 16 min they were barely detectable (Fig. 3D); control amplitude 21.0 ± 2.6 mV, amplitude in NEM 1.6 ± 0.9 mV (n = 4). Washing the preparations with drug-free saline for up to 1 h did not reverse the effect of NEM. Although NEM abolished regenerative potentials it did not appear to alter the discharge of membrane noise. This point was tested in three preparations by constructing spectral density curves of membrane noise recorded before (Fig. 3C) and after NEM had abolished evoked regenerative potentials (Fig. 3D). In each it was found that the power spectral density curves were not changed (Fig. 4A and B).
Estimation of reversal potential of regenerative potentials recorded from isolated bundles of circular muscle from guinea-pig antrum
In these experiments, the amplitudes of regenerative potentials were determined after setting the membrane potential at a range of hyperpolarized values. The amplitudes increased when initiated at more negative membrane potentials (Fig. 5A). The relationship between amplitude of regenerative potentials and the membrane potential at which they were initiated, over the range that could be examined, was found to be linear (Fig. 5C). The reversal potentials obtained by extrapolation lay in the range −18 to −24 mV (−21.4 ± 1.0 mV; n = 6). In addition, it was noted that the threshold for initiation of regenerative potentials varied with membrane potential. At the normal resting potential, −60 mV, the threshold for initiation of a regenerative potential was some 5 to 7 mV positive of the resting potential, i.e. about −54 mV (Fig. 1). When the membrane potential was held at −90 mV, the threshold was −75 mV (Fig. 5A). When held at −75 mV, the threshold was −67 mV (Fig. 5B). These observations indicate that the threshold for initiation of a regenerative potential is not fixed but is changed when the membrane potential is changed. The relationship between holding potential and threshold could be described by a single exponential function (Fig. 5D). The voltage constant, i.e. the change in voltage required for an e-fold change in threshold, for the data shown in Fig. 5 was 29 mV. Similar observations were made on five other preparations, the voltage constants lay in the range 19 to 54 mV (34.1 ± 5.3 mV; n = 6).
Figure 5. Estimation of reversal potential of regenerative potentials recorded from a bundle of circular smooth muscle.

A and B, the effect of altering the membrane potential on the amplitude of regenerative potentials initiated. Note that their amplitudes are increased when initiated at more negative membrane potentials and that the threshold for initiation is moved to more negative values by a preceding period of hyperpolarization. The relationship between amplitude of the regenerative potential and membrane potential is shown in C. The relationship between threshold of the regenerative potential and membrane potential is shown in D.
Nature of the conductance change underlying regenerative potentials recorded from the circular layer of guinea-pig antrum
The previous experiments suggest that the reversal potential of regenerative potentials is about −20 mV (Fig. 5); this potential is close to the equilibrium potential for Cl− in many smooth muscle preparations (Aickin & Brading, 1982; Large & Wang, 1996). To examine the possibility that regenerative potentials resulted from in increase in chloride conductance, gCl, the effects of the chloride channel blockers, 4,4′-diisothiocyano-2,2′-stilbene disulphonic acid (DIDS), anthracene-9-carboxylic acid (9-AC) and niflumic acid (NFA) (Large & Wang, 1996) on regenerative potentials were examined.
Adding DIDS (100 μm) to the physiological saline reduced the amplitude of regenerative potentials within 3 min (Fig. 6A and B). In control solution, regenerative potentials had peak amplitudes of 21.9 ± 1.4 mV; in the presence of DIDS (100 μm) regenerative potentials had peak amplitudes of 1.8 ± 0.5 mV (n = 6). In two experiments when the concentration of DIDS was subsequently raised to 500 μm, no responses could be detected. As well as reducing the amplitude of the regenerative responses, DIDS (100 μm) reduced the discharge of membrane noise (Fig. 6D and E). This was reflected as a fall in the power spectral density of the membrane noise but was not associated with a change in the profile of the spectral density curves (Fig. 6F). In three experiments where power spectral density curves were calculated in control and after adding DIDS (100 μm) to the physiological saline, the power spectral density fell to 12 ± 6 % of control value. When the concentration of DIDS was increased to 500 μm, the power spectral density curves resembled those determined from an electrode placed in the extracellular fluid. No attempt was made to wash out the higher concentrations of DIDS but in each of the three experiments where only the lower concentration of DIDS was applied, the effects were readily reversed by applying drug-free solutions.
Figure 6. Effect of DIDS on regenerative potentials and discharge of membrane noise recorded from a single bundle of circular muscle.

A, regenerative potentials initiated in control solution. The membrane potential changes produced by the same currents (C) 3 min after adding DIDS (100 μm) to the physiological saline are shown in B. The resting potential in control solution (A) was −63 mV and after adding DIDS (C) was −65 mV. D and E, samples of the membrane noise recorded in control solution (D) and 3 min after the addition of DIDS (E). These were used to calculate the power spectral density curves shown in F. The theoretical curves, derived to fit the spectral density curves, each used time constants of 425 and 75 ms. The power function had to be reduced from 2 in control to 0.25 in DIDS to obtain an adequate fit.
9-AC (1 mm) also reduced the amplitude of regenerative potentials within 3 min (Fig. 7A and B). In control solution the regenerative potentials had peak amplitudes of 20.3 ± 1.9 mV; in the presence of 9-AC (1 mm) the regenerative responses had peak amplitudes of 2.0 ± 0.9 mV (n = 6). 9-AC (1 mm), also reduced the discharge of membrane noise (Fig. 7D and E). Again this was reflected in a 90 % fall in the power spectral density of the membrane noise but no apparent change in the profile of the spectral density curves (Fig. 7F). In four experiments where power spectral density curves were calculated after adding 9-AC (1 mm) to the physiological saline, the power spectral density fell to 39 ± 20 % of control value.
Figure 7. Effect of 9-AC on regenerative potentials and discharge of membrane noise recorded from a single bundle of circular muscle.

A, regenerative potentials initiated in control solution, resting membrane potential −61 mV. The membrane potential changes produced by the same currents (C) 3 min after adding 9-AC (1 mm) to the physiological saline are shown in B; resting membrane potential −65 mV. D and E, samples of the membrane noise recorded in control solution (D) and 3 min after the addition of 9-AC (E). These were used to calculate the power spectral density curves shown in F. The theoretical curves, derived to fit the spectral density curves, each used time constants of 485 and 55 ms. The power function had to be reduced from 6 in control to 0.6 in 9-AC to obtain an adequate fit.
When 9-AC was washed out of the recording chamber, the discharge of membrane noise first returned to control values and then became further increased in magnitude for some 5 to 15 min before returning back to control values. This was often reflected in the spontaneous discharge of regenerative potentials (Fig. 8). In the experiment shown in Fig. 8, regenerative potentials occurred irregularly in control solution at some 1 to 2 waves per min (Suzuki & Hirst, 1999; van Helden et al. 2000). After 9-AC had been washed out, regenerative potentials occurred spontaneously at some 6 to 7 waves per min for 15 min and thereafter gradually returned to their control rate of occurrence. In control solutions, regenerative potentials occurred spontaneously at 0.7 ± 0.3 waves per min; 5 min after washing out 9-AC they occurred at 2.8 ± 1.2 waves per min (n = 4) before returning to their control rate of occurrence.
Figure 8. Effect of 9-AC on spontaneous discharge of regenerative potentials recorded from a single bundle of circular muscle.

The three panels in the figure show the effects of applying and washing out 9-AC (1 mm) on the spontaneous discharge of regenerative potentials. A, 9-AC abolished the spontaneous discharge of regenerative potentials and reduced the discharge of membrane noise. During the break in the trace, the responses to electrical stimulation shown in Fig. 7 were measured. After washing out 9-AC, regenerative potentials were generated at some 4 waves per min (B) and then gradually returned to their control value of about 1 wave per min (C). The peak negative potential detected in 9-AC was −62 mV. The time and calibration bars apply to all traces.
NFA (100 μm) induced a persistent discharge of regenerative potentials in each of the five preparations examined (Fig. 9). At the start of the application of NFA, regenerative potentials had amplitudes greater than either those evoked by membrane depolarization or those that were detected spontaneously in the absence of stimulation. Over the next 2 to 3 min the amplitudes of the regenerative potentials fell back to, or below, control values. When NFA was washed out, the amplitudes of the regenerative potentials were again potentiated (Fig. 9). Regenerative potentials, evoked by NFA, had longer durations than those recorded in control solutions. In this group of experiments, regenerative potentials, initiated in control solutions, had amplitudes of 23.0 ± 2.1 mV and half-widths of 2.98 ± 0.29 s (n = 5). After being exposed to NFA (100 μm) for 1 min, spontaneous regenerative potentials had amplitudes of 24.5 ± 1.7 mV and half-widths of 3.90 ± 0.49 s. Some 5 min after applying NFA, spontaneous regenerative potentials had amplitudes of 16.9 ± 1.4 mV and half-widths of 4.98 ± 0.41 s. In control solution, regenerative potentials occurred spontaneously at 1.5 ± 0.4 waves per min; in the presence of NFA, they occurred at 3.6 ± 0.2 waves per min, (n = 4).
Figure 9. Effect of NFA on spontaneous discharge of regenerative potentials recorded from a single bundle of circular muscle.

The three panels in the figure show the effects of applying and washing out NFA (100 μm) on the spontaneous discharge of regenerative potentials. A, NFA increased the rate of discharge of regenerative potentials and transiently increased their amplitudes. After washing out NFA, regenerative potentials were again increased in amplitude (B) and then slowly returned to their control amplitude and rate of occurrence (C). The peak negative potential in control solution was −60 mV. The time and calibration bars apply to all traces.
To examine further a possible role of increased gCl, in the generation of regenerative potentials, the effects of substituting an impermeant anion (isethionate) and a more permeant anion (iodide) on the generation of regenerative potentials was examined. In three experiments where sodium chloride in the external solution was replaced with sodium isethionate, regenerative potentials were slowly reduced in amplitude until, after 15 min, a response could barely be detected (Fig. 10A and B). In these experiments, control regenerative potentials had a mean amplitude of 25.2 ± 2.4 mV; after 15 min exposure to isethionate solution they had an amplitude of 1.5 ± 0.3 mV. Replacing the external solution with control solution for up to 30 min failed to restore the responses. In three experiments where sodium chloride in the external solution was replaced with sodium iodide, regenerative potentials were rapidly reduced in amplitude so that after 2 min in test solution the amplitude of the responses had been reduced from 23.2 ± 6.0 mV to 2.7 ± 1.8 mV (Fig. 10C and D).
Figure 10. Effect of anion substitutions on regenerative potentials recorded from a single bundle of circular muscle.

A and B, regenerative potentials initiated in control solution before (A) and 15 min after (B) substituting sodium isethionate for sodium chloride in the physiological saline. The resting membrane potential was −64 mV and −65 mV, respectively. C and D, regenerative potentials initiated in control solution before (C) and 2 min after (D) substituting sodium iodide for sodium chloride in the physiological saline. The resting membrane potential was −64 mV in both traces. The time, voltage and current calibration bars apply to each set of traces.
A possible contribution of cation selective channels to regenerative potentials was examined by adding gadolinium ions (10 μm) to the physiological saline. In four experiments, gadolinium had no detectable effect on the amplitudes of evoked regenerative potentials. In two further preparations, power spectral density curves constructed from membrane noise recordings made in the presence of gadolinium ions (10 μm) were found to be the same as those determined from recordings made in control solutions.
DISCUSSION
The observations have shown that regenerative potentials are associated with a persistent increase in [Ca2+]i. The increase in [Ca2+]i appears to result from Ca2+ release from IP3-dependent stores, with the increase in [Ca2+]i-activating Ca2+-dependent Cl− channels.
Depolarization triggered regenerative responses that were associated with an increase in [Ca2+]i, with the same duration as the regenerative response (Fig. 1 and Fig. 2). Part of the increase in [Ca2+]i was abolished by nifedipine, indicating that Ca2+ entry occurred during the regenerative potential (Fig. 1). However, when Ca2+ entry was blocked, the amplitudes of regenerative potentials were little changed (Fig. 1B). Similar qualitative observations have been made on slow waves recorded from the dog stomach when the effects of blocking L-type Ca2+ channels were examined (Ozaki et al. 1991). The residual increase in [Ca2+]i and the regenerative potential were abolished by buffering [Ca2+]i to low levels (Fig. 1D), indicating that regenerative responses are triggered by an increase in [Ca2+]i. As the method used for determining changes in [Ca2+]i measured the total changes in [Ca2+]i throughout the muscle bundle, it cannot be used to assign changes to individual cells. However, since ICCIM are responsible for the generation of regenerative responses (Dickens et al. 2001; Hirst et al. 2002) at least a part of the nifedipine-resistant increase in [Ca2+]i must be occurring in those cells.
The increase in [Ca2+]i occurred after the onset of applied depolarization and was not preceded by a gradual rise in [Ca2+]i (Fig. 2) even before L-type Ca2+ channels had been blocked with nifedipine. Thus regenerative potentials are unlikely to be triggered by a gradual accumulation of Ca2+ inside the cells. It could be argued that the method of determining changes in [Ca2+]i had insufficient resolution to detect localized changes in [Ca2+]i occurring in discrete compartments within the preparations. If localized changes did occur they must be small as they were not detected even after averaging many successive responses. Moreover, they would have to involve voltage-gated release of Ca2+ from an internal source or voltage activation of a nifedipine-insensitive, voltage-gated Ca2+ channel. On the other hand, the increases in [Ca2+]i resemble those triggered by excitatory nerve stimulation in the guinea-pig ileum or the rat anococcygeus muscle (Cousins et al. 1993; Bramich & Hirst, 1999). In these muscles, the two different transmitters, acetylcholine and noradrenaline, activate second messenger pathways which cause Ca2+ release from intracellular stores. In both of these muscles, the long latent periods before the onset of Ca2+ responses, like those detected here, were not associated with a detectable, gradual rise in [Ca2+]i (Cousins et al. 1993; Bramich & Hirst, 1999).
2APB abolished both regenerative potentials and the discharge of membrane noise. This compound has been shown to inhibit IP3-evoked release of Ca2+ from intracellular stores (Maruyama et al. 1997) and also to affect the release of Ca2+ from IP3-insensitive intracellular stores (Prakriya & Lewis, 2001). However, as slow waves are also absent in mutant mice which lack IP3 receptors (Suzuki et al. 2000), the present observations are consistent with the idea that part of the dependency of slow waves on IP3 receptors results from their contribution to the secondary regenerative component of slow waves. With the qualification that 2APB might lack selectivity, the finding that it abolishes the discharge of membrane noise suggests that IP3 formation might occur in the absence of stimulation and that membrane depolarization transiently increases its rate of formation, presumably in ICCIM (Dickens et al. 2001).
Regenerative potentials were abolished by NEM (Fig. 3) but the discharge of membrane noise was unchanged (Fig. 4). Regenerative potentials and membrane noise have each been shown to be made up of the discharge of unitary potentials with membrane depolarization transiently increasing the frequency of discharge of unitary potentials (Edwards et al. 1999). Thus NEM differentially blocked the induced increase in frequency of unitary potentials but did not block the pathway leading to their spontaneous occurrence. In a number of tissues, NEM has been shown to alkylate several G-proteins, so preventing their activation (Nakajima et al. 1990; Shapiro et al. 1994). The simplest explanation for our findings is that membrane depolarization activates a G-protein and this is blocked by NEM. Although voltage activation of G-proteins has not been demonstrated in any cell, the rate of IP3 formation has been shown to be increased in other cells by membrane depolarization (Itoh et al. 1992; Ganitkevich & Isenberg, 1993; see also Mason & Mahaut-Smith, 2001). In each case, the G-protein-linked pathway which led to IP3 formation was first activated by an agonist before voltage sensitivity was detected. In these tissues, the G-protein might sense membrane potential changes as well as being the interface for the agonist-receptor interaction. What ever the case, the voltage-gating process involved in the initiation of regenerative potentials was selectively blocked by NEM, indicating that some voltage sensing site can be inhibited by alkylation. A further difference between the gating process detected in these experiments and those on membrane channels was that the threshold for activation was voltage sensitive, being set at more negative values when the membrane was held at more negative values (Fig. 5). Clearly, further studies are required before a full explanation of the process leading to voltage-activated IP3 production is forthcoming.
Regenerative potentials had a reversal potential, obtained by extrapolation, of −20 mV (Fig. 5). The simplest explanation is that the channels activated are selective to chloride ions which have a reversal potential of about −20 mV (Aicken & Brading, 1982; Large & Wang, 1996). Alternatively, the channels might show rectification at membrane potentials more positive than those examined in this series of experiments and be selective to cations. This seems unlikely as gadolinium ions, which block cation-selective channels (Koh et al. 1998), neither blocked regenerative potentials nor affected the discharge of membrane noise. Both DIDS and 9-AC abolished regenerative potentials and at the same time reduced the power spectral density curves in a way that might be expected if they were blocking channel openings (Fig. 6 and Fig. 8). These observations suggest that regenerative potentials result from the opening of anion-selective channels. On the other hand NFA evoked a discharge of regenerative potentials. This finding, and that washing out 9-AC also evoked regenerative potentials, might suggest that anion-selective channels were not involved (Fig. 8 and Fig. 9). However, it has recently been shown that a number of anion channel blockers, including NFA, may act as agonists at negative membrane potentials, especially when cells had a high internal [Ca2+]i (Piper et al. 2002). In our experiments, we could only measure the behaviour of regenerative potentials and the discharge of membrane noise at negative potentials (Piper et al. 2002). Whether ICCIM, which generate the secondary component of slow waves and the discharge of membrane noise (Dickens et al. 2001; Hirst et al. 2002), have a high internal [Ca2+]i is not known. Support for the idea that Cl− channels are involved in the generation of regenerative potentials came from the experiments in which Cl− were substituted with an impermeant or a more permeant anion. Substituting with an impermeant anion, isethionate, slowly abolished the regenerative potential (Fig. 10A and B). A similar pattern of inhibition has been demonstrated in responses of the rat anococcygeus muscle to noradrenaline when external Cl− ions are replaced with an impermeant anion (Large, 1984). There, a reduction in the external concentration of Cl− leads to a depletion of [Cl−]i and an abolition of responses. In the present study, the amplitudes of regenerative responses were also reduced when external Cl− ions were replaced with a more permeant anion (Fig. 10C and D). Such changes in ionic composition have been shown to cause a negative movement of the reversal potential for anions in venous smooth muscle cells (Greenwood & Large, 1999). In the present experiments such a change in reversal potential, from −20 mV (Fig. 5), would be expected to reduce the amplitude of regenerative potentials.
It should be pointed out that each of the pharmacological agents or changes in ionic composition, used in the attempt to identify the nature of the conductance change underlying regenerative potentials, could have reduced the amplitudes of the regenerative potentials by some mechanism unrelated to anion-selective channels in the cell membrane. For example they could have interfered with the functioning of anion channels linked with the release of Ca2+ from internal stores or they could have interfered with the opening of ion channels which were selective for cations. The former possibility seems unlikely to apply for all of the experimental protocols, certainly when anion channels are activated by Ca2+ released from internal stores in the anococcygeus muscle. Abolishing the membrane potential change associated with the opening of these channels by isethionate substitution slightly reduced, but did not abolish, the concurrent Ca2+ transients (N. J. Bramich & G. D. S. Hirst, unpublished observations). The latter possibility will be clarified when it becomes possible to record from isolated ICCIM and more rigorously determine the ionic selectivity of channels in their membranes.
The suggestion that membrane potential changes produced by ICCIM result from an increase in Cl− conductance, which is linked to release of Ca2+ from an IP3-dependent store, is supported by parallel observations made on ICC-like cells in the urethra. In urethral ICC-like cells, Ca2+ activates an anion-selective conductance (Sergeant et al. 2001b). When spontaneous inward currents are detected, they are inhibited by 2APB (Sergeant et al. 2001a) and abolished by 9-AC (Sergeant et al. 2001c).
Acknowledgments
This project was supported by a grant from the Australian NH and MRC and a collaborative research grant from the Japanese government.
REFERENCES
- Aickin CC, Brading AF. Measurement of intracellular chloride in guinea-pig vas deferens by ion analysis, 36Cl efflux and microelectrodes. Journal of Physiology. 1982;326:139–154. doi: 10.1113/jphysiol.1982.sp014182. [DOI] [PMC free article] [PubMed] [Google Scholar]
- Bramich NJ, Hirst GDS. Sympathetic neuroeffector transmission in the rat anococcygeus muscle. Journal of Physiology. 1999;516:101–115. doi: 10.1111/j.1469-7793.1999.101aa.x. [DOI] [PMC free article] [PubMed] [Google Scholar]
- Cousins HM, Edwards FR, Hirst GDS, Wendt IR. Cholinergic neuromuscular transmission in the longitudinal muscle of the guinea-pig ileum. Journal of Physiology. 1993;471:61–86. doi: 10.1113/jphysiol.1993.sp019891. [DOI] [PMC free article] [PubMed] [Google Scholar]
- Dickens EJ, Edwards FR, Hirst GDS. Selective knockout of intramuscular interstitial cells reveals their role in the generation of slow waves in mouse stomach. Journal of Physiology. 2001;531:827–833. doi: 10.1111/j.1469-7793.2001.0827h.x. [DOI] [PMC free article] [PubMed] [Google Scholar]
- Dickens EJ, Hirst GDS, Tomita T. Identification of rhythmically active cells in guinea-pig stomach. Journal of Physiology. 1999;514:515–531. doi: 10.1111/j.1469-7793.1999.515ae.x. [DOI] [PMC free article] [PubMed] [Google Scholar]
- Edwards FR, Hirst GDS, Suzuki H. Unitary nature of regenerative potentials recorded from circular smooth muscle of guinea-pig antrum. Journal of Physiology. 1999;519:235–250. doi: 10.1111/j.1469-7793.1999.0235o.x. [DOI] [PMC free article] [PubMed] [Google Scholar]
- Ganitkevich VYA, Isenberg G. Membrane potential modulates inositol 1, 4, 5-trisphophate-mediated Ca2+ transients in guinea-pig coronary myocytes. Journal of Physiology. 1993;470:35–44. doi: 10.1113/jphysiol.1993.sp019845. [DOI] [PMC free article] [PubMed] [Google Scholar]
- Greenwood IA, Large WA. Modulation of the decay of Ca2+-activated Cl− currents in rabbit portal vein smooth muscle cells by external anions. Journal of Physiology. 1999;516:365–376. doi: 10.1111/j.1469-7793.1999.0365v.x. [DOI] [PMC free article] [PubMed] [Google Scholar]
- Hirst GDS, Beckett EAH, Sanders KM, Ward SM. Regional variation in contribution of myenteric and intramuscular interstitial cells of Cajal to generation of slow waves in mouse gastric antrum. Journal of Physiology. 2002;540:1003–1012. doi: 10.1113/jphysiol.2001.013672. [DOI] [PMC free article] [PubMed] [Google Scholar]
- Hirst GDS, Edwards FR. Generation of slow waves in the antral region of guinea-pig stomach-a stochastic process. Journal of Physiology. 2001;535:165–180. doi: 10.1111/j.1469-7793.2001.00165.x. [DOI] [PMC free article] [PubMed] [Google Scholar]
- Itoh M, Seki N, Suzuki H, Ito S, Kajikura J, Kuriyama H. Membrane hyperpolarization inhibits agonist-induced synthesis of inositol 1, 4, 5-trisphosphate in rabbit mesenteric artery. Journal of Physiology. 1992;451:307–328. doi: 10.1113/jphysiol.1992.sp019166. [DOI] [PMC free article] [PubMed] [Google Scholar]
- Koh SD, Sanders KM, Ward SM. Spontaneous electrical rhythmicity in cultured interstitial cells of Cajal from the murine small intestine. Journal of Physiology. 1998;513:203–213. doi: 10.1111/j.1469-7793.1998.203by.x. [DOI] [PMC free article] [PubMed] [Google Scholar]
- Large WA. The effect of chloride removal on the responses of the isolated rat anococcygeus muscle to α1-adrenoceptor stimulation. Journal of Physiology. 1984;352:17–29. doi: 10.1113/jphysiol.1984.sp015275. [DOI] [PMC free article] [PubMed] [Google Scholar]
- Large WA, Wang Q. Charactersitics and physiological role of the Ca2+-activated Cl− conductance in smooth muscle. American Journal of Physiology. 1996;271:C435–454. doi: 10.1152/ajpcell.1996.271.2.C435. [DOI] [PubMed] [Google Scholar]
- Maruyama T, Kanaji T, Nakade S, Kanno T, Mikoshiba K. 2APB, 2-aminoethoxydiphenyl borate, a membrane-penetrable modulator of Ins(1, 4, 5)P3-induced Ca2+ release. Journal of Biochemistry. 1997;122:498–505. doi: 10.1093/oxfordjournals.jbchem.a021780. [DOI] [PubMed] [Google Scholar]
- Mason MJ, Mahaut-smith MP. Voltage-dependent Ca2+ release in rat megakaryocytes requires functional IP3 receptors. Journal of Physiology. 2001;533:175–183. doi: 10.1111/j.1469-7793.2001.0175b.x. [DOI] [PMC free article] [PubMed] [Google Scholar]
- Nakajima T, Irisawa H, Giles W. N-Ethylmaleimide uncouples muscarinic receptors from acetyl-choline sensitive channels in bullfrog atrium. Journal of General Physiology. 1990;96:887–903. doi: 10.1085/jgp.96.4.887. [DOI] [PMC free article] [PubMed] [Google Scholar]
- Ohba M, Sakamoto Y, Tomita T. The slow wave in the circular muscle of the guinea-pig stomach. Journal of Physiology. 1975;253:505–516. doi: 10.1113/jphysiol.1975.sp011203. [DOI] [PMC free article] [PubMed] [Google Scholar]
- Ordog T, Ward SM, Sanders KM. Interstitial cells of Cajal generate electrical slow waves in the murine stomach. Journal of Physiology. 1999;518:257–269. doi: 10.1111/j.1469-7793.1999.0257r.x. [DOI] [PMC free article] [PubMed] [Google Scholar]
- Ozaki H, Stevens RJ, Blondfield DP, Publicover NG, Sanders KM. Simultaneous measurement of membrane potential, cytosolic Ca2+, and tension in intact smooth muscles. American Journal of Physiology. 1991;260:C917–925. doi: 10.1152/ajpcell.1991.260.5.C917. [DOI] [PubMed] [Google Scholar]
- Pacaud P, Bolton TB. Relation between muscarinic receptor cationic current and intestinal calcium in guinea pig jejunal smooth muscle. Journal of Physiology. 1991;441:477–499. doi: 10.1113/jphysiol.1991.sp018763. [DOI] [PMC free article] [PubMed] [Google Scholar]
- Piper AS, Greenwood IA, Large WA. Dual effect of blocking agents on Ca2+-activated Cl− currents in rabbit pulmonary artery smooth muscle cells. Journal of Physiology. 2002;539:119–131. doi: 10.1113/jphysiol.2001.013270. [DOI] [PMC free article] [PubMed] [Google Scholar]
- Prakriya M, Lewis RS. Potentiation and inhibition of Ca2+ release-activated Ca2+ channels by 2-aminoethyldiphenyl borate (2-APB) occurs independently of IP3 receptors. Journal of Physiology. 2001;536:3–19. doi: 10.1111/j.1469-7793.2001.t01-1-00003.x. [DOI] [PMC free article] [PubMed] [Google Scholar]
- Sanders KM. A case for interstitial cells of Cajal as pacemakers and mediators of neurotransmission in the gastrointestinal tract. Gastroenterology. 1996;111:492–515. doi: 10.1053/gast.1996.v111.pm8690216. [DOI] [PubMed] [Google Scholar]
- Sergeant GP, Hollywood MA, McCloskey KD, McHale NG, Thornbury KD. Role of IP3 in modulation of spontaneous activity in pacemaker cells of rabbit urethra. American Journal of Physiology. 2001a;280:C1349–1356. doi: 10.1152/ajpcell.2001.280.5.C1349. [DOI] [PubMed] [Google Scholar]
- Sergeant GP, Hollywood MA, McCloskey KD, Thornbury KD, McHale NG. Specialised pacemaking cells in the rabbit urethra. Journal of Physiology. 2001b;526:359–366. doi: 10.1111/j.1469-7793.2000.t01-2-00359.x. [DOI] [PMC free article] [PubMed] [Google Scholar]
- Sergeant GP, Hollywood MA, McHale NG, Thornbury KD. Spontaneous Ca2+ activated Cl− currents in isolated urethral smooth muscle cells. Journal of Urology. 2001c;166:1161–1166. [PubMed] [Google Scholar]
- Shapiro MS, Wollmuth LP, Hille B. Modulation of Ca2+ channels by PTX-sensitive G-proteins is blocked by N-ethylmaleimide in rat sympathetic neurones. Journal of Neuroscience. 1994;14:7109–7016. doi: 10.1523/JNEUROSCI.14-11-07109.1994. [DOI] [PMC free article] [PubMed] [Google Scholar]
- Suzuki H, Hirst GDS. Regenerative potentials evoked in circular smooth muscle of the antral region of guinea-pig stomach. Journal of Physiology. 1999;517:563–573. doi: 10.1111/j.1469-7793.1999.0563t.x. [DOI] [PMC free article] [PubMed] [Google Scholar]
- Suzuki H, Takano H, Yamamoto Y, Komuro T, Saito M, Kato K, Mikoshiba K. Properties of gastric smooth muscles obtained from mice which lack inositol trisphosphate receptor. Journal of Physiology. 2000;525:105–111. doi: 10.1111/j.1469-7793.2000.00105.x. [DOI] [PMC free article] [PubMed] [Google Scholar]
- Van Helden DF, Imtiaz MS, Nurgaliyeva K, Von Der Weid P, Dosen PJ. Role of calcium stores and membrane voltage in the generation of slow wave action potentials in guinea-pig gastric pylorus. Journal of Physiology. 2000;524:245–265. doi: 10.1111/j.1469-7793.2000.00245.x. [DOI] [PMC free article] [PubMed] [Google Scholar]
- Ward SM, Brennan MF, Jackson VM, Sanders KM. Role of PI3-kinase in the development of interstitial cells and pacemaking in murine gastrointestinal smooth muscle. Journal of Physiology. 1999;516:835–846. doi: 10.1111/j.1469-7793.1999.0835u.x. [DOI] [PMC free article] [PubMed] [Google Scholar]
- Ward SM, Burns AJ, Torihashi S, Sanders KM. Mutation of the proto-oncogene c-kit blocks development of interstitial cells and electrical rhythmicity in murine intestine. Journal of Physiology. 1994;480:91–97. doi: 10.1113/jphysiol.1994.sp020343. [DOI] [PMC free article] [PubMed] [Google Scholar]
- Ward SM, Harney SC, Bayguinov JR, McLaren GJ, Sanders KM. Development of electrical rhythmicity in the murine gastrointestinal tract is specifically encoded in the tunica muscularis. Journal of Physiology. 1997;505:241–258. doi: 10.1111/j.1469-7793.1997.241bc.x. [DOI] [PMC free article] [PubMed] [Google Scholar]