

Abstract
To investigate the properties of NMDA receptors expressed in new-born rat hippocampal granule cells, recordings were made of single-channel currents produced by application of glutamate or NMDA to outside-out membrane patches. Outside-out patches displayed two distinct patterns of single-channel activity. In some patches only high conductance single-channel activity composed of 42 and 50 pS currents was observed while in others both high (42 and 50 pS) and low (17 and 33 pS) conductance single-channel currents occurred. An absence of direct transitions connecting the smallest (17 pS) and largest (50 pS) conductance unitary currents, as well as an absence of direct transitions connecting 17, 42 and 50 pS currents in sequence, suggested that high and low conductance single-channel activity may have been produced as a result of the activation of two distinct NMDA receptor populations. The NR2B subunit-selective NMDA receptor antagonist, ifenprodil, blocked the high conductance currents suggesting that these receptors contain the NR2B subunit while a clear asymmetry in the frequency of direct transitions between 17 and 42 pS conductance levels indicates the presence of NMDA receptors containing NR2D subunits. In patches containing both high and low conductance-channel activity, evidence for negative coupling between NR2B- and NR2D-like channel activity was observed, suggesting receptors containing these subunits do not gate independently or that both NR2B and NR2D subunits may be part of a single receptor molecule. We conclude that NMDA receptors in P0 hippocampal granule cells are likely to be a mixture of NR1/NR2B diheteromers and receptors of novel molecular composition that may be triheteromeric receptors composed of NR1, NR2B and NR2D subunits.
Identification of the types of NMDA receptors present in the brain is fundamental to understanding a diverse number of neuronal processes which are known to require activation of NMDA receptor-channels. Under physiological conditions, signalling through NMDA receptors is required during processes of neuronal cell migration (Komuro & Rakic, 1993), synaptogenesis (Constantine-Paton & Cline, 1998; Nase et al. 1999), synaptic transmission (Collingridge et al. 1988) and synaptic plasticity (Bliss & Collingridge, 1993) while their excessive activation is thought to be responsible for neuronal cell damage during acute neurological conditions such as brain trauma, cerebral ischaemia, hypoglycaemia, hypoxia and epileptic seizures; as well as during chronic neurodegenerative diseases such as Huntington's chorea, AIDS encephalopathy and dementia complex, and neuropathic pain syndromes (Choi, 1992; Collingridge & Watkins, 1994; Woolf & Salter, 2000; Kaul et al. 2001).
During development NMDA receptors play a critical role in postnatal synaptic stabilization in the hippocampus. Over the first postnatal week, hippocampal glutamatergic synapses are gradually converted from pure NMDA receptor synapses to mature NMDA/AMPA receptor synapses (Durand et al. 1997) which is thought to occur in response to spontaneous synergistic excitation mediated by GABAA and NMDA receptors (Leinekugel et al. 1997). The precise identity of the NMDA receptors expressed at birth in the hippocampus is unknown, although in situ mRNA hybridisation (Monyer et al. 1994; Laurie & Seeburg, 1994; Wenzel et al. 1997;) and protein immunohistochemistry (Wenzel et al. 1997; Okabe et al. 1998) suggest NR1a, NR2B and NR2D are the main subunits expressed. Functionally, CA1 pyramidal cells have been shown during the first postnatal week to have a high sensitivity to ifenprodil and shallower voltage sensitivity of Mg2+ block than in adults, consistent with the presence of NR2B and NR2D subunits (Kirson et al. 1999). In 7- to 14-day-old rats, Strecker et al. (1994) found the Mg2+ sensitivity of large conductance NMDA channels to be similar to adult rats and reported a main NMDA single-channel conductance of 56 pS in granule cells and 50 pS in CA1 cells suggesting the presence of NMDA receptors containing NR2A or NR2B subunits. However, the functional properties of NMDA receptors in new-born rat hippocampal granule cells have not yet been investigated in detail and the molecular composition of these receptors is not known. Yet granule cell NMDA receptors may be of particular interest in the hippocampus because of the ability of granule cells to undergo neurogenesis even in older animals (Cameron et al. 1995).
Studies using recombinant NMDA receptors have shown that the functional and pharmacological properties of NMDA channels are determined by their subunit composition (Stern et al. 1992; Williams, 1993; Monyer et al. 1994; Wyllie et al. 1996; Lynch et al. 1997; Vicini et al. 1998; Rumbaugh et al. 2000). Functional diversity of native NMDA receptor channels is probably determined by assembly of different NMDA receptor subunits in hetero-oligomeric complexes with the NR2A, B, C and D subunits particularly influencing the receptor's functional characteristics. Evidence from radioligand binding studies suggests the presence in rat brain of at least four pharmacologically different NMDA receptor subtypes (Monaghan et al. 1988, 1997) and this evidence is supported by functional evidence, particularly from biophysical and pharmacological experiments, for distinct subtypes of NMDA receptors in specific populations of central neurones (see e.g. reviews by Feldmeyer & Cull-Candy, 1996; Dingledine et al. 1999; Cull-Candy et al. 2001).
Information about the subunit composition of native NMDA receptors can be obtained from single-channel recordings of native NMDA receptor-channel currents obtained from neurons in brain slices. The great advantage of this approach is that it allows investigation of the properties of functional NMDA receptors in identified neurones in the brain slice. For example, a strong correlation has been found between NMDA receptor single-channel properties and the expression of different NMDA receptor subunits in Purkinje cells, granule cells and Golgi cells in the developing cerebellum (Farrant et al. 1994; Momiyama et al. 1996; Misra et al. 2000). These data support the presence of diheteromeric receptors composed of NR1/NR2C subunits in cerebellar granule cells (Farrant et al. 1994) and NR1/NR2D diheteromers in Purkinje cells (Momiyama et al. 1996) and Golgi cells (Misra et al. 2000). There is also evidence from coimmunoprecipitation studies to suggest that two different NR2 subunits can combine in a single molecule with NR1 to form triheteromeric receptors which can be NR1/NR2A/NR2B (Sheng et al. 1994; Chazot & Stephenson, 1997), NR1/NR2A/NR2D or NR1/NR2B/ NR2D (Dunah et al. 1998). Single-channel recordings of recombinant NMDA receptors have provided evidence for the formation of a triheteromeric NR1/NR2A/NR2D receptor with a novel subconductance level of around 30 pS (Cheffings & Colquhoun, 2000). Similar approaches have not yet been used to identify NMDA receptors present in the hippocampus. The aim of this study was to describe, at the single-channel level, the functional and pharmacological properties of NMDA receptors found in the rat dentate gyrus granule cells at birth and to infer the subunit composition of these receptors using the microscopic behaviour of single-channel currents as a fingerprint for the underlying molecular composition of the receptor.
METHODS
Solutions
For slicing, an ice-cold modified Krebs solution (Edwards et al. 1989) with the following composition was used (mm): NaCl, 125; KCl, 2.5; CaCl2, 1.0; MgCl2, 4.0; NaH2 PO4, 1.25; NaHCO3, 24; glucose, 25; pH 7.4. For single-channel recording, slices were bathed in this solution but with no added MgCl2. The slicing and recording solutions were continuously gassed with a mixture of O2 (95 %) and CO2 (5 %). The non-NMDA receptor antagonist DNQX (5 μM) was added to the external recording solution. In some experiments the NMDA receptor antagonist ifenprodil (Sigma) was also applied in the recording solution. Patch pipettes were filled with a low chloride (10 mm) pipette solution containing (mm): NaOH, 180; NaCl, 10; EGTA, 11; Hepes, 10; gluconic acid lactone, 140; pH: 7.2 (Gibb & Colquhoun, 1991).
Drugs and chemicals
Glutamate (l-glutamic acid), glycine, NMDA (N-methyl-d-aspartic acid) and DNQX (6,7-dinitroquinoxaline-2,3-dione) were purchased from Tocris (Bristol, UK). Drugs were added to the recording solution and superfused through the recording chamber. Before drug application, control recordings were made in the absence of agonists or antagonists and patches showing spontaneous channel activity were discarded. Each outside-out patch was exposed to a constant low concentration of glutamate (50-100 nm) or NMDA (1-5 μM) plus glycine (3-10 μM) for 2 to 40 min at membrane potentials between −100 and −20 mV at room temperature (20-24 °C).
Preparation of hippocampal slices
Hippocampal slices (250 μm) from brains of new-born (postnatal day 0; P0) Sprague-Dawley rats were prepared using standard procedures (Gibb & Edwards, 1994), and approved under the UK Animals Act. Briefly, P0 rat pups were decapitated and the brain was quickly dissected into ice-cold oxygenated slicing solution. To reduce brain damage during the slicing procedure, the meninges were carefully removed using fine forceps. Brains were sliced in ice-cold oxygenated slicing solution using a vibroslicer (Vibroslice 752, Campden Instruments, UK). Slices were then transferred into an incubation chamber containing continuously oxygenated slicing solution maintained at 32-34 °C. For recording, slices were transferred to a recording chamber fitted to the stage of an upright microscope (Zeiss Axioscope FS) and viewed under Normaski differential interference contrast optics (Edwards et al. 1989). Dentate gyrus granule cells were identified by their location, size and morphology (Koh et al. 1995).
Patch pipette fabrication and single-channel recording
Patch pipettes were pulled from thick-walled borosilicate glass capillaries (GC150F-7.5, Clark Electromedical), coated with silicon resin (Sylgard 184, Dow Corning, USA) and fire polished on a microforge (Narishige MF-83) to a final resistance of 20-30 MΩ when filled with low-chloride pipette solution. Before recording, the patch noise level was checked and a root mean square noise level below 0.300 pA at a bandwidth of 5 kHz was considered acceptable. Steady-state single-channel activity was recorded at room temperature and stored on digital audio tapes (Maxell, DAT 120) using a patch-clamp amplifier (Axopatch 200A) connected to a digital audio tape recorder (BioLogic DTR 1202).
Data acquisition and analysis
Single-channel currents were replayed from tape, amplified and filtered at 2 kHz and digitized at 20 kHz using an analog-to-digital converter (CED 1401plus, Cambridge Electronics Design, UK). Each digitized record was analysed using SCAN, an interactive computer program (available at http://www.ucl.ac.uk/Pharmacology/dc.html) that fits the time course of each event based on the step response of the recording system (Colquhoun & Sigworth, 1995). Display and analysis of single-channel data distributions was done using the program EKDIST (Colquhoun & Sigworth, 1995). Before analysis, a fixed resolution for open times and closed times that gave a false event rate less than or equal to 10−8 events per second was imposed (Colquhoun & Sigworth, 1995). This was usually 50 μs for open and closed times. Before a patch was accepted for detailed analysis, the long term stability of the data records was checked by making stability plots for amplitudes, open times, shut times and Popen (Weiss & Magleby, 1989). Stability plots for amplitudes were made by plotting against event number the amplitude of all openings longer than 2 filter rise-times (332 μs), which were therefore of a duration sufficient to reach at least 98.8 % of their full amplitude (Colquhoun & Sigworth, 1995). Each data point on the amplitude stability plot therefore represents a single-channel opening independent of its duration. Stability plots for open and shut times were made by calculating a moving average of 50 consecutive open or shut time intervals with an overlap of 25 events and plotting this average against the interval number at the centre of the averaged values. Stability plots for open probability (Popen) were made by calculating a Popen value for each set of 50 open and 50 shut times.
Once the stability of the record had been confirmed, amplitude distributions were made containing individual channel amplitudes longer than 2.5 filter rise times (415 μs). This more stringent criterion (than for stability plots) for accepting amplitude measurements for the amplitude distributions was used because the results of analysing the amplitude distributions provide the channel conductance, the primary means of classifying the NMDA receptors in these experiments. Distributions of channel amplitudes were best fitted with the sum of two or four Gaussian components with the standard deviation constrained to be the same for all components. The relative area occupied by each Gaussian component therefore represents the relative frequency of events to each particular amplitude level. To calculate the slope conductance of the channels, single-channel currents were recorded for 2-3 min at holding potentials between −100 and −20 mV. For each holding potential, the distribution of channel amplitudes was made and fitted with a mixture of Gaussian components, the mean value of each Gaussian component providing an estimate of the mean current for a particular single-channel conductance level. These were plotted against the membrane potential and the slope of the line estimated by linear regression to give the single-channel conductance.
Distributions of closed times and open times were made using a logarithmic transformation of the abscissa (McManus et al. 1987; Sigworth & Sine, 1987) and a square root transformation of the ordinate (Sigworth & Sine, 1987). Distributions were fitted using the maximum likelihood method with probability density functions that were a mixture of one or more exponential components (Colquhoun & Sigworth, 1995). Distributions of open times conditional on amplitude were made using openings in amplitude ranges defined by Acrit values (Howe et al. 1991) calculated from the parameters of the Gaussian components fitted to each amplitude distribution in order to minimise the percentage of misclassified openings present in the open time distribution for each conductance level. Openings shorter than 2 filter rise times (332 μs) were not included in these distributions.
Analysis of super-clusters of openings
Super-clusters of openings were defined as groups of openings separated by shut times of duration less than a critical shut time, tcrit (Colquhoun & Sakmann, 1985) calculated from the fitted parameters of the distribution of shut times such that gaps underlying the 6th exponential component of the shut time distribution were classified as gaps between super-clusters (Gibb & Colquhoun, 1992; Wyllie et al. 1998). tcrit values were calculated so that the percentage of long shut times that were misclassified as ‘within-clusters’ was equal to the percentage of short shut times that were misclassified as ‘between-clusters’ (Colquhoun & Sigworth, 1995). Distributions of super-cluster length and total open time per super-cluster were constructed and fitted with a mixture of exponential components. Super-cluster Popen (the fraction of time during the super-cluster that the channel dwells in any open state) was calculated for each experiment by dividing the mean total open time per super-cluster by the mean super-cluster length.
Direct transitions between conductance levels
A direct transition was considered as a change in open-channel current level from one amplitude level to another (defined using Acrit values calculated from the amplitude distribution) without intervening closures longer than the shut time resolution. Under the recording conditions used in this study (-3 dB, 8-pole Bessel type low pass filter) 99.8 % of the amplitude of an opening is attained when such event had a duration equal to 2.5 filter rise times (415 μs) (Colquhoun & Sigworth, 1995). Three-dimensional representations of the frequency of transitions between conductance levels (represented as the ith conductance followed by the (i + 1)th conductance level, where i is an integer) were made in which the volume of each peak indicated the relative proportion of each type of transition. If a particular type of direct transition was not observed during time-course fitting of the recording, but appeared after imposing the resolution on the data record, then each direct transition event was visually inspected in the original data record to check their validity.
RESULTS
P0 dentate gyrus NMDA receptors display two patterns of single-channel activity
In outside-out patches from P0 hippocampal granule cells, glutamate (50-100 nm) or NMDA (1-5 μM) evoked single-channel activity which was of two distinct types. In some patches (Fig. 1A) only high conductance (50 and 40 pS) single-channel currents were observed, characteristic of NMDA receptors containing NR2A or NR2B subunits (Stern et al. 1992) while in others (Fig.1B) there was, in addition, low conductance channel openings (36 and 19 pS) characteristic of NMDA channels containing the NR2C (Stern et al. 1992) or NR2D (Wyllie et al. 1996) subunits. Of those patches selected for detailed analysis based on stability of channel activity, background noise level and length of recording, seven contained only high conductance channel openings (mean opening frequency = 4.9 ± 1.9 s−1, Popen = 0.023 ± 0.009), while six contained both low and high conductance openings (mean opening frequency = 9.3 ± 5.3 s−1, Popen = 0.027 ± 0.016). These results suggest that new-born rat hippocampal granule cells express at least two different types of NMDA receptor. Intriguingly, no patches (from a total of 19 recordings of at least 4 min duration) were observed to contain only low conductance openings.
Figure 1. Types of single-channel activity mediated by NMDA receptors in outside-out patches from P0 hippocampal granule cells.
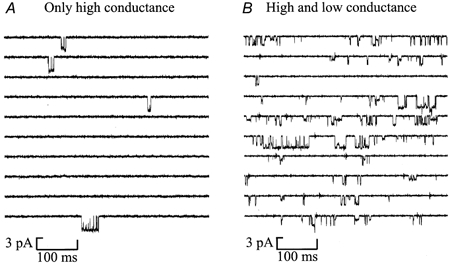
Patches containing only high amplitude single-channel currents (A) and a mixture of high and low amplitude single-channel currents (B) were observed. Openings are downwards. Currents were low-pass filtered at 2 kHz (-3db, 8 pole Bessel filter) and digitized at 20 kHz. Each panel contains ten contiguous 500 ms sweeps of single-channel recording. The solution bathing the extracellular face of the patches contained glutamate (0.05 μM) and glycine (3 μM) as agonists plus the non-NMDA receptor antagonist DNQX (5 μM). Holding potential was −60 mV.
Amplitude of single-channel currents
In patches containing only high conductance single-channel currents, stability plots showed the presence of two different current amplitude levels of around −2.4 and −3.4 pA at −60 mV (Fig. 2A). In patches containing a mixture of high and low conductance single-channel currents, stability plots clearly revealed the presence of an additional lower amplitude single-channel current level of around −1.0 pA at −60 mV (Fig. 2B). Unexpectedly, stability plots also revealed that in patches containing a mixture of high and low amplitude single-channel currents, amplitude levels were not evenly distributed throughout the whole recording. Currents appeared to be grouped into periods of either high or low amplitude (Fig. 2B). They switched from periods of high amplitude to periods of low amplitude and vice versa. The amplitude of the currents within each period remained constant. A more detailed analysis of this behaviour is presented below.
Figure 2. Stability plots and amplitude distributions of NMDA receptor single-channel currents in P0 hippocampal granule cells.
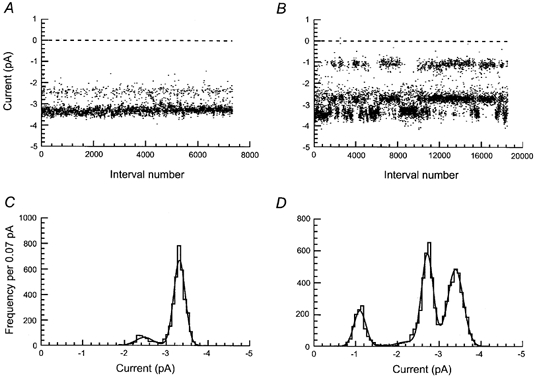
NMDA receptor single-channel currents recorded in outside-out patches containing only high amplitude currents (A and C) or a mixture of high and low amplitude currents (B and D). A and B are stability plots built with 3798 and 7656 single-channel current amplitudes, respectively. Amplitudes of openings shorter than 0.415 ms (2.5 filter rise times) were excluded from the analysis. C and D are amplitude distributions built with the same amplitudes plotted in A and B, respectively. C and D were fitted with 2 and 4 Gaussian components, respectively. The mean current amplitude, standard deviation and relative area of each Gaussian component were: C, 2.48 ± 0.2 pA (13 %) and 3.32 ± 0.1 pA (87 %) and D, 1.10 ± 0.1 pA (15.2 %), 2.24 ± 0.3 pA (3.7 %), 2.72 ± 0.1 pA (38 %) and 3.39 ± 0.2 pA (43 %). Glutamate (0.05 μM) and glycine (3 μM) were used as agonists. Holding potential was −60 mV.
For each patch, amplitude distributions were best fitted with the sum of either 2 or 4 Gaussian components (Fig. 2C and D). At a membrane potential of −60 mV, amplitude distributions made from data obtained from patches containing only high conductance single-channel currents were best fitted by the sum of two Gaussian components (Fig. 2C) with means (and relative areas) of 2.50 ± 0.06 pA (15.9 ± 1.3 %) and 3.25 ± 0.06 pA (84.1 ± 1.3 %) corresponding to chord conductances of 42 and 54 pS. Amplitude distributions obtained from patches containing a mixture of high and low amplitude single-channel currents were best fitted by the sum of four Gaussian components (Fig. 2D) with means (and relative areas) of 1.09 ± 0.01 pA (10.1 ± 2.87 %), 2.03 ± 0.03 pA (2.82 ± 0.55 %), 2.68 ± 0.02 pA (36.2 ± 4.09 %), and 3.35 ± 0.03 pA (50.9 ± 6.47 %) corresponding to chord conductances of 18, 34, 44 and 56 pS.
For patches containing both low and high conductance channels, the means of each Gaussian component were consistent between patches and also consistent whether the agonist was glutamate or NMDA (Table 1). However, the relative area of each component varied suggesting that more than one type of NMDA channel was present in these patches and the number of channels of each type was not constant between patches. In addition, there was no obvious difference in the number of patches observed to have high and low, or only high conductance channels when comparing the two agonists, glutamate or NMDA, suggesting that the different types of receptors in the patch have no obvious selectivity for one agonist relative to the other.
Table 1.
Single current channel amplitude distribution parameters
| Gaussian components | ||||
|---|---|---|---|---|
| 1st(pA) | 2nd(pA) | 3rd(pA) | 4th(pA) | |
| Glutamate | ||||
| Only high conductance | — | — | 2.50 ± 0.07 | 3.26 ± 0.08 |
| (n = 4 patches) | 16 ± 2 % | 84 ± 2 % | ||
| High and low | 1.08 ± 0.02 | 2.01 ± 0.07 | 2.67 ± 0.03 | 3.37 ± 0.04 |
| (n = 3 patches) | 9 ± 3 % | 3 ± 1 % | 37 ± 3 % | 51 ± 6 % |
| NMDA | ||||
| Only high conductance | — | — | 2.50 ± 0.09 | 3.24 ± 0.09 |
| (n = 3 patches) | 16 ± 2 % | 84 ± 2 % | ||
| High and low | 1.09 ± 0.01 | 2.02 ± 0.00 | 2.68 ± 0.02 | 3.33 ± 0.04 |
| (n = 3 patches) | 11 ± 6 % | 3 ± 1 % | 36 ± 9 % | 50 ± 14 % |
Membrane potential, −60 mV. Shown is the average ± s.e.m. for the mean of each Gaussian component detected in each amplitude distribution and immediately below, the mean ± s.e.m. of the relative area of each component.
In patches containing only high conductance channels, both the means and relative areas of the two Gaussian components fitted to the data were consistent between patches. The relative areas of the two components were consistent from patch to patch and consistent whether the agonist was glutamate or NMDA (Table 1). These results suggest that patches showing only high conductance channels contain a homogeneous population of NMDA receptors.
Conductance of single-channel currents
Channel slope conductance was calculated in all patches as this is one of the defining features of NMDA receptors and allows NMDA receptors containing the NR2A and NR2B subunits (generating 50 and 40 pS channel openings) to be distinguished from NMDA receptors containing the NR2C and NR2D subunits which have 18 and 36 pS openings (Stern et al. 1992; Wyllie et al. 1996).
The slope conductance of each of the identified single-channel current levels was estimated from current-voltage relationships (I-V plots) in which the mean of the Gaussian components in the amplitude distributions were plotted against patch membrane potential (Fig. 3). In patches containing only high amplitude single-channel currents, two conductance levels of 42 and 51 pS were identified (Fig. 3A and C). In patches containing a mixture of high and low conductance single-channel currents, four conductance levels were identified with slope conductances of 17, 33, 42 and 49 pS (Fig. 3B and D). In patches containing either only high conductance or a mixture of high and low conductance single-channel currents, no significant difference in single-channel current amplitudes was observed when currents were activated by glutamate or NMDA (Table 1).
Figure 3. Conductance of NMDA receptor single-channel currents in P0 hippocampal granule cells.
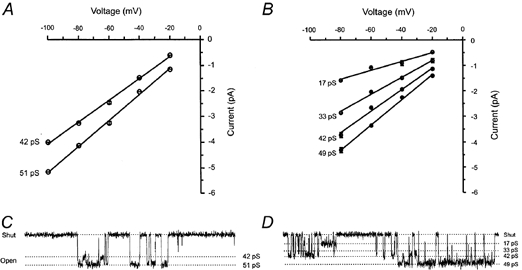
Current-voltage relationships from patches containing only high conductance single-channel currents (A) or a mixture of high and low conductance single-channel currents (B). Each point shows the average ± s.e.m. of the mean current amplitude values for each Gaussian component fitted to the amplitude distributions. Patches were held at potentials between −100 and −20 mV. Linear regression of the data gave slope conductance values of 42 and 51 pS (A) and 17, 33, 42 and 49 pS (B).
Effects of ifenprodil
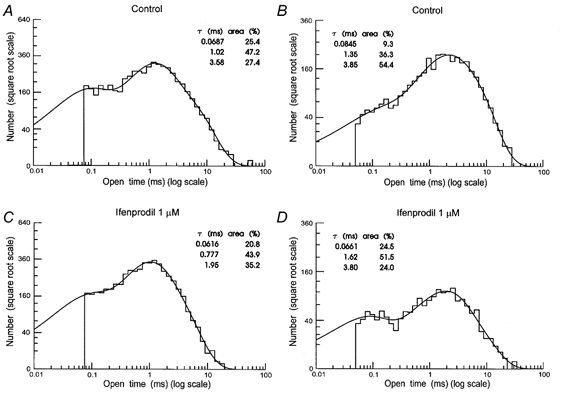
Ifenprodil (1 μM) reduced the single-channel activity in all patches tested suggesting that receptors containing the NR2B subunit were present in all patches. Figure 4 illustrates characteristic single-channel activity evoked by NMDA in control recordings and then, in the same patch, in the presence of NMDA plus ifenprodil for a patch displaying both high and low conductance channels (Fig. 4A and B) and for a patch displaying only high conductance channels (Fig. 4C and D). In patches displaying only high conductance channels ifenprodil reduced the patch Popen from 0.07 ± 0.02 (opening frequency 17.5 ± 4.0 s−1) to 0.02 ± 0.01 (opening frequency 7.7 ± 4.2 s−1) at 1 μM and 0.01 ± 0.005 (opening frequency 5.3 ± 3.1 s−1) at 3 μM. These results suggest an IC50 of 330 nm for ifenprodil inhibition of high conductance channels which is similar to that calculated by Williams (1993) for inhibition of recombinant NR1/NR2B receptors. In patches with both high and low conductance channels ifenprodil (1 μM) reduced the patch Popen from 0.06 ± 0.03 (opening frequency 25.5 ± 15.5 s−1) to 0.04 ± 0.02 (opening frequency 22.4 ± 14.7 s−1). In patches displaying both high and low conductance channel openings, ifenprodil reduced selectively the number of large conductance (42 and 50 pS) openings. Thus, the number of openings underlying the largest Gaussian component fitted to the distribution shown in Fig. 5A (representing 50 pS openings) was reduced (in recordings of equal length) from 1169 openings to 273 openings (Fig. 5C). On average ifenprodil (1 μM) caused a 74 % reduction in the number of 50 pS openings. This is a similar effect to that seen in patches displaying only high conductance events (Fig. 5B and D) where there was a 69 % reduction in the number of high conductance openings and a 76 % reduction in 42 pS openings.
Figure 4. Effects of ifenprodil on single-channel activity mediated by NMDA receptors in P0 hippocampal granule cells.
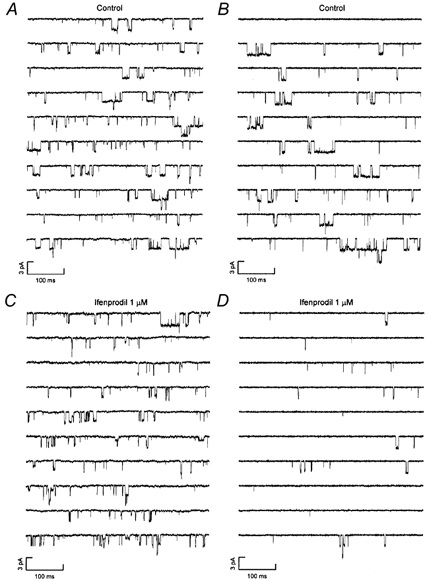
A and B illustrate characteristic NMDA receptor-channel activity in outside-out patches displaying both high and low conductance channel activity (A) or only high conductance channels (B). C and D show examples of activity from the same two patches following application of 1 μM ifenprodil. Holding potential was −60 mV. Openings are downwards. Each panel contains ten contiguous 500 ms sweeps of single-channel recording. Single-channel activity was recorded in the continuous presence of NMDA (5 μM) and glycine (10 μM).
Figure 5. Effects of ifenprodil on the distribution of single-channel current amplitudes in patches with high and low conductance (A and C) or only high conductance (B and D) single-channel activity mediated by NMDA receptors.
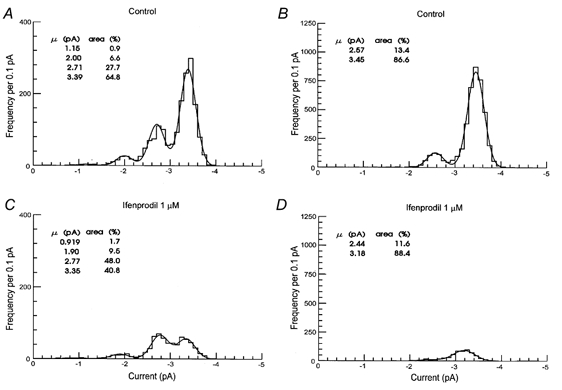
Each distribution contains all current amplitudes that were longer than 2 filter rise times (0.332 μs). Distributions were fitted with the sum of 4 (A and C) and 2 (B and D) Gaussian components. The mean amplitude and relative area of each Gaussian component are shown. Data records with the same length were analysed. Length of the records were 405 s (A and C) and 295 s (B and D). Holding potential was −60 mV.
Direct transitions between conductance levels
In patches with either only high conductance or high and low conductance single-channel activity, direct transitions between the shut and open levels were the most common representing ≈90 % of all direct transitions (Table 2). In patches with either only high conductance or high and low conductance single-channel currents, the frequency of occurrence of direct transitions between pairs of consecutive events involving the shut level was (from most common to least common): 0-50 > 0-42 > 0-17 > 0-33 pS. In patches with high and low conductance single-channel currents, direct transitions between the shut level and all levels except the 17 pS conductance level were symmetric with a similar proportion of direct transitions going in either the channel closing or opening direction (Table 2). This indicates that direct transitions to and from the shut level obeyed microscopic reversibility (Wyllie et al. 1996).
Table 2.
Frequencies of direct transitions
| Between shut level and open levels | Between open channel current levels | ||||
|---|---|---|---|---|---|
| Patch type | High & Low conductance | Only High conductance | High & Low conductance | Only High conductance | |
| Sequence (pS) | (patches = 6) (%) | (patches = 7) (%) | Sequence (pS) | (patches = 6) (%) | (patches = 7) (%) |
| 0–17 | 4.03 ± 0.95 (1391) | — | 17–42 | 0.74 ± 0.27 (255) | — |
| 17–0 | 4.93 ± 1.26 (1696) | — | 42–17 | 1.33 ± 0.50 (455) | — |
| 0–33 | 1.10 ± 0.21 (248) | — | 33–42 | 0.40 ± 0.18 (85) | — |
| 33–0 | 1.17 ± 0.24 (277) | — | 42–33 | 0.47 ± 0.18 (106) | — |
| 0–42 | 17.01 ± 2.20 (5460) | 5.09 ± 1.19 (955) | 33–49 | 0.60 ± 0.23 (147) | — |
| 42–0 | 16.58 ± 2.00 (5295) | 5.15 ± 1.24 (986) | 49–33 | 0.66 ± 0.28 (157) | — |
| 0–49 | 23.03 ± 2.89 (5954) | 40.05 ± 1.32 (7029) | 42–49 | 2.37 ± 0.43 (644) | 4.66 ± 0.63 (861) |
| 49–0 | 23.27 ± 2.96 (5991) | 40.47 ± 1.36 (7096) | 49–42 | 2.32 ± 0.38 (624) | 4.59 ± 0.63 (860) |
| Sub-totals | 91.12 % | 90.76 % | Sub-totals | 8.89 % | 9.25 % |
| N | (26312) | (16066) | N | (2473) | (1721) |
The percentage of all direct transitions between current levels (shown as means ± s.e.m) and the total number of each class of transition is given for patches where both high and low conductance channels were evident, or where only high conductance channels were observed. Direct transitions between open current levels were identified as events where both open levels were greater than 2.5 Tr = 415 μs in duration and no gap longer than the shut time resolution (50 μs) was detected between the two levels. Openings were allocated to each of the four different conductance levels using Acrit values calculated from the amplitude distribution as described in Methods. For patches where both high and low conductance channels were observed, there are 12 possible ways four different open channel current levels can be connected in pairs. Only eight of these combinations are presented as no direct transitions were detected between 17 and 33 pS levels or between 17 and 49 pS levels.
Direct transitions between open-channel current levels were also analysed (Table 2; Fig. 6). Figure 6 illustrates an example of this type of analysis. Panels A and B show two-dimensional plots of the current level before (ith level) and after (ith + 1 level) a direct transition, while panels C and D show three-dimensional plots of the same data. It can be seen that patches with only high conductance channels have an equal density of points describing transitions from 42-51 pS as for 51-42 pS transitions. This is also the case for patches with both high and low conductance channels. In contrast, the density of points representing transitions from 42-17 pS is clearly greater than points representing 17-42 pS transitions. In Fig. 6C and D the volume of each peak describes the density of points in each transition class shown in A and B. The larger peak for 42-17 pS transitions shows that there is a clear asymmetry in direct transitions between 17 and 42 pS current levels.
Figure 6. Direct transitions between consecutive open-channel current levels.
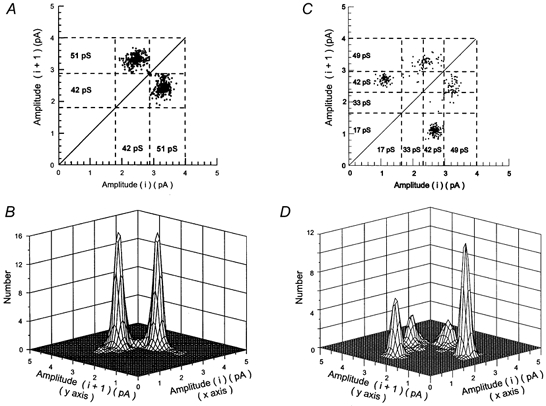
Plots show the number of direct transitions between consecutive open-channel current levels (shut level not included) in outside-out patches containing only high conductance unitary currents (A and B) or high and low conductance unitary currents (C and D). An amplitude-based separation of unitary currents was obtained by calculating critical amplitude values (Acrit) producing an equal percentage of misclassified events between the Gaussian components fitted to the amplitude distribution such as illustrated in Fig. 2C and D. A crit values indicated by the dashed lines in A and C were 2.87 pA in A and 1.71, 2.35 and 3.05 pA in C. In A and C, each dot represents a direct transition, considered as a change in open-channel current level from one amplitude level to another (each amplitude level having a duration longer than 2.5 filter rise times: 415 μs) without intervening closures longer than the shut time resolution (50 μs in these examples). B and D are three-dimensional representations of the data shown in A and C, respectively. The volume of each peak indicates the relative frequency of each type of transition. In the patch illustrated in A and B, 49.2 % of direct transitions between open levels were from 51-42 pS while 50.8 % were from 42-51 pS level. In C and D, 47.5 % of direct transitions between 49 and 42 pS levels were from 49-42 pS while 52.5 % were from 42-49 pS. In contrast, 65.2 % of transitions between 17 and 49 pS levels were from 49-17 pS while only 34.8 % were from 17-49 pS.
The order of occurrence of direct transitions between pairs of consecutive events involving only open-channel current levels was: 42-50 > 17-42 > 33-50 ≥ 33-42 events (Table 2). As with direct transitions to and from the shut level, all direct transitions between open-channel current levels were symmetrical, with the exception of those involving the 17 pS level. Asymmetry was particularly evident for direct transitions connecting 17 and 42 pS single-channel currents. The percentage of direct transitions going from 42 to 17 pS was larger than the percentage of transitions going from 17 to 42 pS (Table 2). This indicates that, as with recombinant NR2D-containing receptors (Wyllie et al. 1996) and some low-conductance native receptors (Momiyama et al. 1996; Misra et al. 2000) direct transitions involving 17 and 42 pS single-channel currents did not obey microscopic reversibility.
No direct transitions were observed between 17 and 33 pS current levels, or between 17 and 49 pS levels (Table 2) suggesting (but not proving) that 17 pS openings are due to a different type of receptor to that generating 33 and 49 pS openings. In contrast, direct transitions are observed between 33, 42 and 49 pS levels. These conductance levels could, therefore, be due to the activity of a single-receptor type. If this is the case, these data suggest that 17 and some 42 pS channel openings are due to one type of receptor (perhaps an NR2D-containing receptor) while 33, some 42 and all 49 pS channel openings could be due to a second type of NMDA receptor (perhaps an NR2B-containing receptor, given that the large conductance openings are selectively blocked by ifenprodil). One way to test this is to examine the data record for direct transitions between three consecutive open levels. For example, if a significant number of direct transition between 33 and 42 pS levels are followed immediately (without channel closing) by a direct transition from the 42 pS level to the 49 pS level, this would be strong evidence that a single type of NMDA receptor can generate 33, 42 and 49 pS openings. The results of this analysis are presented in Table 3.
Table 3.
Frequencies of direct transitions between three consecutive open levels
| Type of sequence | % (no) | Type of sequence | % (no) |
|---|---|---|---|
| 17–42–17 | 2.98 ± 2.00 (23) | 42–33–42 | 2.94 ± 1.03 (19) |
| 17–42–33 | 0.00(0) | 42–33–49 | 1.12 ± 0.54(9) |
| 17–42–49 | 0.00(0) | 42–49–33 | 2.63 ± 1.09(21) |
| 33–42–17 | 0.33 ± 0.22(2) | 42–49–42 | 6.92 ± 1.04(39) |
| 33–42–33 | 1.24 ± 0.65(8) | 49–33–49 | 15.35 ± 2.72(86) |
| 33–42–49 | 1.35 ± 0.46(9) | 49–33–42 | 1.44 ± 0.50(11) |
| 33–49–33 | 1.13 ± 0.75(8) | 49–42–17 | 0.19 ± 0.13(2) |
| 33–49–42 | 1.93 ± 0.69(15) | 49–42–33 | 2.04 ± 1.82(3) |
| 42–17–42 | 7.76 ± 3.91(64) | 49–42–49 | 5.63 ± 6.34(309) |
The percentage of all direct transitions (shown as means ± s.e.m.) involving three consecutive current levels is given (with the total number of each transition sequence) for six patches where both high and low conductance channels were evident. Direct transitions between open current levels were identified as events where both open levels were greater than 2.5Tr = 415 μs in duration and no gap longer than the shut time resolution (50 μs) was detected between the two levels. Openings were allocated to each of the four different conductance levels using Acrit values calculated from the amplitude distribution as described in Methods. Of the 36 possible ways four different open channel current levels can be connected in sequences of three, only 18 sequences are presented. All other sequences involved direct transitions between 17 and 33 pS levels or between 17 and 49 pS levels which had already been found not to occur (Table 2 and Fig. 6).
Table 3 shows an analysis of 628 sequences of direct transitions linking three consecutive open current levels observed in patches showing both high and low conductance activity (n = 6 patches). Since four conductance levels were identified in these patches (17, 33, 42 and 49 pS) there are in principle 36 different sequences which could connect three of these conductance levels. However we can predict from the analysis of direct transitions between pairs of open channel levels that several of these sequences will not be observed. Analysis of pairs of direct transitions showed that there were no direct transitions from 17-49, from 49-17, from 17-33 or from 33-17 pS. Apart from sequences involving these pairs of direct transitions, 18 different sequences of three consecutive open levels were examined (Table 3). Highlighted in bold in Table 3 are those sequences involving the 17 pS level. If 17 pS openings were due to an entirely different receptor to that producing 33 and 49 pS openings, there should be no sequences of three consecutive openings which include sojourns at both 17 and 33 pS or 17 and 49 pS. This was the case except for the 33-42-17 sequence (two instances found) and the 49-42-17 sequence (two instances found). It is almost inevitable that in a very large data set such as analysed here (42 262 transitions between open levels analysed from six patches) there may very occasionally be an artifactual event which looks like a direct transition between conductance levels (Cheffings & Colquhoun, 2000). Overall therefore, these data are consistent with the suggestion that 17 pS openings (and a proportion of 42 pS openings) are due to a different receptor from that producing 33 pS openings, (a proportion of 42 pS openings) and 49 pS openings.
Identification of receptor subtypes by analysis of receptor activations
The activation properties of NMDA receptors were studied at a membrane potential of −60 mV after bath application of glutamate (50 nm) or NMDA (5 μM) in the presence of glycine (3 μM) and DNQX (5 μM) to block non-NMDA receptors. As the kinetics of channel activation depend on the nature of the agonist (Lester & Jahr, 1992) data for glutamate and NMDA will be presented separately. Glutamate-induced activations were studied in four outside-out patches showing only high conductance single-channel activity with an overall mean Popen of 0.012 ± 0.004 (opening frequency: 2.9 ± 0.8 s−1). In a further three patches with an overall mean Popen of 0.014 ± 0.004 (opening frequency: 4.9 ± 1.8 s−1) showing both high and low conductance single-channel activity, glutamate-induced activations were also investigated. For analysis of NMDA-induced activations, data were obtained from three patches with only high conductance single-channel activity with an overall mean Popen of 0.040 ± 0.018 (opening frequency: 8.24 ± 3.5 s−1) and three patches with high and low conductance single-channel activity, with a mean Popen of 0.041 ± 0.026 (opening frequency: 13.7 ± 8.7 s−1).
Stability plot analysis of shut times, open times and Popen
Before analysing the distribution of shut and open times, stability plots for shut times, open times and Popen were made to verify that under these conditions of steady-state receptor activation the average channel kinetic behaviour did not change over time (Weiss & Magleby, 1989). Stability plots from patches with only high conductance single-channel activity were both qualitatively and quantitatively different from those obtained from patches with high and low conductance single-channel activity. Figure 7 shows stability plots for amplitudes, shut times, open times and Popen from a patch containing only high conductance single-channel activity (Fig. 7A, C, E and G) and from a patch with high and low conductance single-channel activity (Fig. 7B, D, F and H). In these Figures amplitude stability plots are reproduced from Fig 2A and B in order to make clear the correlation between changes in channel amplitude and changes in channel kinetics observed with patches displaying both high and low conductance channel activity. In both types of patch, large reductions in mean shut time accompanied by high Popen periods were observed (Fig. 7C and D) as previously described for example in Gibb & Colquhoun (1991). The mean duration of the open intervals was much more stable in patches containing only high conductance single-channel activity than in patches containing high and low conductance single-channel activity in which variations in mean open time (Fig. 7F) seemed to coincide with the changes in current amplitude evident in the stability plot for amplitudes (Fig. 7B).
Figure 7. Stability plot analysis of shut times, open times and Popen.
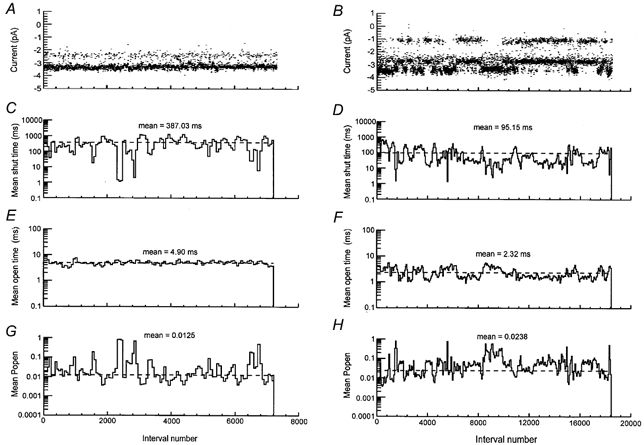
Stability plots for amplitudes (A and B) are the same as those shown in Fig. 2A and B; they are shown here to illustrate the correlation between channel amplitudes and kinetic properties. In C-H, plots show running averages of shut time intervals (C and D), open intervals (E and F) and Popen (G and H). Each bin represents the average of 50 intervals with increments of 25 intervals between averages. Horizontal dashed lines represent overall mean values for the whole data record. Overall mean shut time, open time and Popen values are shown for each plot. Resolution for openings and shuttings was 50 μs. Patches were exposed to a constant concentration of glutamate (0.05 μM) and glycine (3 μM).
Distribution of shut times
Distributions of shut times from patches with only high conductance single-channel activity (Fig. 8A; Table 4) were different from those of patches with high and low conductance single-channel activity (Fig. 8B; Table 4). Due to their different relative areas, exponential components were much easier to identify in shut time distributions from patches with only high conductance single-channel activity than in those from patches with high and low conductance single-channel activity in which exponential components had more similar relative areas.
Figure 8. Shut time distributions.
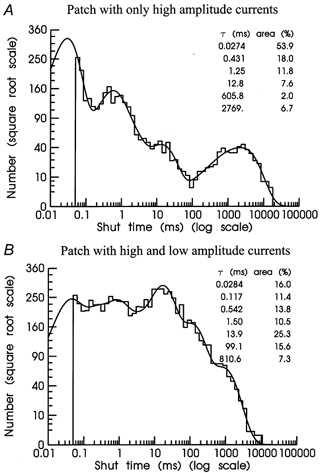
Shut time distributions are shown for patches containing only high amplitude openings (A) or from a different patch containing a mixture of high and low amplitude openings (B). Distributions were fitted with six (A) and seven (B) exponential components. Time constants in ms and relative areas (%) for each fitted exponential component are shown on each histogram. The overall mean shut time and predicted number of shut intervals in each distribution were (A) 198 ms, 5969; and (B) 80.8 ms, 9728.
Table 4.
Distribution of shut times, open times and super-cluster lengths for glutamate and NMDA
| τ1 (μs) | τ2 (ms) | τ3 (ms) | τ4 (ms) | τ5 (ms) | τ6 (ms) | τ7 (ms) | Mean (ms) | |
|---|---|---|---|---|---|---|---|---|
| Glutamate (only high) | ||||||||
| Shut times | 34 ± 3 | 0.3 ± 0.04 | 1.0 ± 0.3 | 11 ± 1 | 415 ± 85 | 1751 ± 475 | — | 445 ± 243 |
| 40 ± 7 % | 14 ± 2 % | 10 ± 1 % | 8.4 ± 1 % | 6.0 ± 2 % | 22 ± 10 % | |||
| Open times | 45 ± 4 | 0.73 ± 0.2 | 4.1 ± 0.6 | — | — | — | — | 2.50 ± 0.6 |
| 17 ± 6 % | 29 ± 5 % | 54 ± 5 % | ||||||
| Super-cluster length | 60 ± 12 | 5.4 ± 2.9 | 45 ± 21 | 2150 ± 735 | — | — | — | 1452 ± 407 |
| 10 ± 1 % | 11 ± 3 % | 7 ± 1 % | 71 ± 6 % | |||||
| Glutamate (high & low) | ||||||||
| Shut times | 34 ± 2 | 0.4 ± 0.07 | 1.8 ± 0.15 | 12 ± 1 | 65 ± 17 | 281 ± 50 | 1316 ± 300 | 190 ± 56 |
| 25 ± 7 % | 16 ± 2 % | 11 ± 1 % | 15 ± 5 % | 11 ± 3 % | 10 ± 1 % | 12 ± 2 % | ||
| Open times | 45 ± 2 | 1.08 ± 0.1 | 4.1 ± 0.3 | — | — | — | — | 1.95 ± 0.2 |
| 10 ± 5 % | 59 ± 5 % | 31 ± 1 % | ||||||
| NMDA (only high) | ||||||||
| Shut times | 23 ± 4 | 0.3 ± 0.08 | 0.8 ± 0.05 | 7 ± 1 | 394 ± 297 | 910 ± 622 | — | 91 ± 61 |
| 63 ± 7 % | 9 ± 2 % | 9 ± 6 % | 4 ± 1 % | 6 ± 0.4 % | 8 ± 2 % | |||
| Open times | 65 ± 3 | 0.73 ± 0.1 | 4.4 ± 0.4 | — | — | — | — | 2.94 ± 0.3 |
| 7 ± 5 % | 31 ± 3 % | 62 ± 1 % | ||||||
| Super-cluster length | 93 ± 8 | 5.8 ± 0.6 | 525 ± 187 | — | — | — | — | 278 ± 124 |
| 21 ± 3 % | 20 ± 2 % | 59 ± 4 % | ||||||
| NMDA (high & low) | ||||||||
| Shut times | 58 ± 19 | 0.4 ± 0.07 | 2.0 ± 0.3 | 18 ± 1 | 458 ± 73 | 1625 ± 34 | — | 258 ± 24 |
| 21 ± 8 % | 20 ± 6 % | 8 ± 1 % | 11 ± 1 % | 34 ± 3 % | 6 ± 1 % | |||
| Open times | 48 ± 12 | 1.08 ± 0.1 | 4.1 ± 0.4 | — | — | — | — | 1.73 ± 0.2 |
| 24 ± 9 % | 44 ± 9 % | 32 ± 9 % | ||||||
| Super-cluster length | 72 ± 21 | 1.3 ± 0.1 | 14 ± 3. | 431 ± 86 | — | — | — | 285 ± 89 |
| 32 ± 15 % | 11 ± 1.3 % | 17 ± 2 % | 55 ± 13 % | |||||
A satisfactory fit to nearly all shut time distributions was obtained by a mixture of six exponential components. However in patches showing both high and low conductance activity, on application of glutamate, three out of four shut time distributions were best fitted with a mixture of seven exponential components. These distributions were similar in form to the shut times from recombinant NR1a/NR2D receptors (Wyllie et al. 1998). The remaining patch was fitted with six exponential components (fitting an extra 7th component did not improve the fit). In all patches, the magnitude of the time constants ranged from tens of microseconds to seconds (Fig. 8; Table 4). For the 1st exponential component, no apparent differences in mean time constant were observed between patches. The relative area of the 1st exponential component was also similar between patches except for patches with only high conductance single-channel activity exposed to NMDA which showed a significantly larger mean relative area (63 ± 7 %). For the 2nd exponential component no apparent differences in mean time constants and relative areas were observed between patches. The 3rd exponential component showed two-fold slower mean time constants in patches with high and low conductance single-channel activity than in patches with only high conductance single-channel activity but mean relative areas were similar between patches. The 4th exponential component had slower mean time constants (18 ± 1 ms) in patches with high and low conductance single-channel activity exposed to NMDA than in patches with only high conductance single-channel activity (7 ± 1 ms). Mean relative areas were larger and more variable (16 ± 5 %) in patches with high and low conductance single-channel activity exposed to glutamate and smaller (4 ± 1 %) in patches with only high conductance single-channel activity exposed to NMDA.
The 5th exponential component showed large variations in mean time constant and relative area between patches. For glutamate, mean time constants were slower (867 ± 331 ms) in patches with only high conductance single-channel activity and faster (65 ± 17 ms) in patches with high and low conductance single-channel activity. No differences in mean relative areas were observed. In contrast, for NMDA-induced single-channel activity mean time constants for the 5th component were similar between patches but mean relative areas showed large variations. Larger variations in the mean time constant of the 6th exponential component were observed between patches (as might be expected if these gaps reflect periods when agonist is not bound to the receptor and so its their duration will be affected by the number of receptors in the patch).
Shut times bordered on each side by 50 pS currents
Shut time distributions containing only shut time intervals that were bordered on each side by openings to the highest conductance level (50 pS level) were made for patches with only high conductance single-channel activity, and for patches with high and low conductance single-channel activity. Before distributions of shut times bordered on each side by openings to the 50 pS level were made, an amplitude-based separation of unitary currents to the 50 pS level was carried out by calculating critical amplitudes values (Acrit) between adjacent Gaussian components fitted to the amplitude distribution. In patches with only high conductance single-channel activity, single-channel currents with amplitudes ranging between 2.96 ± 0.02 and 4.05 ± 0.06 pA and between 2.88 ± 0.11 and 4.07 ± 0.07 pA were used for glutamate and NMDA, respectively. In patches with high and low conductance single-channel activity, single-channel currents with amplitudes ranging between 3.05 ± 0.05 and 4.13 ± 0.07 and between 3.03 ± 0.04 and 4.20 ± 0.00 pA were used for glutamate and NMDA, respectively. Distribution of shut times bordered on each side by openings to the 50 pS level were fitted with a mixture of four exponential components (for patches containing only high conductance channels) or five exponential components (for patches containing both high and low conductance channels). Except for the larger mean shut time obtained from patches with only high conductance single-channel activity that were exposed to glutamate (242 ± 147 ms), the overall mean shut time was similar between all patches (range 40-70 ms). No apparent differences in the mean time constants and relative areas of 1st, 2nd and 3rd exponential components which had mean time constants (and relative areas) of 26 ± 12 μs (51 ± 3.8 %), 0.73 ± 0.03 ms (31 ± 2.3 %) and 6.5 ± 0.71 ms (7.8 ± 1.1 %). The slowest component of distributions for channels activated by glutamate averaged 1601 ± 256 ms (10.1 ± 3.6 %) while for channels activated by NMDA the slowest time constant averaged 927 ± 355 ms (6.2 ± 1.8 %). A 4th exponential component with a mean time constant of 120 ± 78 ms (3 ± 1 %) was clearly evident only in patches with high and low conductance single-channel activity (not in patches with only high conductance single-channel activity). The results are consistent with those of Howe et al. (1991) who observed that in cultured cerebellar granule cells, channel shut times were similar between the agonists glutamate, NMDA or aspartate. These results show that short shut times adjacent to 50 pS openings are similar whether the patch displays only high conductance openings or both high and low conductance openings supporting the idea that high conductance openings result from activity of a similar receptor in both types of patches. However, intriguingly, when shut times adjacent to 42 pS openings are excluded, the 4th exponential component (with time constant around 100 ms) is much less evident suggesting that these gaps may preferentially occur adjacent to 42 pS openings which are linked to 50 pS openings.
Distribution of individual open times
Distributions of the duration of individual openings to all amplitude levels were made and fitted with a mixture of three exponential components (Fig. 9). These had mean time constants (and relative areas) of τ1 = 50 ± 5 μs (15 ± 4.2 %), τ2 = 0.89 ± 0.05 ms (39.7 ± 4.3 %) and τ3 = 4.17 ± 0.19 ms (45.3 ± 4.4 %). The overall mean open time was 2.30 ± 0.11 ms. As also observed by Howe et al. (1991) in cerebellar granule cells, the time constants of each exponential component and their relative areas did not differ significantly between patches activated by glutamate (τ1 = 45 ± 2 μs (14 ± 4 %), τ2 = 0.88 ± 0.12 ms (41.7 ± 6.9 %) and τ3 = 4.12 ± 0.31 ms (43.9 ± 5.2 %); distribution mean 2.26 ± 0.33 ms) and those activated by NMDA (τ1 = 55 ± 7 μs (16 ± 5.8 %), τ2 = 0.90 ± 0.1 ms (37.3 ± 5.2 %) and τ3 = 4.22 ± 0.26 ms (46.8 ± 7.9 %); distribution mean 2.34 ± 0.32 ms). However, it was surprising (given the evidence for more than one type of receptor in patches from direct transition analysis, and from the action of ifenprodil on channel amplitude distributions) to observe that the time constants of each exponential component did not differ significantly between patches containing both high and low conductance channels (Fig. 9A), and those containing only high conductance channels (Fig. 9B).
Figure 9. Distributions of individual open times under control conditions (A and B) and after 1 μM ifenprodil (C and D) in a patch containing high and low conductance (A and C) and in a patch containing only high conductance (B and D) single-channel currents.
Frequency distributions of individual open times are shown fitted with three exponential components. Time constants and relative areas for each exponential component are shown. Predicted overall mean open times are: 1.48 ms (A); 1.04 ms (C); 2.59 ms (B) and 1.76 ms (D). Membrane potential −60 mV. NMDA (5 μM) and glycine (10 μM) were used as agonists.
The overall mean duration of individual openings was ≈1 ms (28-41 %) longer in patches with only high conductance single-channel openings (2.69 ± 0.33 ms) compared with patches with both high and low conductance channels (1.84 ± 0.14 ms) and this is due to the significantly larger area of the intermediate exponential component (51.2 ± 5.64 %) in patches with both high and low conductance channels compared with those containing only high conductance channels (29.8 ± 3.15 %).
Distributions of open times conditional on current amplitude
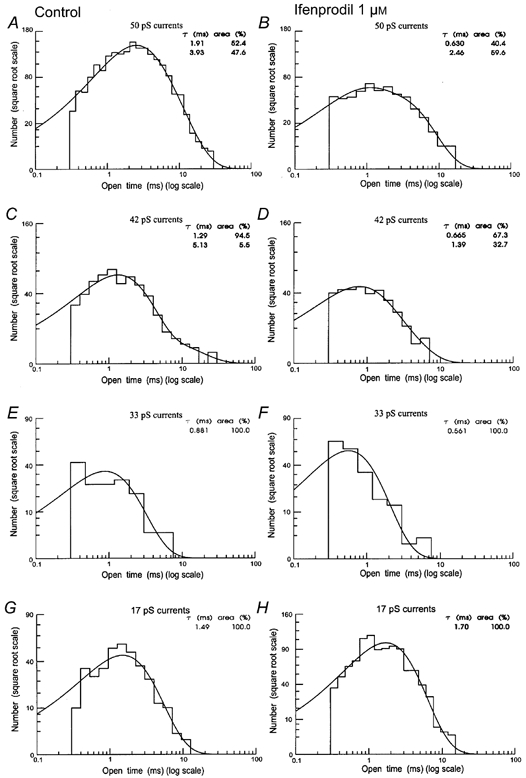
An amplitude-based separation of unitary currents was carried out by calculating critical amplitude values (Acrit) producing an equal percentage of misclassified events between adjacent Gaussian components fitted to the amplitude distribution (Howe et al. 1991). Unlike distributions of all open times, these conditional open time distributions were adequately fitted with a mixture of two exponential components for 50, 42 and 33 pS openings and a single exponential in all but one patch for 17 pS openings (Fig. 10).
Figure 10. Distribution of the duration of individual openings to the 17, 33, 42 and 50 pS conductance levels under control conditions (A, C, E and G) and after 1 μM ifenprodil (B, D, F and H).
Histograms are distributions of individual open times longer than 300 μs. Data obtained from a single outside-out patch containing high and low conductance NMDA receptor single-channel activity. Histograms were fitted with either one or a mixture of two exponential components. Time constants and relative areas are shown inset.
17 pS currents
Openings to the 17 pS level were detected in all patches with high and low conductance single-channel activity and contributed 10.1 ± 2.9 % of all openings in patches containing both high and low conductance channels. Distributions of the duration of 17 pS openings were fitted with a single exponential (Fig. 10G) of mean time constant 1.40 ± 0.19 ms. There was no significant difference between the mean open time of 17 pS openings activated by glutamate or NMDA.
33 pS currents
Openings to the 33 pS single-channel currents were detected in five out of six patches containing high and low conductance channels and contributed 2.8 ± 0.55 % of all openings. Distributions of 33 pS openings were fitted with a mixture of two exponential components (Fig. 10E) with mean time constants (and relative areas) of τ1 = 0.42 ± 0.08 ms (83.9 ± 5.9 %) and τ2 = 1.80 ± 0.39 ms (16.1 ± 5.9 %); distribution mean 0.61 ± 0.09 ms. There was no significant difference between the mean open time of 33 pS openings activated by glutamate or NMDA.
42 pS currents
42 pS openings occur both in patches displaying high and low conductance channels and in patches displaying only high conductance channel openings and constitute 25.3 ± 3.5 % of all openings. Distributions of the duration of 42 pS openings (Fig. 10C) had mean time constants (and relative areas) of τ1 = 0.77 ± 0.05 ms (87.9 ± 3.7 %) and τ2 = 3.73 ± 0.49 ms (12.1 ± 3.7 %); distribution mean 1.04 ± 0.05 ms. There was no significant difference between the mean open time of 42 pS openings activated by glutamate or NMDA. It therefore follows that there was no significant difference in the mean open time of 42 pS openings between patches with only high conductance single-channel activity and patches with high and low conductance single-channel activity.
49-51 pS currents (50 pS)
For the largest conductance single-channel currents (50 pS currents), a satisfactory fit of open time distributions was obtained with a mixture of two exponential components (Fig. 10A). These openings constitute 68.7 ± 5.6 % of all openings. Distributions of the duration of 42 pS openings (Fig. 10C) had mean time constants (and relative areas) of τ1 = 0.91 ± 0.16 ms (21.3 ± 4.6 %) and τ2 = 4.22 ± 0.19 ms (78.7 ± 4.6 %); distribution mean 3.54 ± 0.19 ms. There was no significant difference in the duration of 50 pS openings in patches with only high conductance channels compared with patches with both high and low conductance single-channel activity.
Effects of ifenprodil on channel open times
The NR2B subunit selective antagonist ifenprodil (1 and 3 μM) significantly reduced the duration of channel openings in patches with both high and low conductance openings (Fig. 9A and C) and in patches with only high conductance openings (Fig. 9B and D). In order to determine if the effect of ifenprodil is selective for large conductance openings (as might be expected if large conductance openings are due to activation of the NR2B subunit containing receptors), the effect of ifenprodil on distributions of open times conditional on the amplitude of opening was investigated. In patches with both high and low conductance channels (Fig. 10A and B), ifenprodil (1 μM) significantly (paired t test, P < 0.05) reduced the duration of 50 pS openings from 3.19 ± 0.22 to 1.57 ± 0.11 ms and the duration of 42 pS openings (Fig. 10C and D) from 1.38 ± 0.09 ms in control to 0.97 ± 0.05 ms. Ifenprodil also significantly reduced the duration of 33 pS openings (Fig. 10 and F) from 0.92 ± 0.03 to 0.58 ± 0.11 ms. In contrast (Fig. 10G and H), ifenprodil did not significantly change the mean open time of 17 pS events (control: 1.05 ± 0.31 ms, ifenprodil: 1.32 ± 0.27 ms). In patches displaying only high conductance channel openings (Fig. 9B), ifenprodil significantly (paired t test, P < 0.05) reduced the duration of 50 pS openings from 3.07 ± 0.15 ms in control patches to 1.90 ± 0.49 ms at 1 μM ifenprodil and 1.52 ± 0.11 ms at 3 μM and reduced the duration of 40 pS openings from 1.0 ± 0.1 ms in control to 0.54 ± 0.03 ms at 1 μM ifenprodil and 0.69 ± 0.06 ms at 3 μM.
Analysis of the duration of receptor activations
Super-clusters
Groups of openings constituting single NMDA receptor activations are defined as ‘super-clusters’ (Gibb & Colquhoun, 1992; Wyllie et al. 1998) and their characteristics were investigated by dividing each data record into groups of openings separated by channel closing shorter than a critical gap length tcrit calculated from the fitted parameters of the closed time distribution such that shut times underlying the 5th exponential component and the 6th (slowest) exponential components of the shut time distribution are defined as gaps ‘within activations’ and ‘between activations’, respectively. On average the value of tcrit was 1704 ± 660 ms for glutamate and 589 ± 303 ms for NMDA. Large variations in critical gap lengths (tcrit) were observed between patches as would be expected if the number of receptors varies between patches.
As expected from macroscopic data (Lester & Jahr, 1992) and from studies of recombinant NR1a/NR2D and NR1a/NR2A NMDA receptors (Wyllie et al. 1998), the nature of the receptor activations depends on the agonist with much longer activations observed with glutamate as the agonist, than with NMDA. In principle, distributions of super-cluster length would be expected to contain a number of exponential components equal to the sum of the number of shut time (five exponentials) and open time components (three exponentials) defined as within super-clusters (Wyllie et al. 1998). However, in practice, not all these components may be observed, either because their area is too small to detect, or because they may have similar time constants. In these experiments, distributions of the duration of super-clusters and total open time per super-cluster were adequately described with a mixture of three exponential components when NMDA was the agonist in high conductance-only patches or four exponential components when glutamate was the agonist (Fig. 11) or when NMDA was the agonist in high and low conductance patches. In patches containing both high and low conductance channel openings, the overall channel activity was too high to clearly define super-clusters activated by glutamate.
Figure 11. Distribution of super-cluster lengths and total open time per super-cluster in the presence of glutamate and NMDA for patches containing only high conductance single-channel openings.
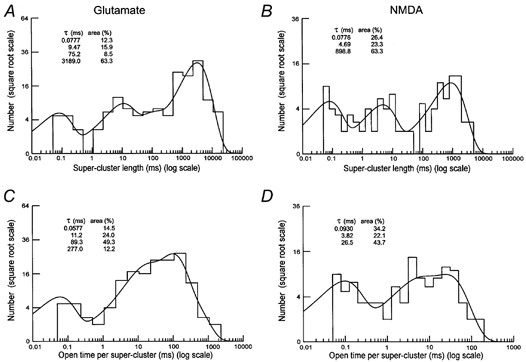
A and B are distributions of the duration of 151 (A) and 102 (B) super-clusters of single-channel openings produced by 50 nm glutamate and 5 μM NMDA, respectively. The predicted overall mean super-cluster duration and number of events were: A, 2027.8 ms and 161; B, 452.8 ms and 117. C and D are distributions of total open time per cluster from the clusters used in A and B, respectively. The predicted overall mean total open time per cluster and number of events were: A, 80.4 ms and 165 and B, 12.5 ms and 119. Critical gap lengths (tcrit = 2638 ms for A and C; 1017 ms for B and D). Time constant and relative areas for each fitted exponential component are shown. Individual openings were separated by shut times longer than 50 μs.
In patches containing only high conductance channel openings the overall mean super-cluster length (Table 4) was approximately five times longer for glutamate (1452 ± 407 ms) than for NMDA (278 ± 124 ms) and the mean total open time per super-cluster was about four times longer for glutamate (57.2 ± 14 ms) than for NMDA (17.6 ± 2.6 ms) giving a mean super-cluster Popen of 0.04 ± 0.004 for glutamate and 0.12 ± 0.07 for NMDA. Super-clusters activated by NMDA had a mean duration of 285 ± 89 ms and mean total open time per super-cluster of 30.6 ± 9.8 ms giving a mean super-cluster Popen of 0.10 ± 0.03 for NMDA.
Super-clusters of recombinant NR1a/NR2D NMDA receptors activated by glutamate have a mean duration of 1602 ± 196 ms, a mean total open time per super-cluster of 65.8 ± 17.4 ms and a mean super-cluster Popen of 0.04 ± 0.02 (Wyllie et al. 1998). Similar single-channel measurements have not yet been published for NR2B subunit-containing recombinant receptors. However, Chen et al. (1999) have used block by MK-801 to estimate the open probability of NR1a/NR2B receptors in whole cell recordings. Their estimate of 0.07 is close to the super-cluster Popen determined here in P0 hippocampal granule cells.
Negative coupling between low and high conductance NMDA channel activity
During the course of this work, an unusual phenomenon was observed when particularly long recordings of NMDA channel activity in patches displaying high and low conductance channel openings were examined. This phenomenon is apparent in panel B of Fig. 2 where is can be seen that periods of 500 to 2000, channel openings occur in succession where there are relatively few high conductance, 50 pS openings or alternatively relatively few low conductance openings. These periods of channel activity correspond to recording periods of between 50 and 200 s long, since there were, on average, 9.3 openings s−1 in this recording. Analysis of the super-cluster properties in these data suggested that there were 871 receptor activations with a mean gap between activations (tcrit) of 217 ms in this relatively high-activity record. Thus, each period of concerted high, or low conductance activity is expected to contain numerous receptor activations. Yet, if high and low conductance channel activity are due to distinct receptor subtypes (as suggested by the analysis of direct transitions between open channels and the effect of ifenprodil) individual receptor activations of high or low conductance type should occur randomly. One possible way to test if high and low conductance channel openings are occurring independently is to measure the occurrence of simultaneous openings in records where significant ‘double’ openings occur since the frequency of double openings should follow the binomial distribution. The results of this analysis are presented in Fig. 12 which shows a re-analysis of the data presented in Fig. 2B to include the occurrence of every single or multiple opening in the data record. Figure 12B shows the all-point amplitude distribution of the data, fitted with the sum of nine Gaussian components representing the channel closed level, four single-channel conductance levels corresponding to 17, 33, 42 and 50 pS levels, and in addition, four multiple open channel levels (shown on an expanded scale in Fig. 12C). The relative area of each Gaussian component gives the probability of observing an opening at each level. The total area of the distribution attributable to 17, 33, 42 and 50 pS openings is equal to 0.42607. If these openings were independent of each other, then the total predicted area of superimposed openings would be (0.42607)2 = 0.18154. In fact, the observed total area occupied by superimposed openings is only 0.00591. In other words, 30.7 times smaller than expected. However, we already know that 17, 33, 42 and 50 pS openings are not independent of each other since direct transitions, particularly between 50 and 42 pS openings, and between 17 and 42 pS openings provide strong evidence that a single receptor can open to more than one conductance level during a single-receptor activation. As the 42 pS conductance level is common to both types of activation, this induces an essential ambiguity into this type of analysis. Analysis of the frequency of 17, 50 and (17 + 50) pS conductance levels gives a similar picture. The probability of observing openings in the 17 pS conductance level was 0.07626 and those in the 50 pS level was 0.22946. If the small probability of superimposition of 17 and 33 pS openings producing ‘apparent’ 50 pS openings is ignored, then the probability of observing (17 + 50) pS events should be 0.07626 × 0.22946 = 0.0175. In fact the area of the distribution representing (17 + 50) pS events is 0.00099 which is 17.7 times less than expected. Likewise, the area of the distribution representing superimposed 50 pS events (mean amplitude 6.8 pA) would be predicted to be (0.22946)2 = 0.053 but is observed to be 0.00293 or 18 times less than expected. These results therefore imply that NMDA receptors from P0 hippocampal granule cells do not gate independently of each other but that instead there is some form of negative coupling between receptors in these patches. The significance of this in terms of considering the likely subunit composition of these receptors and possible mechanisms that could generate this activity are considered in the discussion.
Figure 12. Detection of negative coupling between NMDA receptors.
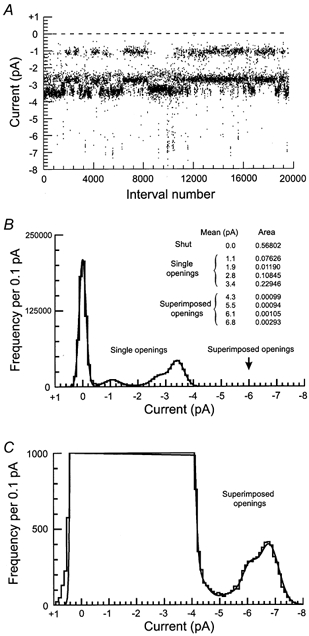
A stability plot for amplitudes. Each dot represents the amplitude of single or superimposed openings longer than 332 μs (2 filter rise times). The stability plot clearly shows the presence of high and low amplitude single-channel currents. Surprisingly, it also shows that currents were apparently segregated into periods of channel activity containing either high or low amplitude openings. To estimate the number of current levels, their mean amplitude and relative area, an all-point amplitude distribution was made with the same data and fitted with the sum of nine Gaussian components representing the channel closed level, four single-channel conductance levels, and four conductance levels expected from superposition of channel openings when two channels are open at the same time (B). Fitted mean amplitudes and relative areas for each current level are shown. Note that in panel B the fitted bins corresponding to the amplitude of superimposed openings are not evident because of their small areas; they are shown in panel C on an enlarged scale. Glutamate (0.05 μM) and glycine (3 μM) were used as agonists. Holding potential was −60 mV. According to a binomial distribution, if the observed total area occupied by single openings is equal to 0.42607, then the predicted total area occupied by the superposition of these openings should be equal to (0.42607)2 = 0.18154. In contrast, the observed total area occupied by superimposed openings is only 0.00591. In other words, 30.7 times smaller than expected.
DISCUSSION
Determining the subunit composition of native species of NMDA receptors and the contributions made by each receptor subunit to the receptor's distinctive physiological and pharmacological properties is fundamental to improving our understanding of the physiological role played by NMDA receptors. In this study we investigated the properties of NMDA receptors in P0 hippocampal granule cells where the NMDA receptor properties are likely to be important in the development of the mature hippocampal circuitry. Two patterns of single-channel activity were observed in different patches: either high conductance (42 and 51 pS) channel openings or high and low conductance (17, 33, 42 and 50 pS) channel openings. The biophysical properties of this channel behaviour and their sensitivity to the NR2B-selective antagonist, ifenprodil, suggest the following possibilities for receptor subunit composition should be considered: (i) NR1 and NR2B diheteromers, (ii) NR1 and NR2D diheteromers and (iii) NR1, NR2B and NR2D triheteromers.
In the following discussion we consider the evidence for each of these possibilities and in particular the possibility that in patches with both high and low conductance channels the subunit composition of these receptors involves NR2B and NR2D subunits forming part of a single receptor molecule.
High and low conductance channel openings
In patches with both high and low conductance channels we consider the possibility that these could be explained by a combination of (i) and (ii). Unitary currents with a main conductance level of 50 pS and a short-lived subconductance level of 42 pS have been described for recombinant NMDA receptors when the NR1 subunit is co-expressed with either NR2A or NR2B subunits (Stern et al. 1992). This finding suggests that NMDA receptors in P0 hippocampal granule cells probably contain NR2A or NR2B subunits. Immunohistochemical and in situ mRNA hybridization studies describe the presence in P0 hippocampus of protein signals and mRNA encoding NR2B subunits. In contrast, clear evidence of NR2A subunit expression in the dentate gyrus at birth is lacking. These results therefore suggest high conductance single-channel currents may be due to NR2B subunit-containing receptors. However we reject this hypothesis as option (i), an NR2B diheteromer, is inconsistent with the clear presence of 33 pS openings (e.g. Fig. 5A and C) that are associated with periods of high conductance ifenprodil-sensitive channel activity (e.g. Fig. 2B or 12A) and the presence of direct transitions linking 33, 42 and 50 pS openings (Tables 2 and 3).
The presence of low conductance channel activity agrees with the expression in P0 hippocampus of protein signals and mRNA encoding the NR2D subunit (Monyer et al. 1994; Wenzel et al. 1997) which is known to produce, on co-expression with NR1 subunits, low conductance 17 and 35 pS channel openings (Wyllie et al. 1996). Recombinant NMDA receptors containing NR2C subunits also produce low conductance single channel currents but expression of NR2C protein, or mRNA encoding for the NR2C subunit has not been detected in P0 rat hippocampus (Monyer et al. 1994; Wenzel et al. 1997). Asymmetry of direct transitions, to or from, the 17 pS level, as observed in this study, is a unique property of NR2D-containing receptors (Wyllie et al. 1996). Therefore, receptors containing the NR2D subunit are most likely to underlie the low conductance channel activity observed in this study. The presence of NR2D diheteromers, option (ii), is not directly consistent with our data because the 17 pS conductance level was found to be connected by direct transitions to openings of around 42 pS rather than 35 pS as observed with recombinant NR2D receptors (Wyllie et al. 1996). This difference in the conductance level linked to 17 pS openings may be an indication that these receptors are not simply composed of NR1 and NR2D subunits. We therefore conclude that a triheteromeric receptor, option (iii), is the more likely explanation for these patches.
Effects of Ifenprodil
Ifenprodil is a non-competitive NMDA receptor antagonist (Kew et al. 1996) which inhibits NMDA receptors by increasing the receptor sensitivity to proton inhibition (Mott et al. 1998). Recombinant NMDA receptors produced by expression in Xenopus oocytes of NR1 and NR2B subunits are more than 100-fold more sensitive to ifenprodil (IC50 = 0.34 μM) than receptors produced by expression of NR1 and NR2A subunits (IC50 146 μM; Williams, 1993). Recombinant human NMDA receptors composed of NR1 and NR2D subunits (IC50 = 76 μM) or NR1 and NR2C subunits (IC50 = 29 μM) have been shown to be more than 100-fold less sensitive to ifenprodil than human NR1/NR2B receptors (IC50 = 0.114 μM; Hess et al. 1998). Ifenprodil has therefore been used as a tool to identify native NR2B-containing receptors in hippocampus (Kirson et al. 1999), cerebellum (Misra et al. 2000) and spinal cord dorsal (Momiyama, 2000) and ventral (Abdrachmanova et al. 2000) horn. In this study, ifenprodil inhibition had an approximate IC50 of 0.33 μM which is consistent with NR2B subunits being part of the high conductance receptors.
The apparently smaller effect of ifenprodil on patches displaying both high and low conductance channels was due to a lack of effect of ifenprodil on the low conductance channel activity as illustrated in Fig. 5 since the effect of ifenprodil on high conductance channels was consistent, whether or not those channels occur in patches displaying only high conductance, or high and low conductance channel activity. This supports the idea that in patches showing only high conductance channels, 42 and 50 pS openings are due to a population of ifenprodil-sensitive (NR2B subunit-containing) receptors. In patches displaying both high and low-conductance activity ifenprodil clearly reduced the number of 50 and 42 pS openings but produced no clear change in the numbers of lower conductance (33 and 17 pS) events (Fig. 5A and C and Fig. 10). However, these events only account for a small percentage of openings in the data record and so effects of ifenprodil on the frequency of low conductance events are more difficult to quantify.
Effects of ifenprodil on channel open times
In addition to reducing the number of large conductance events, ifenprodil also reduced the mean open time of the large conductance channels. Ifenprodil significantly reduced the duration of 50, 42 and 33 pS openings but did not affect the duration of the 17 pS openings (Fig. 10). These results are consistent with the idea that large conductance 50 pS channel openings (and a proportion of 42 and 33 pS openings) are produced by NMDA receptors containing NR2B subunits while receptors generating 17 pS openings are not sensitive to ifenprodil. This does not exclude the possibility however, that when receptors are in an active conformation that can produce 17 pS openings, that conformation has a low affinity for ifenprodil.
Direct transitions between conductance levels
Direct transitions between the shut and all identified open-channel current levels were analysed as well as direct transitions between open levels. In general, where direct transitions between two open levels occur, this strongly suggests that those open levels result from activity of a single receptor molecule. Absence of direct transitions between two current levels, however, cannot be taken to mean that the two current levels are not due to activation of a single type of receptor since it may be that the receptor simply gates in a way which means there is always a closed state between the two open states. Thus identification of direct transitions between conductance levels can be valuable in estimating the number of different channel types present in patches where channel openings to more than one conductance level are observed. In addition, for recombinant receptors, the frequency of transitions between the 17 and 35 pS levels for NR1/NR2D receptors (Wyllie et al. 1996) compared with the frequency of transitions between 19 and 36 pS levels for NR1/NR2C receptors (Stern et al. 1992) provides a fingerprint to distinguish between NMDA receptors containing NR2C and NR2D subunits: for NR2C-containing receptors the frequency of transitions from 19-36 pS levels is equal to the frequency of transitions from 36-19 pS levels (Wyllie et al. 1996) whereas for NR2D containing receptors, 17-35 pS transitions are less common than 35-17 pS transitions (Wyllie et al. 1996). This ‘asymmetry’ of direct transitions between conductance levels with 40 % of transitions being from 17-35 pS and 60 % being from 35-17 pS is unique to NR2D-containing receptors (Wyllie et al. 1996) and has been used in a number of studies to identify native NR2D-containing receptors (Farrant et al. 1994; Momiyama et al. 1996; Misra et al. 2000). We observe also that there was an asymmetry (Fig. 6) between the frequency of direct transition to and from the 17 pS conductance level suggesting that NR2D subunits are present in P0 hippocampal NMDA receptors. We also observe that when the data are analysed for direct transitions between three consecutive conductance levels, direct transitions linking 50, 42 and 17 pS levels were never observed suggesting (although not proving) that either 50 and 17 pS openings are due to distinct NMDA receptors or that the receptor gates in such a way that 17 and 50 pS openings always occur separated by channel closings.
Identification of receptor subtypes by analysis of receptor activations
In principle, as the agonist concentration is lowered the frequency of individual NMDA receptor activations will fall to the point where individual receptor activations will be separated by long closed periods in the single-channel record. An ‘activation’ is defined here as the time from the start of the first opening after agonist binding to the receptor until the end of the opening which is followed by agonist dissociation (see also Gibb & Colquhoun, 1992; Wyllie et al. 1998). Within a single NMDA receptor activation, Gibb & Colquhoun (1992) identified short groups of openings referred to as bursts, which were themselves grouped together in clusters of bursts. Within a single activation, several clusters of bursts may occur, the whole activation being referred to as a ‘super-cluster’ (Gibb & Colquhoun, 1992; Wyllie et al. 1998). The duration of adult hippocampal super-clusters (90 ± 17 ms) and the open probability within a super-cluster (0.2 ± 0.05) are consistent with independent estimates of the duration of NMDA receptor activations in response to glutamate and glycine in cultured hippocampal neurones (Lester et al. 1990; Lester & Jahr, 1992; Benveniste & Mayer, 1995; Dzubay & Jahr, 1996) and the likely open probability within an activation of around 0.2 (Jahr, 1992; Benveniste & Mayer, 1995; Rosenmund et al. 1995; Dzubay & Jahr, 1996). Different NMDA receptor subtypes have different durations of activation dependent both on the NR2 subunit (Monyer et al. 1994; Vicini et al. 1998; Wyllie et al. 1998) and on the NR1 subunit splice variant (Rumbaugh et al. 2000) and different open probability within an activation (Wyllie et al. 1998; Chen et al. 1999). Where the first latencies are relatively short (Jahr, 1992; Benveniste & Mayer, 1995; Dzubay & Jahr, 1996) the duration of the receptor activation will dominate the time course of NMDA receptor-mediated synaptic currents (Lester et al. 1990). The characteristics of receptor activations recorded in isolated patches can therefore be used to infer both the possible molecular makeup of receptors expressed by the cell and the potential characteristics of NMDA receptor-mediated synaptic currents in the cell.
In this study we observed long super-cluster activations characteristic of NMDA receptor single-channel currents observed in a number of different native and recombinant systems. The quantitative details of these activations provides further indications of receptor subunit composition and also some paradoxes. In particular, the deactivation time course of recombinant NR1a/NR2B receptors activated by glutamate (Monyer et al. 1994; Vicini et al. 1998; Rumbaugh et al. 2000) suggests that the durations of single-channel activations for NR1a/NR2B receptors are of the order of 300-600 ms while both macroscopic (Monyer et al. 1994; Vicini et al. 1998; Wyllie et al. 1998) and single-channel measurements (Wyllie et al. 1998) suggest that the duration of NR1a/NR2D receptor activations are of the order of 1.5-5 s. However, in this study, patches displaying only high conductance channel openings activated by glutamate, that were sensitive to ifenprodil (1 μM), had a mean super-cluster duration of 1.5 s and a low super-cluster Popen of 0.04 equivalent to that of NR1a/NR2D activations (Wyllie et al. 1998) but also similar to the Popen of 0.07 estimated from MK-801 block of macroscopic currents by Chen et al. (1999) for NR1a/NR2B receptors. Thus, in P0 hippocampal granule cells NMDA receptors generating high conductance channel activity have an unusually long activation length and low Popen, more characteristic of low-conductance NR2D subunit-containing receptors.
Kinetic effects of the NR1 subunit splice variant
It is clear from the work of Rumbaugh et al. (2000) and Vicini et al. (1998) that the NR1a splice variant prolongs NR2B receptor deactivation. At P0, the NR1 splice variants which lack exon 5 are expressed in the hippocampous: NR1-1a, NR1-2a and NR1-4a plus the NR2B and NR2D subunits (Laurie & Seeburg, 1994; Monyer et al. 1994; Wenzel et al. 1996, 1997). In adult dentate gyrus, the NR3B subunit (Andersson et al. 2001) has been detected but it is not known if this is present at birth. The mean deactivation times estimated for recombinant NR1a/NR2B receptors by Rumbaugh et al. (603 ms for patches and 745 ms for whole cells) and Vicini et al. (342 ms) are considerably shorter than the mean super-cluster duration observed in this study (1452 ms). It is complicated to compare these measurements. The weighted mean of the exponential components in the super-cluster distribution cannot be directly equated to the weighted mean of the exponential components in the deactivation time course (see e.g. Wyllie et al. 1998). However, as illustrated by Wyllie et al. the time course of the macroscopic response will tend to be dominated by the slowest component of the super-cluster distribution with the macroscopic response always being slower than the mean super-cluster length. Hence, in the case of recombinant NR2D receptors, the weighted mean of the super-cluster distribution components of 1602 ms includes several exponential components of which the slowest has a time constant on average of 5174 ms. The decay of the macroscopic current in response to a pulse of glutamate though is well fitted by a single exponential of time constant 4408 ms on average.
We speculate that the NMDA receptors in patches showing both high and low conductance channel activity could have the pharmacological properties (ifenprodil sensitivity) and channel conductance of NR2B subunit-containing receptors, but still have the kinetic properties of NR2D subunit-containing receptors if, like the NR1/NR2A/NR2D triheteromer described by Cheffings & Colquhoun (2000) an NR1/NR2B/NR2D triheteromer can increase the apparent glycine affinity of the receptor and generate activations intermediate in duration between NR2B and NR2D receptors. Such a profile may be possible if a high glutamate affinity NR2D subunit within the receptor can dominate the channel kinetics even in the presence of an ifenprodil-sensitive NR2B subunit which leads to high conductance channel openings. Such a possibility is not without precedent. For example, the edited form of GluR-2 dominates the channel properties of heteromeric AMPA receptors (see e.g. Dingledine et al. 1999 for review).
Conclusions
We consider the following concerning the subunit composition of NMDA receptors in new-born rat hippocampal granule cells. By analogy with AMPA receptors (Rosenmund et al. 1998), NMDA receptors may be tetramers consisting of two NR1 subunits providing the glycine binding site, and two NR2 subunits providing the agonist glutamate or NMDA binding site. One possibility is that a mixed population of receptors exists in granule cells of composition NR12/NR2B2 and NR12/NR2D2 accounting for the fact that some patches show only high conductance, ifenprodil-sensitive channel activity, while other patches show both high and low conductance channel activity with asymmetric transition frequencies linking higher conductance levels with the 17 pS conductance level consistent with the presence of NR2D subunit-containing receptors. However, we would also expect to see some patches with only low conductance channel activity (depending on the relative density of NR2B and NR2D subunit-containing receptors). In fact all patches investigated displayed some high conductance 50 pS openings. It is noticeable that low conductance (17 pS) channel activity occurs in association with 42 pS channel openings (see e.g. Fig. 12A) and the most common direct transitions involving the 17 pS conductance level are with the 42 pS conductance level rather than a conductance level close to 35 pS as expected from studies of recombinant NR2D receptors (Wyllie et al. 1996). On the other hand, amplitude stability plots (Fig. 12) show a greater spread of sub-conductance level openings (42 and 33 pS levels) associated with periods of high conductance (50 pS) openings. The presence of direct transitions between 33 pS openings and higher conductance openings is reminiscent of the behaviour of a putative NR1/NR2A/NR2D triheteromeric receptor described by Cheffings & Colquhoun (2000). Could the hippocampal granule cells be expressing an NR12/NR2B/NR2D receptor? This would be consistent with the presence of high conductance, ifenprodil-sensitive openings with long duration, low open probability super-clusters as well as with the presence of low conductance openings with asymmetrical direct transition frequencies. However such activity from a single type of receptor requires postulation that some mechanism exists that can switch between high and low conductance gating modes (with concomitant switching between high and low ifenprodil sensitivity since the frequency of low conductance openings was largely unaffected by ifenprodil). This switch in gating modes, apparently reduces the receptor sensitivity to ifenprodil such that the low conductance activity is not affected. Such a mechanism seems possible given that the behaviour of the channel conductance in long duration recordings (Fig. 12) is inconsistent with random activation of independent high conductance and low conductance receptors. We therefore conclude that NMDA receptors in P0 hippocampal granule cells may be a mixture of NR1/NR2B diheteromers and receptors composed of NR1, NR2B and NR2D subunits.
Acknowledgments
This work was supported by the MRC and Wellcome Trust. J.P.-C. was supported by the Venezuelan Consejo Nacional de Investigaciones Cientificas y Tecnologicas.
REFERENCES
- Abdrachmanova G, Teisinger J, Vlachova V, Vyklicky L., Jr Molecular and functional properties of synaptically activated NMDA receptors in neonatal motoneurons in rat spinal cord slices. European Journal of Neuroscience. 2000;12:955–963. doi: 10.1046/j.1460-9568.2000.00989.x. [DOI] [PubMed] [Google Scholar]
- Andersson O, Stenqvist A, Attersand A, von Euler G. Nucleotide sequence, genomic organization, and chromosomal localization of genes encoding the human NMDA receptor subunits NR3A and NR3B. Genomics. 2001;78:178–184. doi: 10.1006/geno.2001.6666. [DOI] [PubMed] [Google Scholar]
- Benveniste M, Mayer ML. Trapping of glutamate and glycine during open channel block of rat hippocampal neuron NMDA receptors by 9-aminoacridine. Journal of Physiology. 1995;483:367–384. doi: 10.1113/jphysiol.1995.sp020591. [DOI] [PMC free article] [PubMed] [Google Scholar]
- Bliss TV, Collingridge GL. A synaptic model of memory: long-term potentiation in the hippocampus. Nature. 1993;361:31–39. doi: 10.1038/361031a0. [DOI] [PubMed] [Google Scholar]
- Cameron HA, McEwen BS, Gould E. Regulation of adult neurogenesis by excitatory input and NMDA receptor activation in the dentate gyrus. Journal of Neuroscience. 1995;15:4687–4692. doi: 10.1523/JNEUROSCI.15-06-04687.1995. [DOI] [PMC free article] [PubMed] [Google Scholar]
- Chazot PL, Stephenson FA. Molecular dissection of native mammalian forebrain NMDA receptors containing the NR1 C2 exon: direct demonstration of NMDA receptors comprising NR1, NR2A, and NR2B subunits within the same complex. Journal of Neurochemistry. 1977;69:2138–2144. doi: 10.1046/j.1471-4159.1997.69052138.x. [DOI] [PubMed] [Google Scholar]
- Cheffings CM, Colquhoun D. Single channel analysis of a novel NMDA channel from Xenopus oocytes expressing recombinant NR1a, NR2A and NR2D subunits. Journal of Physiology. 2000;526:481–491. [PubMed] [Google Scholar]
- Chen N, Luo T, Raymond LA. Subtype-dependence of NMDA receptor channel open probability. Journal of Neuroscience. 1999;19:6844–6854. doi: 10.1523/JNEUROSCI.19-16-06844.1999. [DOI] [PMC free article] [PubMed] [Google Scholar]
- Choi DW. Excitotoxic cell death. Journal of Neurobiology. 1992;23:1261–1276. doi: 10.1002/neu.480230915. [DOI] [PubMed] [Google Scholar]
- Collingridge GL, Herron CE, Lester RA. Synaptic activation of N-methyl-d-aspartate receptors in the Schaffer collateral-commissural pathway of rat hippocampus. Journal of Physiology. 1988;399:283–300. doi: 10.1113/jphysiol.1988.sp017080. [DOI] [PMC free article] [PubMed] [Google Scholar]
- Collingridge GL, Watkins JC. The NMDA Receptor. 2. Oxford: Oxford University Press; 1994. [Google Scholar]
- Colquhoun D, Sakmann B. Fast events in single-channel currents activated by acetylcholine and its analogues at the frog muscle end-plate. Journal of Physiology. 1985;369:501–557. doi: 10.1113/jphysiol.1985.sp015912. [DOI] [PMC free article] [PubMed] [Google Scholar]
- Colquhoun D, Sigworth FJ. Fitting and statistical analysis of single-channel records. In: Sakmann B, Neher E, editors. Single-Channel Recording. 2. New York: Plenum Press; 1995. pp. 483–587. [Google Scholar]
- Constantine-Paton M, Cline HT. LTP and activity-dependent synaptogenesis: the more alike they are, the more different they become. Current Opinion in Neurobiology. 1998;8:139–148. doi: 10.1016/s0959-4388(98)80017-2. [DOI] [PubMed] [Google Scholar]
- Cull-Candy S, Brickley S, Farrant M. NMDA receptor subunits: diversity, development and disease. Current Opinion in Neurobiology. 2001;11:327–335. doi: 10.1016/s0959-4388(00)00215-4. [DOI] [PubMed] [Google Scholar]
- Cull-Candy SG, Brickley SG, Misra C, Feldmeyer D, Momiyama A, Farrant M. NMDA receptor diversity in the cerebellum: identification of subunits contributing to functional receptors. Neuropharmacology. 1998;37:1369–1380. doi: 10.1016/s0028-3908(98)00119-1. [DOI] [PubMed] [Google Scholar]
- Dingledine R, Borges K, Bowie D, Traynelis SF. The glutamate receptor ion channels. Pharmacological Reviews. 1999;51:7–61. [PubMed] [Google Scholar]
- Dunah AW, Luo J, Wang YH, Yasuda RP, Wolfe BB. Subunit composition of N-methyl-d-aspartate receptors in the central nervous system that contain the NR2D subunit. Molecular Pharmacology. 1998;53:429–437. doi: 10.1124/mol.53.3.429. [DOI] [PubMed] [Google Scholar]
- Durand GM, Kovalchuk Y, Konnerth A. Long-term potentiation and functional synapse induction in developing hippocampus. Nature. 1996;381:71–75. doi: 10.1038/381071a0. [DOI] [PubMed] [Google Scholar]
- Edwards FA, Konnerth A, Sakmann B, Takahashi T. A thin slice preparation for patch clamp recordings from neurones of the mammalian central nervous system. Pflügers Archiv. 1989;414:600–612. doi: 10.1007/BF00580998. [DOI] [PubMed] [Google Scholar]
- Dzubay JA, Jahr CE. Kinetics of NMDA channel opening. Journal of Neuroscience. 1996;16:4129–4134. doi: 10.1523/JNEUROSCI.16-13-04129.1996. [DOI] [PMC free article] [PubMed] [Google Scholar]
- Farrant M, Feldmeyer D, Takahashi T, Cull-Candy SG. NMDA-receptor channel diversity in the developing cerebellum. Nature. 1994;368:335–339. doi: 10.1038/368335a0. [DOI] [PubMed] [Google Scholar]
- Feldmeyer D, Cull-Candy S. Functional consequences of changes in NMDA receptor subunit expression during development. Journal of Neurocytology. 1996;25:857–867. doi: 10.1007/BF02284847. [DOI] [PubMed] [Google Scholar]
- Gibb AJ, Colquhoun D. Glutamate activation of a single NMDA receptor-channel produces a cluster of channel openings. Proceedings of the Royal Society B. 1991;243:39–45. doi: 10.1098/rspb.1991.0007. [DOI] [PubMed] [Google Scholar]
- Gibb AJ, Colquhoun D. Activation of NMDA receptors by l-glutamate in cells dissociated from adult rat hippocampus. Journal of Physiology. 1992;456:143–179. doi: 10.1113/jphysiol.1992.sp019331. [DOI] [PMC free article] [PubMed] [Google Scholar]
- Gibb AJ, Edwards FA. Patch clamp recording from cells in sliced tissues. In: Ogden DC, editor. Microelectrode Techniques, The Plymouth Workshop Handbook. 2. Cambridge, UK: Company of Biologists; 1994. pp. 255–274. [Google Scholar]
- Hess SD, Daggett LP, Deal C, Lu CC, Johnson EC, Velicelebi G. Functional characterization of human N-methyl-d-aspartate subtype 1A/2D receptors. Journal of Neurochemistry. 1998;70:1269–1279. doi: 10.1046/j.1471-4159.1998.70031269.x. [DOI] [PubMed] [Google Scholar]
- Howe JH, Cull-Candy SG, Colquhoun D. Currents through single glutamate receptor channels in outside-out patches from rat cerebellar granule cells. Journal of Physiology. 1991;432:143–202. doi: 10.1113/jphysiol.1991.sp018381. [DOI] [PMC free article] [PubMed] [Google Scholar]
- Jahr CE. High probability opening of NMDA receptor channels by l-glutamate. Science. 1992;255:470–472. doi: 10.1126/science.1346477. [DOI] [PubMed] [Google Scholar]
- Kaul M, Garden GA, Lipton SA. Pathways to neuronal injury and apoptosis in HIV-associated dementia. Nature. 2001;410:988–994. doi: 10.1038/35073667. [DOI] [PubMed] [Google Scholar]
- Kew JN, Trube G, Kemp JA. A novel mechanism of activity-dependent NMDA receptor antagonism describes the effect of ifenprodil in rat cultured cortical neurones. Journal of Physiology. 1996;497:761–772. doi: 10.1113/jphysiol.1996.sp021807. [DOI] [PMC free article] [PubMed] [Google Scholar]
- Kirson ED, Schirra C, Konnerth A, Yaari Y. Early postnatal switch in magnesium sensitivity of NMDA receptors in rat CA1 pyramidal cells. Journal of Physiology. 1999;521:99–111. doi: 10.1111/j.1469-7793.1999.00099.x. [DOI] [PMC free article] [PubMed] [Google Scholar]
- Koh D-S, Geiger JRP, Jonas P, Sakmann B. Ca2+-permeable AMPA and NMDA receptor channels in basket cells of rat hippocampal dentate gyrus. Journal of Physiology. 1995;485:383–402. doi: 10.1113/jphysiol.1995.sp020737. [DOI] [PMC free article] [PubMed] [Google Scholar]
- Komuro H, Rakic P. Modulation of neuronal migration by NMDA receptors. Science. 1993;260:95–97. doi: 10.1126/science.8096653. [DOI] [PubMed] [Google Scholar]
- Laurie DJ, Seeburg PH. Regional and developmental heterogeneity in splicing of the rat brain NMDAR1 mRNA. Journal of Neuroscience. 1994;14:3180–3194. doi: 10.1523/JNEUROSCI.14-05-03180.1994. [DOI] [PMC free article] [PubMed] [Google Scholar]
- Leinekugel X, Medina I, Khalilov I, Ben-Ari Y, Khazipov R. Ca2+ oscillations mediated by the synergistic excitatory actions of GABAA and NMDA receptors in the neonatal hippocampus. Neuron. 1997;18:243–250. doi: 10.1016/s0896-6273(00)80265-2. [DOI] [PubMed] [Google Scholar]
- Leinekugel X, Medina I, Khalilov I, Ben-Ari Y, Khazipov R. Ca2+ oscillations mediated by the synergistic excitatory actions of GABA(A) and NMDA receptors in the neonatal hippocampus. Neuron. 1997;18:243–255. doi: 10.1016/s0896-6273(00)80265-2. [DOI] [PubMed] [Google Scholar]
- Lester RA, Clements JD, Westbrook GL, Jahr CE. Channel kinetics determine the time course of NMDA receptor-mediated synaptic currents. Nature. 1990;346:565–567. doi: 10.1038/346565a0. [DOI] [PubMed] [Google Scholar]
- Lester RA, Jahr CE. NMDA channel behavior depends on agonist affinity. Journal of Neuroscience. 1992;12:635–643. doi: 10.1523/JNEUROSCI.12-02-00635.1992. [DOI] [PMC free article] [PubMed] [Google Scholar]
- Lynch DR, Gallagher MJ, Lenz SJ, Anegawa NJ, Grant EL. Pharmacology of recombinant NMDA receptors. In: Monaghan DT, Wenthold RJ, editors. The Ionotropic Glutamate Receptors. Totowa, NJ, USA: Humana Press Inc.; 1997. pp. 325–347. [Google Scholar]
- McManus OB, Blatz AL, Magleby KL. Sampling. log binning, fitting, and plotting durations of open and shut intervals from single channels and the effects of noise. Pflügers Archiv. 1987;410:530–553. doi: 10.1007/BF00586537. [DOI] [PubMed] [Google Scholar]
- Misra C, Brickley SG, Wyllie DJ, Cull-Candy SG. Slow deactivation kinetics of NMDA receptors containing NR1 and NR2D subunits in rat cerebellar Purkinje cells. Journal of Physiology. 2000;525:299–305. doi: 10.1111/j.1469-7793.2000.t01-1-00299.x. [DOI] [PMC free article] [PubMed] [Google Scholar]
- Momiyama A. Distinct synaptic and extrasynaptic NMDA receptors identified in dorsal horn neurones of the adult rat spinal cord. Journal of Physiology. 2000;523:621–628. doi: 10.1111/j.1469-7793.2000.t01-1-00621.x. [DOI] [PMC free article] [PubMed] [Google Scholar]
- Momiyama A, Feldmeyer D, Cull-Candy SG. Identification of a native low-conductance NMDA channel with reduced sensitivity to Mg2+ in rat central neurones. Journal of Physiology. 1996;494:479–492. doi: 10.1113/jphysiol.1996.sp021507. [DOI] [PMC free article] [PubMed] [Google Scholar]
- Monaghan DT, Buller AL, Andaloro VJ. On the molecular basis of NMDA receptor diversity. In: Monaghan DT, Wenthold RJ, editors. The Ionotropic Glutamate Receptors. Totowa, NJ, USA: Humana Press Inc.; 1997. pp. 349–372. [Google Scholar]
- Monaghan DT, Olverman HJ, Nguyen L, Watkins JC, Cotman CW. Two classes of N-methyl-d-aspartate recognition sites: differential distribution and differential regulation by glycine. Proceedings of the National Academy of Sciences of the USA. 1988;85:9836–9840. doi: 10.1073/pnas.85.24.9836. [DOI] [PMC free article] [PubMed] [Google Scholar]
- Monyer H, Burnashev N, Laurie DJ, Sakmann B, Seeburg PH. Developmental and regional expression in the rat brain and functional properties of four NMDA receptors. Neuron. 1994;12:529–540. doi: 10.1016/0896-6273(94)90210-0. [DOI] [PubMed] [Google Scholar]
- Mott DD, Doherty JJ, Zhang S, Washburn MS, Fendley MJ, Lyuboslavsky P, Traynelis SF, Dingledine R. Phenylethanolamines inhibit NMDA receptors by enhancing proton inhibition. Nature Neuroscience. 1998;1:659–667. doi: 10.1038/3661. [DOI] [PubMed] [Google Scholar]
- Nase G, Weishaupt J, Stern P, Singer W, Monyer H. Genetic and epigenetic regulation of NMDA receptor expression in the rat visual cortex. European Journal of Neuroscence. 1999;11:4320–4326. doi: 10.1046/j.1460-9568.1999.00859.x. [DOI] [PubMed] [Google Scholar]
- Okabe S, Collin C, Auerbach JM, Meiri N, Bengzon J, Kennedy MB, Segal M, McKay RD. Hippocampal synaptic plasticity in mice overexpressing an embryonic subunit of the NMDA receptor. Journal of Neuroscience. 1998;18:4177–4188. doi: 10.1523/JNEUROSCI.18-11-04177.1998. [DOI] [PMC free article] [PubMed] [Google Scholar]
- Rosenmund C, Feltz A, Westbrook GL. Synaptic NMDA receptor channels have a low open probability. Journal of Neuroscience. 1995;15:2788–2795. doi: 10.1523/JNEUROSCI.15-04-02788.1995. [DOI] [PMC free article] [PubMed] [Google Scholar]
- Rosenmund C, Stern-bach Y, Stevens CF. The tetrameric structure of a glutamate receptor channel. Science. 1998;280:1596–1599. doi: 10.1126/science.280.5369.1596. [DOI] [PubMed] [Google Scholar]
- Rumbaugh G, Prybylowski K, Wang JF, Vicini S. Exon 5 and spermine regulate deactivation of NMDA receptor subtypes. Journal of Neurophysiology. 2000;83:1300–1306. doi: 10.1152/jn.2000.83.3.1300. [DOI] [PubMed] [Google Scholar]
- Sheng M, Cummings J, Roldan LA, Jan YN, Jan LY. Changing subunit composition of heteromeric NMDA receptors during development of rat cortex. Nature. 1994;368:144–147. doi: 10.1038/368144a0. [DOI] [PubMed] [Google Scholar]
- Sigworth FJ, Sine SM. Data transformations for improved display and fitting of single-channel dwell time histograms. Biophysical Journal. 1987;52:1047–1054. doi: 10.1016/S0006-3495(87)83298-8. [DOI] [PMC free article] [PubMed] [Google Scholar]
- Stern P, Behe P, Schoepfer R, Colquhoun D. Single channel conductances of NMDA receptors expressed from cloned cDNAs: comparison with native receptors. Proceedings of the Royal Society B. 1992;250:271–277. doi: 10.1098/rspb.1992.0159. [DOI] [PubMed] [Google Scholar]
- Stern P, Behe P, Schoepfer R, Colquhoun D. Single channel kinetics of recombinant NMDA receptors. Journal of Physiology. 1993;473:48P. [Google Scholar]
- Stern P, Cik M, Colquhoun D, Stephenson FA. Single channel properties of cloned NMDA receptors in a human cell line: comparison with results from Xenopus oocytes. Journal of Physiology. 1994;476:391–397. doi: 10.1113/jphysiol.1994.sp020140. [DOI] [PMC free article] [PubMed] [Google Scholar]
- Strecker GJ, Jackson MB, Dudek FE. Blockade of NMDA-activated channels by magnesium in the immature rat hippocampus. Journal of Neurophysiology. 1994;72:1538–1548. doi: 10.1152/jn.1994.72.4.1538. [DOI] [PubMed] [Google Scholar]
- Vicini S, Wang JF, Li JH, Zhu WJ, Wang YH, Luo JH, Wolfe BB, Grayson DR. Functional and pharmacological differences between recombinant N-methyl-d-aspartate receptors. Journal of Neurophysiology. 1998;79:555–566. doi: 10.1152/jn.1998.79.2.555. [DOI] [PubMed] [Google Scholar]
- Vicini S, Wang JF, Li JH, Zhu WJ, Wang YH, Luo JH, Wolfe BB, Grayson DR. Functional and pharmacological differences between recombinant N-methyl -d- aspartate receptors. Journal of Neurophysiology. 1998;79:555–566. doi: 10.1152/jn.1998.79.2.555. [DOI] [PubMed] [Google Scholar]
- Weiss DS, Magleby KL. Gating scheme for single GABA-activated Cl− channels determined from stability plots, dwell-time distributions, and adjacent-interval durations. Journal of Neuroscience. 1989;9:1314–1324. doi: 10.1523/JNEUROSCI.09-04-01314.1989. [DOI] [PMC free article] [PubMed] [Google Scholar]
- Wenzel A, Fritschy JM, Mohler H, Benke D. NMDA receptor heterogeneity during postnatal development of the rat brain: differential expression of the NR2A, NR2B, and NR2C subunit proteins. Journal of Neurochemistry. 1997;68:469–478. doi: 10.1046/j.1471-4159.1997.68020469.x. [DOI] [PubMed] [Google Scholar]
- Wenzel A, Villa M, Mohler H, Benke D. Developmental and regional expression of NMDA receptor subtypes containing the NR2D subunit in rat brain. Journal of Neurochemistry. 1996;66:1240–1248. doi: 10.1046/j.1471-4159.1996.66031240.x. [DOI] [PubMed] [Google Scholar]
- Williams K. Ifenprodil discriminates subtypes of the N-methyl-d-aspartate receptor: selectivity and mechanisms at recombinant heteromeric receptors. Molecular Pharmacology. 1993;44:851–859. [PubMed] [Google Scholar]
- Woolf CJ, Salter MW. Neuronal plasticity: increasing the gain in pain. Science. 2000;288:1765–1769. doi: 10.1126/science.288.5472.1765. [DOI] [PubMed] [Google Scholar]
- Wyllie DJ, Behé P, Colquhoun D. Single-channel activations and concentration jumps: comparison of recombinant NR1a/NR2A and NR1a/NR2D NMDA receptors. Journal of Physiology. 1998;510:1–18. doi: 10.1111/j.1469-7793.1998.001bz.x. [DOI] [PMC free article] [PubMed] [Google Scholar]
- Wyllie DAJ, Behé P, Nassar M, Schoepfer R, Colquhoun D. Single channel currents from recombinant NMDA NR1a/NR2D receptors expressed in Xenopus oocytes. Proceedings of the Royal Society B. 1996;263:1079–1086. doi: 10.1098/rspb.1996.0159. [DOI] [PubMed] [Google Scholar]