

Abstract
Synchronous discharges between a pair of concurrently active motoneurones are thought to arise from the spike-triggering effects of synaptic inputs shared by the pair. Although there are a number of quantitative indices that have been developed to estimate the strength of this common input, there is still some debate as to whether motoneurone discharge rate affects the values of these indices. The aim of the present study was to test the effects of motoneurone discharge rate on these synchronization indices using known common inputs. To achieve this aim we elicited repetitive discharge in rat hypoglossal motoneurones by combining a suprathreshold injected current step with superimposed noise to mimic the synaptic drive likely to occur during physiological activation. The amplitude of the current step was varied in different trials to achieve discharge rates from 5 to 22 Hz. We first examined the effect of discharge rate on the spike-triggering efficacy of individual EPSPs. Motoneurones were more responsive to large EPSPs delivered at a low rate when their background discharge rate was relatively low and the probability of the EPSPs evoking an extra spike decreased with increasing discharge rate. However, the opposite dependence was found for small, high-frequency EPSPs. We then compared the discharge records obtained in several trials in which the same EPSP train was applied repeatedly to the same cell firing at different background discharge rates. The effect of this ‘common input’ on motoneurone discharge probability was determined by compiling cross-correlation histograms (CCHists) between the discharges of the same cell at different times. The common inputs induced synchronous discharge that gave rise to large central peaks in the CCHists. The relationship between the discharge rate and the level of synchronization changed depending on the synchronization indices used and the amplitude of the common EPSPs. When large EPSPs were used as the common input, the normalized probability of synchronous spikes declined as the discharge rate increased, regardless of the method of normalization used. In contrast, when the common input was composed of a large number of small EPSPs, similar to that likely to occur during physiological activation of motoneurones, different synchronization indices exhibited a positive, a negative or no dependence on the background discharge rate. Indices based on normalizing the number of synchronous spikes by either the number of discharges in the lower frequency train (E), or by the total number of discharges in both trains (S) showed no dependence on background discharge rate and therefore may be the most suitable for quantifying motoneurone synchrony over a range of background discharge rates.
During voluntary contractions in humans, there is a weak tendency for pairs of motor units in the same or synergist muscles to discharge within a few milliseconds of one another (cf. Farmer et al. 1997). This phenomenon has been termed ‘short-term synchrony’ and was originally conceived as a process derived from common excitatory inputs which branch widely to synapse on a high percentage of the motoneurones innervating the same and synergist muscles (Sears & Stagg, 1976). These common inputs increase the likelihood that an action potential in one motoneurone will be closely associated with the time of occurrence of action potentials in other motoneurones receiving the same inputs.
Motor unit synchrony is classically detected by cross-correlation analysis of the spike trains of pairs of motoneurones (Moore et al. 1966). Synchronous discharges give rise to a peak in the cross-correlation histogram (CCHist). The size of CCHist peak is thought to be related to the proportion of shared input (e.g. Datta & Stephens, 1990; Nordstrom et al. 1992) and its width may indicate whether or not the synchronizing input is derived from common input from branched presynaptic axons, synchronization of the discharge of presynaptic fibres (Kirkwood et al. 1982; Vaughan & Kirkwood, 1997) or whether the sign of the net common synchronizing current is excitatory or inhibitory (Türker & Powers, 2001a).
Since the number of synchronous discharges depends upon the total number of spikes in the two spike trains, a variety of methods have been used to normalize the number of synchronous counts (cf. Nordstrom et al. 1992). These include dividing by the number of spikes in one or both of the spike trains (Adams et al. 1989; Datta & Stephens, 1990), by the total counts in the histogram (Logigian et al. 1988), or by the number of counts expected due to chance (Ellaway & Murthy, 1985). The common purpose of these different methods of normalization is to derive an index of synchronization that provides a quantitative measure of the proportion of shared input that is independent of the background discharge rate of the two motor units. It has recently been claimed (Nordstrom et al. 1992) that the previously proposed methods of normalization fail to eliminate the dependence of the number of synchronous counts on background discharge rate. A new method of normalization was proposed that appeared to provide a quantitative index of shared input (common input strength, CIS) that is independent of background discharge. The underlying assumption of this new method of normalization is that the spike-triggering efficacy of an EPSP does not depend upon the background discharge rate. As a result, an unbiased estimate of the degree of common input can be obtained by dividing the number of extra counts in the cross-correlogram peak by the total duration of the trial, to obtain the frequency of synchronous spikes in excess of those expected by chance.
Although there is some experimental evidence from human studies supporting the notion that the spike-triggering efficacy of an EPSP is largely independent of the background discharge rate (Ashby & Zilm, 1982; Miles et al. 1989), other studies indicate an inverse dependence between EPSP efficacy and background discharge rate (Kudina, 1988; Jones & Bawa, 1995; Olivier et al. 1995). This latter result may be explained on the basis of the estimated interspike membrane trajectory that is thought to occur during the lowest voluntary discharge rates in human motoneurones. It has been proposed that under these conditions, there is a period in the interspike membrane trajectory over which the distance to the firing threshold stays constant (Türker, 1995; Matthews, 1996), and that the duration and the distance from threshold of this ‘plateau’ phase increases with decreases in discharge rate (Matthews, 1996). This model of interspike trajectories predicts a complex relationship between background excitatory drive and the spike-triggering efficacy of EPSPs that depends upon EPSP size (Matthews, 1999). For relatively large EPSPs, spike-triggering efficacy is predicted to decrease with increasing discharge rate over the range of discharge rates typically studied in voluntarily-activated human motor units (see Fig. 4 in Matthews, 1999).
An additional complicating factor in human studies is the possibility that changes in motor unit discharge rate produced by varying levels of voluntary drive may be associated with a change in the synaptic current produced by an afferent input. This could arise from alterations in presynaptic inhibition or interneuronal excitability produced either by changes in afferent activity resulting from increased muscle force or by changes in descending inputs resulting from increased effort.
The goals of the present study were to re-examine the effects of motoneurone discharge rate on: (1) the spike-triggering efficacy EPSPs; and (2) the ability of common EPSPs to synchronize motoneurone discharge. We produced tonic, repetitive discharge in rat hypoglossal motoneurones recorded in vitro by injecting a long current step with superimposed noise, and measured the effects of EPSPs on spike probability by applying large and small simulated EPSPs. Our results indicate that the relationship between background discharge rate and the spike-triggering efficacy of EPSPs depends upon EPSP amplitude and frequency. For large EPSPs delivered at a low-frequency, spike-triggering efficacy decreases with increasing discharge rate, whereas the opposite dependence is obtained for small EPSPs delivered at a high frequency. Similarly, the relationship between background discharge rate and motoneurone synchrony depends upon whether the common input to motoneurones is composed of small or large EPSPs and the frequency of the delivery of the EPSPs. For large EPSPs delivered at a low frequency, the degree of synchrony decreases with increasing discharge rate, whereas for small EPSPs delivered at a high frequency the dependence of synchronization strength on discharge rate depends upon which index of synchronization is used. Portions of these results have been presented in abstract form (Türker & Powers, 2001b).
METHODS
The basic surgical and experimental procedures we used to obtain intracellular recordings from rat hypoglossal motoneurones in vitro have recently been described in detail (Sawczuk et al. 1995, 1997; Poliakov et al. 1996, 1997), so only the main features of the protocols will be summarised here.
Experiments were carried out in accordance with the animal welfare guidelines in place at the University of Washington School of Medicine. Rat hypoglossal motoneurones were studied in 400 μm thick brainstem slices obtained from 18- to 24-day-old Sprague-Dawley rats. Following the induction of anaesthesia with an intramuscular injection of a mixture of ketamine (68 mg kg−1) and xylazine (4 mg kg−1), the animal was killed by decapitation. A section of brainstem was removed and glued to a Plexiglass tray filled with cooled, artificial cerebrospinal fluid in which Na+ had been replaced with sucrose (S-ACSF; composed of (mm): 220 sucrose, 2 KCl, 1.25 NaH2PO4, 26 NaHCO3, 2 MgCl2, 2 CaCl2 and 10 glucose). A series of transverse slices were cut throughout the length of the hypoglossal nucleus, transferred to a holding chamber and incubated at room temperature (19-21 °C) in S-ACSF for 30 min, followed by 30 min incubation in standard ACSF (the same as S-ACSF except that sucrose was replaced with 126 mm NaCl).
For the experimental recordings, the slices were submerged in a recording chamber and perfused with ACSF at a rate of 2 ml min−1. We used glass micropipettes filled with 3 m KCl (electrode resistance of 20-60 MΩ) to obtain intracellular recordings from hypoglossal motoneurones. Motoneurone identity was based on location and on the similarity of cell properties to those reported in previous studies (Haddad et al. 1990; Viana et al. 1993a, b; Sawczuk et al. 1995).
Recording and current injection techniques
Motoneurones were initially accepted for study if they exhibited resting potentials more negative than −60 mV and action potentials with positive overshoots. We performed the complete experimental protocol only on those motoneurones capable of producing sustained, repetitive discharge in response to long (35 s) suprathreshold current steps. Following impalement, we used steps of injected current to determine the motoneurone's input resistance, rheobase and steady-state current frequency relation (cf. Sawczuk et al. 1995). We then measured the motoneurone's response to a series of injected current waveforms consisting of suprathreshold current steps with superimposed noise and synaptic-like current transients. The waveforms were stored as sequences of digitized values and converted to a current command via a D-A converter at a rate of 10 kHz. The membrane potential was simultaneously sampled at the same rate and stored.
Stimulus waveforms
Repetitive discharge was elicited by 42 s injected current waveforms consisting of four components: a 35 s suprathreshold step, a 26 s ‘background’ noise waveform starting 5 s after the onset of the step, a 26 s current transient waveform, also starting 5 s after the step onset and two series of eight 1 ms, 1 nA hyperpolarizing current pulses applied before and after the current step (for details see Fig. 1 and Fig. 2 in Türker & Powers, 2001a). The background noise waveform was filtered Gaussion noise (time constant = 1 ms) with a zero mean amplitude, and a standard deviation of 0.0733 nA. The current transient waveforms consisted of series of alpha functions (Rall, 1967) designed to mimic excitatory postsynaptic currents (EPSCs). Two different EPSC waveforms were used. The first waveform (large, low-frequency EPSCs) was designed to mimic the effects of low-frequency, synchronous activation of a large population of excitatory afferent fibres (Türker & Powers, 1999), and consisted of a series of large, slowly rising transients (0.5 nA peak amplitude, 5 ms time to peak). The intervals between transients were uniformly distributed between 200 and 600 ms. The second waveform (small, high-frequency EPSCs) was composed by summing series of trains of brief transients designed to mimic the synaptic currents associated with asynchronous discharge in a set of presynaptic fibres. Individual transients had peak amplitudes of 0.24 nA and 0.5 ms rise times. The intervals between transients in each train were normally distributed with mean values ranging from 14 to 42 ms and coefficients of variation of 0.2. The standard deviation of this summed small EPSC signal was 0.103 nA, so that when combined with the background noise signal, this ‘common’ input signal accounted for about 65 % of the total variance. Thus, when two spike trains are elicited by the same common EPSC signal in combination with different background noise signals, this can be taken to represent two cells with 65 % shared input (cf. Binder & Powers, 2001).
The amplitude and the time course of the simulated excitatory postsynaptic potentials (EPSPs) produced by the EPSC train were calculated by convolving the current waveform with an estimate of the passive impulse response of the motoneurone. The passive impulse response was estimated from the average membrane response to the series of hyperpolarizing current pulses preceding and following the injected current step (cf. Türker & Powers, 1999).
Experimental protocol
The effects of the simulated EPSP train on motoneurone discharge probability were determined from a series of responses to the injected current waveforms described above. On a given series of trials the variance of the background noise waveform was the same but the actual sequence of values was varied between each trial by changing the seed to the random number generator. In contrast, the EPSP train remained the same for all trials. The variance of the background noise component together with that of the common input were chosen to produce interspike interval variability comparable to that seen in voluntarily activated human motoneurones (i.e. values of coefficient of variation that are typically in the range of 0.1 to 0.3; cf. Clamann, 1969; Nordstrom et al. 1992). Changing the background noise for each trial was essential to control the characteristics of the common input that would generate synchronous discharge (Türker & Powers, 2001a). Unless changed in each trial, the background noise also acts as a common input and hence induces extra synchronous activity.
This protocol provided a number of pairs of 26 s epochs of repetitive discharge that could be treated as simultaneous recordings from a pair of motoneurones sharing a fixed percentage of common input. The background discharge rate of the motoneurone was determined online by counting the number of spikes in each epoch. In different sets of trials the amplitude of the current step was varied to maintain three ranges of discharge rates: low (5-9 imp s−1), medium (10-14 imp s−1) and high (15-22 imp s−1).
Data analysis
In each cell, we obtained two different measures of the effects of the EPSP waveform on the cell's discharge. Using the times of the EPSPs as triggers, we calculated a peristimulus time histogram (PSTH) between the times of occurrence of the EPSP and the discharge of the cell. The motoneurone spike times were also used as triggers to calculate crosscorrelation histograms (CCHists) between the times of occurrence of motoneurone spikes in two different sets of trials.
For each background discharge rate, three repetitions of the injected input current waveform were used to compile one PSTH. We calculated CCHists between one set of epochs (usually 3 epochs) with approximately the same background discharge rate and another set of epochs with a different background discharge rate. However, when possible, we elicited two sets of epochs (6 epochs) with approximately the same background discharge rate so that we could correlate one discharge rate against another of the same rate. Typically there were either 198 or 16899 triggers for the PSTHs (number of EPSPs for low-frequency and high-frequency EPSP trains respectively) and from 886 to 3678 spikes (triggers) for each CCHist. Both PSTHs and CCHists were constructed to cover either ± 100 ms or ± 200 ms around the time of occurrence of the trigger/reference spike (1 ms binwidth).
The bin counts in the PSTHs and CCHists were converted to probabilities of spike occurrence by dividing the counts by the number of triggers. Cumulative sums (cusums; Ellaway, 1978) were computed by subtracting each bin count from that of the mean bin count over portions of the histogram away from the peak (all negative lags for the PSTHs and negative lags of more than −25 ms for the CCHists) and integrating the result (e.g. top traces in Fig. 1A and C). The areas of the PSTH and CCHist peaks were calculated from the difference between the maximum and minimum values of the cusum rise occurring at lags of between −10 and +10 ms. Peak durations were estimated from the difference in the lags at which the minimum and maximum values of the cusum rise occurred.
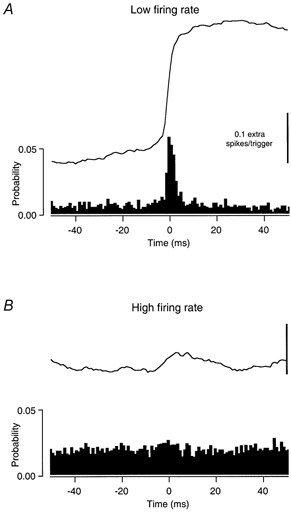
Figure 1. The effect of large amplitude, low-frequency EPSPs on single spike trains.
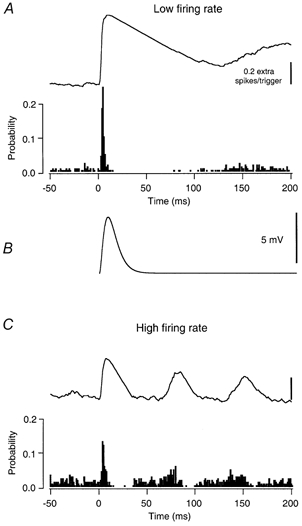
A, the spike-triggering effect of a large amplitude current transient on a motoneurone discharging at a low rate (5.8 imp s−1). The lower trace in this panel is the peristimulus time histogram (PSTH). The number of counts in each bin has been divided by the total number of current transients to give the probability of spike occurrence as a function of time from the onset of the current transient. The upper trace is the cumulative sum (cusum), calculated by subtracting the baseline counts at negative lags in the PSTH and integrating the remainder (see Methods). B, the estimated membrane potential change produced by the current transient (see Methods). The peak amplitude of the simulated EPSP in this cell is 5.6 mV. C, the effect of the same current transients on discharge probability when the cell was firing at a high rate (14.9 imp s−1).
The strength of synchronization was quantified using five different synchronization indices, based on either the total number of counts in the CCHist peak or the number of counts above those expected due to chance (extra counts): (1) k', the ratio of the total counts in the peak to the chance counts in that region (Ellaway and Murthy, 1985); (2) SI, the number of extra counts in the peak divided by the total number of counts in the CCHist (Logigian et al. 1988); (3) E, the extra counts divided by the number of spikes in the lower frequency spike train (Datta & Stephens, 1990); (4) S, the extra counts divided by the total number of spikes in both trains (Adams et al. 1989; Bremner et al. 1991); and (5) CIS, the extra counts divided by the duration of the trial (Nordstrom et al. 1992).
Statistical analysis
Linear regression analysis was used to test for the dependence of both the spike-triggering efficacy of EPSPs and the various synchronization indices on background discharge rate.
RESULTS
We obtained several 35 s epochs of repetitive discharge from eight rat hypoglossal motoneurones. The intrinsic properties of these cells were similar to those previously reported for rat hypoglossal motoneurones (e.g. Sawczuk et al. 1995): afterhyperpolarization (AHP) durations of 130-260 ms (mean = 160 ± 53 ms), mean input resistances of 14.2-38.5 MΩ (26.4 ± 8.9 MΩ) and time constants of 4.1-6.1 ms (4.9 ± 0.7 ms). In each cell, several epochs of repetitive discharge were obtained in response to repeated applications of a given input waveform. Usually, 30-50 epochs were recorded from a given cell and both EPSP trains (i.e. low-frequency, large EPSPs and high-frequency, small EPSPs, see Methods) were delivered at various background discharge rates.
The spike-triggering efficacy of EPSPs
Large, low-frequency EPSPs
The spike-triggering efficacy of EPSPs was quantified by calculating peristimulus time histograms (PSTHs) between the onset times of the EPSPs and the motoneurone spikes. The filled bars in Fig. 1A show a PSTH associated with a large EPSP (Fig. 1B) when the motoneurone was firing at a low rate (5.8 imp s−1). As previously reported (Fetz & Gustafsson, 1983; Türker & Powers, 1999), the occurrence of a large EPSP was associated with a sharp increase in motoneurone discharge probability, as evidenced by the peak in the PSTH and the associated rise in the cusum (top trace in Fig. 1A). The width of the PSTH peak (calculated as the time between the minimum and maximum cusum values) was 12 ms. (The peak widths for all the PSTHs obtained using large low-frequency EPSPs ranged from 8 to 13 ms (9.8 ± 1.7 ms)). The difference between the minimum and maximum cusum values in the area of the PSTH peak gives a measure of the increase in the probability of spike occurrence caused by the EPSP, which in this case was 0.633. For a given EPSP stimulus, changes in the background discharge rate of the motoneurone altered the probability of spike occurrence. This relationship is illustrated in Fig. 1 and Fig. 2A for the large, low-frequency EPSPs. Comparison of Fig. 1A and C shows that large EPSPs caused a larger increase in spike probability when the discharge rate of the cell was low (A). In this example the cell fired at 5.8 Hz (low firing rate, A) and at 14.9 Hz (high firing rate, C). The increase in spike probability caused by the same EPSP at the high firing rate was only about half that obtained when the background discharge rate of the same cell was lower (0.372 vs. 0.633).
Figure 2. Relationship between the spike-triggering probability of large EPSPs and background discharge rate in three cells.
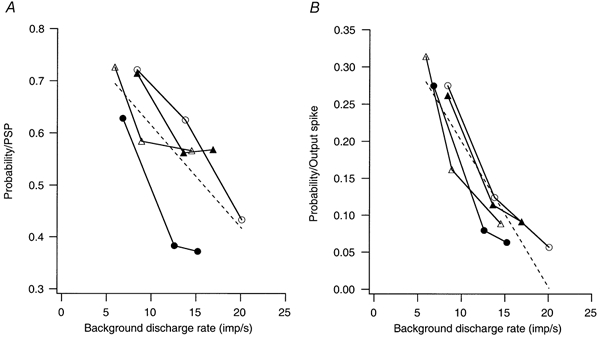
Each set of symbols indicates the relation between the background discharge rate of the cell and the spike-triggering probability of a given EPSP. The EPSP amplitudes in these cells were 7.5 mV (○), 5.6 mV (•), 8.9 mV (▵) and 11.1 mV (▴). (The effects of two different EPSP sizes (5.6 and 11.1 mV) were tested in one of the cells.) The dashed lines indicate the best linear fit to the entire data set. A, probability of spike-triggering normalized by the number of EPSPs. B, probability of spike-triggering normalized by the number of output spikes.
Figure 2A plots the spike-triggering efficacy of large EPSPs in three different cells, each tested at three different background discharge rates, and one tested with two different sized EPSPs. The EPSP amplitudes produced in these cells ranged from 5.6-11.1 mV. In all cases, spike-triggering efficacy was highest at the lowest discharge rate. In one cell (○), spike-triggering efficacy declined roughly linearly with increasing discharge rate, whereas in the other three cells, the largest decline in efficacy occurred between the lowest and intermediate discharge rates, with little or no further decline at the highest discharge rate. Overall, spike-triggering efficacy exhibited a significant negative linear relationship on the background discharge rate (dashed line, probability = 0.81 - 0.02 × rate, r = −0.697; P < 0.05). The mean firing rates in individual cells could also be normalized by dividing them by the reciprocal of that cell's AHP duration. Spike-triggering efficacy also exhibited a negative dependence on relative discharge rate, which was not statistically significant (r = −0.383, P = 0.22).
Most indices of synchronization normalize the number of synchronous spikes by some measure of the output spikes in one or both spike trains (see Introduction). As a result, the effect of common EPSPs on the value of these indices will depend upon their spike-triggering efficacy in relation to the number of output spikes. Figure 2B shows the number of advanced motoneurone spikes normalized by the total number of spikes rather than by the number of EPSPs. These values show an even stronger negative correlation with discharge rate (dashed line, probability = 0.40 - 0.0197 × rate, r = −0.905, P <.0001) than do the values normalized by the number of EPSPs. The probability values of Fig. 2B also showed a significant negative correlation with relative discharge rate (r = −0.61; P = 0.03).
The strong negative correlation between the probability of an advanced spike per output spike and discharge rate illustrated in Fig. 2B might seem to be a necessary consequence of the fact that the number of output spikes increases linearly with discharge rate. However, the exact form of this relationship depends upon the relation between the probability of an advanced spike per EPSP and the background discharge rate (Fig. 2A). If the spike-triggering efficacy of an EPSP is independent of discharge rate, as proposed by Nordstrom et al. (1992), then the form of the function in Fig. 2B should be hyperbolic. In contrast, if there is a steep, positive correlation between the spike-triggering efficacy of an EPSP and discharge rate (i.e. a twofold increase in probability for a twofold increase in rate), then spike-triggering probability normalized to output spikes would be independent of discharge rate.
Although we directly manipulated discharge rate by varying the mean level of the injected current, these changes in mean rate were generally associated with changes in interspike interval variability as also observed in data from voluntarily activated human motoneurones (cf. Matthews, 1996 and references therein). For the data set used in Fig. 2, the percentage coefficient of variation of the interspike intervals (100 × interval standard deviation/mean interval) exhibited a significant negative correlation on discharge rate (coefficient of variation = 52.16 - 2.33 × rate, r = −0.788, P < 0.01). As a result, both of the probability measures (i.e. probability per EPSP and probability per output spike) showed a significant positive correlation with discharge variability (r = 0.855, P < 0.001, and r = 0.932, P < 0.0001, respectively).
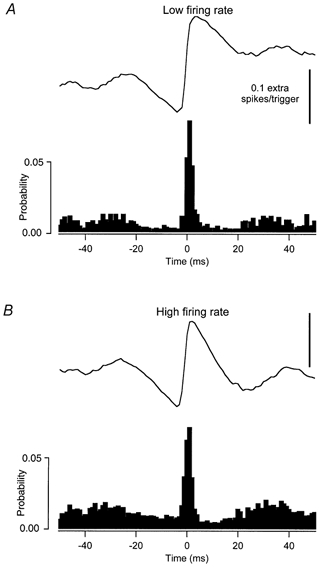
Small, high-frequency EPSPs
Figure 3 shows examples of the PSTHs that were generated in response to low amplitude, high-frequency EPSPs when the motoneurone was firing at a low (5.0 imp s−1, A) and a higher (12.0 imp s−1, C) background discharge rate. Figure 3B shows the EPSP that was generated in response to a single current transient (dotted trace), as well as the mean voltage change caused by all the current transients, calculated by averaging across all onset times of the current transients (continuous trace). The latter trace exhibits small voltage elevations at lags of about ± 30 ms, reflecting the mean intervals between transients. These features are associated with small elevations in the PSTH at similar lags. Nonetheless, as was the case for large, low-frequency EPSPs, there is a clear increase in spike probability associated with the onset of the EPSP, which lasts for 7 ms at the high firing rate and 6 ms at the low firing rate. The peak widths for all the PSTHs obtained using small, high-frequency EPSPs ranged from 5 to 9 ms (6.5 ± 1.1 ms). The spike-triggering efficacy of smaller EPSPs exhibited the opposite dependence on discharge rate, i.e. spike-triggering efficacy increased with increasing discharge rate. In the examples shown in Fig. 3, the spike-triggering probability of EPSPs is 0.073 at the higher firing rate vs. 0.044 at the low rate.
Figure 3. The effect of small amplitude, high-frequency EPSPs on single spike trains.
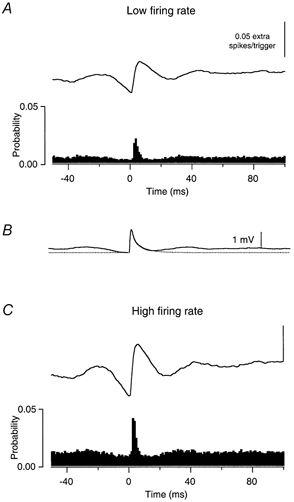
The arrangement of the panels is the same as in Fig. 1. A shows the effects of a small current transient on firing probability when a motoneurone is discharging at low rate (5.0 imp s−1), and C shows its effect on the same motoneurone discharging at a higher rate (12.0 imp s−1). B, the average voltage change produced when the current transients are applied together (continuous line) along with the estimated voltage change produced by a single current transient (dotted line). The peak amplitudes of both simulated EPSPs are 1.5 mV. See text for further details.
Figure 4A summarizes the relation between spike-triggering efficacy (normalized to the number of EPSPs) and background discharge rate for six cells stimulated with high frequency, low amplitude EPSPs at several different background discharge rates. Figure 4B shows the spike-triggering efficacy normalized to the number of output spikes rather than the number of EPSPs. The average peak EPSP amplitude in these cells ranged from 1.3 to 2.7 mV (1.9 ± 0.5 mV). The EPSP amplitudes fell into three groups which are indicated by different symbols in the figure (○, ≤1.5 mV; •, > 1.5 mV and < 2.1 mV; and ▴, > 2.1 mV). The continuous line in Fig. 4A is the best linear fit for all EPSP sizes between spike-triggering efficacy (normalized to the number of EPSPs) and discharge rate. In contrast to the data for large, low-frequency EPSPs (Fig. 2A) there is a positive correlation between spike-triggering efficacy and discharge rate (probability = 0.024 + 0.004 × rate, r = 0.924, n = 30, P < 0.001). However, when spike-triggering probability is normalized by the number of output spikes (Fig. 4B) there is a negative correlation between probability and discharge rate (probability = 0.340 - 0.009 × rate, r = −0.819, P < 0.0001). The probability values of Fig. 4A and B showed similar dependencies on relative discharge rate (i.e. rate divided by the reciprocal of the AHP duration): probability per PSP had a positive correlation against normalized rate (r = 0.63; P < 0.001); and probability per spike had a negative correlation against the normalized rate (r = −0.72; P < 0.0001).
Figure 4. Relationship between the spike-triggering probability of small EPSPs and background discharge rate.
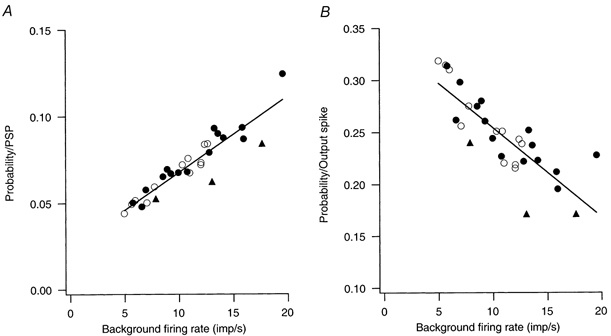
The spike-triggering efficacy of small (1.3 - 2.7 mV) EPSPs versus background discharge rate. Data are from six cells. Different symbols indicate results for different sized EPSPs: ≤1.5 mV, ○; > 1.5 mV and < 2.1 mV, •; > 2.1 mV, ▴. The continuous lines indicate the best linear fit to the entire data set. A, probability of spike-triggering normalized by the number of EPSPs. B, probability of spike-triggering normalized by the number of output spikes.
The positive relation shown in Fig. 4A reflects the fact that, when EPSP arrival rates are higher than motoneurone discharge rates, motoneurone discharge rate has a direct effect on the spike-triggering efficacy of EPSPs (i.e. independent of any associated changes in interspike trajectory). As motoneurone firing rate increases, there is a higher likelihood of a motoneurone spike occurring near enough to an EPSP to cause the EPSP to affect spike timing. This positive relation appears to be similar over a twofold range of EPSP sizes. It should be noted that the variation in EPSP sizes reflects differences in motoneurone input resistance - the amplitude of the current transients making up the ‘common’ input - and the variance of the injected current noise was the same in all cells. The fact that a twofold increase in EPSP amplitude was not associated with a twofold increase in spike-triggering probability may reflect the corresponding increase in the amplitude of the background membrane noise (Poliakov et al. 1996).
Interspike interval variability increased as firing rate decreased for the data set shown in Fig. 4 (coefficient of variation = 30.43 - 0.885 × rate, r = −0.464, P < 0.01), although the correlation was not as strong as for the data of Fig. 2. Spike-triggering efficacy (normalized to EPSP number) was not significantly correlated with interspike variability, whereas the values of probability normalized to the number of output spikes did show a significant positive correlation (probability = 0.160 + 0.004 × coefficient of variation, r = 0.768, P < 0.0001).
Synchronizing effects of EPSPs
Large, low-frequency EPSPs
We measured the ability of the two different EPSP trains to synchronize motoneurone spikes by cross-correlating sets of spike trains that received the same ‘common’ EPSP input and different background noise inputs. When cross-correlations were compiled between spike trains that had received the same low-frequency large amplitude EPSP input, the synchronous discharges resulting from this ‘common’ input were more prevalent when the discharge rates of the cells were low. In the example illustrated in Fig. 5, the CCHist (A) obtained between sets of spike trains with low discharge rates (5.7 and 6.7 imp s−1) exhibits a prominent central peak with a duration of 21 ms, whereas that obtained in the same cell between sets of spike trains with high firing rates (14.9 and 19.3 imp s−1, B) shows a small central peak of 13 ms in duration that is only apparent in the cusum trace. The peak widths for all the CCHists obtained using large, low-frequency EPSP trains ranged from 9 to 21 ms (15.6 ± 2.9 ms).
Figure 5. Cross correlation histogram (CCHist) obtained from spike trains that were conditioned by low-frequency, large EPSPs as common input.
CCHists (filled bars) and cusums calculated between sets of discharge records receiving the same common input composed of large EPSPs applied at a low frequency. A, the synchronizing effect of the common input when the mean rates in the correlated spike trains are low (5.7 and 6.7 imp s−1). B, the synchronizing effect of common input when the mean rates are high (14.9 and 19.3 imp s−1).
As described in Methods, the counts in each bin of the histograms have been divided by the number of triggers (i.e. the number of spikes in the lower frequency train) to give the probability of a spike in one spike train given the occurrence of a spike the other train. The area of the peak above the baseline in this normalized CCHist is the synchronization index E. Using this index for the example shown in Fig. 5, the probability of synchronous discharge (above that expected due to chance) is over seven times higher for the lower discharge rate trials than the higher rate trials (0.244 vs. 0.033).
Nordstrom et al. (1992) reported a similar inverse dependence of the magnitude of several synchronization indices on motor unit discharge rate. In that study, this relationship was demonstrated by showing a significant positive linear correlation between the synchrony index and the product of the mean interspike intervals (ISIs) of the two correlated spike trains (see their Fig. 5). Figure 6 illustrates analogous plots for five different indices of synchronization calculated from sets of spike trains receiving large, low-frequency EPSPs. As previously reported by Nordstrom et al. (1992), there was a significant positive linear correlation between the indices E, S, k' and SI and the product of the mean ISIs, indicating an inverse dependence of synchronization magnitude on discharge rate. (Values of Pearson's correlation coefficient (r) were 0.873, 0.894, 0.940 and 0.943 for E, S, k' and SI, respectively; P < 0.0001, n = 67 in all cases.) For our results using large, low-frequency EPSPs, the index CIS also was positively correlated with the ISI product (r = 0.542, P < 0.0001). Nordstrom et al. (1992) also reported a significant positive linear correlation between all of the synchronization indices (including CIS) and the average discharge variability (calculated as the geometric mean of the coefficients of variation of the interspike intervals in the correlated spike trains). Discharge variability was positively correlated with the product of the interspike intervals for the data set used in Fig. 6 (coefficient of variation = 10.388 + 0.0011 × ISI product, r = 0.890, P < 0.0001). All of the synchronization indices exhibited a significant positive correlation with discharge variability (r values of 0.684 to 0.933, P < 0.0001).
Figure 6. The relationship between different synchronization indices and the background discharge rate using low-frequency, large EPSPs as common input.
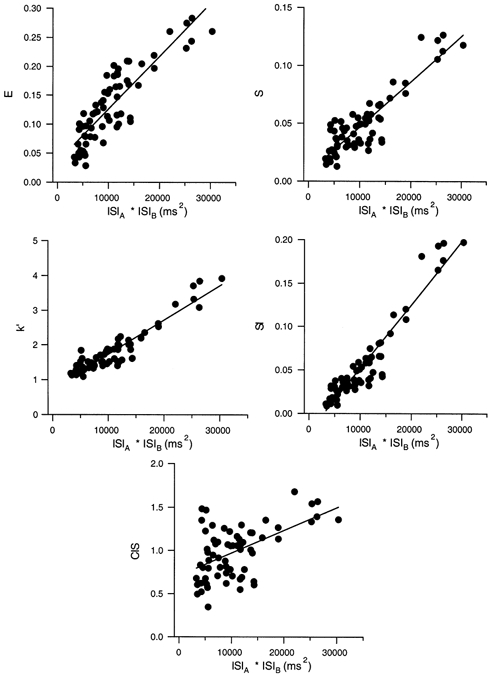
Values of five different synchronization indices are plotted against the product of the mean interspike intervals (ISIs) for 67 sets of spike trains receiving the same low-frequency train of large current transients in combination with different random noise signals.
It has been previously reported that motoneurone synchrony is highest when the correlated spike trains have similar mean rates (Logigian et al. 1988). For the data set of Fig. 6, the mean difference in the discharge rates in the correlated spike trains was 5.2 ± 3.5 Hz (range: 0.4-13.5 Hz; n = 67). Many of the synchronization indices did in fact exhibit a significant negative correlation with the difference in discharge rates, although this dependence was rather weak (r values of −0.328 to 0.040).
Small, high-frequency EPSPs
When small, high-frequency EPSPs were used as common inputs, the relation between the amount of synchronization and the background discharge rate depends upon which synchronization index is used. Figure 7 illustrates CCHists compiled between sets of spike trains with either low (6.8 and 7.2 imp s−1, A) or high (12.0 and 12.8 imp s−1, B) background discharge rates. The peak widths for all the CCHists obtained using small high-frequency EPSP trains ranged from 5 to 19 ms (7.4 ± 1.2 ms).
Figure 7. Cross correlation histogram (CCHist) obtained from spike trains that were conditioned by high-frequency small EPSPs as common input.
CCHists (filled bars) and cusums calculated between sets of discharge records receiving the same common input composed of small EPSPs applied at a high frequency. A, the synchronizing effect of this common input when the mean rates in the correlated spike trains are low (6.8 and 7.2 imp s−1). B, the synchronizing effect when the mean rates are high (12.0 and 12.8 imp s−1).
The areas of the central peaks in the two CCHists in Fig. 7 are quite similar, yielding values of E that differ by less than 10 % (0.172 for the lower firing rate and 0.154 for the higher firing rate). Normalizing the number of extra counts by the total number of spikes in both spike trains (index S) also indicated that the strength of synchronization was similar at the two firing rates (0.084 at the lower rate and 0.075 at the higher rate). In contrast, normalization based on either the number of counts during the peak expected due to chance (index k') or the total number of counts in the histogram (index SI), provided measures of synchronization that were higher at the lower discharge rate (k': 4.10 vs. 2.68, SI: 0.121 vs. 0.060). The index CIS showed the opposite dependence (1.17 at the low rate, 1.85 at the high rate).
Figure 8 illustrates that the relations between the values of different synchronization indices and background discharge rates shown in the example of Fig. 7 also hold for the entire set (n = 54) of CCHists compiled between spike trains with small, high-frequency EPSPs as the common input. The values of the indices E and S (top row) did not show a significant correlation with the product of the mean ISIs in the correlated spike trains. Both k' and SI values exhibited significant positive correlations with the ISI product (r = 0.409, P < 0.01 and r = 0.664, P < 0.001, respectively). The positive correlation of k' with the ISI product is consistent with the results of Ellaway & Murthy (1985). In contrast, we found that CIS exhibited a significant negative correlation on the ISI product (r = 0.564, P < 0.001), unlike Nordstrom et al. (1992), who found no dependence. These results indicate that in spite of the fact that small EPSPs are more effective in triggering spikes at higher motoneurone discharge rates (Fig. 3 and Fig. 4), the synchronization indices E and S both provide a measure of the strength of common input that is apparently independent of the background discharge rate. The reasons for the different dependences of various synchronization indices on discharge rate are considered in the Discussion.
Figure 8. The relationship between different synchronization indices and the background discharge rate using high-frequency, small EPSPs as common input.

Values of five different synchronization indices are plotted against the product of the mean interspike intervals (ISIs) for 54 sets of spike trains receiving the same high-frequency train of small current transients in combination with different random noise signals.
Discharge variability increased with the product of the mean ISIs (coefficient of variation = 13.512 + 0.00051 × ISI product, r = 0.453, P < 0.001). As previously reported (Nordstrom et al. 1992), the values of all of the synchronization indices exhibited significant positive correlations with discharge variability. CIS showed the weakest dependence on discharge variability (r = 0.270, P < 0.05) compared to the other indices (r values of 0.644 to 0.818, P < 0.0001). The mean difference in the discharge rates of the correlated spike trains used in Fig. 8 was 3.6 ± 2.6 Hz (range: 0.3-10.3 Hz; n = 54). In contrast to the case for synchrony produced by large EPSPs (Fig. 6), the synchronization indices obtained using small, high-frequency EPSPs did not generally exhibit a significant correlation with the difference in the discharge rates, except for E, which showed a positive correlation (r = 0.421, P < 0.01).
DISCUSSION
The present results provide insight into two issues that have been the source of some controversy in the human motor unit literature. The first is the effect of motor unit discharge rate on the spike-triggering efficacy of excitatory afferent inputs. Our results show that this effect depends upon the size and arrival rate of EPSPs. Specifically, when normalized to the number of stimuli (EPSPs), the spike-triggering efficacy of large low-frequency EPSPs is likely to decline with increasing background discharge rate (Fig. 2A), whereas that of small, high-frequency EPSPs is likely to increase with increasing rate (Fig. 4A).
As discussed below, the spike-triggering efficacy of an EPSP is likely to depend both on the interspike membrane trajectory and on the number of motoneurone spikes that can be affected by the EPSPs. When the rate of the EPSPs is lower than either of the spike trains then the shape of the membrane potential trajectory is the determining factor for spike-triggering effects of the PSPs. In contrast, when EPSP arrival rates are significantly higher than the motoneurone discharge rate, the discharge rate itself becomes important. At higher motoneurone discharge rates, there is a higher probability that a motoneurone spike will occur close enough to an EPSP to have its timing advanced. This latter effect of motoneurone discharge rate can be removed by normalizing spike-triggering efficacy by the number of motoneurone spikes (instead of the number of PSPs). This index shows a strong negative correlation with discharge rate for large, low-frequency EPSPs (Fig. 2B) and a somewhat weaker negative correlation for small, high-frequency EPSPs (Fig. 4B). We argue below that these correlations are likely to reflect the influence of interspike membrane trajectory on spike-triggering efficacy.
A related issue is the effect of motor unit discharge rate on the synchronization of discharge among motor units receiving common input. It has recently been proposed that the spike-triggering efficacy of common EPSPs is independent of background discharge rate and that the degree of synchrony is best quantified by dividing the number of synchronous counts by the duration of discharge (Nordstrom et al. 1992). Our results do not support this idea and suggest instead that in order to get a quantitative measure of synchrony that is independent of background discharge rate, synchronous counts should be divided by the number of spikes in one or both of the spike trains.
Spike-triggering efficacy of EPSPs
The effective strength of synaptic inputs to human motor units has been measured by compiling peristimulus time histograms (PSTHs) between the afferent stimuli and the spikes of a tonically discharging motor unit. In some studies, the size of the PSTH peak produced by a fixed stimulus was found to be either independent or only weakly dependent on motor unit discharge rate. For example, Ashby & Zilm (1982) reported that the size of the PSTH peak produced by a fixed afferent volley was similar at high and low firing rates, although they did observe that for 11/12 units the peak size was higher at lower discharge rates. Miles et al. (1989) reported that except for the lowest firing rates (4 imp s−1) at which PSTH peaks were the largest, peak size was independent of firing rate. These findings were taken to support a model of the motoneurone interspike voltage trajectory in which the membrane potential drops a constant distance below threshold following a spike, and then rises linearly to threshold at a rate that is inversely proportional to the mean interspike interval (Ashby & Zilm, 1982; Miles et al. 1989; Nordstrom et al. 1992). In contrast, other studies have reported a strong inverse relationship between firing rate and EPSP efficacy (Kudina, 1988; Jones & Bawa, 1995; Olivier et al. 1995). These latter results were taken to reflect the fact that the membrane potential trajectory at the lowest firing rates has a curved shape toward the end of the interspike interval (Jones & Bawa, 1995; Olivier et al. 1995).
It has recently been proposed that the interspike membrane trajectories of human motoneurones during physiological activation differ significantly from those of cat motoneurones driven by injected current (Matthews, 1996). In motoneurones driven by injected current alone, the mean interspike interval at the minimum steady discharge rate is approximately equal to the duration of the afterhyperpolarization (AHP) following a single spike (Kernell, 1965). In contrast, over the lower range of firing rates measured during voluntary activation of human motor units (the ‘subprimary’ range; Kudina, 1999), mean interspike intervals are thought to be longer than the AHP duration (Matthews, 1996). Under these conditions, the average membrane potential reaches a constant distance below threshold toward the end of the interspike interval (Türker, 1995; Matthews, 1996; Powers & Binder, 2000) and spikes are triggered solely by random fluctuations in synaptic noise rather than by a linear rise to threshold. As firing rate decreases, both the duration of the period of constant depolarization and the distance from threshold increases (Matthews, 1996; Powers & Binder, 2000). This leads to a complex relation between discharge rate and the spike-triggering efficacy of EPSPs that depends upon the relation between EPSP amplitude and the distance to threshold toward the end of the interspike interval.
Figure 9 provides a schematic illustration of how the distance to threshold throughout the interspike interval might influence the spike-triggering efficacy of large (A) and small EPSPs (B). The thick lines indicate predicted interspike trajectories for a motoneurone firing at 6 imp s−1. At this firing rate, the mean interspike interval (167 ms) is longer than the AHP duration (about 120 ms), so that the membrane potential approaches a steady depolarization (plateau) toward the end of the interval. In the absence of applied EPSPs, most of the spikes would be triggered by fluctuations in the background synaptic noise that exceed the distance to threshold during the plateau phase. In contrast, at a higher firing rate (14 imp s−1, thin lines), the mean interspike interval is less than the AHP duration and spikes would be triggered when the mean membrane trajectory crosses threshold, even in the absence of applied EPSPs or background synaptic noise.
Figure 9. Relation between shape of membrane trajectories at different firing rates and the spike-triggering efficacy of large and small EPSPs.
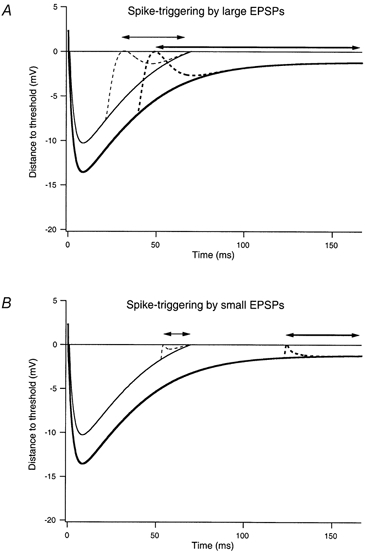
Each panel shows theoretical interspike membrane trajectories for a motoneurone firing at a low rate (6 imp s−1, thick lines) and higher rate (14 imp s−1, thin lines). The dashed lines show superimposed large (A) and small (B) EPSPs. The EPSPs have been placed at the point in the interspike interval where they can first evoke spikes with a 50 % or greater probability. The lines with double arrows indicate the proportion of the interspike interval over which this high probability of spike-triggering can occur at the low rate (thick line) and high rate (thin line). See text for further details.
The relative spike-triggering efficacy of EPSPs at these two discharge rates depends upon the relation between EPSP size and the distance to threshold throughout the interspike interval. For large EPSPs (Fig. 9A), spikes are triggered with a 50 % or greater probability over about the last 71 % of the interspike interval at the lower discharge rate. (Spikes could be triggered with a low probability earlier in the interval by the EPSP in combination with particularly large depolarizing fluctuations in the background synaptic noise.) At the higher firing rate, spikes are triggered with a 50 % or greater probability over about 54 % of the interspike interval. In other words, the spike-triggering efficacy of large EPSPs decreases with increasing discharge rate, as was observed experimentally (Fig. 2). Similarly, Fig. 9B shows that a small EPSP would trigger spikes with a 50 % or greater probability over about 22 % of the interspike interval at the high rate, but at the lower rate this probability would increase very slightly to about 26 %. Thus, when normalized to the number of spikes, the spike-triggering efficacy of small, high-frequency EPSPs should decrease with increasing discharge rate, as observed (Fig. 4B). The fact that spike-triggering efficacy, when normalized by the number of EPSPs, shows a positive dependence on discharge rate (Fig. 4A) reflects the increased likelihood of an EPSP occurring near a spike when the discharge rate is high.
The exact relation between discharge rate, EPSP size, EPSP frequency and spike-triggering efficacy will vary between cells depending upon the characteristics of the background synaptic noise and the membrane trajectories at different firing rates. However, the schematic in Fig. 9 provides a qualitative explanation of our own experimental results, and may also explain our previous finding that spikes in a low-frequency train act as a better indicator of common input when used in analyses of discharge synchrony (Türker & Powers, 2001a).
Discharge variability probably provides the most direct reflection of the different interspike membrane trajectories illustrated in Fig. 9, since the membrane trajectory at the lower rate should be associated with a skewed interspike interval distribution and a high coefficient of variation (Matthews, 1996; Powers & Binder, 2000). This may account for the fact that both spike-triggering efficacy and synchronization exhibit a positive dependence on relative discharge variability. The following section considers how the experimentally observed relations between motoneurone discharge rate and the spike-triggering efficacy of EPSPs can be used to predict their ability to synchronize motoneurone discharge.
Synchronization of motoneurone discharge by large and small EPSPs
The synchronizing effect of a train of EPSPs can be predicted from the average spike-triggering probability of an individual EPSP and the frequency of EPSPs applied. For example, the linear fit to the data of Fig. 2A can be used to predict the spike-triggering efficacy of large EPSPs at different discharge rates. For a background discharge rate of 6 imp s−1, the predicted spike-triggering probability of an individual EPSP is 0.692. The joint probability of the EPSP triggering a spike at the same time in two separate trials with the same low discharge rate is the square of this value (0.479). The 26 s train of large EPSPs was composed of 66 EPSPs, so the expected number of synchronous spikes when this train is applied as a common input to two motoneurones firing at 6 imp s−1 is 32, which is the product of this number of EPSPs and the joint probability of spike triggering (0.479 × 66). The predicted value of the synchronization index E, which is the number of synchronous spikes (32) divided by the number of spikes in lower frequency spike train (157 for a 26 s train at a rate of 6 imp s−1), is 0.204. This value is similar to those observed for low-frequency spike trains, as shown in Fig. 6. (For two spike trains with mean rates of 6 imp s−1, the product of their mean ISIs is about 27 900 m s2.) Similar calculations can be applied for a mean rate of 14 imp s−1, where the product of the joint probability of spike triggering (0.5362 = 0.287) and the number of EPSPs predicts 19 synchronous spikes and an E value of 0.052 (19 synchronous spikes/367 background spikes). Again, comparison of this value with the data of Fig. 6 shows that the predicted E value is close to that observed for high-frequency spike trains (ISI product of about 5100 m s2 for two spike trains of 14 imp s−1).
The above analysis shows that when large EPSPs are applied as the common input, the absolute number of synchronous spikes is higher at the lower discharge rate (i.e. 32 at 6 imp s−1vs. 19 at 14 imp s−1). The exact relation between a given index of synchrony and background discharge rate depends upon how the number of synchronous spikes is normalized. If the number of synchronous spikes is normalized by some measure of the number of motoneurone spikes (as in the indices E and S, top row of Fig. 6), then the inverse dependence of synchrony on discharge rate (or the direct dependence on the product of the mean ISIs) is exaggerated. If the normalization is based on some measure of the mean bin count, or the total of the bin counts in the histogram (k' and SI, middle row of Fig. 6), this dependence is further exaggerated, since the mean or total bin count depends upon the product of the firing rates in the correlated spike trains. For the index CIS, the number of synchronous spikes is divided by the trial duration, which is the same in the two examples given above. The greater number of synchronous spikes at lower discharge rates are thus directly reflected in the index CIS, leading to a direct dependence of the value of the index on the product of the mean ISIs (Fig. 6C).
A similar type of analysis can be used to predict the synchronizing effect of small, high-frequency EPSPs. As illustrated in Fig. 4A, when normalized to the number of EPSPs, the spike-triggering efficacy of small EPSPs shows a direct dependence on motoneurone discharge rate. At 6 imp s−1, the probability of a single EPSP triggering a spike is 0.050, whereas the probability increases to 0.085 at 14 imp s−1. The total number of small EPSPs in a 26 s train was 5633, leading to a prediction of 14 synchronous spikes at the lower firing rate (0.0592 × 5633), and 40 at the higher firing rate (0.0852 × 5633). However, since there are more spikes available to be affected at the high discharge rate, this direct dependence of the number of synchronous spikes on firing rate is offset by dividing them by the number of spikes in one or both of the correlated trains, since neither E nor S showed a significant dependence on the product of the mean ISIs when small EPSPs were used as a common input (top row of Fig. 8). In the example given above, the predicted values of E are similar at the low and high firing rates (0.089 and 0.109 respectively). Dividing the number of synchronous spikes by a factor proportional to the product of the motoneurone firing rates produces an overcompensation; both k' and SI showed a direct dependence on the ISI product. The index CIS shows an inverse dependence on the ISI product, as expected from the direct dependence of the spike-triggering efficacy of the common input on mean firing rate.
Application to human motor unit studies
The complex relation between EPSP amplitude, EPSP frequency, discharge rate and spike-triggering efficacy may account for some of the controversy in the human motor unit literature. All human work to date used stimulus frequencies that are similar to our large low-frequency algorithm. Therefore, the importance of the different interspike membrane trajectories at low and high firing rates was exaggerated in those studies since the number of ISIs that could be affected per stimulus was equal at high and low rate. However, when the stimulus frequency is increased to be higher than the discharge rates, the relationship changes dramatically. The schematic interspike trajectories shown in Fig. 9 suggests that an inverse dependence between motoneurone discharge rate and spike-triggering efficacy may be most prominent for relatively large low-frequency afferent inputs and discharge rates that include rates in the ‘subprimary’ range (Kudina, 1999). Over discharge rates within the primary range (i.e. rates at which the mean ISI is equal to or shorter than the AHP duration), there may be little or no dependence of the spike-triggering efficacy of large EPSPs on discharge rate. The data of Fig. 2 are consistent with this idea, since in three out of four cases spike-triggering efficacy drops significantly from the lowest to the medium discharge rate, and shows relatively little further change at the highest discharge rate. Similarly, in the study of human motor units by Miles et al. (1989), the spike-triggering efficacy of a fixed afferent input was highest at the low discharge rate of 4 imp s−1 but showed little dependence on rate over the range of 6-10 imp s−1.
There has been no report in the human motor unit literature of a positive relation between spike-triggering efficacy and motor unit discharge rate. The present results suggest that such a result might be obtained with high-frequency afferent inputs (see also Poliakov et al. 1997).
Our results using large, low-frequency simulated EPSPs as a source of common input showed that regardless of the synchronization index used the magnitude of synchrony was inversely related to motoneurone discharge rate. However, the use of small, high-frequency EPSPs as a common input is likely to have more relevance for the understanding of motor unit synchrony under physiological conditions. Under these conditions, the number of synchronous spikes evoked by the common input increased with increasing discharge rate. The relation between the magnitude of a given index of synchrony and discharge rate depended upon which index was used (Fig. 8). For example, the index E showed no dependence on rate, k' showed an inverse dependence on rate (positive dependence on the product of the mean ISIs), and CIS showed a positive dependence on rate (inverse dependence on ISI product).
The relevance of these results to the interpretation of studies of human motor unit synchrony depends upon the extent to which our common input mimics that present in human motoneurones during physiological activation. The common input underlying human motor unit synchrony is assumed to be composed of very small EPSPs arriving at a high rate (i.e. tens of thousands of 0.1-0.5 mV EPSP s−1; cf. Kirkwood & Sears, 1978, 1991). This idea is based on the experimental evidence that the amplitudes of unitary EPSPs from single Ia fibres onto alpha motoneurones in anaesthetized cats are typically in the order of 0.1 mV (Mendell & Henneman, 1971). The amplitude of unitary EPSPs is likely to be larger in unanaesthetized animals (Burke, 1967; Kullmann et al. 1989) and the presence of active conductances may increase the size of EPSPs near spike threshold (Deisz et al. 1991; Stuart & Sakmann, 1995). However, the ‘small’ simulated EPSPs used here (1-2 mV) are still likely to be larger than unitary EPSPs. Nonetheless, a positive relation between spike-triggering efficacy and discharge rate has also been observed for smaller EPSPs (Poliakov et al. 1997). Furthermore, a recent study of synchronization using a simulated common input with characteristics expected for very large numbers of small EPSPs (i.e. filtered Gaussian noise) reported that the index E was independent of discharge rate, whereas CIS increased with increasing discharge rate (Binder & Powers, 2001), just as found in the present study.
It is possible that during physiological activation of motoneurones other factors may influence the spike-triggering efficacy of common inputs. For example, higher motoneurone discharge rates are likely to reflect an increase in excitatory synaptic drive and an associated increase in synaptic noise, which would act to decrease the spike-triggering efficacy of common EPSPs (Poliakov et al. 1996). Similarly, a systematic increase in presynaptic inhibition of common inputs with increasing drive would decrease the spike-triggering efficacy of these inputs. Nonetheless, our results suggest that the interspike trajectories of tonically discharging motoneurones should have a strong influence on the ability of common EPSPs to induce synchronous discharge. If this influence predominates, then the synchronization indices E and S could both provide an estimate of the degree of shared input that is relatively independent of motor unit discharge rate. In contrast, for a given amount of shared input the index CIS increases with background discharge rate, reflecting the fact that common EPSPs are more likely to trigger synchronous spikes at higher background discharge rates.
Acknowledgments
We thank C. Madore for assistance with the animal surgery. We are grateful to Prof. Marc Binder for encouragement and support during this study and valuable comments on the manuscript. This study was funded by the NH & MRC of Australia, NIH grants NS 31925 and NS 26840, National Science Foundation grant (IBN-9986167), and a Human Frontiers Science Project Short Term Fellowship.
REFERENCES
- Adams L, Datta AK, Guz A. Synchronization of motor unit firing during different respiratory and postural tasks in human sternocleidomastoid muscle. Journal of Physiology. 1989;413:213–231. doi: 10.1113/jphysiol.1989.sp017650. [DOI] [PMC free article] [PubMed] [Google Scholar]
- Ashby P, Zilm D. Characteristics of postsynaptic potentials produced in single human motoneurons by homonymous group 1 volleys. Experimental Brain Research. 1982;47:41–48. doi: 10.1007/BF00235884. [DOI] [PubMed] [Google Scholar]
- Binder MD, Powers RK. Relationship between simulated common synaptic input and discharge synchrony in cat spinal motoneurons. Journal of Neurophysiology. 2001;86:2276–2284. doi: 10.1152/jn.2001.86.5.2266. [DOI] [PubMed] [Google Scholar]
- Bremner FD, Baker JR, Stephens JA. Variation in the degree of synchronization exhibited by motor units lying in different finger muscles in man. Journal of Physiology. 1991;432:381–399. doi: 10.1113/jphysiol.1991.sp018390. [DOI] [PMC free article] [PubMed] [Google Scholar]
- Burke RE. Composite nature of the monosynaptic excitatory postsynaptic potential. Journal of Neurophysiology. 1967;30:1114–1137. doi: 10.1152/jn.1967.30.5.1114. [DOI] [PubMed] [Google Scholar]
- Clamann HP. Statistical analysis of motor unit firing patterns in a human skeletal muscle. Biophysical Journal. 1969;9:1233–1251. doi: 10.1016/S0006-3495(69)86448-9. [DOI] [PMC free article] [PubMed] [Google Scholar]
- Datta AK, Stephens JA. Synchronization of motor unit activity during voluntary activation in man. Journal of Physiology. 1990;422:397–419. doi: 10.1113/jphysiol.1990.sp017991. [DOI] [PMC free article] [PubMed] [Google Scholar]
- Deisz RA, Fortin G, Zieglgansberger W. Voltage dependence of excitatory postsynaptic potentials of rat neocortical neurons. Journal of Neurophysiology. 1991;65:371–382. doi: 10.1152/jn.1991.65.2.371. [DOI] [PubMed] [Google Scholar]
- Ellaway PH. Cumulative sum technique and its application to the analysis of peristimulus time histogram. Electroencephalography and Clinical Neurophysiology. 1978;45:302–304. doi: 10.1016/0013-4694(78)90017-2. [DOI] [PubMed] [Google Scholar]
- Ellaway PH, Murthy KS. The source and distribution of short-term synchrony between gamma-motoneurones in the cat. Quarterly Journal of Experimental Physiology. 1985;70:233–247. doi: 10.1113/expphysiol.1985.sp002906. [DOI] [PubMed] [Google Scholar]
- Farmer SF, Halliday DM, Conway BA, Stephens JA, Rosenberg JR. A review of recent applications of cross-correlation methodologies to human motor unit recording. Journal of Neuroscience Methods. 1997;74:175–187. doi: 10.1016/s0165-0270(97)02248-6. [DOI] [PubMed] [Google Scholar]
- Fetz EE, Gustafsson B. Relation between shapes of post-synaptic potentials and changes in firing probability of cat motoneurones. Journal of Physiology. 1983;341:387–410. doi: 10.1113/jphysiol.1983.sp014812. [DOI] [PMC free article] [PubMed] [Google Scholar]
- Haddad GG, Donnelly DF, Getting PA. Biophysical properties of hypoglossal neurons in vitro: intracellular studies in adult and neonatal rats. Journal of Applied Physiology. 1990;69:1509–1517. doi: 10.1152/jappl.1990.69.4.1509. [DOI] [PubMed] [Google Scholar]
- Jones KE, Bawa P. Responses of human motoneurons to Ia inputs: effects of background firing rate. Canadian Journal of Physiology and Pharmacology. 1995;73:1224–1234. doi: 10.1139/y95-174. [DOI] [PubMed] [Google Scholar]
- Kernell D. The limits of firing frequency in cat lumbosacral motoneurones possessing different time course of afterhyperpolarization. Acta Physiologica Scandinavica. 1965;65:87–100. [Google Scholar]
- Kirkwood PA, Sears TA. The synaptic connections to intercostal motoneurones as revealed by their average common excitation potential. Journal of Physiology. 1978;275:103–134. doi: 10.1113/jphysiol.1978.sp012180. [DOI] [PMC free article] [PubMed] [Google Scholar]
- Kirkwood PA, Sears TA. Cross-correlation analyses of motoneuron inputs in a coordinated motor act. In: Kruger J, editor. Neuronal Cooperativity. Berlin: Springer-Verlag; 1991. pp. 225–248. [Google Scholar]
- Kirkwood PA, Sears TA, Tuck DL, Westgaard RH. Variations in the time course of the synchronization of intercostal motoneurones in the cat. Journal of Physiology. 1982;327:105–135. doi: 10.1113/jphysiol.1982.sp014223. [DOI] [PMC free article] [PubMed] [Google Scholar]
- Kudina LP. Excitability of firing motoneurones tested by Ia afferent volleys in human triceps surae. Electroencephalography and Clinical Neurophysiology. 1988;69:576–580. doi: 10.1016/0013-4694(88)90170-8. [DOI] [PubMed] [Google Scholar]
- Kudina LP. Analysis of firing behaviour of human motoneurones within ‘subprimary range’. Journal de Physiologie. 1999;93:115–123. doi: 10.1016/s0928-4257(99)80142-9. [DOI] [PubMed] [Google Scholar]
- Kullmann DM, Martin RL, Redman SJ. Reduction by general anaesthetics of group Ia excitatory postsynaptic potentials and currents in the cat spinal cord. Journal of Physiology. 1989;412:277–296. doi: 10.1113/jphysiol.1989.sp017615. [DOI] [PMC free article] [PubMed] [Google Scholar]
- Logigian EL, Wierzbicka MM, Bruyninckx F, Wiegner AW, Shahani BT, Young RR. Motor unit synchronization in physiologic, enhanced physiologic, and voluntary tremor in man. Annals of Neurology. 1988;23:242–250. doi: 10.1002/ana.410230306. [DOI] [PubMed] [Google Scholar]
- Matthews PBC. Relationship of firing intervals of human motor units to the trajectory of post-spike after-hyperpolarization and synaptic noise. Journal of Physiology. 1996;492:597–628. doi: 10.1113/jphysiol.1996.sp021332. [DOI] [PMC free article] [PubMed] [Google Scholar]
- Matthews PBC. The effect of firing on the excitability of a model motoneurone and its implications for cortical stimulation. Journal of Physiology. 1999;518:867–882. doi: 10.1111/j.1469-7793.1999.0867p.x. [DOI] [PMC free article] [PubMed] [Google Scholar]
- Mendell LM, Henneman E. Terminals of single 1a fibers: location, chemistry and distribution within a pool of 300 homonymous motoneurons. Journal of Neurophysiology. 1971;34:171–187. doi: 10.1152/jn.1971.34.1.171. [DOI] [PubMed] [Google Scholar]
- Miles TS, Türker KS, Le TH. Ia reflexes and EPSPs in human soleus motor neurones. Experimental Brain Research. 1989;77:628–636. doi: 10.1007/BF00249616. [DOI] [PubMed] [Google Scholar]
- Moore GP, Perkel DH, Segundo JP. Statistical analysis and functional interpretation of neuronal spike data. Annual Reviews of Physiology. 1966;28:493–522. doi: 10.1146/annurev.ph.28.030166.002425. [DOI] [PubMed] [Google Scholar]
- Nordstrom MA, Fuglevand AJ, Enoka RM. Estimating the strength of common input to human motoneurons from the cross-correlogram. Journal of Physiology. 1992;453:547–574. doi: 10.1113/jphysiol.1992.sp019244. [DOI] [PMC free article] [PubMed] [Google Scholar]
- Olivier E, Bawa P, Lemon RN. Excitability of human upper limb motoneurones during rhythmic discharge tested with transcranial magnetic stimulation. Journal of Physiology. 1995;485:257–269. doi: 10.1113/jphysiol.1995.sp020728. [DOI] [PMC free article] [PubMed] [Google Scholar]
- Poliakov AV, Powers RK, Sawczuk A, Binder MD. Effects of background noise on the response of rat and cat motoneurones to excitatory current. Journal of Physiology. 1996;495:143–157. doi: 10.1113/jphysiol.1996.sp021580. [DOI] [PMC free article] [PubMed] [Google Scholar]
- Poliakov AV, Powers RK, Binder MD. Functional identification of the input-output transforms of motoneurones in the rat and cat. Journal of Physiology. 1997;504:401–424. doi: 10.1111/j.1469-7793.1997.401be.x. [DOI] [PMC free article] [PubMed] [Google Scholar]
- Powers RK, Binder MD. Relationship between the time course of the afterhyperpolarization and discharge variability in cat spinal motoneurones. Journal of Physiology. 2000;528:131–150. doi: 10.1111/j.1469-7793.2000.t01-1-00131.x. [DOI] [PMC free article] [PubMed] [Google Scholar]
- Rall W. Distinguishing theoretical synaptic potentials computed for different soma-dendritic distribution of synaptic input. Journal of Neurophysiology. 1967;30:1138–1168. doi: 10.1152/jn.1967.30.5.1138. [DOI] [PubMed] [Google Scholar]
- Sawczuk A, Powers RK, Binder MD. Spike frequency adaptation studied in hypoglossal motoneurones of the rat. Journal of Neurophysiology. 1995;73:1799–1810. doi: 10.1152/jn.1995.73.5.1799. [DOI] [PubMed] [Google Scholar]
- Sawczuk A, Powers RK, Binder MD. Contribution of outward currents to spike-frequency adaptation in hypoglossal motoneurons of the rat. Journal of Neurophysiology. 1997;78:2246–2253. doi: 10.1152/jn.1997.78.5.2246. [DOI] [PubMed] [Google Scholar]
- Sears TA, Stagg D. Short term synchronization of intercostal motoneurone activity. Journal of Physiology. 1976;263:357–381. doi: 10.1113/jphysiol.1976.sp011635. [DOI] [PMC free article] [PubMed] [Google Scholar]
- Stuart G, Sakmann B. Amplification of EPSPs by axosomatic sodium channels in neocortical pyramidal neurons. Neuron. 1995;15:1065–1076. doi: 10.1016/0896-6273(95)90095-0. [DOI] [PubMed] [Google Scholar]
- Türker KS. The shape of the membrane potential trajectory in tonically-active human motoneurons. Journal of Electromyography and Kinesiology. 1995;5:3–14. doi: 10.1016/s1050-6411(99)80001-7. [DOI] [PubMed] [Google Scholar]
- Türker KS, Powers RK. Effects of large excitatory and inhibitory inputs on motoneuron discharge rate and probability. Journal of Neurophysiology. 1999;82:829–840. doi: 10.1152/jn.1999.82.2.829. [DOI] [PubMed] [Google Scholar]
- Türker KS, Powers RK. Effects of common excitatory and inhibitory inputs on motoneuron synchronization. Journal of Neurophysiology. 2001a;86:2807–2822. doi: 10.1152/jn.2001.86.6.2807. [DOI] [PubMed] [Google Scholar]
- Türker KS, Powers RK. The effect of motoneuron discharge rate on synchronization. Society for Neuroscience Abstracts. 2001b;27:625.9. [Google Scholar]
- Vaughan CW, Kirkwood PA. Evidence from motoneurone synchronization for disynaptic pathways in the control of inspiratory motoneurones in the cat. Journal of Physiology. 1997;503:673–689. doi: 10.1111/j.1469-7793.1997.673bg.x. [DOI] [PMC free article] [PubMed] [Google Scholar]
- Viana F, Bayliss DA, Berger AJ. Calcium conductances and their role in the firing behavior of neonatal rat hypoglossal motoneurons. Journal of Neurophysiology. 1993a;69:2137–2149. doi: 10.1152/jn.1993.69.6.2137. [DOI] [PubMed] [Google Scholar]
- Viana F, Bayliss DA, Berger AJ. Multiple potassium conductances and their role in action potential repolarization and repetitive firing behavior of neonatal rat hypoglossal motoneurons. Journal of Neurophysiology. 1993b;69:2150–2163. doi: 10.1152/jn.1993.69.6.2150. [DOI] [PubMed] [Google Scholar]