

Abstract
The discharge variability of abducens motoneurones was studied after blocking inhibitory synaptic inputs or both excitatory and inhibitory inputs by means of an intramuscular (lateral rectus) injection of either a low (0.5 ng kg−1) or a high dose (5 ng kg−1) of tetanus neurotoxin (TeNT), respectively. Motoneuronal firing increased after low-dose TeNT. High-dose treatment, however, produced a firing depression, and in some cells, a total lack of modulation in relation to eye movements. Firing became increasingly more regular with larger TeNT doses as shown by significant reductions in the coefficient of variation after low- and high-dose treatments. Similarly, autocorrelation histograms of interspike intervals increased the number of resolvable peaks twofold in low-dose-treated motoneurones and sevenfold in high-dose-treated motoneurones. The plots of standard deviation versus the mean instantaneous firing frequency showed an upward deflexion with low firing frequencies. The upward deflexion occurred in controls at 39.9 ± 4.9 ms, an interval similar to the mean afterhyperpolarisation (AHP) duration (48.4 ± 8.8 ms). Low-dose TeNT treatment shifted the deflexion point to 20.9 ± 3.9 ms, whereas the high dose increased it to 60.7 ± 6.1 ms, in spite of the fact that no differences in AHP parameters between groups were found. The density of synaptophysin-immunoreactive boutons decreased by 14 % after the low-dose treatment and 40.5 % after the high-dose treatment, indicating that protracted synaptic blockade produces elimination of synaptic boutons. It is concluded that abducens motoneurone spike variability during spontaneous ocular fixations depends largely on the balance between inhibitory and excitatory synaptic innervation.
Extraocular motoneurones, in contrast to other cells such as cortical neurones (Stevens & Zador, 1998; Salinas & Sejnowski, 2000), fire highly regular spike trains. Firing stability ensures the correct eye position and it is, therefore, necessary for visual accuracy during eye movements (Easter, 1973; Kapoula et al. 1990). Nevertheless, during an eye fixation, motoneurone interspike intervals (ISI) show a certain degree of variability (Gómez et al. 1986). Sources of ISI variability have been attributed to several mechanisms. For instance, spontaneously active cholinergic neostriatal neurones, recorded in vitro under minimal synaptic activation, show irregular firing originating from an endogenous mechanism (Bennett & Wilson, 1999). Secondly, large membrane potential fluctuations, produced by input synchrony (Lampl et al. 1999), could explain the high firing variability in cortical neurones (Stevens & Zador, 1998). In this regard, Segundo et al. (1963) first noted that changes in the variability of a train of presynaptic impulses determined differences in the voltage-threshold crossing of the postsynaptic neurone. Moreover, compensatory synaptic changes after partial deafferentation of vestibular neurones might be responsible for the maintenance of firing variability (Ris & Godaux, 1998). The influence of the spatial distribution of synaptic inputs has also been noted as a factor controlling firing variability (Banks & Sachs, 1991). Finally, an interaction between both intrinsic and synaptic factors might explain changes in variability of the discharge activity (Piotrkiewicz, 1999).
It has been shown that the maximum steady ISI that spinal motoneurones attain during constant current injection corresponds to the duration of the action potential afterhyperpolarisation (AHP; Kernell, 1965). Nonetheless, spinal and cranial motoneurones can fire in vivo at frequencies lower than the reciprocal of the AHP duration (Matthews, 1996). Factors that alter membrane potential stability, such as synaptic noise, late afterdepolarizations and subthreshold oscillatory mechanisms, can be responsible for producing firing frequencies lower than expected from the AHP duration (Gueritaud, 1988; Kiehn et al. 2000). Several studies in sensory neurones and motoneurones have shown that whenever a cell fires using long intervals, the variability is higher than at short intervals (Ratliff et al. 1968; Pastor et al. 1991; Ris & Godaux, 1998; Powers & Binder, 2000). Thus, the shape of the plot of standard deviation versus mean ISI is curved towards high variability at long ISIs (low firing frequencies). Interestingly, the ISI at which the variability rises has been related to the AHP duration (Piotrkiewicz, 1999; Powers & Binder, 2000). Discharge variability, despite the regulatory effect produced by the AHP trajectory, has been attributed to several sources, such as synaptic noise (Calvin & Stevens, 1968), the location of inhibitory inputs (Shadlen & Newsome, 1998), the electrotonic distribution of inputs (Banks & Sachs, 1991) and the temporal coordination of inputs (Lampl et al. 1999).
Therefore, two important factors pose a strong influence on the regulation of variability of spike trains, the AHP and the temporal and spatial structure of synaptic inputs. In order to investigate the role of excitatory and inhibitory inputs in the firing regularity of abducens neurones we chemically blocked these synaptic inputs using our recently developed model of central deafferentation by means of a tetanus neurotoxin (TeNT; González-Forero et al. 1999, 2001a,b). By using two different doses, we produced opposite effects in the firing pattern of motoneurones. Thus, a low dose of TeNT produced disinhibitory effects in firing, whereas a larger dose reduced firing modulation and resting rate. We found that, in the absence of any change in the AHP, synaptic drive strongly influenced firing regularity. Successive elimination of inhibitory and excitatory synaptic drive produced corresponding increases in the motoneuronal regularity.
METHODS
Extracellular single-unit recordings were performed in four adult cats. Intracellular recordings of abducens motoneurones were obtained in four additional adult cats. Immunohistochemistry for synaptophysin was performed in another two cats. Animals were purchased from the authorised breeders at the University of Cordoba (Spain). All experimental procedures were performed in accordance with the relevant directives of the European Union (86/609/EEC) and Spanish legislation for the use and care of laboratory animals (BOE 67/8509-12, 1988). Surgical procedures and post-operative care followed the National Institutes of Health (USA) guidelines (http://oacu.od.nih.gov/regs/guide/guidex.htm) and recommendations for the preparation and maintenance of higher mammals for neuroscience experiments (NIH publication No. 94-3207, 1994).
Surgical preparation for chronic recordings
Following a protective injection of atropine sulphate to reduce vagal reflexes (0.5 mg kg−1, i.m.), the animals were anaesthetised with sodium pentobarbital (50 mg kg−1, i.p.) and maintained in a deeply anaesthetised state with supplementary doses (3 mg kg−1, i.p.) throughout the 3 h that surgery lasted. The depth of anaesthesia was assessed by monitoring sudden changes in the electrocardiogram rate measured non-invasively. The animals were mounted in a stereotaxic frame and implanted with two silver bipolar electrodes to stimulate bilaterally the VIth nerve at its exit from the brainstem. Coils, 22 mm diameter, made up of Teflon-insulated multistranded stainless-steel wire (200 μm wire section), were sutured to the sclera of both eyes to record eye movements by means of the magnetic field search-coil technique (Fuchs & Robinson, 1966). Eye coils did not interfere with the movement of the nictitating membrane or eyelids (Gruart et al. 1993). A square window (5 mm × 5 mm) was drilled in the occipital bone to allow transcerebellar access with microelectrodes to the abducens nucleus during recordings. A chamber made of acrylic resin was constructed around the window. To immobilise the head during recording sessions, a restraining system was constructed using three bolts cemented by means of acrylic resin to self-tapping screws attached to the skull. The leads of all electrodes and coils were soldered to a socket cemented to the restraining system.
Post-operative and continuous care
Post-operative care was provided daily throughout the experiment. During the initial three days, antibiotics (streptomycin and penicillin, 20 000 i.u. kg−1 day−1, i.m.), corticosteroids (dexametasone, 5 mg kg−1 day−1, i.m.) and analgesics (pirazolone, 0.1 g kg−1 day−1, i.m.) were administered. The animals were then monitored daily for potential signs of distress by observing their behavioural state in relation to feeding and grooming habits, as well as social interactions. All the animals used showed normal behaviour. The eyes and the skin around the implanted sockets were also inspected daily and cleaned if needed with sterile saline and instilled with antibiotics (gentamicin sulphate) and corticosteroids (dexametasone). During the post-operative period the animals were adapted to the feline restraining system by seating each animal for periods of 20 min during the aseptic cleaning of the recording chamber and calibration of eye movements. Cleaning consisted of rinsing the chamber with sterile saline and instillation of the required dose of antibiotics (gentamicin sulphate) and corticosteroids (dexametasone). To close the chamber, the cerebellar surface was protected with a silicone tissue and the chamber was sealed with aseptic gauze and a cap.
Extracellular recordings
Recording sessions started after 2 weeks of recovery, they were scheduled on alternate days and each was 2.5 h in duration. At the beginning of the recording session the animal was seated comfortably and gently restrained with elastic bandages in their feline-restraining system, as previously described (de la Cruz et al. 1994, 2000). Briefly, the assembly consisted of a sturdy Perspex box cushioned with spongy material. The box was located within the eye movement recording frame so that the eyes were in the geometric centre. None of the animals showed any sign of discomfort during the recording sessions. Continuous non-invasive monitoring of heart rate (beats min−1) and respiratory rhythm (cycles min−1) confirmed that the animals were not stressed during recording, because measured rates (heart rate, 182 ± 8 beats min−1; respiratory rate, 53 ± 5 cycles min−1) were similar to values obtained with the animals resting on the lap of one of the experimenters (heart rate, 184 ± 9 beats min−1; respiratory rate, 54 ± 6 cycles min−1). The head restraining and micromanipulator bars were attached to the box. The portion of dura mater accessible from the recording chamber was gently removed under local 2 % lidocaine anaesthesia at the beginning of the first recording session. Extracellular recordings were carried out with glass micropipettes bevelled to a resistance of 1-3 MΩ and filled with a conductive solution of 2 m NaCl. Prior to recording, the chamber was opened, tissue debris was gently removed after instillation of 2 % lidocaine and the cerebellar surface was then bathed in sterile saline containing droplets of antibiotics during the recording. We also examined, and cleaned if necessary, the palpebral margin of the animal. The abducens nucleus was located stereotaxically with the aid of the antidromic field potential evoked by electrical stimulation of the VIth nerve. Motoneurones were identified by their antidromic activation from the VIth nerve and by the collision test.
Data storage and analysis
The extracellular neuronal activity was amplified and filtered at a bandwidth of 10 Hz-10 kHz. Action potentials were fed into a window discriminator and the resulting Schmitt-trigger pulses were stored at a time resolution of 10 μs in a computer using a CED 1401 A/D card (Cambridge Electronics Design, UK). Computer programs were developed to display a histogram of instantaneous firing frequency of the neuronal discharge (i.e. the reciprocal of the interval between two consecutive spikes) and eye position. Data consisted of strings of ISIs (> 7) selected from epochs of stationary firing frequency occurring during stable eye fixations. Intervals were selected at least 200 ms after saccades to avoid the post-saccadic slide in firing rate that follows saccadic bursts. Interval epochs were selected from different eye fixations (> 20 per cell) to cover the range of firing frequencies of the studied motoneurone as exemplified in Fig. 1. For each epoch, the mean, standard deviation and coefficient of variation were calculated. The number of spikes within the epochs was limited in the control and low-dose treatment by saccades. Whenever the eye fixation included enough intervals (> 200), histogram intervals and autocorrelation histograms were constructed. A total of 87 identified abducens motoneurones were analysed. Regression analysis and comparison between groups were performed using the Sigma-plot and Statistica packages.
Figure 1. Firing characteristics of abducens motoneurones in control and after TeNT.
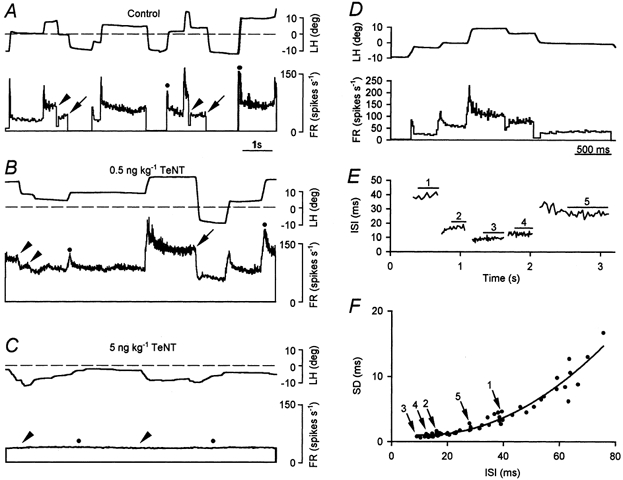
A, control abducens motoneurones discharged tonically (FR, in spikes s−1) in relation to eye position (LH, left horizontal eye position, in deg) during spontaneous fixations. Bursts of action potentials were present during saccades in the on-direction (•) and transient pauses (arrowheads) or long pauses (arrows) occurred during off-directed saccades. The dashed line indicates the mid-position of the eye. Upward deflections represent eye movements to the left. B, example of a motoneurone recorded 7 days after a low dose of TeNT, showing an overall increase in firing rate, reduced pauses for off-directed saccades (arrowheads), and the absence of silenced firing during large off-directed saccades (arrows). C, discharge of a motoneurone recorded 7 days after a high dose of TeNT showing a complete absence of modulation for both on- (•) and off- (arrowheads) directed eye movements. D, firing rate of a control motoneurone recorded in the left abducens nucleus in relation to the left horizontal eye position during 5 spontaneous fixations. E, interspike intervals (ISI, ms), after clipping out saccadic discharges for clarity, from the firing shown in D. Horizontal lines indicate the epochs used for calculation of ISI statistics. F, relation between the standard deviation (s.d.) and the mean ISI for the motoneurone in D and E. Arrows point to the data indicated by numbers in E. The curved line represents the equation of the polynomial quadratic y = 1.453 - 0.077x + 0.003x2 obtained by non-linear regression that best adjusted the data (r = 0.97; P < 0.001).
Tetanus neurotoxin injection
Animals were anaesthetised with sodium pentobarbital (50 mg kg−1, i.p.) for the injection of TeNT (kindly provided by Dr J.O. Dolly; Imperial College, London). The left lateral rectus muscle was isolated under a dissecting microscope and a total of 4 μl of the diluted neurotoxin was injected using a microsyringe. The neurotoxin doses employed were 0.5 and 5 ng kg−1 (referred to as low dose and high doses, respectively) dissolved in physiological saline. In no case was systemic or facial tetanus produced. In animals prepared for chronic recordings, control recordings were taken prior to TeNT injection. The minimum lethal dose of the toxin badge used, assessed in 250 g Wistar rats, was 25 ng kg−1. The LDmin was adjusted to kill after 5 days. A total of 10 rats were used in five groups (2 rats per group). Anaesthetized rats (sodium pentobarbital, 50 mg kg−1 i.p.) were injected in the gastrocnemius muscle with 2 μl TeNT in sterile saline at doses per group of 50, 40, 30, 25 and 20 ng kg−1. General tetanus appeared in each group within 24 h prior to death except the 20 ng kg−1 group, which survived 7 days and were killed with an overdose of sodium pentobarbital (100 ng kg−1, i.p.). Two additional animals were injected with 10 and 15 ng kg−1; they had not developed signs of general tetanus after 15 days and were also killed by barbiturate overdose. Injected animals received the post-operative care described above.
Acute recording experiments
Cats were pre-injected with TeNT as described above (2 animals per dose). After 7 days, animals were anaesthetised with sodium pentobarbital (50 mg kg−1, i.p.) and maintained at a deep level of anaesthesia (see below) throughout the preparatory and experimental procedures with a continuous infusion of pentobarbital (3 mg kg−1 h−1) injected through an indwelling catheter inserted in the brachial vein. A protective injection of atropine sulphate (0.5 mg kg−1, i.m.) was administered to reduce vagal reflexes. A tracheotomy was performed and the animals were mounted in a stereotaxic device and artificially ventilated. End-tidal expired CO2 was kept at 4 %. Blood pressure was measured by inserting an indwelling catheter in the brachial artery. A bilateral pneumotorax was performed to reduce mechanical thoracic coupling with the recording. Two subcutaneous electrodes were used for electrocardiogram monitoring. Body temperature was kept constant at 38 °C with a thermoregulated heating pad. The depth of anaesthesia was assessed by monitoring sudden cardiovascular responses (changes in heart rate and arterial pressure) or the constriction level of the pupil in response to the electrical stimuli used in the experiments. Stainless-steel hook electrodes were inserted bilaterally into the lateral rectus muscles for the antidromic identification of motoneurones. Silver bipolar electrodes were placed bilaterally near the ampulla of the horizontal canal (Baker & Highstein, 1975). The vestibular apparatus was exposed extracranially through the temporal bone via a dorsolateral approach. In all animals the correct placement of the electrodes was assessed by the induction of appropriate movements of the uninjected eye. Neuromuscular blockade was then induced with gallamine triethiodide injected through the brachial vein (3 mg kg−1, i.v.). All incisions were periodically infiltrated with 2 % lidocaine. During periods of recovery from the blockade (approximately every 60 min) we also tested the depth of anaesthesia by assessing the state of withdrawal reflexes and corneal and pupillary reflexes in response to natural stimuli or electrical stimuli used in the experiments. Neuromuscular blockade was then induced again using the same dose of gallamine triethiodide. The abducens nucleus was stereotaxically approached through a craniotomy performed in the occipital bone, and searched with the aid of electrical stimuli applied using microelectrodes which were positioned until the appropriate field potentials were found. Extracellular field potentials were recorded with glass micropipettes containing 2 m NaCl. Intracellular recordings were made with glass micropipettes filled with 3 m potassium acetate and bevelled to a resistance of 8-20 MΩ. Electrical signals were recorded with a bridge amplifier and, for display and digitisation purposes, signals were DC-coupled for low gain and AC-coupled (1 Hz-10 kHz) for high gain. Data were digitally stored and analysed by means of programs written for a digital converter (Cambridge Electronics Design 1401 Plus). At the end of the experiment, the animals were killed with an overdose of sodium pentobarbital (100 mg kg−1, i.v.).
Immunohistochemistry
Two animals, one injected with a high dose of TeNT and the other with a low dose, were anaesthetised after 7 and 15 days, respectively, with an overdose of sodium pentobarbital (100 mg kg−1, i.p.) and perfused transcardially with 1 l of physiological saline followed by 2 l of 4 % paraformaldehide in phosphate buffer (pH 7.4). Transverse sections 40 μm thick of the pons at the level of the abducens nucleus were cut with a vibratome and collected free-floating in 0.01 m phosphate buffer (pH 7.4), containing 0.9 % saline and 0.1 % Triton X-100 (PBS-TX). The sections were blocked with normal goat serum (1:10 in PBS-TX), and then placed in the primary antiserum solution containing a rabbit polyclonal synaptophysin antibody (Zymed Laboratories, San Francisco, CA, USA; 1:1000 dilution) for 12 h. Thereafter, the sections were washed in PBS-TX and incubated for 2 h in a 1:250 dilution of biotinylated goat anti-rabbit IgG (Vector Laboratories, Burlingame, CA, USA) in PBS-TX. Biotin was revealed according to the avidin-biotin-horseradish peroxidase (HRP) complex (ABC; Vector Laboratories) method (Horikawa & Armstrong, 1988). The ABC solution was prepared in PBS-TX. After incubating for 90 min, the HRP was visualised using 3,3′-diaminobenzidine tetrahydrochloride (DAB) as the chromogen. Finally, the sections were washed in PBS, mounted on gelatine-coated slides, dehydrated in graded alcohols, cleared in xylene and covered with resin.
Imaging and quantitative analysis
Sections were analysed using an Olympus BX60 microscope, and pictures were captured with a digital camera (Spot-2 camera; Diagnostic Instruments, Sterling Heights, MI, USA). Images were analysed by measuring the optical density (corrected for background subtraction) of 0.16 mm2 areas randomly distributed through the abducens nucleus. Data were collected from 12-14 sections ipsilateral (experimental side) and contralateral (control side) to the TeNT injection site for both doses. Pairwise comparison of data from experimental and control sides was performed using Student's t test.
RESULTS
Discharge pattern of abducens motoneurones
Abducens motoneurones are recruited into activity at a certain eye position threshold. Beyond that threshold they fire at regular cadences during eye fixations. The relation between abducens motoneurone firing and eye movements indicates a correlation of burst discharges with eye velocity and of tonic firing with eye position. An example of control firing is shown in Fig. 1A for a left side motoneurone during eye movements. Two modes of firing are observed, tonic for fixations and bursting for on-directed saccades (Fig. 1A, •). Cells briefly paused during off-directed saccades (Fig. 1A, arrowheads) and went into cut-off (Fig. 1A, arrows) during eccentric eye fixations in the off-direction.
The discharge pattern was modified shortly after (2 days) the injection of either a low or high dose of TeNT in the lateral rectus muscle, and lasted for about 20 days. We collected the data for this study during the period of maximal effects from 7 to 15 days. The low-dose treatment (0.5 ng kg−1) resulted in an overall increase of firing due to disinhibition (see below). Neither pauses during off-directed saccades (Fig. 1B, arrowheads) nor cut-offs (Fig. 1B, arrows) were present for large excursions of the eye in the off-hemifield. As a consequence, the injected eye showed a deviation of 8.4 ± 2.3 deg towards the on-hemifield. The most severe firing pattern modification resulted after the high-dose treatment (5 ng kg−1). An example of minimal relationship to eye movements is shown in Fig. 1C; •, arrowheads). In contrast to the effects obtained with the low dose, the injected eye deviated towards the off-hemifield by −15.7 ± 6.1 deg. Detailed analysis of the ISI statistics during fixations showed that the larger the mean ISI (i.e. low firing frequencies) the larger the variability measured as the standard deviation. An example is shown in Fig. 1E, which demonstrates the reduction in variability with shorter ISIs. After clipping out the saccadic bursts (Fig. 1D), quasi-stationary ISI fluctuations remained during the ensuing fixation. The post-saccadic slide in firing after bursts or pauses was excluded by adjusting the data collection (denoted by straight lines in Fig. 1E). For the construction of the standard deviation versus mean ISI plots we collected as many epochs as possible fulfilling these characteristics in cells belonging to the three experimental groups. Since the variability always increased with longer intervals, it appeared as an upward deflexion in the plot, an example of which is illustrated for a control motoneurone (Fig. 1F).
The ISI and autocorrelation histograms
For analysis of firing regularity, we selected epochs where firing rate was stationary, namely, the mean and the variance of the ISI sequences did not change overly and there was no conspicuous trend in the firing rate (Holden, 1976). As shown in Fig. 2A–C for a similar mean firing frequency, the discharge variability decreased for low- and high-dose-treated motoneurones compared to control. ISI histograms constructed from at least 150 intervals from the same eye fixation followed normal distributions (Kolmogorov-Smirnov test, P > 0.05). Control cells showed the largest variance of ISIs (Fig. 2D). In contrast, high-dose-treated motoneurones showed the narrowest ISI distribution (Fig. 2F). Low-dose-treated motoneurones represented an intermediate case (Fig. 2E). In no case were distributions significantly skewed to the right, which would indicate irregular spiking. Autocorrelation histograms demonstrated the highly regular and predictable spike trains produced by abducens motoneurones. In control motoneurones up to seven peaks were readily observed. However, less than three peaks (one, for instance, in Fig. 2G) usually appeared isolated. In low-dose-treated motoneurones, more peaks, up to 11, were observed (Fig. 2H). With high-dose treatment (Fig. 2I), a higher number of peaks, up to 20, with 12 or more of them fully isolated, were usually found. The number of discrete peaks in the autocorrelation functions, obtained in the 40-70 Hz band, significantly increased from a mean control value of 1.7 ± 0.5 peaks to 3.4 ± 0.7 and 12.4 ± 2.2 peaks for low- and high-dose-treated motoneurones, respectively (one-way ANOVA, P < 0.05).
Figure 2. ISI histograms and autocorrelograms.
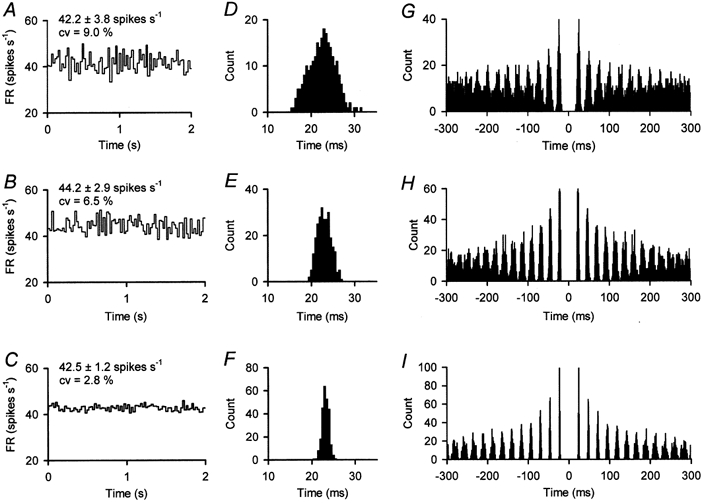
A-C, two second epochs of instantaneous firing rate (FR) in a control (A), a low-dose-treated (B) and a high-dose-treated (C) abducens motoneurone. Stationary epochs were selected as having similar mean firing rate (mean ± s.d. in spikes s−1) across groups. Note, however, from A to C a reduction of both the standard deviation and the coefficient of variation (cv). D-F, ISI histograms from the corresponding cells shown in A-C, but constructed using a 6 s sample (bins of 0.5 ms). All were normal distributions (Kolmogorov-Smirnov test; P > 0.05). G, the control autocorrelogram (1 ms bin size) showed one clear peak and up to 6 other peaks fused at the base (same cell as in A and D). H, the autocorrelogram of the low-dose-treated motoneurone shown in B and E demonstrated a greater regularity than the control motoneurone. It showed 4 non-fused peaks at the base and 6 other fusing peaks. I, the autocorrelogram of the high-dose-treated motoneurone illustrated in C and F showed an extraordinarily predictable conditional probability of spike occurrence.
The relation of standard deviation to the mean ISI
We plotted separately data that followed on- or off-directed saccades to ascertain whether there was an influence on variability of the large excitation or inhibition produced by the saccadic discharges. The standard deviation-mean interval plot showed the different ranges of variability covered by the intervals sampled during stationary fixations after on- or off-directed saccades. However, this was due to the different interval ranges exhibited by the neurone after on- or off-directed saccades. As shown in Fig. 3A and B for a control motoneurone, similar standard deviations were attained over the range of short intervals (i.e. 7-35 ms). Thus, if plotted together, data merged along the same trend. Long intervals (i.e. > 35 ms) were only attained after off-directed saccades. We constructed plots of joint ISIs, that is, we plotted of one interval against the previous interval, separating intervals occurring after on- or off-directed saccades. If data points were distributed along a line with a slope of 1, this would demonstrate a tendency for the duration of the interval to be repeated, so if an interval were short the next interval would also be short. For short intervals (Fig. 3C), the joint ISI plots clustered along lines with slopes close to 1 and correlation coefficients (r) larger than 0.96 (n = 6). The plots of joint ISIs obtained in the low frequency range showed a larger scattering around the line of with a slope of 1 (r > 0.88, n = 6). Thus, very long intervals (for instance, longer than 40 ms in Fig. 3D) were followed by intervals either shorter or longer by up to ≈50 %.
Figure 3. Effect of previous firing on motoneuronal variability.
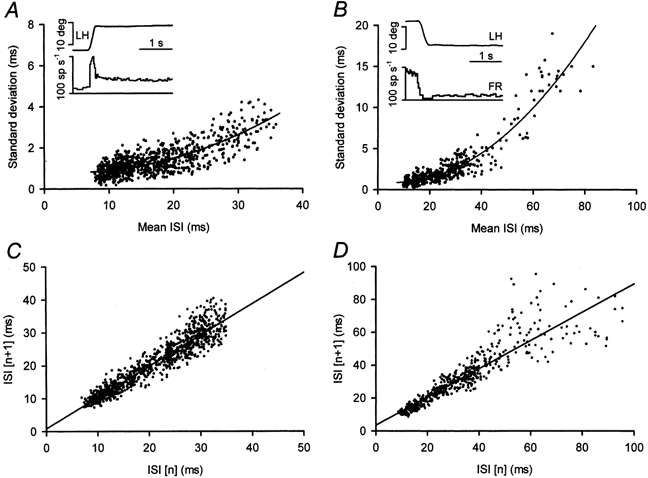
A, plots of the standard deviation versus the mean ISI of 925 intervals from 49 fixations obtained after on-directed saccades (see inset for an example) in a control motoneurone. The line is the inverse quadratic regression y = 0.846 - 0.022x + 0.002x2 (r = 0.94; P < 0.001). B, same as A, but for 550 intervals from 36 fixations obtained after off-directed saccades analysed in the same motoneurone. The inverse quadratic function was y = 1.033 - 0.042x + 0.003x2 (r = 0.93; P < 0.001). Note larger standard deviations for intervals longer than 40 ms. C, joint ISI plot of the intervals in A; data clustered along the regression line y = 0.81 + 0.95x (r = 0.94; P < 0.001). D, joint ISI plot of the intervals in B; data clustered along the regression line y = 3.56 + 0.87x (r = 0.91; P < 0.001). Also note larger scatter of data for intervals longer than 40 ms.
The dependence of the standard deviation on the mean ISI has previously been described in motoneurones (Piotrkiewicz, 1999; Powers & Binder, 2000). These authors described a ‘break point’ interval since they fit two straight lines for the low- and high-variability parts of the plot. In the present data, we attempted the fitting of straight lines to find their crossing point. However, the determination of that point depended on the data set chosen to construct the regression lines. We then used non-linear regression of the data. The data plot coursed asymptotically towards the co-ordinate axes such as a hyperbole appeared. A symmetric hyperbole has the property that the product of the ordinate and the abscissa is always constant. Applied to our data, this would imply that the product of the mean frequency and the standard deviation would always be constant irrespective of the mean frequency at which the cell was firing. This would explain the observation that the larger the firing frequency the less would be the variability of the data and vice versa. Hyperbolic regression to the data was good in the three experimental situations (r > 0.72; Fig. 4A–C; _ _ _). However, it was noticed that the data clearly failed to fit a hyperbolic model. Thus, systematically, for large firing frequencies variability was less than would be expected with the hyperbolic fit. Conversely, for low firing frequencies, variability was larger than would be expected with the hyperbolic fit. A better fit to the data (r > 0.86) was obtained when we used an inverse quadratic function having both a linear and a quadratic term in the equation (Fig. 4A-C; –).
Figure 4. Relation of standard deviation and coefficient of variation with firing frequency.
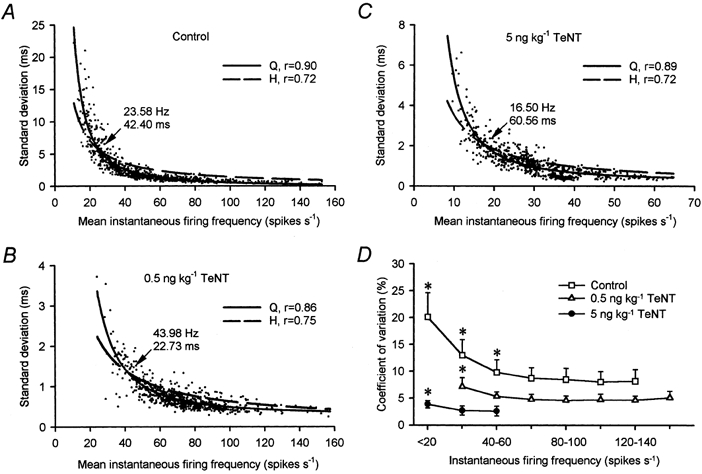
A, plots of the standard deviation versus the mean firing frequency of 857 stationary epochs obtained from 30 control motoneurones. The dashed line is the hyperbolic (H) function y = 143.8(0.2 + x)−1 (r = 0.72; P < 0.001). The continuous line is the polynomial quadratic (Q) inverse function y = −0.2 + 51.5x + 2423.6x2 (r = 0.90; P < 0.001). B, same as A, but for 770 fixations from 29 low-dose-treated motoneurones. The hyperbolic regression was y = 52.2(0.5 + x)−1 (r = 0.75; P < 0.001). The polynomial regression was y = 0.2 + 1.3x + 1760.6x2 (r = 0.86; P < 0.001).C, same as A, but for 775 fixations analysed in 28 high-dose-treated motoneurones. The hyperbolic function was y = 33.8(0.2 + x)−1 (r = 0.72; P < 0.001). The polynomial regression was y = 0.2 + 8.2x + 426.1x2 (r = 0.89; P < 0.001). In A-C, the point of crossing of both curves is shown (arrow) both in rate and interval units. D, mean coefficient of variation (in %) grouped for firing frequency intervals of 20 spikes s−1 for 30 control (□), 29 low-dose- (▵) and 28 high-dose-treated (•) abducens motoneurones (error bars are s.d.). Asterisks indicate those firing intervals whose mean coefficient of variation was significantly different to the rest of firing intervals within the same treatment (two-way ANOVA, Scheffé's post hoc comparisons, P < 0.001).
We used the crossing point of the hyperbole and inverse quadratic curves to determine the frequency (or its inverse, the ISI) at which the firing statistics changed from a high variability to a low variability pattern. In the plots of Fig. 4A–C, the rupture points so determined for the entire population of motoneurones (28-30 cells per group) are indicated. Large differences can be observed in the rupture interval point between treatments, as well as in the frequency ranges used by the cells. In fact, low-dose-treated motoneurones rarely fired at less than 30 Hz (ISI of 33.3 ms), well above the rupture point of the control group. The opposite applied for high-dose-treated motoneurones, whose firing was in a low frequency band (12-65 Hz). Analysis of individual motoneurones that were widely sampled at different frequencies showed that the mean rupture interval point after the low-dose treatment (20.9 ± 3.9 ms; n = 12) was smaller than control (39.9 ± 4.9 ms; n = 12). Rupture intervals were larger (60.7 ± 6.1 ms; n = 12) than control after the high-dose treatment (one-way ANOVA, P < 0.05). That is, clear-cut differences of approximately 20 ms below and above control data were observed for the two treatments.
The effect of changing instantaneous firing frequency on variability
We studied the variability of the discharge as a function of firing frequency for the different treatments. The coefficient of variation (i.e. the percentage ratio of the standard deviation to the mean) is insensitive to the scale of measurements, thus proving adequate for comparison between the different groups. The coefficient of variation changed in control cells as a function of the firing frequency. Thus, with low firing frequencies the coefficient of variation increased (Fig. 4D). A similar trend was observed in the TeNT-treated groups of motoneurones. The largest variability was near 20 % for frequencies < 20 spikes s−1 in control motoneurones. The average variability irrespective of the frequency was 11.2 % for the control group. With low-dose treatment, overall variability decreased to 5.1 % (a reduction of 54.4 %), and the high-dose treatment further reduced variability to 3.1 % (a reduction of 72.3 %; one-way ANOVA, P < 0.05). Multiple post hoc comparisons demonstrated that the upward deflexion tendency for low frequencies found in the control group was still present in both TeNT-treated groups (Scheffé's test; P < 0.001).
AHP characteristics and their relation to the variability of discharge
The AHP duration has been implicated as a determinant factor controlling regularity of firing. Under deep barbiturate anaesthesia, the minimum steady discharge rate has been found virtually to be the reciprocal of the AHP duration (Kernell, 1965). The AHP duration, therefore, is related to the rupture point in the standard deviation-mean ISI plots (Piotrkiewicz, 1999), as confirmed in motoneurone groups with different properties (Powers & Binder, 2000). Since our rupture interval changed for the different treatments, it was reasonable to expect corresponding changes in the AHP duration or amplitude. We measured in acute experiments the AHP properties of antidromically activated motoneurones. As reported by Grantyn & Grantyn (1978), abducens motoneurones, like other extraocular motoneurones (Baker & Precht, 1972), have shorter AHPs than spinal motoneurones (Fig. 5B). The AHP amplitude also increases by double antidromic activation (Fig. 5A). The average AHP duration of our control group was 48.4 ± 8.8 ms (n = 15; Table 1) with a half-width of 19.7 ± 7.9 ms and an amplitude of 1.9 ± 0.7 mV. Since the amplitude of the AHP varies with changes in the resting potential, we performed the measurements at the resting voltage of −60 mV. Neither of the two TeNT doses used affected the measured parameters of the AHP (one-way ANOVA, P > 0.05; Table 1). Moreover, we did not find any changes in the AHP amplitude on applying double antidromic activation among the different groups (Fig. 5C–F). We analysed the duration of the AHP versus the rupture ISIs for the different groups. Results are presented in Fig. 5G. In the control group, both measures were similar, indicating that the rupture interval could be an estimator of the duration of the AHP. However, the rupture interval was shorter than the AHP duration in the low-dose group (Fig. 5G; ** P < 0.001) and longer than the AHP duration in the high-dose group (Fig. 5G; * P < 0.02, two-way ANOVA, Scheffé's post hoc comparisons). However, as noticed above, differences in the value of the rupture interval were significant (Fig. 5G; † P < 0.001). This result indicated that our treatment revealed factors other than the AHP duration that could influence firing variability.
Figure 5. Comparison of the AHP duration of antidromic spikes and the rupture ISI.
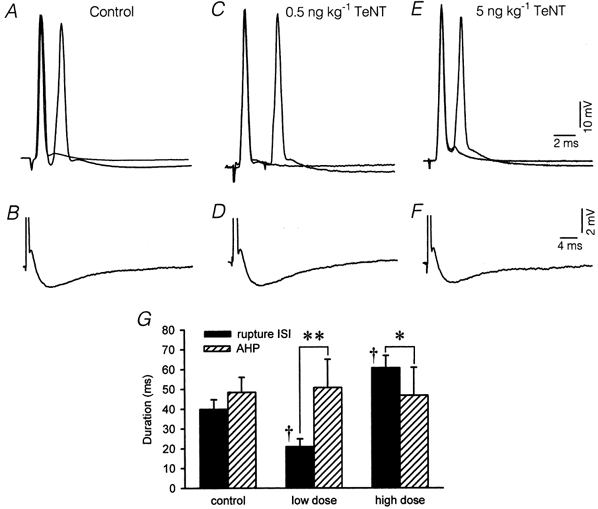
Intrasomatic recordings of 6 abducens motoneurones antidromically activated from the VIth nerve. A, double and single antidromic spike activation of a control motoneurone (two traces superimposed). B, afterpotentials of a control motoneurone, spike truncated. C and D, same as A and B but for a motoneurone recorded 7 days after treatment with the low TeNT dose. E and F, same as A and B but for a motoneurone recorded 7 days after the high TeNT dose. G, histogram representing the duration (mean ± s.d.) of the rupture ISI (filled bars) and the AHP (hatched bars) of antidromically activated abducens motoneurones. Significant differences were: * P < 0.02 and ** P < 0.001, within-treatment groups comparisons; † P < 0.001, comparisons with respect to control (two-way ANOVA, Scheffé's post hoc comparisons).
Table 1.
Properties of the afterhyperpolarisation of control and TeNT-treated motoneurones
| Control | Low dose | High dose | |
|---|---|---|---|
| Duration (ms) | 48.4 ± 8.8 | 50. 6 ± 14.3 | 46.7 ± 14.2 |
| Amplitude (mV) | 1.9 ± 0.7 | 1.4 ± 0.8 | 2.2 ± 0.8 |
| Half-width (ms) | 19.7 ± 7.9 | 18.2 ± 5.8 | 19.0 ± 6.2 |
| Rise time (ms) | 4.2 ± 2.2 | 3.2 ± 1.04 | 4.3 ± 1.6 |
| Time to half-decay (ms) | 12.4 ± 5.4 | 13.9 ± 5.7 | 14.3 ± 5.6 |
Values are means ± s.d. of antidromically identified abducens motoneurones (the number of cells analysed was 15, 9 and 9 for control, low-dose and high-dose groups, respectively).
Vestibular synaptic potentials of abducens motoneurones
Electrical stimulation to the ampulla of the horizontal semicircular canals evoked contralateral EPSPs and ipsilateral IPSPs in abducens motoneurones (Baker et al. 1969; Fig. 6A). EPSPs usually had a rising phase with two to three steps, reflecting the firing in doublets and triplets of second order vestibular axons (McCrea et al. 1980). Control EPSPs had a mean latency of 1.24 ± 0.14 ms (n = 9), consistent with a disynaptic origin, and a mean amplitude at 2 × voltage threshold of 5.49 ± 0.86 mV (Table 2; Fig. 6A, Vc). IPSPs elicited by ipsilateral canal stimulation were, on occasion, preceded by a small EPSP (Fig. 6A, Vi) of utricular origin (Uchino et al. 1994). The latency of IPSPs was 1.50 ± 0.23 (n = 9) and had a mean amplitude at 2 × threshold of 4.20 ± 0.59 mV. Both the rise time (1.25 ± 0.23 ms) and the half-width (2.22 ± 0.50 ms) of IPSPs were significantly shorter than in EPSPs (Table 2), indicating a closer somatic location of the former (P < 0.01, Student's t test).
Figure 6. Alterations in vestibular synaptic potentials on abducens motoneurones.
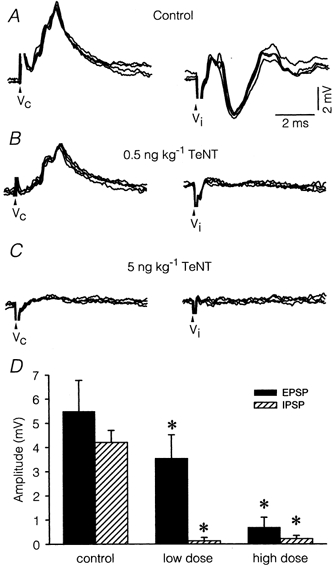
Excitatory (EPSP) and inhibitory (IPSP) postsynaptic potentials recorded in representative motoneurones at different stages post-treatment after single shock stimulus applied to the contralateral (Vc) and ipsilateral (Vi) horizontal semicircular canal ampulla. Each pair of responses corresponds to the same motoneurone. A, EPSPs and IPSPs recorded in a motoneurone from the control side of an animal injected with a low dose of TeNT 7 days previously. B, same as A, but from a motoneurone recorded on the treated side. Note that only EPSPs were patent. C, synaptic potentials in a motoneurone recorded 7 days after a high-dose injection were abolished. D, amplitude changes of EPSPs (filled bars) and IPSPs (hatched bars) in the groups studied. Asterisks indicate significant differences with respect to control (two-way ANOVA, P < 0.05).
Table 2.
Properties of EPSPs and IPSPs evoked in motoneurones by vestibular stimulation
| Latency (ms) | Amplitude (mV) | Rise time (ms) | Half-width (ms) | |
|---|---|---|---|---|
| Control EPSP | 1.24 ± 0.14 | 5.49 ± 0.86 | 1.66 ± 0.21 | 2.89 ± 0.72 |
| LD EPSP | 1.35 ± 0.10 | 3.54 ± 0.96* | 2.20 ± 0.20* | 3.48 ± 0.99 |
| HD EPSP | 1.36 ± 0.13 | 0.68 ± 0.41* | 2.50 ± 0.90* | 6.68 ± 2.17* |
| Control IPSP | 1.50 ± 0.23 | 4.20 ± 0.59 | 1.25 ± 0.23 | 2.22 ± 0.50 |
| LD IPSP | 1.62 ± 0.19 | 0.13 ± 0.04* | 1.43 ± 0.28 | 2.10 ± 0.33 |
| HD IPSP | 1.40 ± 0.21 | 0.22 ± 0.12* | 1.30 ± 0.74 | 2.36 ± 0.72 |
Values are means ± s.d. of antidromically identified abducens motoneurones. The number of cells analysed was 9, 7 and 5 for control, low-dose (LD) and high-dose (HD) groups, respectively. Asterisks indicate significant differences with respect to the control group (one-way ANOVA, P < 0.05).
In seven motoneurones recorded in the treated side 7 days after the low-dose injection we found drastic alterations in the characteristics of synaptic potentials. As shown in Fig. 6B and D, EPSPs showed decreased amplitude. The mean amplitude of EPSPs after the low-dose treatment was significantly reduced to 3.54 ± 0.96 mV (one-way ANOVA; P < 0.05). However, the effects were more intense for IPSPs since they were virtually abolished (Fig. 6B, Vi). With the high-dose treatment, EPSPs were also extremely reduced in amplitude (Table 2). Thus, in motoneurones recorded 7 days post-injection (Fig. 6C), the mean amplitude was 0.68 ± 0.41 mV (n = 5), and in 12 different cells not included in this mean, no EPSPs were detected. The amplitude of control IPSPs was sensitive to both hyperpolarising and depolarising currents (not illustrated). We attempted systematically to reveal IPSPs in TeNT-treated motoneurones by applying transmembrane currents. In no case were IPSPs revealed after transmembrane current injections. EPSPs of contralateral origin recorded after the low dose of TeNT showed reduced sensitivity to externally applied currents, suggesting that the source of the synaptic current might be located more distally in the dendritic tree than in the control situation. This suggestion was further reinforced in the case of EPSPs of contralateral vestibular origin, which showed a significant increase (one-way ANOVA; P < 0.05) in half-width and in rise time occurring after TeNT treatment (Table 2).
Changes in synaptophysin immunoreactivity in the abducens nucleus
All the effects reported in relation to firing properties were long lasting, so that changes appeared early during the first week, reached a summit by the second week and finally recovered slowly over up to 5 weeks (not illustrated, but see González-Forero et al. 2001b). We questioned whether firing and synaptic changes were accompanied by a parallel morphological alteration affecting the density of afferent synaptic boutons. Thus, we carried out immunostaining against synaptophysin, a marker of synaptic terminals, at survival times when physiological changes were maximal. The optical density was measured in brainstem sections immunoreacted for synaptophysin. As a result of the low-dose injection, we detected a significant 14 % reduction in the optical density of the treated side compared to control (Fig. 7A; t test, P < 0.01). The high dose further reduced the optical density by 40. 5 % (t test, P < 0.001). A closer inspection of the immunoreacted material demonstrated a reduction in synaptophysin-immunoreactive terminals both in the neuropil (Fig. 7, C2 compared to control in C1) and surrounding cell body profiles (Fig. 7, E 2 versus E 1) after the low-dose treatment. The decreased optical density after the high-dose treatment was particularly noticeable in the neuropil (Fig. 7D2; control in D1), but also around somata (Fig. 7, F2 versus F1).
Figure 7. Changes in synaptophysin immunoreactivity in the abducens nucleus.
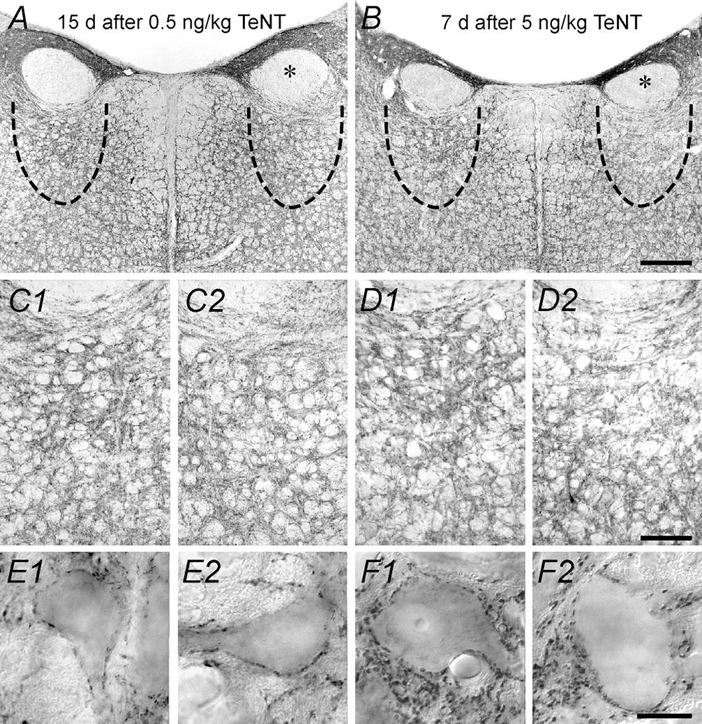
A, synaptophysin immunoreactivity in a brainstem coronal section from an animal injected 15 days previously with a low dose of TeNT. The asterisk indicates the genu of the facial nerve in the injected side. The approximate location of the abducens nucleus is indicated by a dashed line. B, same as A, but from an animal treated 7 days before with a high dose of TeNT. Calibration bar in B is 500 μm and applies to A. C1 and C2, photomicrographs illustrating details of the abducens nucleus neuropil from the same animal as in A for the control and treated sides, respectively. D1 and D2, same as before, but from the same animal as in B. Calibration bar in D2 is 100 μm and applies to all C and D panels. E1 and E2, high power magnification of cellular somata from the same animal as in A for the control and treated sides, respectively. F1 and F2, high power magnification of cellular somata from the same animal as in B. Calibration bar in F2 is 10 μm and applies to all panels in E and F. Note a reduction in the density of synaptophysin-immunoreactive terminals in the treated side.
DISCUSSION
We aimed to study the effects of selective synaptic denervation on the ISI statistics of abducens motoneurones. Stationary firing was quantified in motoneurones recorded in alert behaving cats during spontaneous ocular fixations. Two different doses of TeNT produced two separated modes of firing with different discharge characteristics. The low dose produced disinhibition, as demonstrated by higher rates of firing, lack of pauses and preferential loss of IPSPs. The high dose abolished both IPSPs and EPSPs and produced depression of firing with low or null modulation in relation to eye movements and low resting rates. Synaptophysin immunoreactivity demonstrated a progressive reduction in the density of afferent boutons in the abducens nucleus and around motoneurones with increasing TeNT doses. In parallel, discharge variability, as measured by the coefficient of variation, decreased after the low-dose-induced disinhibition and was further reduced after the high-dose-induced deafferentation.
Changes in the firing pattern and firing statistics as a result of the TeNT treatment
The firing pattern and ISI statistics of abducens motoneurones were drastically modified as a result of the two TeNT treatments. Changes could be explained by the progressive deafferentation produced by increasing doses of TeNT. Two parameters were affected, the range of intervals and the standard deviation. The firing range after the low dose of TeNT was shifted towards lower intervals than in controls, probably due to the lack of inhibition. However, a reduction of standard deviation at all frequencies produced narrower interval histograms and autocorrelation histograms with more discrete peaks. By contrast, motoneurones after the high dose fired primarily using long intervals, probably due to the large degree of deafferentation produced by TeNT. The standard deviation of the interval histogram further decreased while the number of discrete peaks in the autocorrelation function increased. Thus, differences in the probability density function between the experimental groups were only due to parametric changes (the mean and the standard deviation). Therefore, the histogram of ISIs in abducens motoneurones can be fitted with a normal distribution in agreement with a previous description (Gómez et al. 1986).
The stationary firing during fixations can, thus, be described as a constant mean firing plus a random variability normally distributed. Departures from the stationary pattern were systematically searched and excluded from the analysis, and therefore we focused our study on periods of eye fixation devoid of post-saccadic slides in firing (Miles et al. 1980; Fuchs et al. 1988). The slide produces a nearly monotonic decay in firing after on-directed saccades (seen in our traces of Fig. 1A and B). Increases of firing after off-directed saccades are also present, representing an additional potential departure from stationarity. The effect of the post-saccadic slide, if mixed with the analysed data, would produce highly skewed ISI histograms. The skew would be leftward if mostly decaying slides were included, or rightward if up-slides were more prevalent. In both cases, it would introduce a disruption (or breakdown) of the periodicity, such as occurs for firings that follow a Poisson ISI distribution. When the ISI histogram is a long tailed Poisson distribution, the autocorrelation histogram lacks structure, whereas a narrow normal distribution in regular neurones produces a multipeaked autocorrelation histogram as in our data (Bennett & Wilson, 1999).
AHP as a factor that influences the variability of discharge
The firing statistics of abducens motoneurones showed a similar profile as previously reported in sensory and motoneurones. Thus, at high frequencies of discharge, variability was low and, for low frequencies, the variability increased. However, when firing at low frequencies (large mean intervals) the distribution of intervals around the mean interval increased more rapidly than the mean interval itself. Thus, the relation of standard deviation to mean frequency was non-linear and curved upwards at low frequencies with two clear regions of different variability (Ratliff et al. 1968; Person & Kudina, 1972; Piotrkiewicz, 1999; Powers & Binder, 2000; also present data).
We analysed two factors as potential sources of variability, the AHP and the synaptic input on abducens motoneurones. Several investigators have found a relationship between the AHP duration and the shape of the standard deviation-mean interval curve. Person & Kudina (1972) indicated that the high variability region of that curve could be due to the increasing proportion of ISIs that were longer than the AHP. More recently, it has been proposed, in theoretical grounds, that the transition point in the plots of standard deviation versus mean interval is related to the duration of the AHP (Piotrkiewicz, 1999). After experimentally testing this relationship, it was concluded that detection of the transition point is not as clear, and represents, at best, a crude estimate of the AHP duration (Powers & Binder, 2000). Our data also support this finding. Thus, we propose that variability changes continuously across the entire range of intervals used by the motoneurone.
A hyperbolic curve fitted our data reasonably well. The symmetric hyperbole can be constructed by keeping constant the product of the pairs of x-y values that build it. Thus, irrespective of the mean frequency, the product of standard deviation and mean frequency would be constant if it were to follow an hyperbolic model. Our data showed that variability was lower than expected from the hyperbolic fit at high frequencies, and vice versa. We obtained, however, a better fit to the data using a polynomial function with linear and quadratic terms. The linear term indicates that the rise in variability is a continuum, even over the low variability region of the plot. The quadratic term introduces the sudden rise in variability when approaching long intervals. Similar functions can be found in the data from Ratliff et al. (1968). More recently, Goldberger et al. (2001) used quadratic functions to describe the relation between heart rate variability and sympathetic drive.
We defined our ‘break point’ as the interval that separated the low and high variability regions in the firing of motoneurones. This rupture point was ≈40 ms in control and varied between the two experimental groups. It decreased by ≈20 ms after the low-dose and increased by ≈20 ms after the high-dose treatment. In our controls, the rupture point was not different from the AHP durations which were also similar to previously reported values for the cat (Baker & Highstein, 1975; Grantyn & Grantyn, 1978) and rat (Gueritaud, 1988). However, we found no changes in the AHP parameters despite clear horizontal shifts in our standard deviation-mean frequency plots. Powers & Binder (2000) have shown that motoneurones with different AHP durations also have different ‘break points’. In contrast, we show different ‘break points’ without changes in the AHP duration. Consistent with our data, it has been previously shown that TeNT does not alter the AHP properties of either spinal motoneurones in vivo (Wiegand & Wellhöner, 1979; Kanda & Takano, 1983) or cultured central neurones (Dimpfel, 1979).
Synaptic potentials as factors that influence the variability of discharge
The variability changes reported here could be attributed to the synaptic effects of TeNT. As shown by Calvin & Stevens (1968), synaptic noise could account for the variability of firing in spinal motoneurones. We propose that the lack of inhibitory synapses after a low dose of TeNT, or more precisely the ratio of inhibition to excitation (see next section), determines both the level of disinhibition and the increase of regularity by reducing the fluctuations of the impinging synaptic noise. Consistent with this view there are several findings. Firstly, the work by Ratliff et al. (1968) in invertebrate optic nerve fibres showed that changes in the fluctuations of the generator potential affected the variability of the discharge. Secondly, vagal denervation not only reduces reflex modulation of discharges, but also strongly augments heartbeat regularity (Chiou & Zipes, 1998). Finally, the variability of cortical neurones decreases under excitatory influences alone (Stevens & Zador, 1998).
The high dose increased further the regularity of firing by reducing both excitation and inhibition on the motoneurone in agreement with other studies. Synaptic blockade by TeNT of inhibition and excitation has been described both in vivo (Curtis et al. 1976; Kanda & Takano, 1983) and in vitro (Heredero et al. 1983; Gobbi et al. 1993). Examples of increased firing regularity under low synaptic input have been noted for photoreceptor activity under light adaptation (Ratliff et al. 1968), the pyramidal cortical neurone (Bernander et al. 1991), and heart rhythm under autonomic blockade that produces the so-called intrinsic rate or pacemaker activity (Goldberger et al. 1999).
Temporal integration of synaptic inputs at the abducens motoneurone
Discharge variability of spontaneously spiking cells or those firing under ongoing synaptic activation depends largely, besides intrinsic regulatory properties such as AHP, upon the patterns and temporal interdependency of synaptic activation. It has been proposed that processing of multiple co-ordinated irregular signals produces a similar variability at the output neurone, whereas integration of multiple independent signals increases output regularity (Lampl et al. 1999). According to this view, some elements of the oculomotor system have been described as parallel processing devices (Baker et al. 1981). For example, there is evidence, in the firing regularity of neurones and in the adaptation of reflex properties that suggests parallel vestibulo-ocular reflex channels (Minor & Goldberg, 1991). Thus, vestibular afferent neurones with different regularity properties (Fernández & Goldberg, 1976) would convey specific information to the motoneurone in different parts of the frequency and time domain (Lisberger & Pavelko, 1986). Moreover, the neural generator of eye position has been proposed to be composed of multiple independent modules conveying information to the motoneurone (Crawford & Vilis, 1993). Therefore, parallel processing in the pre-oculomotor system would facilitate regularity at the output motoneuronal level (Lampl et al. 1999; deCharms & Zador, 2000).
The afferent neurones arising from prepositus hypoglossi and medial vestibular nuclei have been implicated in the control of tonic firing of abducens neurones. These afferents are reciprocally connected to motoneurones, and also show linear relationships between firing and eye position (Escudero & Delgado-García, 1988). We plotted in Fig. 8A the average values of the regression lines from the work by Escudero et al. (1992) and González-Forero et al. (2001b). Thus, beyond a certain threshold, motoneuronal firing rises linearly correlated with eye position directed to the ipsilateral side. Excitatory afferents increase their firing in the same direction as the motoneurone and inhibitory afferents do the opposite.
Figure 8. Prediction of the inhibition to excitation balance.
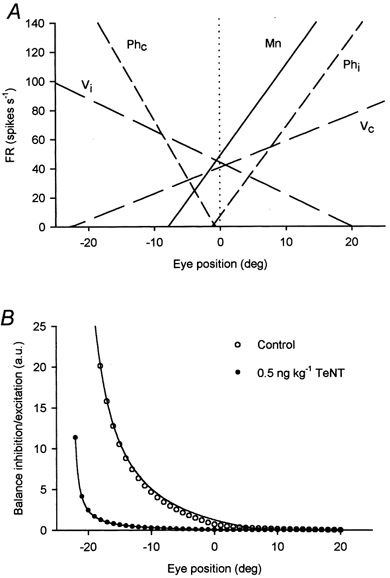
A, plot of the linear regression lines between firing rate (FR, in spikes s−1) and eye position (in deg) for 5 neuronal groups characterised by the equation FR = kP + F0 (P, eye position in deg; k, slope of the regression line or eye position sensitivity in spikes s−1 degree−1; F0, the ordinate intercept (…….) or firing during straight-ahead gaze in spikes s−1). Firing threshold is the abscissa intercept. Positive P values represent temporal-directed eye movements (on-directed for the abducens motoneurone), negative values are nasal-directed eye movements (off-directed). Average motoneurone (Mn, –) parameters were FR = 6.1 P + 48.9 spikes s−1 (from González-Forero et al. 2001). Vestibular neurones (_ _) projecting to abducens motoneurones are inhibitory ipsilateral (Vi) and excitatory contralateral (Vc) and respond, respectively, to the equations: FR = −2.2P + 44.1 spikes s−1 and FR = 1.8 P + 40.7 spikes s−1. Prepositus hypoglossi neurones (_ _ _) are inhibitory contralateral (Phc) and excitatory ipsilateral (Phi) and respond, respectively, to the equations: FR = −7.9P - 6.0 spikes s−1 and FR = 6.1P + 7.5 spikes s−1 (from Escudero et al. 1992). B, balance of inhibition to excitation across the motor field in arbitrary units (a.u.). The balance was calculated as the ratio of Vi + Phc firing (inhibitory afferents) over Vc + Phi firing (excitatory afferents). Firing of these four populations was multiplied by the following synaptic correction factors: IPSP/EPSPcontrol = 0.76; IPSP/EPSPlow dose = 0.036. The balance was calculated for eye positions at intervals of 1 deg in the eye position range from - 22 to 20 deg for control (○) and low dose of TeNT (•). In this range the balance was neither ∞ nor zero and hyperbolic regressions (–) y = 239.8 (0.5 + x)−1 (control) and y = 108.4 (0.6 + x)−1 (low dose) had r values of 0.99 in both cases.
How do excitation and inhibition co-ordinate along the range of eye movements where the motoneurone fires? We calculated the balance of inhibition to excitation as the ratio of firing supplying tonic inhibition to that supplying tonic excitation, as shown in Fig. 8A. We also corrected the balance by a reduction factor representing differences in synaptic strength between inhibitory and excitatory inputs. This factor was calculated as the average IPSP to EPSP amplitude ratio found in the present work (Table 2) in relation to the control value. Thus, for example, a factor of 0.76 corrected the control balance. The balance was calculated in 1 degree steps through the motor range (Fig. 8B). In the control situation, a decay in the balance between inhibition and excitation is predicted (hyperbolic fit with r = 0.99; P < 0.001). At the extrapolated eye position threshold for activation of the average motoneurone (-8 deg), the balance is about 3.5 (Fig. 8B; –). Real firing thresholds observed in our control motoneurones corresponded to 17 spikes s−1. At this firing frequency, motoneuronal variability reaches a maximum (see Fig. 4A). An interesting region in the curve appears between −3 and 0 deg, the region where excitatory and inhibitory prepositus neurones start and cease firing, respectively. In this region, the balance changes from 1.47 to 0.7, that is, from higher to lower inhibition, which correlates with a shift of the firing towards intervals shorter than the AHP duration (firing from 30-50 Hz), and variability is low (< 10 %). In summary, it is important to note that the balance of inhibition to excitation calculated from the firing of known afferences precisely correlates with the curved pattern of firing variability of abducens motoneurones determined in the present study.
For the low-dose-treated motoneurones we used the relationship FR = 5.4P + 71.1 (González-Forero et al. 2001b). The predicted balance (Fig. 8B; •) was also fitted by a hyperbolic function (r = 0.99; P < 0.001). A comparison with the control shows that after a low-dose TeNT injection the estimated balance was 0.22 at firing threshold (-13 deg), whereas this same value was reached by the control motoneurone when firing at 60 Hz. Also the balance at 0 deg for the low-dose motoneurone was 0.043, a value approximately 16 times lower than the control. Thus, we conclude that disinhibition increases the regularity and reduces the threshold of firing in the motoneurone. Our view also agrees with the data of Stevens & Zador (1998) who demonstrated similar variability changes by altering the composition of synaptic noise from purely excitatory inputs (as in our low-dose treatment) to different balances between inhibition and excitation. Because of the extremely reduced synaptic potentials with the high-dose, the balance was not determined (12 motoneurones were not included in the sample). Nonetheless, the balance curve for high TeNT dose should lie between the control value (IPSP/EPSP = 0.76) and the low-dose treatment value, which is the maximum imbalance between inhibition and excitation (IPSP/EPSP = 0.036). The IPSP/EPSP amplitude ratio of the measurable synaptic potentials with the high dose of TeNT was 0.33. However, irrespective of this ratio, input synaptic efficacy was negligible compared to controls (Table 2). Thus, other factors, such as the unmasking of intrinsic rhythmic activity or the resistance of tonic inputs to the action of TeNT might control unmodulated firing of abducens motoneurones after intense dennervation.
Acknowledgments
This work was supported by research grants from F.I.S. (01/0193 to R.R.C. and A.M.P.) and N.S.F. (9984441 to F.J.A.). D.G.F. received fellowship and travel grants from the Universidad de Sevilla.
REFERENCES
- Baker R, Evinger C, McCrea RA. Some thoughts about the three neurons in the vestibular ocular reflex. Annals of the New York Academy of Sciences. 1981;374:171–188. doi: 10.1111/j.1749-6632.1981.tb30869.x. [DOI] [PubMed] [Google Scholar]
- Baker R, Highstein SM. Physiological identification of interneurons and motoneurons in the abducens nucleus. Brain Research. 1975;91:292–298. doi: 10.1016/0006-8993(75)90551-x. [DOI] [PubMed] [Google Scholar]
- Baker RG, Mano N, Shimazu H. Postsynaptic potentials in abducens motoneurons induced by vestibular stimulation. Brain Research. 1969;15:577–580. doi: 10.1016/0006-8993(69)90189-9. [DOI] [PubMed] [Google Scholar]
- Baker R, Precht W. Electrophysiological properties of trochlear motoneurons as revealed by IVth nerve stimulation. Experimental Brain Research. 1972;14:127–157. doi: 10.1007/BF00234796. [DOI] [PubMed] [Google Scholar]
- Banks R, Sachs MB. Regularity analysis in a compartmental model of chopper units in the anteroventral cochlear nucleus. Journal of Neurophysiology. 1991;65:606–629. doi: 10.1152/jn.1991.65.3.606. [DOI] [PubMed] [Google Scholar]
- Bennett BD, Wilson CJ. Spontaneous activity of neostriatal cholinergic interneurons in vitro. Journal of Neuroscience. 1999;19:5586–5596. doi: 10.1523/JNEUROSCI.19-13-05586.1999. [DOI] [PMC free article] [PubMed] [Google Scholar]
- Bernander O, Douglas RJ, Martin KAC, Koch C. Synaptic background activity influences spatiotemporal integration in single pyramidal cells. Proceedings of the National Academy of Sciences of the USA. 1991;88:11569–11573. doi: 10.1073/pnas.88.24.11569. [DOI] [PMC free article] [PubMed] [Google Scholar]
- Brooks VB, Curtis DR, Eccles JC. The action of tetanus toxin on the inhibition of motoneurones. Journal of Physiology. 1957;135:655–672. doi: 10.1113/jphysiol.1957.sp005737. [DOI] [PMC free article] [PubMed] [Google Scholar]
- Calvin WH, Stevens CF. Synaptic noise and other sources of randomness in motoneuron interspike intervals. Journal of Neurophysiology. 1968;31:574–587. doi: 10.1152/jn.1968.31.4.574. [DOI] [PubMed] [Google Scholar]
- Chiou C-W, Zipes DP. Selective vagal denervation of the atria eliminates heart rate variability and baroreflex sensitivity while preserving ventricular innervation. Circulation. 1998;98:360–368. doi: 10.1161/01.cir.98.4.360. [DOI] [PubMed] [Google Scholar]
- Crawford JD, Vilis T. Modularity and parallel processing in the oculomotor integrator. Experimental Brain Research. 1993;96:443–456. doi: 10.1007/BF00234112. [DOI] [PubMed] [Google Scholar]
- Curtis DR, De Groat WC. Tetanus toxin and spinal inhibition. Brain Research. 1968;10:208–212. doi: 10.1016/0006-8993(68)90123-6. [DOI] [PubMed] [Google Scholar]
- Curtis DR, Game CJA, Lodge D, McCulloch RM. A pharmacological study of Renshaw cell inhibition. Journal of Physiology. 1976;258:227–242. doi: 10.1113/jphysiol.1976.sp011416. [DOI] [PMC free article] [PubMed] [Google Scholar]
- Decharms RC, Zador A. Neural representation and cortical code. Annual Review of Neuroscience. 2000;23:613–647. doi: 10.1146/annurev.neuro.23.1.613. [DOI] [PubMed] [Google Scholar]
- de la Cruz RR, Delgado-García JM, Pastor AM. Discharge characteristics of axotomized abducens internuclear neurons in the adult cat. Journal of Comparative Neurology. 2000;427:391–404. doi: 10.1002/1096-9861(20001120)427:3<391::aid-cne6>3.0.co;2-e. [DOI] [PubMed] [Google Scholar]
- Delgado-García JM, Del Pozo F, Spencer RF, Baker R. Behavior of neurons in the abducens nucleus of the alert cat-III. Axotomized motoneurons. Neuroscience. 1988;24:143–160. doi: 10.1016/0306-4522(88)90319-3. [DOI] [PubMed] [Google Scholar]
- Dimpfel W. Hyperexcitability of cultured central nervous system neurons caused by tetanus toxin. Experimental Neurology. 1979;65:53–65. doi: 10.1016/0014-4886(79)90247-4. [DOI] [PubMed] [Google Scholar]
- Easter SS. A comment on the “glissade”. Vision Research. 1973;13:881–882. doi: 10.1016/0042-6989(73)90052-7. [DOI] [PubMed] [Google Scholar]
- Escudero M, de la Cruz RR, Delgado-García JM. A physiological study of vestibular and prepositus hypoglossi neurones projecting to the abducens nucleus of the alert cat. Journal of Physiology. 1992;458:539–560. doi: 10.1113/jphysiol.1992.sp019433. [DOI] [PMC free article] [PubMed] [Google Scholar]
- Escudero M, Delgado-García JM. Behavior of reticular, vestibular and prepositus neurons terminating in the abducens nucleus of the alert cat. Experimental Brain Research. 1988;71:218–222. doi: 10.1007/BF00247538. [DOI] [PubMed] [Google Scholar]
- Fernández C, Goldberg JM. Physiology of peripheral neurons innervating otolith organs of the squirrel monkey. I. Response to static tilts and to long-duration centrifugal force. Journal of Neurophysiology. 1976;39:970–1008. doi: 10.1152/jn.1976.39.5.970. [DOI] [PubMed] [Google Scholar]
- Fuchs AF, Robinson DA. A method for measuring horizontal and vertical eye movement chronically in the monkey. Journal of Applied Physiology. 1966;21:1068–1070. doi: 10.1152/jappl.1966.21.3.1068. [DOI] [PubMed] [Google Scholar]
- Fuchs AF, Scudder CA, Kaneko CRS. Discharge patterns and recruitment order of identified motoneurons and internuclear neurons in the monkey abducens nucleus. Journal of Neurophysiology. 1988;60:1874–1895. doi: 10.1152/jn.1988.60.6.1874. [DOI] [PubMed] [Google Scholar]
- Gobbi M, Facchiano F, Frittoli E, Luini A, Mennini T. Tetanus toxin inhibits depolarization-induced [3H]serotonin release from rat brain cortex synaptosomes. Neuroscience Letters. 1993;151:205–208. doi: 10.1016/0304-3940(93)90021-c. [DOI] [PubMed] [Google Scholar]
- Goldberger JJ. Sympathovagal balance: how should we measure it? American Journal of Physiology. 1999;276:1273–1280. doi: 10.1152/ajpheart.1999.276.4.H1273. [DOI] [PubMed] [Google Scholar]
- Goldberger JJ, Challapalli S, Tung R, Parker MA, Kadish AH. Relationship of heart rate variability to parasympathetic effect. Circulation. 2001;17:1977–1983. doi: 10.1161/01.cir.103.15.1977. [DOI] [PubMed] [Google Scholar]
- Gómez C, Canals J, Torres B, Delgado-García JM. Analysis of the fluctuations in the interspike intervals of abducens nucleus neurons during ocular fixation in the alert cat. Brain Research. 1986;381:401–404. doi: 10.1016/0006-8993(86)90099-5. [DOI] [PubMed] [Google Scholar]
- González-Forero D, Álvarez F, de la Cruz RR, Delgado-García JM, Pastor AM. Discharge characteristics of abducens neurons in the alert cat after afferent synaptic blockade with tetanus toxin. Society for Neuroscience Abstracts. 1999;25:1652. [Google Scholar]
- González-Forero D, de la Cruz RR, Delgado-García JM, Álvarez FJ, Pastor AM. Morpho-functional correlates in a tetanus neurotoxin-induced model of deafferentation. Society for Neuroscience Abstracts. 2001a;27:402. [Google Scholar]
- González-Forero D, de la Cruz RR, Delgado-García JM, Pastor AM. Reversible deafferentation of abducens motoneurons and internuclear neurons with tetanus neurotoxin. NeuroReport. 2001b;12:753–756. doi: 10.1097/00001756-200103260-00028. [DOI] [PubMed] [Google Scholar]
- Grantyn R, Grantyn A. Morphological and electrophysiological properties of cat abducens motoneurons. Experimental Brain Research. 1978;31:249–274. doi: 10.1007/BF00237603. [DOI] [PubMed] [Google Scholar]
- Gruart A, Zamora C, Delgado-García JM. Response diversity of pontine and deep cerebellar nuclei neurons to air puff stimulation of the eye in the alert cat. Neuroscience Letters. 1993;152:87–90. doi: 10.1016/0304-3940(93)90490-c. [DOI] [PubMed] [Google Scholar]
- Gueritaud JP. Electrical activity of rat ocular motoneurons recorded in vitro. Neuroscience. 1988;24:837–852. doi: 10.1016/0306-4522(88)90072-3. [DOI] [PubMed] [Google Scholar]
- Heredero J, Korpi ER, Oja SS. Tetanus toxin treatment in vitro inhibits the release of GABA from rat cerebral cortex slices evoked by high K+ and Na+-free media. Neurochemistry International. 1983;5:137–143. doi: 10.1016/0197-0186(83)90020-7. [DOI] [PubMed] [Google Scholar]
- Holden AV. Statistical properties of a spike train. In: Levin S, editor. Lecture Notes in Biomathematics, Models of Stochastic Activity of Neurones. Vol. 12. New York: Springer-Verlag; 1976. pp. 84–114. [Google Scholar]
- Horikawa K, Armstrong WE. A versatile means of intracellular labeling: injection of biocytin and its detection with avidin conjugates. Journal of Neuroscience Methods. 1988;25:1–11. doi: 10.1016/0165-0270(88)90114-8. [DOI] [PubMed] [Google Scholar]
- Kanda K, Takano K. Effects of tetanus toxin on the excitatory and the inhibitory post-synaptic potentials in the cat motoneurone. Journal of Physiology. 1983;335:319–333. doi: 10.1113/jphysiol.1983.sp014536. [DOI] [PMC free article] [PubMed] [Google Scholar]
- Kapoula Z, Optican LM, Robinson DA. Retinal image motion alone does not control disconjugate postsaccadic eye drift. Journal of Neurophysiology. 1990;63:999–1009. doi: 10.1152/jn.1990.63.5.999. [DOI] [PubMed] [Google Scholar]
- Kernell D. The limits of firing frequency in cat lumbosacral motoneurones possessing different time course of afterhyperpolarization. Acta Physiologica Scandinavica. 1965;65:87–100. [Google Scholar]
- Kiehn O, Kjaerulff O, Tresch MC, Harris-Warrick RM. Contributions of intrinsic motor neuron properties to the production of rhythmic motor output in the mammalian spinal cord. Brain Research Bulletin. 2000;53:649–659. doi: 10.1016/s0361-9230(00)00398-1. [DOI] [PubMed] [Google Scholar]
- Lampl I, Reichova I, Ferster D. Synchronous membrane potential fluctuations in neurons of the cat visual cortex. Neuron. 1999;22:361–374. doi: 10.1016/s0896-6273(00)81096-x. [DOI] [PubMed] [Google Scholar]
- Lisberger SG, Pavelko TA. Vestibular signals carried by pathways subserving plasticity of the vestibulo-ocular reflex in monkeys. Journal of Neuroscience. 1986;6:346–354. doi: 10.1523/JNEUROSCI.06-02-00346.1986. [DOI] [PMC free article] [PubMed] [Google Scholar]
- McCrea RA, Yoshida K, Berthoz A, Baker R. Eye movement related activity and morphology of second order vestibular neurons terminating in the cat abducens nucleus. Experimental Brain Research. 1980;40:468–473. doi: 10.1007/BF00236156. [DOI] [PubMed] [Google Scholar]
- Matthews PBC. Relationship of firing intervals of human motor units to the trajectory of post-spike after-hyperpolarization and synaptic noise. Journal of Physiology. 1996;492:597–628. doi: 10.1113/jphysiol.1996.sp021332. [DOI] [PMC free article] [PubMed] [Google Scholar]
- Miles FA, Fuller JH, Braitman DJ, Dow BM. Long-term adaptive changes in primate vestibuloocular reflex. III: Electrophysiological observations in flocculus of normal monkeys. Journal of Neurophysiology. 1980;43:1437–1476. doi: 10.1152/jn.1980.43.5.1437. [DOI] [PubMed] [Google Scholar]
- Minor LB, Goldberg JM. Vestibular-nerve inputs to the vestibulo-ocular reflex: a functional-ablation study in the squirrel monkey. Journal of Neuroscience. 1991;11:1636–1648. doi: 10.1523/JNEUROSCI.11-06-01636.1991. [DOI] [PMC free article] [PubMed] [Google Scholar]
- Pastor AM, Moreno-López B, de la Cruz RR, Delgado-García JM. Effects of botulinum neurotoxin type A on abducens motoneurons in the cat: ultrastructural and synaptic alterations. Neuroscience. 1997;81:457–478. doi: 10.1016/s0306-4522(97)00200-5. [DOI] [PubMed] [Google Scholar]
- Pastor AM, Torres B, Delgado-García JM, Baker R. Discharge characteristics of medial rectus and abducens motoneurons in the goldfish. Journal of Neurophysiology. 1991;66:2125–2140. doi: 10.1152/jn.1991.66.6.2125. [DOI] [PubMed] [Google Scholar]
- Person RS, Kudina LP. Discharge frequency and discharge pattern of human motor units during voluntary contraction of muscle. Electroencephalography and Clinical Neurophysiology. 1972;32:471–483. doi: 10.1016/0013-4694(72)90058-2. [DOI] [PubMed] [Google Scholar]
- Piotrkiewicz M. An influence of afterhyperpolarization on the pattern of motoneuronal rhythmic activity. Journal of Physiology (Paris) 1999;93:125–133. doi: 10.1016/s0928-4257(99)80143-0. [DOI] [PubMed] [Google Scholar]
- Powers RK, Binder MD. Relationship between the time course of the afterhyperpolarization and discharge variability in cat spinal motoneurones. Journal of Physiology. 2000;528:131–150. doi: 10.1111/j.1469-7793.2000.t01-1-00131.x. [DOI] [PMC free article] [PubMed] [Google Scholar]
- Ratliff F, Hartline HK, Lange D. Variability of interspike intervals in optic nerve fibers of Limulus: effect of light and dark adaptation. Proceedings of the National Academy of Sciences of the USA. 1968;60:464–469. doi: 10.1073/pnas.60.2.464. [DOI] [PMC free article] [PubMed] [Google Scholar]
- Ris L, Godaux E. Spike discharge regularity of vestibular neurons in labyrinthectomized guinea pigs. Neuroscience Letters. 1998;253:131–134. doi: 10.1016/s0304-3940(98)00631-4. [DOI] [PubMed] [Google Scholar]
- Salinas E, Sejnowski TJ. Impact of correlated synaptic input on output firing rate and variability in simple neuronal models. Journal of Neuroscience. 2000;20:6193–6209. doi: 10.1523/JNEUROSCI.20-16-06193.2000. [DOI] [PMC free article] [PubMed] [Google Scholar]
- Segundo JP, Moore GP, Stensaas LJ, Bullock TH. Sensitivity of neurones in Aplysia to temporal pattern of arriving impulses. Journal of Experimental Biology. 1963;40:643–667. doi: 10.1242/jeb.40.4.643. [DOI] [PubMed] [Google Scholar]
- Shadlen MN, Newsome WT. The variable discharge of cortical neurons: implications for connectivity, computation, and information coding. Journal of Neuroscience. 1998;18:3870–3896. doi: 10.1523/JNEUROSCI.18-10-03870.1998. [DOI] [PMC free article] [PubMed] [Google Scholar]
- Stevens CF, Zador AM. Input synchrony and the irregular firing of cortical neurons. Nature Neuroscience. 1998;1:210–217. doi: 10.1038/659. [DOI] [PubMed] [Google Scholar]
- Uchino Y, Ikegami H, Sasaki M, Endo K, Imagawa M, Isu N. Monosynaptic and disynaptic connections in the utriculo-ocular reflex arc of the cat. Journal of Neurophysiology. 1994;71:950–958. doi: 10.1152/jn.1994.71.3.950. [DOI] [PubMed] [Google Scholar]
- Wiegand H, Wellhöner HH. Electrical excitability of motoneurones in early local tetanus. Naunyn-Schmiedeberg's Archives of Pharmacology. 1979;308:71–76. doi: 10.1007/BF00499722. [DOI] [PubMed] [Google Scholar]