

Abstract
Electroretinographic (ERG) methods were used to determine response properties of mouse rod photoreceptors in vivo following adapting illumination that produced a significant extent of rhodopsin bleaching. Bleaching levels prevailing at ∼10 min and ∼20 min after the adapting exposure were on average 14% and 9%, respectively, based on the analysis of visual cycle retinoids in the eye tissues. Recovery of the rod response to the adapting light was monitored by analysing the ERG a-wave response to a bright probe flash presented at varying times during dark adaptation. A paired-flash procedure, in which the probe flash was presented at defined times after a weak test flash of fixed strength, was used to determine sensitivity of the rod response to the test flash. Recovery of the response to the adapting light was 80% complete at 13.5 ± 3.0 min (mean ± s.d.; n = 7) after adapting light offset. The adapting light caused prolonged desensitization of the weak-flash response derived from paired-flash data. By comparison with results obtained in the absence of the adapting exposure, desensitization determined with a test-probe interval of 80 ms was ∼fourfold after 5 min of dark adaptation and ∼twofold after 20 min. The results indicate, for mouse rods in vivo, that the time scale for recovery of weak-flash sensitivity substantially exceeds that for the recovery of circulating current following significant rhodopsin bleaching. The lingering desensitization may reflect a reduced efficiency of signal transmission in the phototransduction cascade distinct from that due to residual excitation.
Photoisomerization of the 11-cis retinal chromophore of rhodopsin in rod photoreceptors leads to dissociation of the all-trans retinoid photoproduct from opsin (i.e. to rhodopsin bleaching) and, in the intact eye, to processing of the retinoid in the visual cycle that supports rhodopsin regeneration. Results obtained from biochemical and in vitro electrophysiological studies indicate that rhodopsin bleaching produces a lingering excitation and desensitization of the rods themselves and of post-receptor retinal neurons during a subsequent period of dark adaptation (Donner & Reuter, 1968; Dowling & Ripps, 1970; Grabowski & Pak, 1975; Pepperberg et al. 1978; Baylor & Lamb, 1982; Hofmann et al. 1992; Cornwall & Fain, 1994; Leibrock et al. 1994; Melia et al. 1997; for reviews, see Leibrock et al. 1998; Fain et al. 2001; McBee et al. 2001).
A long-standing goal of substantial interest is to understand how rhodopsin bleaching affects rod dark adaptation in the intact visual system (e.g. Dowling, 1963; Rushton, 1965; Barlow, 1972). Recent studies by Thomas & Lamb (1999) and by Kennedy et al. (2001) have investigated this process by measurement of the rod electroretinographic (ERG) a-wave. We have used a paired-flash ERG method (Birch et al. 1995; Lyubarsky & Pugh, 1996; Pepperberg et al. 1997; Hetling & Pepperberg, 1999; Robson & Frishman, 1999; Friedburg et al. 2001) to investigate photoresponse properties of mouse rods in vivo following a significant fractional bleach of the rhodopsin. Preliminary results have been reported (Kang Derwent et al. 2001).
METHODS
Animals
All procedures were in accordance with protocols approved by the Animal Care Committee of the University of Illinois at Chicago, and with the principles embodied in the Statement for the Use of Animals in Ophthalmic and Vision Research established by the Association for Research in Vision and Ophthalmology. C57BL/6J mice (male and female, 5-16 weeks of age) obtained from Jackson Laboratories (Bar Harbor, ME, USA) were maintained on a light- dark cycle and dark-adapted overnight before the experiment. Under dim red light, the mouse was anaesthetized with an intraperitoneal injection of ketamine and xylazine (0.15 and 0.01 mg (g body wt)−1, respectively). Boosts of anaesthetic (approximately 1/6 of the initial dose) were delivered subcutaneously at approximately 20 min intervals beginning ≈40 min after the initial dose. As determined in control tests, the additional anaesthetic treatment maintained a depth of anaesthesia that suppressed the paw-pinch reflex. However, paw-pinch reflex tests were not possible during ERG experiments due to mechanical perturbation of the corneally positioned ERG recording electrode. The depth of anaesthesia during the experiments was periodically checked by visual inspection (red light from a hand-held flashlight) of the animal's breathing rate; heavy or rapid breathing was taken as indication of an insufficient depth of anaesthesia. The pupil was dilated with 2.5 % phenylephrine HCl and 1 % tropicamide (Mydriacyl), and the cornea anaesthetized with 0.5 % proparacaine HCl. The mouse was positioned on a heating pad and stabilized by a surrounding pad of foam rubber so that the visual axis of the left eye was approximately vertical. The heating pad and temperature controller (model TR-100; Fine Science Tools, Inc., Foster City, CA, USA) maintained the mouse's body temperature at about 37.5-38.5 °C as determined rectally (model 555 temperature probe; Yellow Springs Instruments, Yellow Springs, OH, USA). The corneal surface was periodically lubricated with a drop of methylcellulose solution (Ultra Tears; Alcon, Inc., Fort Worth, TX, USA) and was kept moist during the experiment by the constant addition of distilled water. An infusion pump (model PHD2000; Harvard Bioscience, Inc., Holliston, MA, USA) delivered the water at a flow rate of ≈0.02 ml min−1 through a thin polyethylene tube, the end of which was positioned at the corner of the tested eye; a wick of absorbent cotton continuously drained away excess water. Each animal was used in only one experiment. With the exception of experiments involving retinoid analysis (see below), the mouse was monitored for recovery following ERG measurements and then returned to the University animal care facility.
Flash stimulation and ERG recording
Equipment and procedures used for the presentation of full-field test and probe flashes, and for the recording of ERG a-wave responses, were similar to those previously described (Hetling & Pepperberg, 1999; Silva et al. 2001). Unless otherwise indicated, presentation of the test and probe flashes employed projection of these stimuli onto the inner surface of a hemispheric dome positioned above the tested eye (Hetling & Pepperberg, 1999). This apparatus will be referred to below as the ‘dome’ photostimulator. The nominal, unattenuated strength of the probe flash in this photostimulator was in the range of 310-370 sc cd s m−2 as determined with a calibrated photometer (model 1700 equipped with an SED033 detector, radiance barrel and ZCIE scotopic filter; International Light Inc., Newburyport, MA, USA). Tolerances of the test and probe flash strengths, as well as the strength of the adapting illumination (see below), can be taken as ± 10 %. Successive experimental trials involving the presentation of single or multiple flashes were separated by a dark-adaptation period of at least 1 min.
A paired-flash procedure similar to that described (Hetling & Pepperberg, 1999; Silva et al. 2001) was used to derive amplitudes of the rod response to a weak test flash at defined times t after test flash presentation. The method involves analysis of the a-wave response to a bright probe flash that rapidly drives the rods to saturation and thus titrates the rod circulating current. The probe flash is delivered at time tprobe after the test flash, and the amplitude of the probe response is determined at a defined time, tdet, after probe flash presentation. A(t), the derived amplitude of the response to the test flash at time t, is taken as:
| (1) |
where t = tprobe + tdet, Am(t) is the probe response amplitude determined in a paired-flash trial, and Amo is the response to the probe flash delivered in the absence of a recent test flash (‘probe-alone’ response). The probe-alone amplitude Amo determined before and after light adaptation will be represented by AmoD and AmoL, respectively. Unless otherwise indicated, quoted values of AmoD represent the average of three measurements made over an approximately 10 min period immediately before the adapting exposure. Determination times tdet for probe responses obtained under dark- and light-adapted conditions were 6 ms and 7 ms, respectively (see Results).
Amplitudes of the derived response to a fixed test flash (0.11 sc cd s m−2) obtained with test-probe intervals of 80 and 250 ms were taken, respectively, as measures of relative sensitivity at near-peak and mid-falling-phase times in the weak-flash response (Xu et al. 1997; Hetling & Pepperberg, 1999; Calvert et al. 2001; Silva et al. 2001). Use of a 0.11 sc cd s m−2 flash for sensitivity determinations was based on previous evidence that the response to this test stimulus is in the near-linear range (Hetling & Pepperberg, 1999; Silva et al. 2001). In light of the modest extent of rhodopsin bleaching inferred for all but the shortest periods following the standard adapting illumination used here (see Results), no correction for the bleach-induced reduction in quantum capture (i.e. in photoisomerizing strength of the test flash) was applied to the determinations of sensitivity. For determinations of the normalized derived response in paired-flash trials, the prevailing probe-alone amplitude was taken as the average of probe-alone amplitudes measured at 1-2 min before and 1-2 min after the paired-flash run. Probe responses recorded in paired-flash trials with an 80 or 250 ms interval between the test (T) flash and probe (P) flash will be termed, respectively, T80P and T250P responses.
Adapting illumination
A tungsten-halogen lamp powered by a regulated supply (model 718-10D; Leader Electronics Corp., Hauppauge, NY, USA) and positioned above the mouse provided steady illumination for the adapting exposure. Immediately before this illumination, the hemispheric dome (see above) was removed, and an infrared-absorbing glass plate and a glass light-diffusing plate were placed below the lamp to provide a luminous surface (white light) of dimensions 8.5 × 8.5 cm in a plane approximately 5 cm above the mouse's eye; the angle about the visual axis subtended by this surface ranged from 40 deg to 50 deg. This apparatus will be referred to below as the ‘adapting’ photostimulator; the luminance of the adapting light, as measured axially at the position of the mouse's eye, will be termed Ia. The illumination referred to below as the ‘standard’ adapting exposure employed a luminance Ia of 2.1 × 10⁴ sc cd m−2 and was 45 s in duration. Offset of the adapting light defined time zero in a given experiment, and ERG data are presented in relation to time tda, the period of dark adaptation. Unless otherwise indicated, the corneal recording electrode remained in place during the adapting illumination. Typically, the adapting photostimulator was removed and the dome photostimulator replaced in its original position immediately after light adaptation, for the further collection of ERG data.
Retinoid analysis
Following light adaptation of one eye in the ERG apparatus and a subsequent period of dark adaptation, both the light-adapted eye and the dark-adapted fellow eye were analysed for visual cycle retinoids contained in the retina and retinal pigment epithelium/ choroid (RPE/choroid). In each experiment of this type, the mouse was removed from the ERG apparatus shortly after offset of the adapting light. The longer periods of dark adaptation (see below) typically led to the mouse's recovery from the anaesthesia delivered prior to the adapting illumination; in these cases, additional anaesthetic was delivered at approximately 5 min before conclusion of the dark-adaptation period (intraperitoneal injection of 0.15-0.18 mg (g body wt)−1 ketamine and 0.004- 0.006 mg (g body wt)−1 xylazine; Qtaishat et al. 1999). Procedures used for tissue isolation and retinoid analysis were similar to those described (Qtaishat et al. 1999). Briefly, the anaesthetized mouse was killed by cervical dislocation, the retina of a given eye was isolated, and the remainder of the globe, which contained the RPE and choroid, was removed. The light-adapted eye was in all cases dissected first. Separate homogenization of the retina and of the RPE/choroid preparations obtained from a given eye, and extraction with formaldehyde and isopropanol/hexane, were begun immediately after dissection of the second eye. Biochemical data obtained from a given animal are presented in relation to the time period th, defined as the interval between adapting light offset and the average time (for the two eyes) at which tissue homogenization and extraction were begun.
Retinoids contained in the extracts of the retina and RPE/choroid were analysed by high performance liquid chromatography. Determinations of retinal (11-cis, all-trans and 13-cis isomers), all-trans retinol and retinyl ester, in terms of absolute molar amount and of molar percent of total recovered retinoid, were carried out as previously described (Qtaishat et al. 1999). For experiments involving the analysis of both the retina and RPE/choroid (‘full’ analysis), dissections were complete and tissue homogenization/extraction initiated at about 10 min (estimated tolerance ± 3 min) after the animal was killed. Data are reported from 21 animals for which the total molar amounts of retinoid in the two eyes differed from the mean of the two determinations by ≤ 15 % (cf. Qtaishat et al. 1999). This criterion led to the exclusion of data from an additional four animals. Based on full analyses of the retina and RPE/choroid, the molar amount of 11-cis retinal in the RPE/choroid divided by the molar amount of 11-cis retinal in the retina yielded ratios of 0.07 ± 0.13 and 0.06 ± 0.09 (mean ± s.d.; n = 21), respectively, for light- and dark-adapted eyes. The amount of 11-cis retinal in the RPE/choroid was thus relatively small. Experiments on an additional eight mice involved analysis only of a formaldehyde extract (analysis of isomers of retinal) obtained from the retina (‘retina-only’ analysis). Here, dissections were complete and tissue homogenization/extraction initiated at about 5 min (estimated tolerance ± 1 min) after the animal was killed. For these animals, the determined molar amount of 11-cis retinal in the dark-adapted retina was 321 ± 22 pmol (mean ± s.d.) (range 300-369 pmol).
RESULTS
Characterization of adapting exposure
a-Wave responses
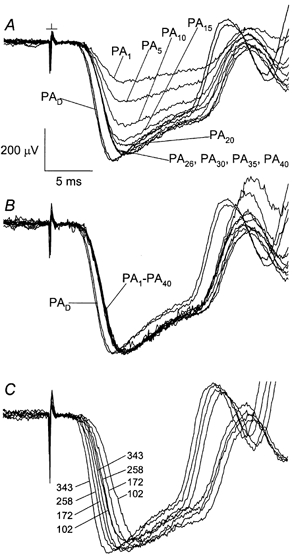
A 45-s exposure to bright light of fixed strength (Ia = 2.1 × 10⁴ sc cd m−2) served as the standard adapting illumination in the present experiments. As will be shown below, this adapting light yielded a time scale of maximal response recovery that was long by comparison with the time resolution of paired-flash ERG determinations (≈2-3 min) but well within the ≈1 h period during which stable ERG recordings were routinely attainable. Figure 1 shows the effect of the standard exposure on ERG a-wave responses obtained in a single experiment. Here, a fixed series of test flashes was presented under dark-adapted conditions (A); at 6-12 min after offset of the adapting light (at time tda = 6-12 min; see Methods) (B); and at tda = 38-44 min (C). As illustrated in Fig. 1, the peak amplitude of the response to the brightest flash (343 sc cd s m−2) was reduced by the adapting light from 586 μV to 425 μV, and recovered to 541 μV in the later set of responses (D). The adapting light furthermore reduced the relative size of the response to a weaker flash. For example, the dark-adapted response to the 0.98 sc cd s m−2 flash at 15 ms after test flash presentation, normalized to the peak amplitude of the response to the brightest flash, was 0.20 (= 116 μV/ 586 μV) (A). Light adaptation reduced this ratio to 0.04 (= 17 μV/425 μV; B); the subsequently recorded responses exhibited a ratio of 0.11 (= 62 μV/541 μV; C). The leading edges of the Fig. 1 waveforms were also analysed through a transduction activation model (Lamb & Pugh, 1992; Breton et al. 1994) to determine the amplification, or gain, of the a-wave response (dashed curves in A-C; see figure legend). For the responses obtained with flash strengths over the range 0.11-27.5 sc cd s m−2, this analysis yielded amplifications of 2.30 × 10⁻³, 0.88 × 10⁻³ and 1.34 × 10⁻³ (sc cd s m−2)−1 ms−2, respectively, for the groups shown in A-C. As 1 s2 = 106 ms2, these amplifications can equivalently be stated as 2.30 × 10³, 0.88 × 10³ and 1.34 × 10³ (sc cd s m−2)−1 s−2, respectively.
Figure 1. a-Wave responses recorded before and after the standard adapting exposure.
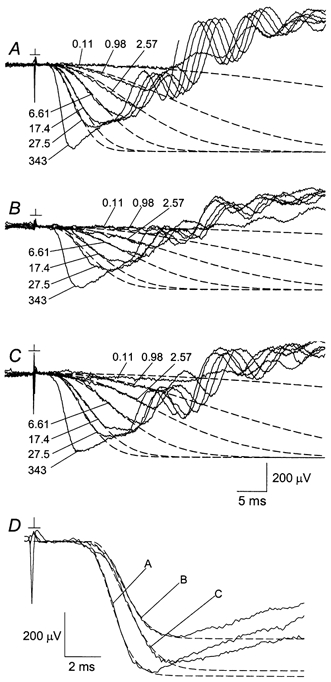
β = 2.30 × 10⁻³ (sc cd s m−2)−1 ms−2 and td = 2.5 ms (A); β = 0.88 × 10⁻³ (sc cd s m−2)−1 ms−2 and td = 2.4 ms (B); and β = 1.34 × 10⁻³ (sc cd s m−2)−1 ms−2 and td = 2.8 ms (C).
Values of β and td for the curves fitted to responses A-C in D are:
β = 1.59 × 10⁻³ (sc cd s m−2)−1 ms−2 and td = 2.8 ms (A); β = 1.17 × 10⁻³ (sc cd s m−2)−1 ms−2 and td = 3.2 ms (B); and β = 8.04 × 10⁻⁴ (sc cd s m−2)−1 ms−2 and td = 3.0 ms (C).
Retinoid analysis
The rhodopsin bleaching strength of the standard adapting illumination was investigated by determining the effect of this exposure on the amount of 11-cis retinal in the eye tissues. The light-induced reduction in 11-cis retinal recovered with the formaldehyde-based extraction method is an approximate measure of the loss of rhodopsin's 11-cis retinal chromophore and, thus, of bleaching (e.g. Qtaishat et al. 1999). Figure 2 illustrates levels of 11-cis retinal and other visual cycle retinoids determined in four experiments that involved a period th of about 20 min between adapting light offset and the initiation of tissue homogenization/extraction. In each experiment, the mouse was initially positioned in the electrophysiological apparatus, and ERG data were obtained to characterize the dark-adapted response. The 45-s adapting illumination was then delivered with the corneal electrode in place and with the fellow eye shielded from the light by an opaque patch. At a defined time after the adapting exposure, the mouse was killed, and dissection of the eye tissues was immediately begun. Open and filled bars in Fig. 2 show molar percent determinations for retinoids contained, respectively, in the light-adapted eyes and the unilluminated control eyes of the investigated group of animals. In both dark- and light-adapted eyes, the amount of 11-cis retinal in the retina (A) far exceeded that in the RPE/choroid (B). The results obtained from the retina indicated, on average, an 11 % decrease in 11-cis retinal and a 3 % increase in all-trans retinal produced by the adapting light. Neither the dark-adapted nor the light-adapted eyes contained substantial amounts of all-trans retinol or 13-cis retinal, consistent with previous findings (Qtaishat et al. 1999; Saari, 2000). In addition, data obtained from the RPE/ choroid indicated a small light-induced increase in retinyl ester at th ≈20 min, consistent with the processing of all-trans retinoid photoproduct in the visual cycle (reviewed by Saari, 2000; McBee et al. 2001). The small amount of retinyl ester contained in the extract of the retina may have been due to contamination by the RPE. Light-induced changes represented by the grouped data just summarized (filled vs. open bars in Fig. 2) were similar to those indicated by data obtained from the same animal (hatched bars). Furthermore, as determined by analysis of data obtained from the same animal, the adapting light-induced decrease in 11-cis retinal within the retina was significant (P < 10−3); also significant were the increase in all-trans retinal and the small increase in all-trans retinol within the retina (P = 0.050 and P = 0.011, respectively) as well as the increase in retinyl ester within the RPE/choroid (P = 0.037).
Figure 2. Retinoid levels in the retina (A) and RPE/choroid (B) at th ≈20 min after a standard adapting exposure.
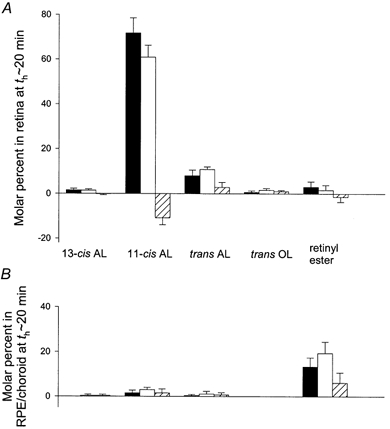
Results obtained in four experiments. Filled and open bars indicate the mean ± s.d. of results obtained, respectively, from dark-adapted (control) eyes and light-adapted eyes. Each bar represents the molar percent for the indicated retinoid, i.e. the molar amount normalized to the total molar amount of retinoid in the eye (cf. Qtaishat et al. 1999), for 11-cis retinal (11-cis AL), all-trans retinal (trans AL), 13-cis retinal (13-cis AL), all-trans retinol (trans OL) and retinyl ester. Hatched bars show the mean ± s.d. of differences in molar percent for data obtained from the dark- vs. light-adapted eye of a given animal.
The effect of the standard adapting exposure is further described in Table 1, which indicates fractional reductions in 11-cis retinal determined with varying periods th following the exposure. The first row of the table shows data obtained from full analyses of the retina and RPE/ choroid at th ≈10 min, ≈20 min (same experiments as those of Fig. 2), ≈1 h and ≈4.5 h (columns 2-5, respectively). Also shown are results obtained with retina-only analysis at th ≈5 min (column 1). These data imply an average bleaching extent of 25 % at th ≈5 min; a recovery to ≈9 % bleaching extent at th ≈20 min; and essentially complete recovery at th ≈4.5 h. Consistent with an increased extent of bleaching upon prolongation of the adapting illumination beyond 45 s, results obtained in control experiments with a 12 min exposure to the standard adapting luminance showed a more extensive loss of 11-cis retinal (Table 1, second row, column 1). In addition, the 12 min exposure markedly delayed the onset of regeneration during the subsequent period of darkness (second row, column 4).
Table 1.
Fractional bleach based on relative levels of 11-cis retinal in light- and dark-adapted eyes at periods th between adapting light offset and initiation of tissue homogenization/extractiona
| Duration of adapting illumination | [1] 5 min | [2] 10 min | [3] 20 min | [4] 1 h | [5] 4.5 h |
|---|---|---|---|---|---|
| 45 s | 0.25 ± 0.15 (4)b | 0.14 ± 0.06 (4)c | 0.09 ± 0.05 (4)c,d | 0.04 ± 0.01 (4)c | 0.02 ± 0.04 (4)c |
| 12 min | 0.45 ± 0.01 (2)b | 0.39 ± 0.02 (2)c | — | 0.46 ± 0.05 (2)b | — |
Estimated tolerances for th are ± 1 min at th = 5 min and ± 3 min for the other th values. Numbers in parentheses indicate the numbers of animals analysed. Except as described in footnote (d), the mouse was removed from the ERG apparatus immediately after offset of the adapting light.
Data based on determinations of 11-cis retinal in the retina only (see Methods). Entries indicate the mean ±s.d. of determinations, for a given animal, of [1-(11-cisLr)/(11-cisDr)], where 11-cisLr and 11-cisDr are, respectively, molar amounts of 11-cis retinal in the light-adapted and dark-adapted retina.
Data based on determinations of 11-cis retinal in both the retina and RPE/choroid (full analysis; see Methods). The combined molar percent of 11-cis retinal in the retina plus RPE/choroid was determined for the light-adapted eye (11-cisLf) and for the dark-adapted eye (11-cisDf) of a given animal. Entries indicate the mean ±s.d. of determinations of [1-(11-cisLf)/(11-cisDf)] at the indicated time th. Here, inclusion of the small amount of 11-cis retinal contained in the RPE/choroid (see Methods) is based on the assumption that this 11-cis retinal derived from rod outer segment material isolated with the RPE/choroid.
Same experiments as those of Fig. 2. In each experiment, the recording electrode remained in place during the adapting illumination, and the mouse was maintained in the ERG apparatus for about 10 min after adapting light offset. Paired-flash trials with a test-probe interval of 80 ms, conducted under dark-adapted conditions and at ∼8–9 min after the adapting exposure, yielded, respectively, derived amplitudes A(86)/AmoD = 0.42 ± 0.05 and A(87)/AmoL = 0.15 ± 0.03.
In three control experiments, the recording electrode was withdrawn during the adapting exposure, then replaced on the cornea for the collection of ERG data for a brief period prior to killing of the animal for retinoid analysis. The fractional reduction in 11-cis retinal at th ≈20 min determined with this ‘electrode-out’ configuration (0.17 ± 0.08 by molar percent analysis) was on average greater than, but not significantly (t test, P = 0.15) different from, results obtained with the recording electrode in place during light adaptation (Table 1, first row, column 3). Paired-flash trials with a test flash strength of 0.11 sc cd s m−2 and with a test-probe interval of 80 ms, conducted under dark-adapted conditions and at ≈8-9 min after the adapting exposure in these electrode-out experiments, yielded, respectively, normalized derived amplitudes A(86)/AmoD = 0.43 ± 0.04 and A(87)/AmoL = 0.18 ± 0.04. This reduction in the weak-flash derived response was similar to that produced with the recording electrode in position during the adapting exposure (Table 1, footnote d).
Electrophysiological estimate of fractional bleach
The experiment described in Fig. 3 was designed to test the photoisomerizing strength of the adapting illumination, for comparison with that of light provided by the dome photostimulator (see Methods), and thereby to permit an estimate of the fractional bleach produced by the adapting illumination. Initially in the experiment, with the dome photostimulator in position, the response to the nominal probe flash was recorded (waveform PAD). The dome was then removed and replaced by the adapting photostimulator, and a flashgun positioned obliquely above the glass plates of the adapting photostimulator was used to deliver probe flashes to the eye. In darkness, presentation of this probe flash yielded waveform 1. By comparison with waveform PAD, waveform 1 was smaller in amplitude and exhibited a later time-to-peak. However, waveform 1 was kinetically similar to the Fig. 1A responses obtained in the dome photostimulator with test flashes of 17.4 and 27.5 sc cd s m−2, consistent with full-field stimulation by the probe flash. Waveforms 2-5 in Fig. 3 show responses to the same probe flash obtained in the presence of steady backgrounds provided by the adapting lamp (luminance Ia of 11, 106, 630 and 5240 sc cd m−2, respectively); in each case, the flash was presented following ≥ 30 s at the selected level of illumination. Determinations of the probe response amplitude at 6 ms indicated an approximately 55 % reduction of the waveform 1 response at Ia = 11 sc cd m−2 (waveform 2). Previous experiments show that a background strength of 1.2 sc cd m−2 delivered by the dome photostimulator produces a similar reduction of the probe response amplitude (Silva et al. 2001). Defining Ib as the background luminance produced by the dome photostimulator, Fig. 3 indicates that the photoisomerization rate produced at Ib = 1.2 sc cd m−2 roughly matches that produced at Ia = 11 sc cd m−2.
Figure 3. Test of relative photoisomerizing strength of light delivered by the adapting photostimulator.
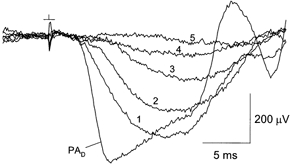
Waveform PAD, single dark-adapted probe-alone response obtained with the dome photostimulator. The probe flash strength measured at the position of the mouse's eye was 364 sc cd s m−2. Waveforms 1-5 were obtained with Ia = 0, 11, 106, 630 and 5240 sc cd m−2, respectively.
Assuming the 45-s duration of the standard adapting exposure to be short by comparison with the time scale of rhodopsin regeneration (e.g. Kueng-Hitz et al. 2000; Kennedy et al. 2001), the extent of rhodopsin bleaching immediately after the adapting illumination is roughly given by the Poisson relation:
| (2) |
where B is the number of photolysed (bleached) rhodopsins per rod, R0 is the total number of rhodopsins per rod, Neff is the physiologically effective, time-integrated luminance (sc cd s m−2) of the adapting light, and Φ is a photosensitivity parameter relevant to use of the dome photostimulator. Equating 1 sc cd s m−2 (dome photostimulator) with the activation of 100 rhodopsins per rod (Hetling & Pepperberg, 1999), and taking R0 as ≈108 (Pugh & Lamb, 2000), eqn (2) yields Φ = 10−6 (sc cd s m−2)−1. Taking the photoisomerizing strength of a given luminance Ia in the adapting photostimulator as equivalent to ≈1/10 that of the same numerical value of luminance Ib in the dome photostimulator, and with the standard adapting illumination consisting of Ia = 2.1 × 10⁴ sc cd m−2 for 45 s, Neff ≈ 9.4 104 sc cd s m−2 (= (2.1 × 10⁴)(1/10)(45)). The fractional bleach B/R0 prevailing at the time of adapting light offset is thus predicted to be ≈0.09 {= 1 - exp[-(10−6) (9.4 × 10⁴)]}. This estimate is in rough agreement with the Table 1 determinations of 11-cis retinal reduction at times shortly after the adapting illumination.
Probe response waveform
Effect of varying adapting illumination
Figure 4A and B shows the effect of the standard adapting exposure on probe-alone responses, and on probe responses obtained in paired-flash trials with a test flash of 11 sc cd s m−2. A and B illustrate results obtained in a single experiment before and after the adapting illumination. Under dark-adapted conditions, and at the determination time tdet of 6 ms (vertical arrow in A), the probe response (probe-alone waveform PAD) was approximately halved when the test flash preceded the probe by 80 ms (waveform T80PD), and was reduced by a lesser amount when the test flash preceded the probe by 250 ms (waveform T250PD). From eqn (1), the normalized amplitude A(t)/AmoD of the dark-adapted derived response to the test flash was thus about 0.49 at 86 ms and 0.17 at 256 ms. As shown in Fig. 4B, the probe-alone response recorded 1 min after adapting light offset (tda = 1 min; response PA1 in B) was markedly reduced relative to the dark-adapted response PAD; the probe-alone response then grew with increasing period of dark adaptation (responses PA3, PA5, PA9, PA25 and PA29). Furthermore, the adapting light reduced the difference between the probe response obtained in a paired-flash trial and the prevailing probe-alone response. For example the response recorded at tda = 4 min with an 80 ms test-probe interval (response T80P4) differed from the prevailing probe-alone response (PA3 and PA5) to a degree considerably less than the difference between responses T80PD and PAD in A. This evident reduction in the derived response to the weak test flash will be further analysed below and referred to as desensitization of the response. Following adapting illuminations of standard duration (45 s) but reduced luminance, there occurred rapid recovery of both the probe-alone response and weak-flash sensitivity (Fig. 4C, D). A 3 min exposure to the standard adapting luminance was followed by relatively slow recovery (Fig. 4E).
Figure 4. Probe flash responses obtained before and after adapting light.
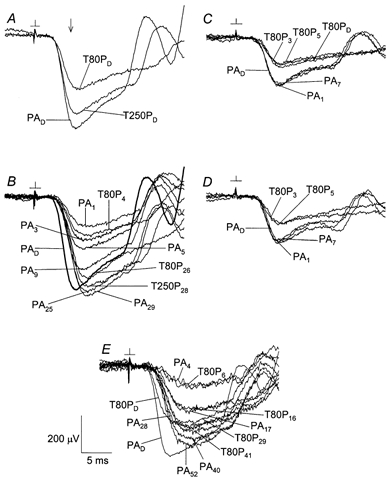
A and B, effect of standard adapting exposure (duration = 45 s; Ia = 2.1 × 10⁴ sc cd m−2). Data obtained in a single experiment. PA indicates probe-alone response. T80P and T250P indicate probe responses obtained in paired-flash trials (0.11 sc cd s m−2 test flash) with a test-probe interval of 80 ms and 250 ms, respectively. Subscripts refer to dark-adapted conditions (D) or to the dark-adaptation time tda (min). Waveform PAD in B is the average of three responses, all others are single responses. C and D, results obtained in a separate experiment. Data obtained before and after an initial adapting exposure of 45 s and Ia = 165 sc cd m−2 (C), and before and after a second adapting exposure of 45 s and Ia = 694 sc cd m−2 (D). E, results obtained in a third experiment, before and after a 3 min adapting exposure with Ia = 2.1 × 10⁴ sc cd m−2. Labelling format in panels C-E is as in A and B. See text for further details.
Delayed rising phase of probe response
The leading edge of the probe response obtained after an adapting exposure of standard or greater energy (Fig. 4B and E) exhibited a delay of ≈1 ms or more relative to that of the dark-adapted response. This delay is further described by Fig. 5A and B, which shows probe responses recorded over a 40 min period following the adapting illumination. Consistent with the Fig. 4B data, the delay was evident immediately after offset of the adapting light (waveform PA1 in Fig. 5A) and persisted throughout the ERG recording period. Figure 5C compares the light-induced delay with that induced by attenuation of the probe flash strength. Both before and after a standard adapting exposure, dimming of the probe flash progressively increased the leading-edge delay, consistent with previous rod photocurrent and ERG results (e.g. Lamb & Pugh, 1992; Hood & Birch, 1993; Cideciyan & Jacobson, 1996; Xu et al. 1997). The evident similarity in the effect of the adapting exposure and of stimulus dimming is consistent with a desensitization of the phototransduction process expressed at early times in the probe flash response. Moreover, dimming of the flash strength over the investigated range of about threefold had little effect on the peak amplitude of the response, consistent with interpretation of the nominal probe flash strength (343 sc cd s m−2) as a saturating stimulus. The delay in the probe flash response illustrated in Fig. 5A and B can be quantified in terms of the post-flash time required to reach 60 % of the peak amplitude. For the responses of Fig. 5A and B recorded before and after the adapting exposure, this criterion level was reached, respectively, at 4.55 ± 0.07 ms (n = 2) and 5.29 ± 0.08 ms (n = 9). Based on the results shown in Fig. 4 and Fig. 5, probe responses obtained after an adapting exposure were routinely analysed for amplitude at 7 ms after probe flash presentation (tdet = 7 ms).
Figure 5. Rising-phase delay in the probe-alone (PA) response induced by the standard adapting exposure.
A, response PAD, dark-adapted response. Numerical subscripts indicate dark-adaptation time tda (min). Results obtained in a single experiment. B, responses PA1-PA40 in A rescaled to match the average peak amplitude of response PAD in A. C, effect of stimulus attenuation. Results from a second experiment in which a probe flash of nominal strength (343 sc cd s m−2) was attenuated with neutral density filters. Numbers to the left and right identify flash strengths (sc cd s m−2) for responses obtained, respectively, before and 28-31 min after a standard adapting illumination.
Recovery of response to adapting light
Previous psychophysical and electrophysiological studies (e.g. Stiles & Crawford, 1932; Barlow, 1972; Thomas & Lamb, 1999) have developed the concept of the ‘equivalent background’ as a means of relating the excitatory and desensitizing after-effects of adapting illumination with the effects maintained by a steady luminous background. In a recent study of the ERG a-wave recorded from mouse, Kennedy et al. (2001) analysed rod dark adaptation following rhodopsin bleaching in terms of the recoveries of maximal a-wave amplitude and of the amplification parameter determined from analysis of the a-wave leading edge. In this section, we describe determination of the ‘excitation-equivalent background’ associated with recovery of the probe-alone response after the standard adapting illumination. These probe-alone results, together with sensitivity data obtained in paired-flash experiments (following section of Results), are evaluated below (Discussion) in relation to the equivalent background.
Figure 6A shows probe-alone response amplitudes determined in the experiment of Fig. 4A and B and in six others that similarly examined the effect of a standard adapting exposure. Within each experiment, the amplitude (tdet = 7 ms; see above) of the response obtained at a given time tda after the adapting exposure was normalized to the amplitude of the dark-adapted response (tdet = 6 ms). The data are described well by the nested exponential relation (Hetling & Pepperberg, 1999):
| (3a) |
where AmoL(tda)/AmoD is the normalized probe-alone response amplitude, and a and b are free parameters. By analogy with eqn (1), the difference between AmoL(tda) and the dark-adapted maximal amplitude AmoD represents A(tda), the derived response to the adapting illumination at dark-adaptation time tda. That is, the normalized derived response A(tda)/AmoD is given by:
| (3b) |
Fitting eqn (3a) to the entire set of data in Fig. 6A yielded a = 1.36 and b = 0.14 min−1 (smooth curve in A); for reference below, these values of a and b will be termed the nominal values a0 and b0. We may define, as a characteristic recovery time tr for the probe response, the time after adapting light offset at which AmoL(tda)/AmoD = 0.8. The separate fitting of eqn (3a) to data from each of the Fig. 6A experiments yielded tr = 13.5 ± 3.0 min (mean ± s.d.). Values of exp{-a [exp(-b)]} in the seven experiments, representing the extent of recovery of the normalized probe-alone response at tda = 1 min, were 0.31 ± 0.10. As illustrated by the dashed curve in Fig. 6A, the data were also described well by a recovery function of the type considered by Kennedy et al. (2001):
| (4) |
with γ1 = 2.53, k1 = 0.20 min−1, γ2 = 0.09 and k2 = 0.04 min−1.
Figure 6. Recovery of probe-alone response amplitude as a function of dark-adaptation time tda.
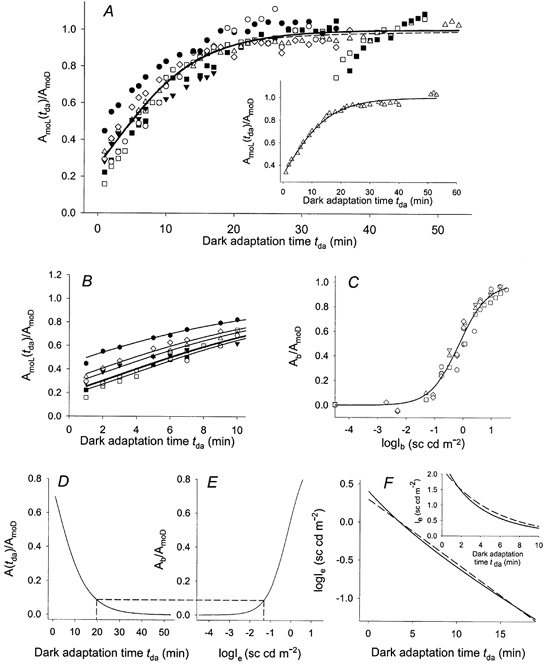
A, collected data from seven experiments that employed the standard adapting exposure; identical symbols indicate results from the same experiment. Data shown by ⋄ obtained in the experiment of Fig. 4A and B. The continuous curve plots the nominal fit of eqn (3a). Dashed curve plots eqn (4) with evaluated parameters as indicated in the text. Both illustrated curves exhibit root-mean-square deviations of 0.0721. Inset, fit of eqn (3a) to data from one of the Fig. 6A experiments; fitted parameters a = 1.15 and b = 0.12 min−1. B, data of A plotted on an expanded time scale. Curves plot eqn (5) with fitted values of δ in the range of −1.7 min to 3.8 min. C, normalized amplitudes Ab/AmoD of the maintained derived response in steady background light of luminance Ib (five experiments). Data reproduced from Fig. 1 of Silva et al. (2001). The continuous curve plots the empirically chosen relation Ab/AmoD = [β1Ibθ (β2θ + Ibθ)−1] with β1 = 0.99, β2 = 0.71 sc cd m−2 and θ = 0.87. D and E, determination of the excitation-equivalent background Ie. F, continuous curve (obtained using Maple, Waterloo Maple Inc., Waterloo, Ontario, Canada) shows the dependence of logIe on dark adaptation time tda, determined from D and E. Dashed line describes a first-order decay with exponential time constant of 5.2 min. Inset, continuous curve plots Ievs. tda. Dashed curve plots an exponential decay with a 5.2 min time constant. See text for further details.
Figure 6B illustrates the Fig. 6A data on a faster time scale and further describes the initial phase of the recovery. The curves accompanying these data plot a modified form of eqn (3a):
| (5) |
where a0 and b0 represent the nominal fit of eqn (3a), and δ is a time parameter varied to provide a fit to the individual sets of recovery data. The general agreement of these curves with the data implies that, despite differences among animals in the extent of recovery measured at a given time tda shortly after the adapting illumination, the instantaneous rates of recovery exhibited at a given level of recovery are similar.
The effect of steady background illumination on the maintained derived response of mouse rods in vivo has recently been investigated (Silva et al. 2001). Figure 6C, which reproduces data reported by Silva et al. (2001; their Fig. 1), shows the normalized maintained response (defined here as Ab/AmoD) as a function of logIb, the logarithm of background luminance in the dome photostimulator. With the results shown in Fig. 6A and C, the falling phase of the derived response to the adapting light can be represented as the decline of the excitation-equivalent background, here termed Ie. Figure 6D and E illustrates the transform that yields this excitation-equivalent background at a given dark-adaptation time tda. Figure 6D, which plots eqn (3b) evaluated with the nominal parameters a0 and b0, shows the derived response A(tda)/AmoD as a function of tda. Figure 6E reproduces the Fig. 6C curve, with the equivalent background Ie substituted for the actual background Ib. Dashed lines relate points of equal ordinate value in D and E, and thus associate a given dark-adaptation time tda with a value of logIe. The function resulting from this association (logIevs. tda) is shown by the curve in F; also shown is a plot of Ievs. tda in linear coordinates (continuous curve in the inset). In Fig. 6F the illustrated range of tda extends to 19 min, the dark-adaptation time that in D and E corresponds with a 10 % maximal excursion of A(tda)/AmoD and Ab/AmoD. Over the range 1 ≤ tda ≤ 19 min, the decline in logIe is approximately described by a first-order decay with an exponential (1/e) time constant of 5.2 min (dashed line and inset dashed curve in Fig. 6F). An exponential decay with time constant 4.3 min closely describes the decline of logIe over the range 1 ≤ tda ≤ 8 min (not illustrated).
Weak-flash sensitivity
Desensitization produced by adapting light
The standard adapting illumination reduced the amplitude of the derived response to a weak test flash (0.11 sc cd s m−2) determined in paired-flash trials with a given test-probe interval. Circles and squares in Fig. 7 indicate results obtained with test-probe intervals of 80 and 250 ms, respectively; filled and open symbols indicate, respectively, data obtained before and after the adapting exposure. Fig. 7A displays the results with normalization to the dark-adapted maximal amplitude AmoD determined in each experiment. The normalized derived amplitude determined with the 80 ms test-probe interval was on average 0.44 before the adapting exposure and, immediately after the adapting exposure, was on average 0.11. The average value then increased gradually toward a plateau representing about 45 % of the dark-adapted level. Normalized amplitudes obtained with the 250 ms test-probe interval also showed an immediate reduction due to the adapting light (on average, from 0.17 to 0.08), and subsequently exhibited values representing about 30-60 % of the dark-adapted level. Fig. 7B illustrates the data with normalization to the prevailing maximal amplitude AmoL and thus describes the extent of desensitization upon compensation for the reduction in maximal amplitude produced by the adapting light.
Figure 7. Amplitudes of derived responses to a weak test flash (0.11 sc cd s m−2).
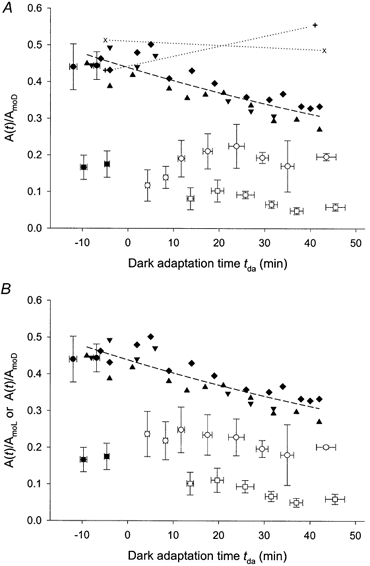
Data obtained in the seven experiments of Fig. 6A with test-probe intervals of 80 ms (circles) and 250 ms (squares). Filled and open symbols represent data obtained, respectively, before and after the adapting exposure; each data point indicates the mean ± s.d. of two to seven determinations. ▴, ▾, ♦, × and + are results obtained with a test-probe interval of 80 ms in control experiments in which the adapting exposure was omitted; identical symbols show results from the same experiment. Each set of data is positioned along the time axis to approximately match, with the experiments involving adapting illumination, the time of initial administration of anaesthetic (estimated tolerance of the match ± 5 min). In the experiments described by × and + symbols, a period of darkness (about 40 min) separated initial and final paired-flash trials; each × and + is the average of two determinations. A, for the experiments shown by × and + symbols, derived amplitudes are normalized to the prevailing dark-adapted maximal amplitude AmoD. For all other experiments, derived amplitudes are normalized to AmoD determined early in the experiment. Dashed curve accompanying the ▴, ▾ and ♦ plots the empirical relation A(tda)/AmoD = [0.44 exp(-0.0085tda)]. B, same as A, except with derived amplitudes determined after light adaptation (○ and □) normalized to the prevailing maximal amplitude AmoL.
Temporal properties of the derived weak-flash response are illustrated in Fig. 8, which shows ratios of the normalized derived amplitudes obtained with the 250 and 80 ms test-probe intervals. Figure 8 indicates the occurrence of modest changes in the average of these ratios during the investigated period of dark adaptation. Data obtained from a given animal were analysed by linear regression to determine the best-fit slope of ratios determined during the course of dark adaptation. The best-fit slope was negative for five of the seven experiments described in Fig. 8, and positive for one experiment; these six slope determinations exhibited a mean ± s.d. of −6.74 × 10⁻³ ± 9.39 × 10⁻³ min−1. (Data from the seventh experiment included only a single determination of A(287)/A(87) following light adaptation.) The ratio determinations of Fig. 8 were also analysed following grouping of these data as follows: results obtained before the adapting exposure (group 1) (filled symbols in Fig. 8); and results obtained at dark-adaptation times tda = 12-21 min (group 2), tda = 22-32 min (group 3) and tda ≥ 35 min (group 4). An independent samples t test performed on these grouped data indicated significant differences between the ratios of group 4 and those of groups 1, 2 and 3 (P < 0.05). Post hoc analysis using the Bonferroni correction for multiple comparisons (Stevens, 1996) indicated a significant difference only between groups 2 and 4 (P = 0.023).
Figure 8. Ratio of derived amplitudes obtained with test-probe intervals of 80 and 250 ms.
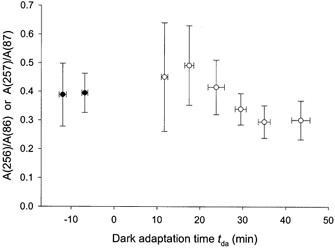
Results obtained in the experiments described by Figs 6A, B and 7. • and ○ indicate data obtained, respectively, before and after the adapting illumination. Each data point indicates the ratio of derived amplitudes determined in paired-flash trials (A(256)/A(86) or A(257)/A(87)) and is the mean ± s.d. of two to seven determinations.
The Fig. 7 data described by open circles may be compared with the results of control experiments in which the adapting exposure was omitted (Fig. 7, filled triangles, inverted triangles and diamonds). Over periods comparable with those of the light-adaptation experiments, a gradual decrease in derived amplitude obtained with the 80 ms test-probe interval was observed in these control experiments. Based on determinations of the probe-alone amplitude AmoD at early and late times in these experiments (Table 2), this decrease in the derived amplitude typically was accompanied by a modest increase in AmoD (mean increase ± s.d.: 22 ± 29 %). As measured at 60 % of the peak amplitude, the leading edge of probe responses recorded in these control experiments exhibited gradual development of a delay (0.3-0.4 ms) over a period of 39-49 min (data not illustrated).
Table 2.
Probe-alone amplitudes (μV) in the Fig. 7 control experiments that omitted adapting illumination
| Symbol in Fig. 7 | Early determinations a | Late determinations b |
|---|---|---|
| ▴ | 518 ± 31.3 | 413 ± 19.5 |
| ▾ | 469 ± 21.3 | 523 ± 6.2 |
| ♦ | 485 ± 25.5 | 608 ± 12.2 |
| × | 365 ± 15.9 | 582 ± 20.5 |
| + | 513 ± 12.1 | 678 ± 30.2 |
Data obtained within brief intervals (≤ 10 min) near the beginning of the experiment (a) and ∼39–49 min later (b), near the conclusion of the experiment.
Recovery after prolonged dark adaptation
The experiments of Fig. 9 were undertaken to determine whether a full recovery of sensitivity after a standard adapting illumination occurs over an extended period of dark adaptation. Open and filled symbols in Fig. 9 show normalized amplitudes of the derived response obtained with a 0.11 sc cd s m−2 test flash and with test-probe intervals of 80 and 250 ms, respectively. The experiments described by circles and triangles (referred to below as experiments 1 and 2, respectively) involved initial dark-adapted characterization followed by presentation of the adapting light. In each experiment the mouse was removed from the ERG recording apparatus ≈10 min after the adapting illumination, maintained in darkness for about 4 h, and then re-anaesthetized and re-positioned in the recording apparatus for the further collection of ERG data. Procedures used in a third, control experiment (3; squares in Fig. 9) were similar to those of experiments 1 and 2 but omitted the adapting exposure. As shown in Fig. 9, data obtained during the latter phases of these experiments (tda > 265 min) at a given test-probe interval were generally similar among the three animals studied. In addition, with the exception of results obtained in experiment 2 with a test-probe interval of 250 ms (filled triangles), the amplitude determined at the initiation of the experiment's latter phase (tda = 268-274 min) differed by < 20 % from the dark-adapted value determined at the beginning of the experiment.
Figure 9. Effect of prolonged dark-adaptation period.
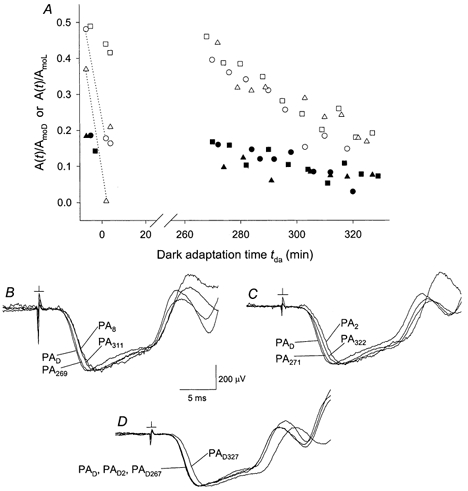
Open and filled symbols indicate, respectively, derived amplitudes obtained with an 80 and 250 ms test-probe interval. A, experiments 1 and 2 (circles and triangles, respectively) involved a standard adapting exposure. Dotted lines connect data obtained with the 80 ms test-probe interval before and immediately after the exposure. Control experiment 3 (squares) omitted the adapting illumination; data positioned on the time axis as described in Fig. 7 legend for the control experiments of Fig. 7. B-D, probe-alone responses obtained in experiments 1-3, respectively. In each panel, responses are scaled to match the peak amplitude of the dark-adapted responses PAD. Labelling of waveforms as in Figs 4 and 5. Subscript D in all waveform labels of D symbolizes the dark-adapted condition maintained throughout this experiment.
Figure 9B-D shows peak-normalized probe-alone responses recorded, respectively, in experiments 1-3 of Fig. 9A. In the light-adaptation experiments 1 and 2, the ≈4 h period in darkness following the adapting exposure yielded near-complete recovery from the rising-phase delay produced by the adapting light (cf. Fig. 5) (in Fig. 9B, compare waveforms PA8 and PA269 with the dark-adapted response PAD; in Fig. 9C, compare waveforms PA2 and PA271 with PAD). In both cases a delay re-appeared over the latter period of ERG measurement (waveforms PA311 and PA322, respectively, in B and C). In the control experiment 3, little if any rising-phase delay developed over the ≈4 h period of darkness, but a delay did develop over the ≈1 h period of recording in the latter phase of the experiment (in D, compare waveforms PAD2, PAD267 and PAD327 with the initially recorded dark-adapted waveform PAD). In summary, the Fig. 9 results indicate near-complete recovery, over a period of ≈4 h, from the effects of the standard adapting illumination on both the sensitivity of the weak-flash derived response and the delay that precedes the leading edge of the probe response.
Control experiments with reduced repetition of flash stimulation
The gradual decline in sensitivity observed in the absence of the adapting exposure (filled triangles, inverted triangles and diamonds in Fig. 7), the near-complete recovery of sensitivity observed after ≈4 h in darkness (Fig. 9), and the gradual sensitivity decline observed with photic stimulation long after the adapting exposure (Fig. 9) suggested that the gradual decline may be a cumulative effect of bright probe flash presentation. The two control experiments described by × and + symbols in Fig. 7 tested this possibility. In each of these experiments, weak-flash sensitivity with an 80 ms test-probe interval was determined early in the experiment. The mouse was then maintained in the recording apparatus, in darkness, for ≈40 min; sensitivity was again determined. The results indicated little or no decrease in sensitivity; in addition, no detectable delay (< 0.1 ms) in the probe-alone response developed during the course of these experiments. The gradual decline of sensitivity determined with the 80 ms test-probe interval (Fig. 9; and triangles, inverted triangles and diamonds in Fig. 7) thus appears to be a consequence of photic stimulation, and the desensitization specifically attributable to the adapting illumination is given by the relationship between the open circles and dashed curve in Fig. 7. This desensitization is approximately fourfold at tda = 5 min and twofold at tda = 20 min.
Effect of weak pre-illumination
The experiments of Fig. 10 tested whether pre-exposure to relatively weak but near-saturating light affects the course of dark adaptation following a standard adapting illumination, perhaps by extending the period of influence of reduced intracellular Ca2+ concentration on light-adaptation processes (Matthews, 1991; Gray-Keller & Detwiler, 1996; Sampath et al. 1998; reviewed by Fain et al. 2001). The pre-illumination consisted of a 10 min exposure with the adapting photostimulator (Ia = 210 sc cd m−2) immediately before the standard illumination. The time-integrated luminance of the pre-exposure represented only 13 % of that of the standard exposure, but the effective luminance maintained during this 10 min period was equivalent to Ib ≈21 sc cd m−2 (= 210/10; see text accompanying eqn (2)) and thus near-saturating for the rod response (Silva et al. 2001; and present Fig. 6C). As shown in Fig. 10, results obtained for normalized derived amplitudes with test-probe intervals of 80 and 250 ms (circles and squares, respectively) were generally similar to those obtained following the standard adapting exposure (cf. Fig. 7B). The fitting of eqn (3a) to the recovery time course of the probe-alone response (not illustrated) yielded 80 % recovery times tr of 10.9 ± 2.7 min (n = 3) and normalized fractional recoveries of 0.40 ± 0.03 at tda = 1 min (eqn (3a)). Similar experiments performed with a 20 min pre-illumination period yielded tr = 14.2 ± 5.4 min and normalized recoveries of 0.20 ± 0.18 at tda = 1 min (n = 2) (not shown). Thus, neither the 10 min nor the 20 min pre-illumination under the present experimental conditions substantially altered the recovery time tr or the normalized initial recovery from values exhibited in the absence of pre-illumination.
Figure 10. Effect of pre-illumination.
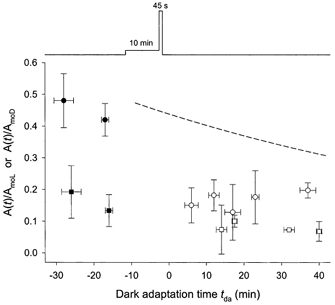
Results obtained in three experiments with 10 min exposure to weak adapting light (Ia = 210 sc cd m−2) immediately before the 45 s standard exposure. Derived response amplitudes obtained with test-probe intervals of 80 and 250 ms shown, respectively, by circles and squares. Filled and open symbols indicate data obtained before and after light adaptation, respectively. All data normalized to the prevailing probe-alone amplitude. Each data point is the mean ± s.d. of two to four determinations. Dashed curve reproduces that shown in Fig. 7A and B.
DISCUSSION
The present experiments address the nature of dark adaptation in mouse photoreceptors in vivo through analysis of the ERG a-wave response to a bright probe flash. As shown by Fig. 5, probe-alone responses obtained over a dark-adaptation period of ≈40 min show little if any change in normalized kinetics of the response's leading edge. Previous ERG studies in mouse (Hetling & Pepperberg, 1999; Lyubarsky et al. 1999; Silva et al. 2001) have concluded, on the basis of this type of kinetic constancy as well as properties of the test flash response derived from paired-flash data, that cone photoreceptors in the mouse eye contribute only modestly to the response generated by a bright probe flash under all but extreme conditions of light adaptation (for example Fig. 9 and accompanying text of Hetling & Pepperberg, 1999). On this basis we interpret the probe responses obtained here as largely rod-mediated, and the derived responses determined from these data as essentially those of the rod photoreceptors.
Decay of excitatory signal
The Fig. 6 results show that eqn (3a) accounts well for the recovery phase of the derived rod response, i.e. for recovery of the rod circulating current, at dark-adaptation times beyond about 1 min after the standard adapting illumination. The nominal evaluation of eqn (3a) yields an average fractional recovery of 0.31 at 1 min following adapting light offset (tda = 1 min), and half-completion of the recovery (i.e. AmoL(tda)/AmoD = 0.5) at tda = 4.9 min. Previous determinations of the derived response in steady background light (Silva et al. 2001) show that a background strength Ib of ≈20 sc cd m−2 produces a near-saturating maintained response. As the effective strength of the present adapting illumination (≈(0.1)Ia = 2.1 × 10³ sc cd m−2; see text accompanying eqn (2)) far exceeds 20 sc cd m−2, the rods were presumably at or near saturation at the moment of adapting light offset. A recovery of about 31 % at tda = 1 min and the subsequently slower kinetics of recovery thus imply the occurrence of a rapid initial component of recovery, the course of which is largely complete by tda ≈1 min.
We have determined the time course of the excitation-equivalent background Ie that describes recovery of the response to the standard adapting illumination used here (Fig. 6F). Over the interval beginning at tda = 1 min and extending to the time at which the normalized derived response A(tda)/AmoD falls to 0.1 (tda = 19 min), Ie is approximately described by a single exponential decay with a time constant of 5.2 min. Kennedy et al. (2001), in their recent ERG study of mouse rod recovery following a rhodopsin bleach of about 20 % (similar to that inferred for the present standard adapting illumination; Table 1), report a biphasic decline of the excitation-equivalent background consisting of a rapid phase with a time constant of 2.4 min, and a subsequent phase of small excursion with a time constant of 56 min. Normalized amplitude data obtained in the two studies exhibit a generally similar pattern (compare filled circles in Fig. 5D of Kennedy et al. (2001) with the present Fig. 6A data). A possible basis for the modest difference in the findings of the two studies may be differences in the methods of analysis. Kennedy et al. (2001) determined amax, a parameter proportional to the prevailing maximal amplitude of the rod response, by fitting a leading-edge model to ensembles of a-wave responses (Breton et al. 1994; Smith & Lamb, 1997); resulting values of amax were then analysed through an assumed biphasic exponential decay (eqn (3) of Kennedy et al. 2001). In the present study, amplitudes of responses to a bright probe flash were analysed in relation to a nested exponential recovery function (eqns (3a) and (3b)) of form similar to that used previously to describe the recovery phase of the derived rod response (Hetling & Pepperberg, 1999; Silva et al. 2001). The time course of Ie was then determined from this recovery function and from an experimentally determined function linking response amplitude with background intensity (Fig. 6C). The present Fig. 6A data are well described by a function of the type used by Kennedy et al. (2001) (dashed curve), with time constants (k1−1 = 5.0 min; k2−1 = 25 min; cf. eqn (4)) of order similar to those determined by Kennedy et al. (2001). Furthermore, the Kennedy et al. (2001) study and the present study indicate similar half-completion times (≈8 min and ≈5 min, respectively) for the recovery of rod photocurrent after a bleach of ≈20 %. Thomas & Lamb (1999), in their ERG study of human rod recovery, report a similar half-completion time after ≈20 % bleaching.
The possible dependence of Ie on non-excitatory desensitizing processes initiated by the adapting light (see below) cannot be ruled out. However, assuming Ie to be linearly related to the level of a rhodopsin bleaching product generated by the adapting exposure (e.g. Thomas & Lamb, 1999), the Fig. 6 analysis is consistent with the simple view that over a major portion of its excursion, recovery of the rod response to the adapting light is rate-limited by a first-order decay of this product with time constant τe = 5.2 min. An estimate of the excitatory effectiveness of this product, relative to that of photoactivated rhodopsin (R*; metarhodopsin II), can be obtained through the following calculation.
(i) Based on the data of Table 1 and the calculation accompanying eqn (2), the bleach produced by the standard adapting exposure was (to within a factor of ≈2) about 20 percent, or about 2 × 10⁷ bleached rhodopsins per rod, at the time of adapting light offset (tda = 0).
(ii) Extrapolation of the linear function shown in the semilog plot of Fig. 6F yields Ie = 1.94 sc cd m−2 at tda = 0. Equating 1 sc cd m−2 with 100 R* rod−1 s−1 (Hetling & Pepperberg, 1999), Ie at tda = 0 is ≈194 R* rod−1 s−1.
(iii) Taking the effective lifetime of R* in weak to moderate background light as ≈0.3 s or less (i.e. similar to or less than the integration time of the dark-adapted weak-flash response; Chen et al. 1995; Xu et al. 1997; Silva et al. 2001; also cf. Lyubarsky & Pugh, 1996), a generation rate of 194 R* rod−1 s−1 corresponds with a steady-state R* level of at most ≈58 per rod.
From (i-iii), the excitatory effectiveness of the bleaching product relative to that of R* is at most ≈3 × 10⁻⁶ (= 58/(2 × 107)). This effectiveness ratio is of an order similar to that determined by Melia et al. (1997) for the residual transducin-activating property of bleached rhodopsin in vitro (≈10−6), and also is of an order similar to that determined electrophysiologically by Cornwall & Fain (1994) for the signalling activity of bleached rhodopsin in salamander rods (≈10−7 to ≈10−6).
Several types of evidence indicate a close link between the decay of excitation after a rhodopsin bleaching illumination and the removal of all-trans retinal from opsin (e.g. Surya et al. 1995; Weng et al. 1999; Sachs et al. 2000; and references cited in the Introduction). However, Kennedy et al. (2001) report a time constant of ≈14 min for the enzymatic reduction of all-trans retinal under conditions similar to those of the present experiments (also cf. Qtaishat et al. 1999). As 14 min considerably exceeds the observed time constant of 5.2 min for the decay of Ie, the present results support the possibility (Kennedy et al. 2001) that the decay of Ie is rate-limited by the dissociation of all-trans retinal from opsin and/or the translocation of this retinal from the intradiskal space to the cytosol, rather than by enzymatic reduction of the retinal.
Lingering desensitization
A central finding of the present study comes from the results of the Fig. 7 paired-flash experiments, which indicate a persisting desensitization of the rods following near-complete recovery of the response to the adapting illumination. For example at tda = 20 min, a time well beyond the average required for 80 % recovery of the response (see Fig. 6), results obtained with the 80 ms test-probe interval indicate rod sensitivity to be only ≈60 % of that measured in control experiments (compare open circles with filled triangles, inverted triangles and diamonds in Fig. 7A). Furthermore, over the period ≈20 ≤ tda ≤ 40 min, the normalized desensitization as referred to the dark-adapted sensitivity (desensitization of about twofold; Fig. 7B) is generally similar to that inferred from the delayed leading edge of the probe response (Fig. 4 and Fig. 5), and is similar also to the reduction in amplification determined from analysis of the Fig. 1 a-wave responses. Neither the desensitization determined from the paired-flash trials nor the delay in the probe response's leading edge at dark-adaptation times near ≈20 min can be explained by a reduced efficiency of quantum capture by the rods, since the sensitivity reduction at tda ≈20 min substantially exceeds the prevailing reduction in rhodopsin inferred from the retinoid analyses of Fig. 2 and Table 1.
The possibility that the long-lived desensitization is due to a pre-retinal opacification (e.g. corneal drying and resulting cataract formation during ketamine/xylazine anaesthesia, producing attenuation of the incident stimulating light; Calderone et al. 1986; Nusinowitz et al. 2000) cannot be ruled out. However, this possibility seems unlikely, inasmuch as the tested eye of the animal was well moistened by the constant application of water and the periodic application of methylcellulose solution to the corneal surface. Furthermore, routine visual observation of the eye during the experiment (under dim red illumination) showed no evidence of opacification. On this basis we interpret the observed, lingering desensitization as a property of the rod response under the present conditions of dark adaptation. We furthermore interpret the near-constancy of the leading-edge delay as correlated with the relatively constant desensitization of the normalized derived response shown in Fig. 7B.
By analogy with the excitation-equivalent background considered above, the sensitivity loss exhibited after the standard adapting illumination can be associated with a desensitization-equivalent background, here termed Id. An estimate of the Id associated with the desensitization at tda ≈20 min (relative sensitivity ≈0.6; see above) can be obtained as follows. Under steady background illumination of 0.63 sc cd m−2, the rod flash response exhibits a near-peak relative sensitivity of about 0.4 (i.e. ≈2.5-fold desensitization; cf. Fig. 3 of Silva et al. 2001). Furthermore, the relative near-peak sensitivity S/SD of mammalian rods varies with the strength Ib of relatively weak background light according to the Weber relation:
| (6) |
where I0 is the background strength that halves S/SD (Nakatani et al. 1991; Kraft et al. 1993; Schneeweis & Schnapf, 2000; Friedburg et al. 2001). With eqn (6), I0 for the present system is 0.42 sc cd m−2 {= [0.63(2.5 - 1)−1]}. At tda ≈20 min, the desensitization-equivalent background Id associated with the observed relative sensitivity of ≈0.6 is thus 0.28 sc cd m−2 {= I0 [(SD /S) - 1] = 0.42[(1/0.6) - 1]}.
Two related arguments imply that the desensitization at tda ≈20 min represented by this value of Id is unlikely to result from residual excitation by the photoproduct considered in the preceding Discussion. First, with the excitation-equivalent background Ie equal to 1.94 sc cd m−2 at tda = 0 and with the decay time constant τe = 5.2 min (Fig. 6F), Ie at a dark-adaptation time of 20 min is predicted to be only ≈0.042 sc cd m−2, i.e. much smaller than the prevailing 0.28 sc cd m−2 value of Id. Second, the excitation measured at tda = 20 min is smaller than that predicted to occur with a ‘real’ background of strength equal to Id. That is, the fitted curve in Fig. 6C associates 0.28 sc cd m−2 with a maintained normalized response of 0.31, but the determined normalized response at this dark-adaptation time is only ≈0.1 (eqn (3b) and Fig. 6D). Kennedy et al. (2001) similarly observed that desensitization at long dark-adaptation times exceeds that expected from residual excitation by a rapidly decaying photoproduct. They hypothesized that the slow phase of excitation decay and of sensitivity recovery determined from their analysis is regulated by the decay of a long-lived bleaching product.
Both the present findings and those of Kennedy et al. (2001) are, however, consistent with an alternative possibility: namely, that the lingering desensitization does not derive from continuing excitation (as in the desensitization produced by weak background light), but rather from a ‘silent’ (i.e. non-excitatory) process that reduces the efficiency of photic signal transmission. For example, previous studies have hypothesized that desensitization after bright (rhodopsin bleaching) light may reflect depletion of the activatable form of a disk-based transduction component downstream from rhodopsin (e.g. Pepperberg, 1984; Pepperberg et al. 1996), or accelerated shut-off of the activated form of a downstream component (e.g. Norton et al. 2000). Data recently reported by Sokolov et al. (2001) support a specific possibility, that of a light-induced decrease in the level of transducin in the outer segment. Such a mechanism is consistent, for example, with the similarity observed here between normalized desensitization as determined near the peak of the weak-flash response (paired-flash results obtained with the 80 ms test-probe interval; Fig. 7B) and that implied by the delay in the leading edge of the probe response (Fig. 5). That is, a reduced amount of activatable transducin in the vicinity of a given photoactivated rhodopsin would on a simple view be expected to reduce the instantaneous gain of the flash response at very early times as well as at near-peak times. A decrease in local transducin level induced by bright illumination can furthermore account for the observed development of a measurable delay in the probe response's leading edge with repeated photic stimulation (Fig. 9B–D). The process described by Sokolov et al. (2001) appears consistent also with the finding by Leibrock et al. (1994), that desensitization following small bleaches greatly exceeds that attributable to continuing excitation (photocurrent noise) in the transduction cascade.
Kinetics of weak-flash response
A final note concerns the results shown in Fig. 8, which indicate ratios of weak-flash response amplitudes obtained before and after the standard adapting illumination with test-probe intervals of 80 and 250 ms. Previous studies investigating the effects of bleaching on rods in vitro (Cornwall et al. 1990; Cornwall & Fain, 1994) show that significant bleaching, like steady background light of moderate intensity, accelerates the kinetics of the weak-flash response. The present Fig. 8 data indicate the absence of a large effect of bleaching on response kinetics, and thus might seem at odds with the previous findings. It will be recalled, however, that the post-bleach times described in Fig. 8 (tda ≈11 min and greater) correspond with the progressive and already near-complete recovery of circulating current (Fig. 6) and thus, through the equivalent background concept, with conditions produced by progressively decreasing and already weak background light. As the accelerating effect of background light on the weak-flash response diminishes with decreasing background intensity (e.g. Kraft et al. 1993; Friedburg et al. 2001; Silva et al. 2001), the modest changes in response kinetics described in Fig. 8 and the accompanying text are consistent with the possibility considered in the preceding paragraph.
Acknowledgments
We thank Drs J. R. Hetling, G. A. Silva and J. B. Hurley for helpful discussions, and Mr M. Mori for technical assistance, during the course of this study. We also thank Dr John J. K. Derwent for assistance with the MatLab and Maple fittings, and Dr Deborah M. Little for assistance with statistical analyses. This research was supported by NIH grants EY-05494 and EY-01792, and by an unrestricted grant from Research to Prevent Blindness, Inc. (New York, NY, USA).
REFERENCES
- Barlow HB. Dark and light adaptation: psychophysics. In: Jameson D, Hurvich LM, editors. Handbook of Sensory Physiology. VII/4. Berlin: Springer; 1972. pp. 1–28. [Google Scholar]
- Baylor DA, Lamb TD. Local effects of bleaching in retinal rods of the toad. Journal of Physiology. 1982;328:49–71. doi: 10.1113/jphysiol.1982.sp014252. [DOI] [PMC free article] [PubMed] [Google Scholar]
- Birch DG, Hood DC, Nusinowitz S, Pepperberg DR. Abnormal activation and inactivation mechanisms of rod transduction in patients with autosomal dominant retinitis pigmentosa and the pro-23-his mutation. Investigative Ophthalmology and Visual Science. 1995;36:1603–1614. [PubMed] [Google Scholar]
- Breton ME, Schueller AW, Lamb TD, Pugh EN., Jr Analysis of ERG a-wave amplification and kinetics in terms of the G-protein cascade of phototransduction. Investigative Ophthalmology and Visual Science. 1994;35:295–309. [PubMed] [Google Scholar]
- Calderone L, Grimes P, Shalev M. Acute reversible cataract induced by xylazine and by ketamine-xylazine anesthesia in rats and mice. Experimental Eye Research. 1986;42:331–337. doi: 10.1016/0014-4835(86)90026-6. [DOI] [PubMed] [Google Scholar]
- Calvert PD, Govardovskii VI, Krasnoperova N, Anderson RE, Lem J, Makino CL. Membrane protein diffusion sets the speed of rod phototransduction. Nature. 2001;411:90–94. doi: 10.1038/35075083. [DOI] [PubMed] [Google Scholar]
- Chen J, Makino CL, Peachey NS, Baylor DA, Simon MI. Mechanisms of rhodopsin inactivation in vivo as revealed by a COOH-terminal truncation mutant. Science. 1995;267:374–377. doi: 10.1126/science.7824934. [DOI] [PubMed] [Google Scholar]
- Cideciyan AV, Jacobson SG. An alternative phototransduction model for human rod and cone ERG a-waves: normal parameters and variation with age. Vision Research. 1996;36:2609–2621. doi: 10.1016/0042-6989(95)00327-4. [DOI] [PubMed] [Google Scholar]
- Cornwall MC, Fain GL. Bleached pigment activates transducin in isolated rods of the salamander retina. Journal of Physiology. 1994;480:261–279. doi: 10.1113/jphysiol.1994.sp020358. [DOI] [PMC free article] [PubMed] [Google Scholar]
- Cornwall MC, Fein A, MacNichol EF., Jr Cellular mechanisms that underlie bleaching and background adaptation. Journal of General Physiology. 1990;96:345–372. doi: 10.1085/jgp.96.2.345. [DOI] [PMC free article] [PubMed] [Google Scholar]
- Donner KO, Reuter T. Visual adaptation of the rhodopsin rods in the frog's retina. Journal of Physiology. 1968;199:59–87. doi: 10.1113/jphysiol.1968.sp008639. [DOI] [PMC free article] [PubMed] [Google Scholar]
- Dowling JE. Neural and photochemical mechanisms of visual adaptation in the rat. Journal of General Physiology. 1963;46:1287–1301. doi: 10.1085/jgp.46.6.1287. [DOI] [PMC free article] [PubMed] [Google Scholar]
- Dowling JE, Ripps H. Visual adaptation in the retina of the skate. Journal of General Physiology. 1970;56:491–520. doi: 10.1085/jgp.56.4.491. [DOI] [PMC free article] [PubMed] [Google Scholar]
- Fain GL, Matthews HR, Cornwall MC, Koutalos Y. Adaptation in vertebrate photoreceptors. Physiological Reviews. 2001;81:117–151. doi: 10.1152/physrev.2001.81.1.117. [DOI] [PubMed] [Google Scholar]
- Friedburg C, Thomas MM, Lamb TD. Time course of the flash response of dark- and light-adapted human rod photoreceptors derived from the electroretinogram. Journal of Physiology. 2001;534:217–242. doi: 10.1111/j.1469-7793.2001.t01-1-00217.x. [DOI] [PMC free article] [PubMed] [Google Scholar]
- Grabowski SR, Pak WL. Intracellular recordings of rod responses during dark-adaptation. Journal of Physiology. 1975;247:363–391. doi: 10.1113/jphysiol.1975.sp010936. [DOI] [PMC free article] [PubMed] [Google Scholar]
- Gray-keller MP, Detwiler PB. Ca2+ dependence of dark- and light-adapted flash responses in rod photoreceptors. Neuron. 1996;17:323–331. doi: 10.1016/s0896-6273(00)80163-4. [DOI] [PubMed] [Google Scholar]
- Hetling JR, Pepperberg DR. Sensitivity and kinetics of mouse rod flash responses determined in vivo from paired-flash electroretinograms. Journal of Physiology. 1999;516:593–609. doi: 10.1111/j.1469-7793.1999.0593v.x. [DOI] [PMC free article] [PubMed] [Google Scholar]
- Hofmann KP, Pulvermüller A, Buczyłko J, Van Hooser P, Palczewski K. The role of arrestin and retinoids in the regeneration pathway of rhodopsin. Journal of Biological Chemistry. 1992;267:15701–15706. [PubMed] [Google Scholar]
- Hood DC, Birch DG. Light adaptation of human rod receptors: the leading edge of the human a-wave and models of rod receptor activity. Vision Research. 1993;33:1605–1618. doi: 10.1016/0042-6989(93)90027-t. [DOI] [PubMed] [Google Scholar]
- Kang Derwent JJ, Qtaishat NM, Pepperberg DR. Dark adaptation in mouse rod photoreceptors measured in vivo by paired-flash electroretinography. Investigative Ophthalmology and Visual Science. 2001;42:S369. abstract. [Google Scholar]
- Kennedy MJ, Lee KA, Niemi GA, Craven KB, Garwin GG, Saari JC, Hurley JB. Multiple phosphorylation of rhodopsin and the in vivo chemistry underlying rod photoreceptor dark adaptation. Neuron. 2001;31:87–101. doi: 10.1016/s0896-6273(01)00340-3. [DOI] [PubMed] [Google Scholar]
- Kraft TW, Schneeweis DM, Schnapf JL. Visual transduction in human rod photoreceptors. Journal of Physiology. 1993;464:747–765. doi: 10.1113/jphysiol.1993.sp019661. [DOI] [PMC free article] [PubMed] [Google Scholar]
- Kueng-hitz N, Grimm C, Lansel N, Hafezi F, He L, Fox DA, Remé CE, Niemeyer G, Wenzel A. The retina of c-fos−/- mice: electrophysiologic, morphologic and biochemical aspects. Investigative Ophthalmology and Visual Science. 2000;41:909–916. [PubMed] [Google Scholar]
- Lamb TD, Pugh EN., Jr A quantitative account of the activation steps involved in phototransduction in amphibian photoreceptors. Journal of Physiology. 1992;449:719–758. doi: 10.1113/jphysiol.1992.sp019111. [DOI] [PMC free article] [PubMed] [Google Scholar]
- Leibrock CS, Reuter T, Lamb TD. Dark adaptation of toad rod photoreceptors following small bleaches. Vision Research. 1994;34:2787–2800. doi: 10.1016/0042-6989(94)90048-5. [DOI] [PubMed] [Google Scholar]
- Leibrock CS, Reuter T, Lamb TD. Molecular basis of dark adaptation in rod photoreceptors. Eye. 1998;12:511–520. doi: 10.1038/eye.1998.139. [DOI] [PubMed] [Google Scholar]
- Lyubarsky AL, Falsini B, Pennesi ME, Valentini P, Pugh EN., Jr UV- and midwave-sensitive cone-driven retinal responses of the mouse: a possible phenotype for coexpression of cone photopigments. Journal of Neuroscience. 1999;19:442–455. doi: 10.1523/JNEUROSCI.19-01-00442.1999. [DOI] [PMC free article] [PubMed] [Google Scholar]
- Lyubarsky AL, Pugh EN., Jr Recovery phase of the murine rod photoresponse reconstructed from electroretinographic recordings. Journal of Neuroscience. 1996;16:563–571. doi: 10.1523/JNEUROSCI.16-02-00563.1996. [DOI] [PMC free article] [PubMed] [Google Scholar]
- McBee JK, Palczewski K, Baehr W, Pepperberg DR. Confronting complexity: the interlink of phototransduction and retinoid metabolism in the vertebrate retina. Progress in Retinal and Eye Research. 2001;20:469–529. doi: 10.1016/s1350-9462(01)00002-7. [DOI] [PubMed] [Google Scholar]
- Matthews HR. Incorporation of chelator into guinea-pig rods shows that calcium mediates mammalian photoreceptor light adaptation. Journal of Physiology. 1991;436:93–105. doi: 10.1113/jphysiol.1991.sp018541. [DOI] [PMC free article] [PubMed] [Google Scholar]
- Melia TJ, Jr, Cowan CW, Angleson JK, Wensel TG. A comparison of the efficiency of G protein activation by ligand-free and light-activated forms of rhodopsin. Biophysical Journal. 1997;73:3182–3191. doi: 10.1016/S0006-3495(97)78344-9. [DOI] [PMC free article] [PubMed] [Google Scholar]
- Nakatani K, Tamura T, Yau K-W. Light adaptation in retinal rods of the rabbit and two other nonprimate mammals. Journal of General Physiology. 1991;97:413–435. doi: 10.1085/jgp.97.3.413. [DOI] [PMC free article] [PubMed] [Google Scholar]
- Norton AW, D'Amours MR, Grazio HJ, Hebert TL, Cote RH. Mechanism of transducin activation of frog rod photoreceptor phosphodiesterase. Allosteric interactions between the inhibitory gamma subunit and the noncatalytic cGMP-binding sites. Journal of Biological Chemistry. 2000;275:38611–38619. doi: 10.1074/jbc.M004606200. [DOI] [PubMed] [Google Scholar]
- Nusinowitz S, Azimi A, Heckenlively JR. Adaptation, body temperature, pupil size, and anesthetic effects on the electroretinogram (ERG) in mice. Investigative Ophthalmology and Visual Science. 2000;41:S495. abstract. [Google Scholar]
- Pepperberg DR. Rhodopsin and visual adaptation: analysis of photoreceptor thresholds in the isolated skate retina. Vision Research. 1984;24:357–366. doi: 10.1016/0042-6989(84)90061-0. [DOI] [PubMed] [Google Scholar]
- Pepperberg DR, Birch DG, Hofmann KP, Hood DC. Recovery kinetics of human rod phototransduction inferred from the two-branched a-wave saturation function. Journal of the Optical Society of America A. 1996;13:586–600. doi: 10.1364/josaa.13.000586. [DOI] [PubMed] [Google Scholar]
- Pepperberg DR, Birch DG, Hood DC. Photoresponses of human rods in vivo derived from paired-flash electroretinograms. Visual Neuroscience. 1997;14:73–82. doi: 10.1017/s0952523800008774. [DOI] [PubMed] [Google Scholar]
- Pepperberg DR, Brown PK, Lurie M, Dowling JE. Visual pigment and photoreceptor sensitivity in the isolated skate retina. Journal of General Physiology. 1978;71:369–396. doi: 10.1085/jgp.71.4.369. [DOI] [PMC free article] [PubMed] [Google Scholar]
- Pugh EN, Jr, Lamb TD. Phototransduction in vertebrate rods and cones: molecular mechanisms of amplification, recovery and light adaptation. In: Stavenga DG, DeGrip WJ, Pugh EN Jr, editors. Handbook of Biological Physics. Vol. 3. Amsterdam: Elsevier Science; 2000. pp. 183–255. [Google Scholar]
- Qtaishat NM, Okajima T-I L, Li S, Naash MI, Pepperberg DR. Retinoid kinetics in eye tissues of VPP transgenic mice and their normal littermates. Investigative Ophthalmology and Visual Science. 1999;40:1040–1049. [PubMed] [Google Scholar]
- Robson JG, Frishman LJ. Dissecting the dark-adapted electroretinogram. Documenta Ophthalmologica. 1999;95:187–215. doi: 10.1023/a:1001891904176. [DOI] [PubMed] [Google Scholar]
- Rushton WAH. Bleached rhodopsin and visual adaptation. Journal of Physiology. 1965;181:645–655. doi: 10.1113/jphysiol.1965.sp007789. [DOI] [PMC free article] [PubMed] [Google Scholar]
- Saari JC. Biochemistry of visual pigment regeneration. The Friedenwald Lecture. Investigative Ophthalmology and Visual Science. 2000;41:337–348. [PubMed] [Google Scholar]
- Sachs K, Maretzki D, Meyer CK, Hofmann KP. Diffusible ligand all-trans-retinal activates opsin via a palmitoylation-dependent mechanism. Journal of Biological Chemistry. 2000;275:6189–6194. doi: 10.1074/jbc.275.9.6189. [DOI] [PubMed] [Google Scholar]
- Sampath AP, Matthews HR, Cornwall MC, Fain GL. Bleached pigment produces a maintained decrease in outer segment Ca2+ in salamander rods. Journal of General Physiology. 1998;111:53–64. doi: 10.1085/jgp.111.1.53. [DOI] [PMC free article] [PubMed] [Google Scholar]
- Schneeweis DM, Schnapf JL. Noise and light adaptation in rods of the macaque monkey. Visual Neuroscience. 2000;17:659–666. doi: 10.1017/s0952523800175017. [DOI] [PubMed] [Google Scholar]
- Silva GA, Hetling JR, Pepperberg DR. Dynamic and steady-state light adaptation of mouse rod photoreceptors in vivo. Journal of Physiology. 2001;534:203–216. doi: 10.1111/j.1469-7793.2001.00203.x. [DOI] [PMC free article] [PubMed] [Google Scholar]
- Smith NP, Lamb TD. The a-wave of the human electroretinogram recorded with a minimally invasive technique. Vision Research. 1997;37:2943–2952. doi: 10.1016/s0042-6989(97)00094-1. [DOI] [PubMed] [Google Scholar]
- Sokolov M, Strissel KJ, Govardovskii VI, Arshavsky VY. Massive light-dependent movement of transducin from the outer segments of vertebrate rods. Investigative Ophthalmology and Visual Science. 2001;42:S186. abstract. [Google Scholar]
- Stevens J. Applied Multivariate Statistics for the Social Sciences. 3. Mahwah, New Jersey: Lawrence Erlbaum Associates; 1996. pp. 6–9. [Google Scholar]
- Stiles WS, Crawford BH. Report of a Joint Discussion on Vision. London: The Physiological Society; 1932. Equivalent adaptation levels in localized retinal areas; pp. 194–211. [Google Scholar]
- Surya A, Foster RW, Knox BE. Transducin activation by the bovine opsin apoprotein. Journal of Biological Chemistry. 1995;270:5024–5031. doi: 10.1074/jbc.270.10.5024. [DOI] [PubMed] [Google Scholar]
- Thomas MM, Lamb TD. Light adaptation and dark adaptation of human rod photoreceptors measured from the a-wave of the electroretinogram. Journal of Physiology. 1999;518:479–496. doi: 10.1111/j.1469-7793.1999.0479p.x. [DOI] [PMC free article] [PubMed] [Google Scholar]
- Weng J, Mata NL, Azarian SM, Tzekov RT, Birch DG, Travis GH. Insights into the function of rim protein in photoreceptors and etiology of Stargardt's disease from the phenotype in abcr knockout mice. Cell. 1999;98:13–23. doi: 10.1016/S0092-8674(00)80602-9. [DOI] [PubMed] [Google Scholar]
- Xu J, Dodd RL, Makino CL, Simon MI, Baylor DA, Chen J. Prolonged photoresponses in transgenic mouse rods lacking arrestin. Nature. 1997;389:505–509. doi: 10.1038/39068. [DOI] [PubMed] [Google Scholar]