

Abstract
Phorbol esters are hypothesised to produce a protein kinase C (PKC)-dependent increase in the probability of transmitter release via two mechanisms: facilitation of vesicle fusion or increases in synaptic vesicle number and replenishment. We used a combination of electrophysiology and computer simulation to distinguish these possibilities. We constructed a stochastic model of the presynaptic contacts between a pair of hippocampal pyramidal cells that used biologically realistic processes and was constrained by electrophysiological data. The model reproduced faithfully several forms of short-term synaptic plasticity, including short-term synaptic depression (STD), and allowed us to manipulate several experimentally inaccessible processes. Simulation of an increase in the size of the readily releasable vesicle pool and the time of vesicle replenishment decreased STD, whereas simulation of a facilitation of vesicle fusion downstream of Ca2+ influx enhanced STD. Because activation of protein kinase C with phorbol ester enhanced STD of EPSCs in rat hippocampal slice cultures, we conclude that an increase in the sensitivity of the release process for Ca2+ underlies the potentiation of neurotransmitter release by PKC.
The regulation of neurotransmitter release at mammalian central synapses is determined by a dynamic interaction between many complex processes within the presynaptic nerve terminal. Activation and inactivation of voltage-dependent Ca2+ channels, fusion of readily releasable vesicles at active zones in the plasma membrane, handling of cytoplasmic Ca2+, replacement of exocytosed vesicles, and docking and priming of replaced vesicles all influence transmitter release (Südhof, 1995). Understanding these processes is essential for insight into how presynaptic terminals are able to release neurotransmitter and activate postsynaptic receptors during periods of elevated activity.
Protein phosphorylation is an essential regulator of cell function. Presynaptic nerve terminals contain numerous protein kinases whose activation leads to a facilitation of evoked and spontaneous neurotransmitter release. The mechanisms by which these kinases facilitate release remain controversial. Presynaptic substrates of protein kinases include voltage-dependent Ca2+ channels (Herlitze et al. 2001), proteins involved in the synaptic vesicle cycle (e.g. Fujita et al. 1996), and proteins that form the vesicle exocytosis machinery (e.g. Shimazaki et al. 1996). The functional roles played by these proteins have led to hypotheses that their phosphorylation potentiates neurotransmitter release by facilitating presynaptic Ca2+ influx, synaptic vesicle trafficking, and/or vesicle fusion with the plasma membrane.
One presynaptic protein kinase whose mechanism of action has been studied intensively is protein kinase C (PKC). Application of phorbol ester activators of PKC elevates release probability at hippocampal excitatory synapses (Malenka et al. 1986; Yamamoto et al. 1987). Parfitt & Madison (1993) found that the phorbol ester-induced increase in glutamatergic excitation is reduced by the non-specific Ca2+ channel blocker Cd2+, suggesting that phorbol esters potentiate release, in part, by promoting voltage-dependent Ca2+ influx. More recently, however, fluorometric imaging of presynaptic Ca2+ influx and direct recording of presynaptic Ca2+ currents at the calyx of Held have indicated that PKC activation by phorbol esters can potentiate release in the absence of changes in Ca2+ influx (Hori et al. 1999; Yawo, 1999; Wu & Wu, 2001).
Perhaps the most direct evidence for the mechanism of PKC action on transmitter release comes from chromaffin cells, where phorbol esters produce a PKC-dependent facilitation of vesicle trafficking (Vitale et al. 1995; Gillis et al. 1996). In nerve terminals, morphological and physiological studies have revealed multiple populations of presynaptic vesicles (Heuser et al. 1979; Schikorski & Stevens, 1997). One small population of vesicles, known as the readily releasable pool (RRP), is closely apposed to the presynaptic membrane and is believed to constitute those vesicles that are docked and primed for release in response to Ca2+ influx. Most presynaptic vesicles are located some distance from the active zone and constitute the so-called reserve pool. At autapses in hippocampal cell cultures, Stevens & Sullivan (1998) found that activation of PKC by phorbol esters increased the number of vesicles in the RRP and also increased the rate at which the RRP became refilled by reserve pool vesicles after its depletion. An increased number of available vesicles in the RRP should increase release probability and might thereby account for the facilitation of evoked and spontaneous release by PKC.
In contrast, phorbol esters have no effect on the maximally evoked increase in nerve terminal capacitance or recovery from vesicle depletion at the calyx of Held (Wu & Wu, 2001), suggesting that PKC does not affect vesicle dynamics at this synapse. Instead, the observation that phorbol esters enhance the Ca2+-independent release of transmitter elicited with hyperosmotic saline suggests a facilitatory action of PKC on vesicle release ‘downstream’ of the Ca2+ sensor for exocytosis (Wu & Wu, 2001). Hence PKC activation enhances evoked transmitter release at the calyx of Held not by increasing the number of RRP vesicles, but by increasing the probability of release of RRP vesicles. The ability of phorbol esters to elicit a PKC-dependent increase in the frequency of TTX- and Cd2+-insensitive miniature synaptic currents in hippocampus (Capogna et al. 1999) suggests that this process may also occur at other CNS terminals.
In an attempt to resolve these apparently conflicting results, i.e. PKC-mediated changes in vesicle dynamics vs. direct facilitation of exocytosis, we have studied the actions of phorbol ester on short-term synaptic depression (STD). Studies of hippocampal synapses suggest that the size of the RRP decreases progressively during STD (Dobrunz & Stevens, 1997). The replenishment of released vesicles is thus likely to be the rate-limiting step for maintaining synaptic transmission during prolonged high frequency activity (e.g. Markram & Tsodyks, 1996; Yawo, 1999). We reasoned that the two hypothesised actions of PKC should affect STD differentially: an increase in RRP size and faster replenishment should attenuate STD, whereas facilitation of exocytosis should increase depletion of the RRP and enhance STD.
The small size and inaccessibility of most CNS nerve terminals does not allow the size of the RRP, the RRP replenishment rate, or the release probability of a given vesicle to be measured directly or manipulated in a controlled fashion. Therefore, we employed a combined electrophysiological and computer modelling-based approach in order to generate testable experimental predictions of these apparently conflicting hypotheses.
Using electrophysiological data and published observations as constraints, we constructed a biologically realistic model of the presynaptic release sites between a single hippocampal CA3 cell and a postsynaptic CA1 cell. Because short-term plasticity is dependent, in part, upon the number of vesicles released from individual nerve terminals (Debanne et al. 1996; Dobrunz & Stevens, 1997; Tsodyks & Markram, 1997; Hagler & Goda, 2001), and because the release of neurotransmitter from hippocampal nerve terminals is highly stochastic (Debanne et al. 1996; Stricker et al. 1996), we built a model that reproduced the random trial-to-trial variations in transmitter release described previously. The model faithfully replicated STD and other forms of short-term synaptic plasticity. The predicted effects of the two hypothesised PKC actions on STD were then compared with the actions of phorbol esters at Schaffer collateral-CA1 cell synapses in rat hippocampal slice cultures.
Simulation of an increase in RRP size and faster RRP replenishment decreased simulated STD, whereas simulation of a direct increase in the probability of vesicle fusion, in contrast, enhanced STD. Because phorbol esters enhanced STD in rat hippocampal slice cultures, we suggest that PKC enhances glutamate release at Schaffer collateral nerve terminals by facilitation of exocytosis.
METHODS
Electrophysiology of hippocampal slice cultures
Experiments were performed on organotypic hippocampal slice cultures (Gähwiler et al. 1998). Hippocampi were dissected from 5- to 6-day-old, CO2-anaesthetised rat pups and cut into 400 μm transverse slices using a protocol approved by the University of Maryland School of Medicine. Slices were plated onto glass coverslips in a drop of chicken plasma, which was then coagulated with thrombin. The coverslips were placed into culture tubes with serum-containing media, and incubated in a roller-drum at 36 °C. Slice cultures were incubated for 14 days to allow for synaptic maturation.
Excitatory postsynaptic currents (EPSCs) were recorded from CA1 pyramidal cells in response to stimulation of Schaffer collateral inputs from area CA3. Cultures were perfused with control extracellular saline containing (mm): 137 NaCl, 2.8 KCl, 2.5 CaCl2, 2.5 MgCl2, 11.6 NaCO3, 0.4 NaH2PO4 and 5.6 glucose at approximately 1 ml min−1 at room temperature. Extracellular stimuli (-10 to −100 μA for 25-100 μs) were delivered in stratum radiatum at the border between area CA3 and CA1 using a 2 MΩ patch pipette filled with extracellular saline. Postsynaptic responses were recorded using whole-cell recording techniques with an Axopatch 200B amplifier (Axon Instruments), low-pass filtered at 2 kHz, and digitised at 10 kHz. Patch pipettes (5-7 MΩ) were filled with (mm): 140 KF, 10 KCl, 0.4 Hepes, 2 MgCl2 and 1.1 EGTA; pH 7.2. Whole-cell recordings during which the access resistance exceeded 30 MΩ were discarded. Fluoride ions were included in the pipette solution to block GABAergic inhibitory currents in the recorded cell (Smirnov et al. 1999). The omission of ATP had no adverse effects on the stability of EPSC slope during the course of an experiment. AMPA receptor-mediated excitatory responses were isolated in all experiments by blocking NMDA receptors with 40 μM dl-2-amino-5-phosphono-pentanoic acid (AP5).
STD in each cell was calculated from the average of four trials, each consisting of a 15 s period of tetanic stimulation. The initial slope of the mean EPSC was then measured over 1-2 ms at a fixed latency from the stimulus, in order to minimise contributions from polysynaptic responses. Data were normalised to the first response, and are expressed as means ± s.e.m. Recovery from STD was determined from four trials in which stimuli were delivered at 0.25 Hz after the tetanus, in order to minimise the maintenance of depression by the recovery stimuli. The delay between the end of the tetanus and the first recovery stimulus increased by 1 s for each trial (see Fig. 2A, inset). For the recovery experiments, data in each trial were normalised to the first response in the corresponding tetanus.
Figure 2. Recovery from STD.

A, STD and recovery of EPSC slope after 1 Hz ( , n = 4), 3 Hz (○, n = 5) and 10 Hz (•, n = 12) stimulation for 15 s. Lines show the exponential fits to 3 Hz (dashed) and 10 Hz (continuous) recovery data points. Inset: stimulation protocol for assessing recovery from STD. After tetanic stimulation, stimuli were delivered at 0.25 Hz, with the first stimulus offset by 1 s over 4 trials. B, recovery from STD (10 Hz, 15 s) before and after application of the A1 antagonist DPCPX. Lines show the exponential fits to vehicle (continuous) and DPCPX (dashed) data points. C, simulations of tetanic stimulation using a mechanism in which vesicle replenishment required 1 s, but was capacity limited (see text). Depression and recovery in response to 1 Hz (•) and 10 Hz (○) stimulation was consistent with EPSC data. The continuous line indicates exponential fit of recovery data. D, time constants of exponentials for recovery from simulated release (hatched bars) and EPSCs (open bars) induced with 3 and 10 Hz stimulation. *P < 0.01 vs. 10 Hz stimulation. Recovery of both EPSCs and simulated release is faster after 3 Hz stimulation than after 10 Hz stimulation.
Unitary EPSCs were identified as monosynaptic, digitised and analysed as described previously (Debanne et al. 1996). Briefly, single presynaptic CA3 cells were impaled with sharp microelectrodes containing 1 m KMeSO4 and action potentials were elicited with 1 nA, 10 ms depolarising current pulses via an active bridge circuit. EPSCs were recorded under whole-cell voltage clamp (-70 mV) with pipettes containing the same intracellular solution as above, but with 140 mm potassium gluconate rather than KF. 1,3-Dipropyl-8-cyclopenylxanthine (DPCPX; Tocris Cookson, Ballwin, MO, USA) was prepared in 100 % ethanol and used at 1:1000 dilution. Aqueous stocks of phorbol 12,13 diacetate (PDAc; Sigma, St Louis, MO, USA) were diluted 1:100 in extracellular saline.
Data analysis
Exponentials were fitted from maximum using Origin software (Microcal Software Inc., Northampton, MA, USA). Exponential fits were compared by analysing the correlation coefficients. Time constants of exponential fits were compared using a normal asymptotic test (Z-test), and steady-state levels of depression were compared using Student's paired and unpaired t tests, as appropriate. Data sets were considered not significantly different if P > 0.05. Analysis of variance of responses during the last 5 s of stimulation was not significant, indicating that responses had reached a steady-state level. The steady-state level of depression was defined as the mean of the last 5 s of stimulation, except for 20 Hz, which was 2.5 s. Responses from six trials, during which a pair of stimuli were delivered 70 ms apart after the tetanus, were averaged and the paired-pulse ratio was calculated as mean of the second response divided by the mean of the first. The inverse of the square of the coefficient of variation (CV−2) was calculated as the square of the mean response during the last 5 s of stimulation, divided by the variance. All values from simulations are mean responses (± s.e.m.) of 100 iterations of the model. Data were grouped into ten consecutive 10-run trial blocks.
Construction of the model
The model was constructed using the stock-and-flow program STELLA (High Performance Systems, Hanover, NH, USA) and was adapted from a stochastic model used to study homosynaptic depression of Aplysia sensory synapses (Gover et al. 2002). We simulated the connection formed by a single presynaptic CA3 pyramidal cell with a single CA1 cell using published experimental observations. The simulated connection consisted of five presynaptic terminals, each with ten readily releasable vesicles and 100 reserve pool vesicles, consistent with morphological studies of hippocampal nerve terminals (Schikorski & Stevens, 1997). The effects of varying the initial RRP size will be described below. The reserve pool was sufficiently large so that there was no appreciable depletion of the reserve pool of vesicles during simulations. For this reason, we did not model vesicle endocytosis.
One Ca2+ channel was associated with each readily releasable vesicle (Koester & Sakmann, 2001). In response to a presynaptic action potential, all Ca2+ channels may not open. In the model, the open probability (Popen) of each Ca2+ channel was independently selected for every stimulus from a normal distribution (mean ± s.d. = 0.95 ± 0.05) (e.g. Lee & Elmslie, 1999). At the time of stimulation, a randomly generated number between 0 and 1 was compared with the Ca2+ channel open probability. If the random number was less than Popen, the Ca2+ channel was considered to have opened. The Ca2+ concentration in the ‘microdomain’ at the mouth of the Ca2+ channel was then raised ([Ca2+]influx). The amount of influx was selected independently for each channel from a normal distribution having a preset mean and a s.d. of 10 % of the mean.
The Ca2+ in the microdomain decayed away exponentially with a time constant (τ) of 1 ms (Simon & Llinas, 1985; Roberts, 1994). The decay of Ca2+ from the microdomain resulted in an elevation in the local cytoplasmic compartment ([Ca2+]residual) equal to 10 % of the peak Ca2+ concentration. [Ca2+]residual then decayed away exponentially with a τ = 40 ms, consistent with published values for mammalian central synapses (Chen & Regehr, 1999; Emptage et al. 2001; Koester & Sakmann, 2001).
The total available Ca2+ (influx plus residual) could then bind to the Ca2+ sensor for exocytosis, which had four binding sites. Assuming the binding and unbinding of Ca2+ to the Ca2+ sensor occurs in < 1 ms (Heidelberger et al. 1994), we calculated the probability of release every millisecond for each vesicle (Pves) with eqn (1):
| (1) |
where KD is the inverse of the affinity of all four binding sites of the Ca2+ sensor. Pves thus depends on the ratio of KD to the total Ca2+ concentration. Because the actual affinity of the sensor for Ca2+ and the concentration of Ca2+ in a channel microdomain are unknown, we express Ca2+ influx as a percentage of KD.
The probability that a vesicle will be released from a given terminal (Pterm) was first calculated using eqn (2):
| (2) |
where 1 – Pvesn is the probability that the n th vesicle in the RRP of that terminal fails to be released. Release occurs from that terminal when Pterm exceeded a randomly generated number between 0 and 1; a comparison was made every millisecond. Only one vesicle could be released per stimulus (Korn et al. 1994). There was a 5 ms refractory period immediately after a release event from a given terminal (Stevens & Wang, 1995), but asynchronous release could occur at later times if the release probability remained elevated. The output of the model was the total number of vesicles released from all five terminals per stimulus, corresponding to the quantal content of the unitary EPSC.
Increasing Ca2+ influx between 25 and 75 % of the KD of the Ca2+ sensor increased quantal content. The relationship between Ca2+ influx and quantal content was well described by a power relationship with a slope of 2.9 (Fig. 1A), consistent with observations of hippocampal synapses (Wu & Saggau, 1994; Capogna et al. 1997).
Figure 1. Calcium dependence of release and paired-pulse behaviour of simulated Schaffer collateral synapses, constructed as described in the text.

A, simulated quantal content as a function of the Ca2+ influx into the Ca2+ channel/synaptic vesicle microdomain. The data are well fitted by a power function (y è ∝ x2.9, continuous line). B, paired-pulse ratio as a function of interstimulus interval (ISI) with low Ca2+ conditions for the model (○) and for the data on unitary EPSCs reported by Debanne et al. (1996) (•). The effects of concomitant paired-pulse depression were minimised by calculating the paired-pulse ratio as the mean of all EPSC2s following a failure of release, divided by the mean of all EPSC1s (see Debanne et al. 1996). C, paired-pulse ratio as function of ISI with high Ca2+ conditions for the model (○) and for unitary EPSCs (Debanne et al. 1996) (•). The effects of concomitant paired-pulse facilitation were minimised by calculating the paired pulse ratio as the mean of all EPSC2s following the largest 10 % of all EPSC1s (see Debanne et al. 1996). D, mean quantal content of EPSC2 as a function of the quantal content of EPSC1 for a simulation of paired-pulse behaviour under control conditions (ISI = 75 ms). The data are well fitted by linear regression.
Simulation of paired-pulse facilitation
The magnitude of paired-pulse facilitation (PPF) or depression (PPD) is a function of the interstimulus interval (ISI) and the initial release probability. Under control conditions, either PPF or PPD may occur at Schaffer collateral-CA1 cell synapses, depending on the stochastic behaviour of terminals in response to the first stimulus (Debanne et al. 1996). That is, the quantal content of the second response to a pair of stimuli is inversely dependent on the quantal content of the first response.
Katz & Miledi (1968) originally suggested that residual free Ca2+ accounts for PPF by summing with the Ca2+ influx triggered by the second stimulus to give an increased probability of release relative to the first stimulus. Imaging of presynaptic Ca2+ transients has revealed, however, that PPF outlasts residual Ca2+ (Atluri & Regehr, 1996). Therefore, it is likely that PPF involves binding of the Ca2+ from the first stimulus to some high affinity receptor ‘X’ that facilitates the release triggered by Ca2+ influx during the second stimulus (Katz & Miledi, 1968; Zucker, 1993). The identity of the putative Ca2+ sensor for PPF, X, is unknown, as is the mechanism by which X facilitates release.
We assumed that Ca2+ influx was identical for the first and second stimuli, that facilitation is triggered maximally by all Ca2+ influxes modelled, and that there was no release of Ca2+ from intracellular stores (Wu & Saggau, 1994; Chen & Regehr, 1999; Koester & Sakmann, 2001; but see Emptage et al. 2001). We modelled facilitation arbitrarily as a transient Ca2+-dependent increase in affinity of the Ca2+ sensor for exocytosis that occurs with a delay of 1 ms after opening of Ca2+ channels. If a given Ca2+ channel opened, then the affinity of the Ca2+ sensor for exocytosis at that microdomain increased and recovered exponentially with a time constant of 167 ms, corresponding to the time constant of recovery of PPF (Debanne et al. 1996). The increased affinity of the sensor for Ca2+ raised Pves and thus facilitated release in response to the Ca2+ influx resulting from the second stimulus.
The magnitude of the increase in affinity of the Ca2+ sensor for exocytosis following Ca2+ influx was determined using paired-pulse data from monosynaptically coupled CA3-CA1 cell pairs in hippocampal slice cultures (Debanne et al. 1996). These authors found that the paired-pulse ratio (PPR) was 2.2 for ISI = 75 ms under low release probability conditions characterised by the failure of stimuli to release neurotransmitter in 20 % of trials. We therefore selected a Ca2+ influx that produced a failure of release from all five terminals in 20 % of trials (= 26 % of the KD of the Ca2+ sensor, ‘low Ca2+’), and modelled release in response to two stimuli separated by 75 ms. In order to produce a PPR of 2.2 for ISI = 75 ms, the affinity of the Ca2+ sensor had to increase by 45 %.
Simulation of paired-pulse depression
Paired-pulse depression of transmission at Schaffer collateral-CA1 cell synapses is observed when the release probability is high (Creager et al. 1980; Debanne et al. 1996). The classical explanation for PPD is a depletion of presynaptic vesicles (Theis, 1965; Betz, 1970). We therefore asked whether this mechanism could account for the PPD of unitary EPSCs seen under conditions of high release probability in hippocampal slice cultures (Debanne et al. 1996). These authors found that the PPR was 0.5 for ISI = 75 ms when release probability was increased such that the unitary EPSC amplitude was four times greater than that seen under the low release probability conditions described above. However, when we selected a Ca2+ influx (= 78 % of the KD of the Ca2+ sensor, ‘high Ca2+’) that produced a mean 4-fold increase in the number of vesicles released, compared with the release triggered by ‘low Ca2+’ (1.2 ± 0.1 vs. 4.7 ± 0.05 vesicles per stimulus), we observed no PPD (PPR = 1.05; ISI = 75 ms).
These observations support previous inferences that some process(es) other than the depletion of vesicles must underlie PPD at Schaffer collateral synapses. It appears instead that PPD results from a transient reduction in the probability that remaining RRP vesicles can undergo exocytosis after one vesicle has been released from a given terminal (Debanne et al. 1996; Dobrunz et al. 1997; Dittman et al. 2000). The mechanism underlying this decrease in probability is unknown.
Paired-pulse depression was modelled as transient, release-dependent decrease in the probability that any of the vesicles remaining in the RRP of a given terminal can undergo Ca2+-dependent exocytosis. In order to model this decrease, we created a ‘hindrance’ function, h:
| (3) |
where t is the time after the preceding exocytotic event, τh is the time constant of recovery of hindrance, and hmax is the maximum hindrance reached immediately after a vesicle has fused. Upon release of a vesicle from a given terminal, h increased from 0 to hmax and recovered exponentially with a time constant of 1 s, corresponding to the time constant of recovery of PPD (Debanne et al. 1996). Because hindrance is a property of individual terminals, the probability of vesicle fusion at a given terminal, Pterm, was redefined as the product of eqn (2) and (1 – h):
| (4) |
We determined that a hmax value of 0.5 was necessary to produce the experimentally observed PPR of 0.5 for ISI = 75 ms under the conditions of high release probability defined above (Debanne et al. 1996).
With these functions included, the magnitude of simulated PPF under low release probability conditions and simulated PPD under high release probability conditions matched published values of PPF and PPD of unitary EPSCs over a range of ISIs (Fig. 1B and C). The model also displayed the expected negative correlation between the number of vesicles released by the first and second stimuli (Fig. 1D), consistent with data for unitary EPSCs (Thompson et al. 1998).
Presynaptic inhibition
Tetanic stimulation causes activation of presynaptic adenosine receptors and affects STD in the hippocampus (D. H. Brager & S. M. Thompson, unpublished observations). In order to model the contribution of presynaptic adenosine receptors to STD, we added a function (Ψ) that produced an exponential decrease in the probability of Ca2+ channel opening, based upon the only available kinetic data on presynaptic inhibition in the hippocampus (Pfrieger et al. 1994):
| (5) |
where Ψmax is the maximum inhibition of calcium channel opening probability (= 0.5), and τΨ is the time constant of the development of inhibition (= 175 ms). Ψ lowered Pves by decreasing the mean Ca2+ channel open probability exponentially from 0.95 to 0.475. At the conclusion of the stimulus train, Ψ recovered according to eqn (6):
| (6) |
where τΨr is the time constant of the recovery from inhibition (= 2.5 s), and tpt is time post-tetanus. Because application of an A1 antagonist affects STD elicited with 10 Hz, but not 3 Hz, stimulation (D. H. Brager & S. M. Thompson, unpublished observations), Ψ was only activated for frequencies > 10 Hz.
A downloadable version of the model is available at:
RESULTS
Replenishment of the RRP
The time required for vesicles to translocate from the reserve pool to the RRP, dock at active zones, and become primed for release, as well as any fast recycling of recently released vesicles (Pyle et al. 2000), must be accounted for in order to model STD. STD is likely to be determined to a large extent by depletion of vesicles in the RRP (Dobrunz & Stevens, 1997; Hagler & Goda, 2001). Recovery from STD must therefore depend, in part, upon the replenishment of the RRP (Wu & Borst, 1999). We therefore determined the rates of recovery of EPSCs in rat hippocampal slice cultures electrophysiologically. The rate of recovery following 3 Hz stimulation for 15 s was significantly faster than after 10 Hz stimulation (τ 3 Hz = 1.0 ± 0.7 s vs. τ 10 Hz = 4.1 ± 1.0 s; n = 5 and 12; P < 0.01)(Fig. 2A and D).
Why did transmission recover faster after 3 Hz than 10 Hz stimulation? Three hypotheses were considered. First, increases in intraterminal Ca2+ accelerate recovery. Second, there is a slow recovery from the activation of presynaptic inhibitory adenosine receptors after 10 Hz stimulation. Third, the recovery rate is inversely proportional to the depletion of the RRP.
Recovery of transmission at several CNS synapses is faster following STD elicited with higher stimulation frequencies, and this acceleration is blocked by Ca2+ chelators, suggesting that there is a Ca2+-dependent acceleration of the RRP replenishment rate (Dittman & Regehr, 1998; Stevens & Wesseling, 1998; Wang & Kaczmarek, 1998). However, if Ca2+ were to accelerate replenishment, then recovery after 10 Hz stimulation should be the same or faster than after 3 Hz stimulation. Since we observed that recovery was slower after 10 Hz than after 3 Hz stimulation, we suggest that this Ca2+-dependent acceleration of vesicle replenishment does not occur under our conditions.
Stimulation at 10 Hz, but not 3 Hz, causes activation of presynaptic inhibitory adenosine A1 receptors. If recovery from presynaptic inhibition is slower than RRP replenishment, then the slower recovery from 10 Hz STD could be due to adenosine receptor activation. Recovery from STD induced with 10 Hz stimulation was not significantly different in presence of the A1 antagonist DPCPX (330 nm) compared with vehicle-treated controls (τ vehicle = 2.9 ± 1.0 s; τ DPCPX = 2.3 ± 0.6 s; n = 6) (Fig. 2B).
Stimulation at 10 Hz produces a lower steady-state level of STD than stimulation at 3 Hz (19 vs. 51 %). We have assumed that the steady-state level of transmission is directly proportional to the number of vesicles remaining in the RRP. Since recovery from STD is dependent on replenishment of the RRP, the rate of RRP replenishment appeared to be inversely related to the number of vesicles needing to be replenished.
Three experimental observations were used as constraints on the simulated mechanism of replenishment. STD does not occur during 1 Hz stimulation, recovery from 10 Hz STD proceeds exponentially with a time constant of ∼4 s, and the time constant of recovery from 3 Hz STD must be about half of the 10 Hz STD recovery time constant (Fig. 2A and D). We have assumed that replenishment begins when a vesicle has been released and that vesicles are not release competent until replenishment is complete. The total time required for a vesicle to translocate, dock, prime, and become release competent was set to 1 s, so that that there was no depression during 1 Hz stimulation.
We constructed a capacity-limited vesicle replenishment process that satisfied the experimental constraints. Such behaviour might occur, for example, if there were a rate-limiting supply of the molecules required to translocate, dock, or prime vesicles. Vesicle replenishment initially required 1 s, but increased proportionally as the number of vesicles in the RRP decreased. The total time from release of a vesicle to its replacement by a release competent vesicle (including translocation, docking, and priming) was the product of the replenishment time for a single vesicle (1 s) and the number of vesicles to be replenished. This replenishment mechanism satisfied the three experimental constraints (Fig. 2C and D). This solution may not be a unique way to meet the constraints described above (see Discussion).
STD of EPSCs and simulated release
Unitary EPSCs between monosynaptically coupled pyramidal cell pairs are mediated by small numbers of synapses (Debanne et al. 1996; Markram et al. 1997). The amplitudes of unitary EPSCs in consecutive trials display prominent variations as the result of the stochastic release of transmitter from the small number of terminals. Stochastic variations in transmitter release have been shown to result in qualitative differences in responses to paired-pulse stimulation (Debanne et al. 1996). Similarly, STD of unitary EPSCs displayed substantial trial-to-trial variability in response to 10 Hz stimulus trains (Fig. 3A). In contrast, extracellular stimulation at 10 Hz resulted in a decrease in EPSC amplitude which displayed little trial-to-trial variability (Fig. 3B). Extracellularly evoked EPSCs result from the release of transmitter from large numbers of presynaptic terminals, originating from multiple cells, and reflect the average behaviour of these synapses. Indeed, the average STD of unitary EPSCs (Fig. 3A) qualitatively resembled the STD of extracellularly evoked EPSCs (Fig. 3B).
Figure 3. Short-term synaptic depression.

A, brief depolarising current pulses were used to elicit presynaptic action potentials at 10 Hz in a single CA3 cell (upper trace) and a train of unitary EPSCs in a monosynaptically coupled postsynaptic CA1 cell (lower traces). Note that there was so much stochastic variability in the responses in two single trials in the same cell that a progressive decrease in EPSC amplitude (STD) was apparent only when the responses from 12 trials were averaged (bottom trace). B, STD of extracellularly evoked EPSCs in a CA1 cell elicited with 10 Hz extracellular stimulation of Schaffer collateral axons for 3 s. Unlike the unitary EPSCs in A, STD in the two trials was very similar. C, simulated change in release during 10 Hz stimulation for 3 s during two individual runs of the model. In order to more easily compare the simulated data with the unitary EPSCs in A, quantal postsynaptic responses were simulated with an α function and linear summation of the quanta released by the simulated presynaptic terminals was assumed. As for the unitary EPSCs in A, there was considerable variability in the responses in the two individual trials, but progressive STD was seen when 100 trials were averaged (lower trace). D, STD of extracellularly elicited EPSCs (n = 20 cells) and simulated release (average of 10 blocks of 10 individual trials) in response to 10 Hz stimulation for 15 s. STD in the model occurred with the same time course, and to the same extent, as STD of EPSCs.
For simulations of STD, the Ca2+ influx was set to 54 % of the KD of the Ca2+ sensor for exocytosis so that the mean Pterm was 0.55 and the mean PPR was 1.2, comparable to electrophysiological observations in hippocampus. Individual runs of the model displayed variable decreases in evoked release during 10 Hz stimulation (Fig. 3C), much like the STD of unitary EPSCs (Fig. 3A). When multiple runs of the model cell pair were averaged, 10 Hz stimulation resulted in a decrease in the number of vesicles released per stimulus, and this decrease was indistinguishable from the decrease in EPSC slope observed during 10 Hz extracellular stimulation of Schaffer collateral axons (Fig. 3D). The time course of simulated STD was well described as the sum of two exponentials (τ1 = 0.2 s, τ2 = 2.9 s) and a steady-state level of release was maintained at 17 % of the initial value. These values are quantitatively similar to the observed depression of EPSC slope (τ = 0.3 and 3 s, 19 % steady-state).
Hippocampal synapses differ in the number of vesicles in their RRPs and in their initial release probability (Dobrunz & Stevens, 1997; Schikorski & Stevens, 1997). We examined the consequences of modifying the model so that the RRPs of individual terminals ranged from 6 to 14 vesicles, without changing the mean number of vesicles (10). This manipulation resulted in an increase in the range release probabilities across the five terminals (Pterm = 0.37-0.67), and had no effect on the mean quantal content of responses to single stimuli or the mean PPR, as expected. In addition, there was no change in the time course and steady-state level of STD (data not shown).
Schaffer collateral-CA1 cell synapses display a transient increase in PPR immediately following STD. Simulated connections also displayed a significant increase in PPR after 10 Hz stimulation (Fig. 4A) that was quantitatively comparable to that observed for EPSCs.
Figure 4. Simulated STD results in changes in paired-pulse ratio and CV−2.

A, both EPSCs (open bars) and simulated release (hatched bars) displayed a significant, transient increase in paired-pulse ratio after 10 Hz stimulation for 15 s (ISI = 60 ms). Pre-tetanus PPR for EPSCs was taken from the average of six responses at 0.1 Hz immediately prior to tetanic stimulation, recovery was taken 30 s post-tetanus. *P < 0.05. B, the decrease in CV−2 for both EPSCs (•) and simulated release (○) is correlated with the steady-state level of depression after 10 Hz stimulation for 15 s.
The CV−2 of the last 50 evoked EPSCs during 10 Hz stimulation in hippocampal slice cultures is decreased compared with control EPSCs elicited with low-frequency stimuli, and the amount of decrease was strongly correlated with the steady-state level of depression. The decrease in CV−2 displayed by the simulated connections was quantitatively similar to the decrease observed for EPSCs and was also well correlated with the steady-state level of transmission (Fig. 4B).
Effects of changes in stimulation frequency and release probability
What determines the steady-state level of release? Electrophysiological observations indicated that activation of presynaptic inhibitory receptors does not contribute to the maintained depression of synaptic transmission during 10 Hz stimulation (D. H. Brager & S. M. Thompson, unpublished observations). Consistent with this observation, the steady-state level of simulated STD was also unaffected by eliminating presynaptic inhibition (17 % with Ψ, 16 % without Ψ).
We hypothesised that the steady-state level of release would correspond to the net number of vesicles in the RRP, i.e. the equilibrium between release and replenishment. The steady-state level of STD of EPSCs is sensitive to changes in the frequency of stimulation and the release probability (Fig. 5B). Increasing the frequency of stimulation or probability of release decreases the steady-state level of synaptic responses. We found that the steady-state level of simulated STD displayed a frequency dependence that was essentially indistinguishable from STD of EPSCs (Fig. 5A and B). Similar results were obtained for increases in release probability (not shown). The ability of the model, constrained solely by 10 Hz data in control saline, to replicate quantitatively the frequency and release probability dependence of experimental STD provides evidence that it describes many dynamic aspects of presynaptic function reasonably well.
Figure 5. Frequency dependence of STD and of readily releasable vesicle pool depletion.

A, change in simulated release during 3 Hz (○) and 10 Hz (•) stimulation for 15 s. B, frequency dependence of the steady-state level of EPSCs (•) and simulated release (○) in control release probability conditions. C, frequency dependence of the number of vesicles remaining in the RRP at the steady state of STD. D, correlation between the steady-state EPSC slope for various stimulation frequencies in electrophysiological experiments and the simulated steady-state RRP size in the model for the same stimulation frequencies.
In the model, the number of vesicles remaining in the RRP was strongly dependent on stimulation frequency (Fig. 5C). Because the steady-state level of simulated and experimental STD were so similar at all frequencies tested, we plotted the steady-state level of transmission in electrophysiological experiments as a function of the percentage of vesicles remaining in the RRP in our simulations (Fig. 5D). The excellent correlation supports the hypothesis that the number of vesicles in the RRP available for release largely determines the steady-state level of transmission during high-frequency stimulation.
Effects of changing RRP replenishment time
If the net depletion of the RRP vesicle pool is critical for setting the steady-state level of transmission during high-frequency stimulation, then speeding vesicle replenishment should allow the RRP to reach equilibrium at a higher level. Unfortunately there is no known way to produce such a change experimentally. We therefore used our model to test the effects of manipulating the vesicle replenishment process. The time required for a single vesicle to translocate, dock and prime was decreased from 1 to 0.5 s, without changing the capacity limitation (see above). Decreasing the vesicle replenishment time significantly increased the steady-state level of release (15.8 ± 0.3 vs. 32.7 ± 0.5 %; P < 0.001) after stimulation at 10 Hz for 15 s (Fig. 6A). An examination of the frequency dependence of STD under these conditions revealed that decreasing the total replenishment time increased the steady-state level at frequencies > 3 Hz (Fig. 6B). When the steady-state levels of release were fitted with a Lorentzian function, decreasing the time required for replenishment shifted the frequency that produces 50 % depression from 3.2 ± 0.3 to 7.4 ± 0.4 Hz (Fig. 6B, inset). The increase in the steady-state level of STD produced by decreasing the time of replenishment was accompanied by an increase in the steady-state number of vesicles in the RRP (control steady state = 1.9 vesicles; fast replenishment steady state = 4.6 vesicles). There was, however, no effect on the rate of RRP depletion (τ control = 2.5 s; τ fast replenishment = 2.3 s) (Fig. 6C). We conclude that modifications of RRP replenishment affect the steady-state level of release by decreasing the net depletion of the RRP.
Figure 6. Consequences of decreasing the time required for vesicle replenishment on simulated STD.

A, change in simulated release during 10 Hz stimulation under control conditions (•) and after decreasing the replenishment time by 50 % (○). B, frequency dependence of the steady-state level of release during simulated STD with control (•) and fast (○) replenishment. Inset, fit of control (continuous line) and fast replenishment data (dashed line) with a Lorentzian function. The dotted line indicates frequency that produces 50 % depression. C, mean number of vesicles in RRP during simulated STD with control (•) and fast (○) replenishment. Exponential fits of the data for control (continuous line) and fast replenishment (dotted line) are shown in A (double) and C (single).
Effects of changes in mean RRP size
We first modelled the effects of varying the mean RRP size on STD, without changing the capacity limitation of the replenishment process. Increasing the initial RRP in all terminals from 10 to 15 vesicles in the model increased the quantal content of single responses by 28 %, and decreased the PPR from 1.14 to 0.82 because Pterm was increased even though Pves was the same. Increasing RRP size did not significantly affect the steady-state level of release at any frequency (Fig. 7A and B). When the steady-state levels of release were fitted with a Lorentzian function, increasing the RRP size had no effect on the frequency that produces 50 % depression (Fig. 7B, inset). Increasing the RRP did not affect the rate of the net decline in the number of vesicles in the RRP (τ RRP 10 = 2.5 s; τ RRP 15 = 2.6 s) or the ultimate level of RRP depletion (RRP 10 steady state = 1.9 vesicles; RRP 15 steady state = 2.0 vesicles) (Fig. 7C). We conclude that modifications of initial RRP size modestly increase the starting release probability, but do not affect STD.
Figure 7. Consequences of increasing the initial RRP size on simulated STD.
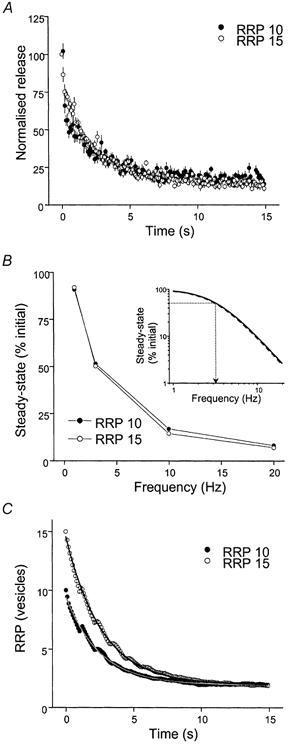
A, change in release during 10 Hz simulation for control terminals (10 vesicles in the RRP, •) and terminals in which the initial RRP size was increased to 15 vesicles (○). Control steady state = 13.4 ± 0.4 %; RRP15 steady state = 12.6 ± 0.6 %. B, frequency dependence of the steady-state level of release during simulated STD with 10 (•) and 15 (○) vesicles in the RRP. Inset, fit of control (continuous line) and RRP 15 data (dashed line) with a Lorentzian function. The dotted line indicates the frequency resulting in 50 % depression. C, mean number of vesicles in RRP during simulated STD with 10 (•) and 15 (○) vesicles in RRP. Exponential fits of the data for 10 (continuous line) and 15 vesicles in the RRP (dotted line) are shown in A (double) and C (single).
Mechanisms of PKC action
Phorbol esters produce a PKC-mediated 50 % increase in RRP size, as determined electrophysiologically and with FM1-43 staining, and acceleration of RRP refilling at hippocampal autapses (Stevens & Sullivan, 1998). We used our model to generate testable predictions about how these actions of phorbol esters would affect STD.
Increasing the mean RRP size from 10 to 15 vesicles in the model, while decreasing the replenishment time to 0.5 s, increased the quantal content of single responses by 25 %, and decreased the PPR from 1.14 to 0.87. The steady-state level of STD was increased from 15.8 ± 0.3 to 30.4 ± 1.5 % (P < 0.01) after stimulation at 10 Hz for 15 s (Fig. 8A). In addition, the rate of recovery from 10 Hz stimulation was increased (τ phorbol = 4.2 ± 1.0 s vs. τ control = 6.8 ± 2.0 s).
Figure 8. Effects of phorbol ester on STD of EPSCs and simulated release.

A, change in simulated release during 10 Hz stimulation for control terminals (•, 10 vesicles in RRP and 1 s replenishment time) and terminals in which the initial RRP size was increased to 15 vesicles and the replenishment time was decreased to 0.5 s (○) in order to mimic the effects of phorbol ester described by Stevens & Sullivan (1998). Note that STD was reduced by this manipulation. B, change in simulated release during 10 Hz simulation for control terminals (•) and terminals in which Pterm was increased by 50 % (○) in order to mimic the effects of phorbol ester described by Wu & Wu (2001). Note that STD was enhanced by this manipulation. C, STD (10 Hz, 15 s stimulation) of EPSCs before (•) and after (○) application of 3 μM PDAc for 10 min. The enhancement of STD produced by PDAc is consistent with the predictions of an increase in Pterm on simulated STD. Inset: EPSCs before and after application of 3 μM PDAc for 10 min. Note the increase in EPSC1 amplitude and the decrease in PPR. Scale bars, 50 pA and 25 ms.
Alternatively, activation of PKC by phorbol esters has been shown to produce a PKC-dependent increase in the Ca2+ sensitivity of exocytosis by 50 % at the calyx of Held (Wu & Wu, 2001). We simulated this potential mechanism of PKC action by increasing the probability of release from a given terminal (Pterm) by 50 %. This produced a 56 % increase in the quantal content of responses to single stimuli and a decrease in the PPR from 1.14 to 0.93. The steady-state level of STD during 10 Hz stimulation was decreased from 15.8 ± 0.3 to 9.8 ± 0.3 % (P < 0.01) after stimulation at 10 Hz for 15 s (Fig. 8B).
These simulations predict clear qualitative differences on STD for these two hypothesised mechanisms of PKC action. We tested the effects of phorbol ester application on STD of EPSCs. Application of 3 μM PDAc produced a 298 % increase in EPSC slope and a decrease in PPR from 1.08 to 0.82 (n = 3), consistent with the effects of phorbol esters on EPSCs in acute hippocampal slices and cell cultures (Gustafsson et al. 1988). These actions of PDAc were blocked by pretreatment with the specific PKC inhibitor bisindolylmaleimide I (10 μM for 120 min). After PDAc application, STD elicited with 10 Hz extracellular stimulation was described by two exponentials (τ = 0.14 and 3.0 s, n = 4), comparable to the STD time constants in untreated cultures (τ = 0.3 and 3.0 s). In contrast to the simulated effects of increasing RRP size and replenishment, however, the steady-state level of transmission was decreased from 19.9 ± 1.0 to 6.9 ± 0.5 % (n = 5; P < 0.01) (Fig. 8C). In addition, we observed no significant difference in the rate of recovery of transmission after STD, an indication of the refilling rate, before and after PDAc application (τ control = 5.2 ± 1.4 s; τ phorbol = 4.2 ± 1.1 s; not significantly different). These results are thus qualitatively inconsistent with the predictions of the simulated effects of a phorbol ester-induced increase in RRP size and replenishment rate. Because the electrophysiological effects of PDAc on the STD of EPSCs are qualitatively comparable to the simulated effects of increasing Pterm, we conclude that facilitation of exocytosis, rather than vesicle dynamics, is the dominant mechanism underlying the potentiation of neurotransmitter release by PKC in the hippocampus under our conditions.
DISCUSSION
We constructed a model of the presynaptic terminals contributing to a unitary connection between a CA3 and a CA1 hippocampal cell, which was based on electrophysiological data and which reliably reproduced several forms of short-term presynaptic plasticity. Unlike previous simulations of presynaptic release (Markram & Tsodyks, 1996; Dittman et al. 2000; Matveev & Wang, 2000), we have incorporated numerous stochastic behaviours that underlie the known random, trial-to-trial variations in transmitter release seen in paired recordings. Because short-term plasticity is dependent in part upon prior exocytotic events of individual presynaptic terminals (Debanne et al. 1996; Dobrunz & Stevens, 1997; Hagler & Goda, 2001), a stochastic model provides a more biologically realistic means of exploring the presynaptic basis of short-term depression. Evidence of this point can be seen by comparison of the responses generated by individual model runs, corresponding to the behaviour of a single cell pair, with the average responses of multiple model runs, corresponding to extracellularly evoked EPSCs mediated by large numbers of connections (Fig. 3).
Replenishment of the RRP
The amplitude of Schaffer collateral-CA1 cell EPSCs is unaffected by maintained stimulation at 1 Hz, suggesting that released vesicles can be replenished in < 1 s under these conditions. Stevens & Wessling (1998) found that the refilling of the RRP after complete depletion occurs exponentially in dissociated hippocampal cell cultures with a time constant of 3 s. Similarly, we observed that EPSCs recovered exponentially with a time constant of 4.1 s following 10 Hz stimulation. Furthermore, EPSCs recovered more quickly after 3 Hz stimulation than after 10 Hz stimulation. When replenishment of the readily releasable vesicle pool was modelled as a capacity-limited process, analogous to the refilling of vesicles with neurotransmitter (Sankaranarayanan & Ryan, 2000), the recovery of simulated release after STD displayed identical properties.
Other explanations are consistent with the data, however, and might satisfy the experimental constraints equally well. One possibility is that 10 Hz stimulation produces a greater accumulation of intraterminal Ca2+ than 3 Hz stimulation and that Ca2+ decreases the rate of replenishment. However, elevated intraterminal Ca2+ was reported previously to accelerate recovery at several synapses (Dittman & Regehr, 1998; Stevens & Wesseling, 1998; Wang & Kaczmarek, 1998; Weis et al. 1999), a mechanism inconsistent with our observations.
Alternatively, it could be that the translocation of vesicles from the reserve pool to the RRP is fast, as at the calyx of Held, but newly replaced vesicles are ‘reluctant’ to undergo Ca2+-triggered exocytosis (Wu & Borst, 1999). The newly replaced vesicles would become gradually less reluctant as their release probability increases. During 1 Hz stimulation, the proportion of reluctant vesicles in the RRP would be small, whereas during 10 Hz stimulation the RRP would be largely populated with reluctant vesicles. Slow recovery following 10 Hz stimulation could thus reflect both replacement of RRP vesicles and the transition of newly replaced vesicles from low to high release probability. This transition occurs more slowly than translocation in the calyx of Held (Wu & Borst, 1999).
Determinants of the time course and steady-state level of STD
The changes in PPR and CV−2 associated with the simulated STD were essentially identical to those seen with extracellularly evoked EPSCs. Because the experimentally observed correlation between the steady-state level of STD of EPSCs and the decreases in CV−2 after tetanic stimulation, potentially mediated by pre- and postsynaptic mechanisms, are quantitatively comparable to those generated by simulated presynaptic terminals, these observations support the conclusion that STD of EPSCs in rat hippocampal slice cultures is mediated predominantly by presynaptic processes. Furthermore, the model reproduced both the time course and steady-state level of STD of EPSCs observed under conditions of elevated release probability and varied stimulation frequency.
The release of vesicles during high frequency stimulation can be characterised by three components: an initial rapid exponential decline in transmission, a second, slower exponential decline, and a steady-state level of maintained transmission. What processes underlie these features?
Electrophysiological data from cultured hippocampal slices (D. H. Brager & S. M. Thompson, unpublished observations) indicate that activation of presynaptic inhibitory adenosine A1 receptors underlies the fast component of STD. Depletion of vesicles from the RRP has been proposed as a dominant process in STD at excitatory hippocampal synapses (Dobrunz & Stevens, 1997). Indeed, RRP depletion in the model occurs at a rate comparable to the slow component of simulated STD. Real nerve terminals may possess other processes, such as an accumulation of ‘reluctant’ vesicles (Wu & Borst, 1998) or Ca2+ channel inactivation (Forsythe et al. 1998), which could also contribute to the slow component of STD if they occur at similar rates.
We observed an excellent correlation between the number of vesicles remaining in the RRP and the simulated and experimental steady-state level of transmission. We conclude, therefore, that the average number of neurotransmitter vesicles remaining in the RRP during sustained activity determines the steady-state level of STD. Net vesicle depletion is determined by the rates of vesicle release and replenishment. We found that the steady-state level of transmission was affected by modifying the time required for vesicle replenishment, but not by increasing the initial RRP size.
Presynaptic actions of PKC
Application of phorbol esters increases release probability in many CNS nerve terminals. Although phorbol esters may also act directly on the presynaptic protein Munc-13 to produce a PKC-independent facilitation of release in some systems (Betz et al. 1998), we have found that the facilitation of evoked and spontaneous glutamate release in hippocampal slice cultures is fully blocked by the competitive inhibitor of the ATP binding site of PKC, bisindolylmaleimide I. We suggest, therefore, that the phorbol ester effects we studied are mediated by PKC.
The mechanisms by which PKC facilitates release remain controversial. In hippocampal autapses, PKC activation increases the initial size of the RRP, measured as an increase in both maximal sucrose-evoked release and FM1-43 staining per bouton, and the RRP refilling rate by ∼50 % (Stevens & Sullivan, 1998). At the calyx of Held, in contrast, PKC activation increases the Ca2+ sensitivity of the exocytotic process, without affecting vesicle dynamics (Wu & Wu, 2001). Simulation of either a 50 % increase in RRP size with a decrease in replenishment time or a 50 % increase in the probability of vesicle fusion resulted in large increases in the quantal content of responses to single stimuli, similar to the increases in evoked synaptic responses produced by stimulating PKC with phorbol esters. These two manipulations produced opposite effects on simulated STD, however. Whereas the change in vesicle dynamics attenuated STD, the change in the probability of exocytosis enhanced STD.
Our electrophysiological experiments revealed that PDAc application significantly decreased the STD steady state: a result that suggests that changes in vesicle dynamics alone cannot account completely for the facilitation of neurotransmitter release by PKC. Our electrophysiological results are consistent with the predicted consequences of increasing the Ca2+ sensitivity of the exocytotic process on STD. We suggest therefore that phorbol esters potentiate glutamate release in rat hippocampal slice cultures by stimulating PKC and thereby increasing the likelihood of vesicle fusion in response to a given amount of presynaptic Ca2+ influx. This increased likelihood could be mediated by several molecular mechanisms, including PKC-mediated phosphorylation of exocytotic proteins and/or a decreased energetic barrier to vesicle fusion. For example, both the SNARE protein SNAP-25 (Shimazaki et al. 1996; Genoud et al. 1999) and the v-SNARE binding protein munc-18 (Fujita et al. 1996) are known to be phosphorylated by PKC. Phosphorylation of munc-18 inhibits its binding to synaptobrevin and may thus promote core complex formation.
Acknowledgments
We thank T. Gover, Dr J. P. Y. Kao, and Dr T. A. Abrams for advice on model construction, and Dr B. E. Alger and Dr T. A. Abrams for comments on the manuscript. This work was supported by University of Maryland School of Medicine Bressler Research Funds.
Supplementary material
The online version of this paper contains a downloadable version of the model:
http://www.jphysiol.org/cgi/content/full/541/2/545
Expression of myelin basic and 2',3'-cyclic nucleotide 3'-phospodiesterase proteins in cells displaying high EGFP intensity in white matter
Confocal images (z=15-19μm) of white matter from a coronal slice of P8 CNP-EGFP mouse. A1-A3. Strong MBP staining of processes is observed in close localization of the large, high intensity EGFP+ cell bodies (arrows). In contrast, a relatively less dense distribution of MBP staining was noted surrounding faint EGFP+ cell bodies (arrowheads). Since it was not always easy to definitively determine from which cells the MBP stained processes were emanating from (due to the amount of MBP immunoreactivity observed), we repeated the experiment using antibodies to the CNP protein, which is also localized within cell bodies. This allows for a more accurate determination of the correlation between EGFP intensity and this marker of mature, myelinating oligodendrocytes. B1-B3. CNP protein expression is exclusively co-localized within the cell bodies of the large high intensity EGFP+ cells, but is absent from faint EGFP+ cells (see arrows vs arrowheads). Scale bars = 50 μm. Note: Cells that display EGFP, but not CNP-protein expression, represent cells that possess CNP mRNA, since EGFP expression is regulated by the CNP-promoter. All data was obtained from P8 CNP-EGFP mice.
Non-invasive cell-attached measurements of the resting membrane potential in white matter and cortical NG2+ cells
A. Depolarizing ramp command from -140 to + 200 mV (-Vpip) used to elicit K+-channel currents from cell-attached patch recordings from white matter and cortical NG2+ cells. B - C. Voltage-gated K+-currents activated by the ramp protocol in a white matter (B) and a cortical (C) NG2+ cell. The reversal potential was calculated by fitting the linear leak (grey straight line) and ascertaining its intersection with the current trace (i.e. the point of K+ -current reversal). The Vm was calculated from this reversal potential as outlined in the methods. In the single examples shown the Vm for the white matter and cortical NG2+ cells were found to be -64 and -88 mV, respectively. All data was obtained from P5 -P8 CNP-EGFP mice.
NG2+/EGFP+ cells FACS-purified from the P8 cerebral cortex express immature neuronal markers
NG2+/EGFP+ cells were FACS-purified from P8 cortical tissue as previously described (Belachew et al., 2003; Aguirre et al., 2004). A-C: Sorting profiles of acutely isolated cell suspensions from P8 cerebral cortices (A, wt) and CNP-EGFP transgenic mice (B and C) dot plotted according to fluorescence intensity for EGFP (x axis, logarithmic scale) and Cy-5 (fluorescence associated to secondary antibody recognizing NG2 immunoreactivity, y axis, logarithmic scale). The polygon R3 in panels B and C defines the levels of fluorescence above which cells from CNP-EGFP brains were selected as EGFP+. It was observed that less than 0.01 % (limit of detection) of the control cells from (A) fell over this threshold. When CNP-EGFP cell suspensions were immunostained for NG2 (C), cortical NG2+/EGFP+cells were detected in the upper right polygon (R2). In order to ensure accurate purification of NG2+ cells, the sort gate for these cells (polygon R2 in C) was defined by taking an additional margin (0.2-0.3 log units) with respect to background fluorescence levels. D: Percentage of cortical NG2+/EGFP+ cells stained with anti-TUJ anti-HuC/D and anti-NeuN 2hrs after FACS-purification (nd = not detected). E1-E4: cortical NG2+/EGFP+cells (E1 and E2) that were FACS-purified from cerebral cortices and stained with anti-TUJ1 (E3) antibody 2 hours after plating. Scale bars = 50 μm.
REFERENCES
- Atluri PP, Regehr WG. Determinants of the time course of facilitation at the granule cell to Purkinje cell synapse. Journal of Neuroscience. 1996;16:5661–5671. doi: 10.1523/JNEUROSCI.16-18-05661.1996. [DOI] [PMC free article] [PubMed] [Google Scholar]
- Betz WJ. Depression of transmitter release at the neuromuscular junction of the frog. Journal of Physiology. 1970;206:629–644. doi: 10.1113/jphysiol.1970.sp009034. [DOI] [PMC free article] [PubMed] [Google Scholar]
- Betz A, Ashery U, Rickmann M, Augustin I, Neher E, Südhof TC, Rettig J, Brose N. Munc13–1 is a presynaptic phorbol ester receptor that enhances neurotransmitter release. Neuron. 1998;21:123–136. doi: 10.1016/s0896-6273(00)80520-6. [DOI] [PubMed] [Google Scholar]
- Capogna M, Fankhauser C, Gagliardini V, Gähwiler BH, Thompson SM. Excitatory synaptic transmission and its modulation by PKC is unchanged in the hippocampus of GAP-43-deficient mice. European Journal of Neuroscience. 1999;11:433–440. doi: 10.1046/j.1460-9568.1999.00450.x. [DOI] [PubMed] [Google Scholar]
- Capogna M, McKinney RA, O'Connor V, Gähwiler BH, Thompson SM. Ca2+ or Sr2+ partially rescues synaptic transmission in hippocampal cultures treated with botulinum toxin A and C, but not tetanus toxin. Journal of Neuroscience. 1997;17:7190–7202. doi: 10.1523/JNEUROSCI.17-19-07190.1997. [DOI] [PMC free article] [PubMed] [Google Scholar]
- Chen C, Regehr WG. Contributions of residual calcium to fast synaptic transmission. Journal of Neuroscience. 1999;19:6257–6266. doi: 10.1523/JNEUROSCI.19-15-06257.1999. [DOI] [PMC free article] [PubMed] [Google Scholar]
- Creager R, Dunwiddie T, Lynch G. Paired-pulse and frequency facilitation in the CA1 region of the in vitro rat hippocampus. Journal of Physiology. 1980;299:409–424. doi: 10.1113/jphysiol.1980.sp013133. [DOI] [PMC free article] [PubMed] [Google Scholar]
- Debanne D, Guérineau NC, Gähwiler BH, Thompson SM. Paired-pulse facilitation and depression at unitary synapses in rat hippocampus: quantal fluctuation affects subsequent release. Journal of Physiology. 1996;491:163–176. doi: 10.1113/jphysiol.1996.sp021204. [DOI] [PMC free article] [PubMed] [Google Scholar]
- Dittman JS, Kreitzer AC, Regehr WG. Interplay between facilitation, depression, and residual calcium at three presynaptic terminals. Journal of Neuroscience. 2000;20:1374–1385. doi: 10.1523/JNEUROSCI.20-04-01374.2000. [DOI] [PMC free article] [PubMed] [Google Scholar]
- Dittman JS, Regehr WG. Calcium dependence and recovery kinetics of presynaptic depression at the climbing fiber to Purkinje cell synapse. Journal of Neuroscience. 1998;18:6147–6162. doi: 10.1523/JNEUROSCI.18-16-06147.1998. [DOI] [PMC free article] [PubMed] [Google Scholar]
- Dobrunz LE, Huang EP, Stevens CF. Very short-term plasticity in hippocampal synapses. Proceedings of the National Academy of Sciences of the USA. 1997;94:14843–14847. doi: 10.1073/pnas.94.26.14843. [DOI] [PMC free article] [PubMed] [Google Scholar]
- Dobrunz LE, Stevens CF. Heterogeneity of release probability, facilitation, and depletion at central synapses. Neuron. 1997;18:995–1008. doi: 10.1016/s0896-6273(00)80338-4. [DOI] [PubMed] [Google Scholar]
- Emptage NJ, Reid CA, Fine A. Calcium stores in hippocampal synaptic boutons mediate short-term plasticity, store-operated Ca2+ entry, and spontaneous transmitter release. Neuron. 2001;29:197–208. doi: 10.1016/s0896-6273(01)00190-8. [DOI] [PubMed] [Google Scholar]
- Forsythe ID, Tsujimoto T, Barnes-Davies M, Cuttle MF, Takahasi T. Inactivation of presynaptic calcium current contributes to synaptic depression at a fast central synapse. Neuron. 1998;20:797–807. doi: 10.1016/s0896-6273(00)81017-x. [DOI] [PubMed] [Google Scholar]
- Fujita Y, Sasaki T, Fukui K, Kotani H, Kimura T, Hata Y, Sudhof TC, Scheller RH, Takai Y. Phosphorylation of Munc-18/n-Sec1/rbSec1 by protein kinase C: its implication in regulating the interaction of Munc-18/. n-Sec1/rbSec1 with syntaxin. Journal of Biological Chemistry. 1996;271:7265–7268. doi: 10.1074/jbc.271.13.7265. [DOI] [PubMed] [Google Scholar]
- Genoud S, Pralong W, Riederer BM, Eder L, Catsicas S, Muller D. Activity-dependent phosphorylation of SNAP-25 in hippocampal organotypic cultures. Journal of Neurochemistry. 1999;72:1699–1706. doi: 10.1046/j.1471-4159.1999.721699.x. [DOI] [PubMed] [Google Scholar]
- Gillis KD, Mossner R, Neher E. Protein kinase C enhances exocytosis from chromaffin cells by increasing the size of the readily releasable pool of secretory granules. Neuron. 1996;16:1209–1220. doi: 10.1016/s0896-6273(00)80147-6. [DOI] [PubMed] [Google Scholar]
- Gover T, Jiang X-Y, Abrams TA. Persistent, exocytosis-independent silencing of release sites underlies homosynaptic depression at sensory synapses in Aplysia. Journal of Neuroscience. 2002;22:1942–1955. doi: 10.1523/JNEUROSCI.22-05-01942.2002. [DOI] [PMC free article] [PubMed] [Google Scholar]
- Gustaffson B, Huang YY, Wigstrom H. Phorbol ester-induced synaptic potentiation differs from long-term potentiation in the guinea pig hippocampus in vitro. Neuroscience Letters. 1988;85:77–81. doi: 10.1016/0304-3940(88)90432-6. [DOI] [PubMed] [Google Scholar]
- Hagler DJ, Goda Y. Properties of synchronous and asynchronous release during pulse train depression in cultured hippocampal neurons. Journal of Neurophysiology. 2001;85:2324–2334. doi: 10.1152/jn.2001.85.6.2324. [DOI] [PubMed] [Google Scholar]
- Heidelberger R, Heinemann C, Neher E, Matthews G. Calcium dependence of the rate of exocytosis in a synaptic terminal. Nature. 1994;371:513–515. doi: 10.1038/371513a0. [DOI] [PubMed] [Google Scholar]
- Herlitze S, Zhong H, Scheuer T, Catterall WA. Allosteric modulation of Ca2+ channels by G proteins, voltage-dependent facilitation, protein kinase C, and Cavα subunits. Proceedings of the National Academy of Sciences of the USA. 2001;98:4699–4704. doi: 10.1073/pnas.051628998. [DOI] [PMC free article] [PubMed] [Google Scholar]
- Heuser JE, Reese TS, Dennis MJ, Jan Y, Jan L, Evans L. Synaptic vesicle exocytosis captured by quick freezing and correlated with quantal transmitter release. Journal of Cell Biology. 1979;81:275–300. doi: 10.1083/jcb.81.2.275. [DOI] [PMC free article] [PubMed] [Google Scholar]
- Hori T, Takai Y, Takahashi T. Presynaptic mechanism for phorbol ester-induced synaptic potentiation. Journal of Neuroscience. 1999;19:7262–7267. doi: 10.1523/JNEUROSCI.19-17-07262.1999. [DOI] [PMC free article] [PubMed] [Google Scholar]
- Katz B, Miledi R. The role of calcium in neuromuscular facilitation. Journal of Physiology. 1968;195:481–492. doi: 10.1113/jphysiol.1968.sp008469. [DOI] [PMC free article] [PubMed] [Google Scholar]
- Koester HJ, Sakmann B. Calcium dynamics associated with action potentials in single nerve terminals of pyramidal cells in layer 2/3 of the young rat neocortex. Journal of Physiology. 2001;529:625–646. doi: 10.1111/j.1469-7793.2000.00625.x. [DOI] [PMC free article] [PubMed] [Google Scholar]
- Korn H, Sur C, Charpier S, Legendre P, Faber DS. The one-vesicle hypothesis and multivesicular release. In: Stjarne L, Greengard P, Grillner S, Hokfelt T, Ottoson D, editors. Molecular and Cellular Mechanisms of Neurotransmitter Release. New York, USA: Raven Press Ltd; 1994. pp. 301–322. [DOI] [PubMed] [Google Scholar]
- Lee HK, Elmslie KS. Gating of single N-type calcium channels recorded from bullfrog sympathetic neurons. Journal of General Physiology. 1999;113:111–124. doi: 10.1085/jgp.113.1.111. [DOI] [PMC free article] [PubMed] [Google Scholar]
- Malenka RC, Madison DV, Andrade R, Nicoll RA. Phorbol esters mimic some cholinergic actions in hippocampal pyramidal neurons. Journal of Neuroscience. 1986;6:475–480. doi: 10.1523/JNEUROSCI.06-02-00475.1986. [DOI] [PMC free article] [PubMed] [Google Scholar]
- Markram H, Lubke J, Frotscher M, Roth A, Sakmann B. Physiology and anatomy of synaptic connections between thick tufted pyramidal neurones in the developing rat neocortex. Journal of Physiology. 1997;500:409–440. doi: 10.1113/jphysiol.1997.sp022031. [DOI] [PMC free article] [PubMed] [Google Scholar]
- Markram H, Tsodyks M. Redistribution of synaptic efficacy between neocortical pyramidal neurons. Nature. 1996;382:807–810. doi: 10.1038/382807a0. [DOI] [PubMed] [Google Scholar]
- Matveev V, Wang X-J. Implications of all-or-none synaptic transmission and short-term depression beyond vesicle depletion: a computational study. Journal of Neuroscience. 2000;20:1575–1588. doi: 10.1523/JNEUROSCI.20-04-01575.2000. [DOI] [PMC free article] [PubMed] [Google Scholar]
- Parfitt KD, Madison DV. Phorbol esters enhance synaptic transmission by a presynaptic, calcium-dependent mechanism in rat hippocampus. Journal of Physiology. 1993;471:245–268. doi: 10.1113/jphysiol.1993.sp019900. [DOI] [PMC free article] [PubMed] [Google Scholar]
- Pfrieger FW, Gottmann K, Lux HD. Kinetics of GABAB receptor-mediated inhibition of calcium currents and excitatory synaptic transmission in hippocampal neurons in vitro. Neuron. 1994;12:97–107. doi: 10.1016/0896-6273(94)90155-4. [DOI] [PubMed] [Google Scholar]
- Pyle JL, Kavalali ET, Piedras-Renteria ES, Tsien RW. Rapid reuse of readily releasable pool vesicles at hippocampal synapses. Neuron. 2000;28:221–231. doi: 10.1016/s0896-6273(00)00098-2. [DOI] [PubMed] [Google Scholar]
- Roberts WM. Localization of calcium signals by a mobile calcium buffer in frog saccular hair cells. Journal of Neuroscience. 1994;14:3246–3262. doi: 10.1523/JNEUROSCI.14-05-03246.1994. [DOI] [PMC free article] [PubMed] [Google Scholar]
- Sankaranarayanan S, Ryan TA. Real-time measurements of vesicle-SNARE recycling in synapses of the central nervous system. Nature Cell Biology. 2000;2:197–204. doi: 10.1038/35008615. [DOI] [PubMed] [Google Scholar]
- Schikorski T, Stevens CF. Quantitative ultrastructural analysis of hippocampal excitatory synapses. Journal of Neuroscience. 1997;17:5858–5867. doi: 10.1523/JNEUROSCI.17-15-05858.1997. [DOI] [PMC free article] [PubMed] [Google Scholar]
- Shimazaki Y, Nishiki T, Omori A, Sekiguchi M, Kamata Y, Kozaki S, Takahashi M. Phosphorylation of 25-kDa synaptosome-associated protein. Possible involvement in protein kinase C-mediated regulation of neurotransmitter release. Journal of Biological Chemistry. 1996;271:14548–14553. doi: 10.1074/jbc.271.24.14548. [DOI] [PubMed] [Google Scholar]
- Simon SM, Llinas RR. Compartmentalization of the submembrane calcium activity during calcium influx and its significance in transmitter release. Biophysical Journal. 1985;48:485–498. doi: 10.1016/S0006-3495(85)83804-2. [DOI] [PMC free article] [PubMed] [Google Scholar]
- Smirnov S, Paalasmaa P, Uusisaari M, Voipio J, Kaila K. Pharmacological isolation of the synaptic and non-synaptic components of the GABA-mediated biphasic response in rat CA1 hippocampal pyramidal cells. Journal of Neuroscience. 1999;19:9252–9260. doi: 10.1523/JNEUROSCI.19-21-09252.1999. [DOI] [PMC free article] [PubMed] [Google Scholar]
- Stevens CF, Sullivan JM. Regulation of the readily releasable vesicle pool by protein kinase C. Neuron. 1998;21:885–893. doi: 10.1016/s0896-6273(00)80603-0. [DOI] [PubMed] [Google Scholar]
- Stevens CF, Wang Y. Facilitation and depression at single central synapses. Neuron. 1995;14:795–802. doi: 10.1016/0896-6273(95)90223-6. [DOI] [PubMed] [Google Scholar]
- Stevens CF, Wesseling JF. Activity-dependent modulation of the rate at which synaptic vesicles become available to undergo exocytosis. Neuron. 1998;21:415–424. doi: 10.1016/s0896-6273(00)80550-4. [DOI] [PubMed] [Google Scholar]
- Stricker C, Field AC, Redman SJ. Statistical analysis of amplitude fluctuations in EPSCs evoked in rat CA1 pyramidal neurones in vitro. Journal of Physiology. 1996;490:419–441. doi: 10.1113/jphysiol.1996.sp021155. [DOI] [PMC free article] [PubMed] [Google Scholar]
- Südhof TC. The synaptic vesicle cycle: a cascade of protein-protein interactions. Nature. 1995;375:645–653. doi: 10.1038/375645a0. [DOI] [PubMed] [Google Scholar]
- Theis RE. Neuromuscular depression and the apparent depletion of transmitter in mammalian muscle. Journal of Physiology. 1965;28:427–442. doi: 10.1152/jn.1965.28.3.427. [DOI] [PubMed] [Google Scholar]
- Thompson SM, Debanne D, Capogna M. Presynaptic determinants of synaptic efficacy in hippocampal pyramidal neurons. In: Faber DS, Korn H, Redman SJ, Thompson SM, Altman JS, editors. Central Synapses: Quantal Mechanisms and Plasticity. Strasbourg, France: Human Frontier Science Program; 1998. pp. 247–254. [Google Scholar]
- Tsodyks MV, Markram H. The neural code between neocortical pyramidal neurons depends on neurotransmitter release probability. Proceedings of the National Academy of Sciences of the USA. 1997;94:719–723. doi: 10.1073/pnas.94.2.719. [DOI] [PMC free article] [PubMed] [Google Scholar]
- Vitale ML, Seward EP, Trifaro JM. Chromaffin cell cortical actin network dynamics control the size of the release-ready vesicle pool and the initial rate of exocytosis. Neuron. 1995;14:353–363. doi: 10.1016/0896-6273(95)90291-0. [DOI] [PubMed] [Google Scholar]
- Wang L-Y, Kaczmarek LK. High-frequency firing helps replenish the readily releasable pool of synaptic vesicles. Nature. 1998;394:384–388. doi: 10.1038/28645. [DOI] [PubMed] [Google Scholar]
- Weis S, Schneggenburger R, Neher E. Properties of a model of Ca2+-dependent vesicle pool dynamics and short term synaptic depression. Biophysical Journal. 1999;77:2418–2429. doi: 10.1016/S0006-3495(99)77079-7. [DOI] [PMC free article] [PubMed] [Google Scholar]
- Wu L-G, Borst JGG. The reduced release probability of releasable vesicles during recovery from short-term synaptic depression. Neuron. 1999;23:821–832. doi: 10.1016/s0896-6273(01)80039-8. [DOI] [PubMed] [Google Scholar]
- Wu L-G, Saggau P. Presynaptic calcium is increased during normal synaptic transmission and paired-pulse facilitation, but not in long-term potentiation in area CA1 of hippocampus. Journal of Neuroscience. 1994;14:645–654. doi: 10.1523/JNEUROSCI.14-02-00645.1994. [DOI] [PMC free article] [PubMed] [Google Scholar]
- Wu X-S, Wu L-G. Protein kinase C increases the apparent affinity of the release machinery to Ca2+ by enhancing the release machinery downstream of the Ca2+ sensor. Journal of Neuroscience. 2001;21:7928–7936. doi: 10.1523/JNEUROSCI.21-20-07928.2001. [DOI] [PMC free article] [PubMed] [Google Scholar]
- Yamamoto C, Higashima M, Sawada S. Quantal analysis of potentiating action of phorbol ester on synaptic transmission in the hippocampus. Neuroscience Research. 1987;5:28–38. doi: 10.1016/0168-0102(87)90021-6. [DOI] [PubMed] [Google Scholar]
- Yawo H. Protein kinase C potentiates transmitter release from the chick ciliary presynaptic terminal by increasing the exocytotic fusion probability. Journal of Physiology. 1999;515:169–180. doi: 10.1111/j.1469-7793.1999.169ad.x. [DOI] [PMC free article] [PubMed] [Google Scholar]
- Zucker RS. Calcium and transmitter release. Journal of Physiology (Paris) 1993;87:25–36. doi: 10.1016/0928-4257(93)90021-k. [DOI] [PubMed] [Google Scholar]
Associated Data
This section collects any data citations, data availability statements, or supplementary materials included in this article.
Supplementary Materials
Expression of myelin basic and 2',3'-cyclic nucleotide 3'-phospodiesterase proteins in cells displaying high EGFP intensity in white matter
Confocal images (z=15-19μm) of white matter from a coronal slice of P8 CNP-EGFP mouse. A1-A3. Strong MBP staining of processes is observed in close localization of the large, high intensity EGFP+ cell bodies (arrows). In contrast, a relatively less dense distribution of MBP staining was noted surrounding faint EGFP+ cell bodies (arrowheads). Since it was not always easy to definitively determine from which cells the MBP stained processes were emanating from (due to the amount of MBP immunoreactivity observed), we repeated the experiment using antibodies to the CNP protein, which is also localized within cell bodies. This allows for a more accurate determination of the correlation between EGFP intensity and this marker of mature, myelinating oligodendrocytes. B1-B3. CNP protein expression is exclusively co-localized within the cell bodies of the large high intensity EGFP+ cells, but is absent from faint EGFP+ cells (see arrows vs arrowheads). Scale bars = 50 μm. Note: Cells that display EGFP, but not CNP-protein expression, represent cells that possess CNP mRNA, since EGFP expression is regulated by the CNP-promoter. All data was obtained from P8 CNP-EGFP mice.
Non-invasive cell-attached measurements of the resting membrane potential in white matter and cortical NG2+ cells
A. Depolarizing ramp command from -140 to + 200 mV (-Vpip) used to elicit K+-channel currents from cell-attached patch recordings from white matter and cortical NG2+ cells. B - C. Voltage-gated K+-currents activated by the ramp protocol in a white matter (B) and a cortical (C) NG2+ cell. The reversal potential was calculated by fitting the linear leak (grey straight line) and ascertaining its intersection with the current trace (i.e. the point of K+ -current reversal). The Vm was calculated from this reversal potential as outlined in the methods. In the single examples shown the Vm for the white matter and cortical NG2+ cells were found to be -64 and -88 mV, respectively. All data was obtained from P5 -P8 CNP-EGFP mice.
NG2+/EGFP+ cells FACS-purified from the P8 cerebral cortex express immature neuronal markers
NG2+/EGFP+ cells were FACS-purified from P8 cortical tissue as previously described (Belachew et al., 2003; Aguirre et al., 2004). A-C: Sorting profiles of acutely isolated cell suspensions from P8 cerebral cortices (A, wt) and CNP-EGFP transgenic mice (B and C) dot plotted according to fluorescence intensity for EGFP (x axis, logarithmic scale) and Cy-5 (fluorescence associated to secondary antibody recognizing NG2 immunoreactivity, y axis, logarithmic scale). The polygon R3 in panels B and C defines the levels of fluorescence above which cells from CNP-EGFP brains were selected as EGFP+. It was observed that less than 0.01 % (limit of detection) of the control cells from (A) fell over this threshold. When CNP-EGFP cell suspensions were immunostained for NG2 (C), cortical NG2+/EGFP+cells were detected in the upper right polygon (R2). In order to ensure accurate purification of NG2+ cells, the sort gate for these cells (polygon R2 in C) was defined by taking an additional margin (0.2-0.3 log units) with respect to background fluorescence levels. D: Percentage of cortical NG2+/EGFP+ cells stained with anti-TUJ anti-HuC/D and anti-NeuN 2hrs after FACS-purification (nd = not detected). E1-E4: cortical NG2+/EGFP+cells (E1 and E2) that were FACS-purified from cerebral cortices and stained with anti-TUJ1 (E3) antibody 2 hours after plating. Scale bars = 50 μm.