

Abstract
Group I metabotropic glutamate receptors (mGluRs) are expressed in cells in the superficial layers of the rat superior colliculus (SSC) and SSC afferents. The purpose of this study was to investigate the physiological effect of Group I mGluR activation on visual responses of SSC neurones using both in vivo and in vitro techniques. In the in vivo preparation, agonists and antagonists were applied by iontophoresis and single neurone activity was recorded extracellularly in anaesthetised rats. Application of the Group I agonist (S)-3,5-dihydroxyphenylglycine (DHPG) resulted in a reversible inhibition of the visual response. The effect of DHPG could be blocked by concurrent application of the Group I (mGluR1/mGluR5) antagonist (S)-4-carboxyphenylglycine (4CPG) or mGluR1 antagonist (+)-2-methyl-4-carboxyphenylglycine (LY367385). Application of 4CPG alone resulted in a facilitation of the visual response and this effect was not changed when the visual stimulus contrast was varied. Response habituation was observed when visual stimuli were presented at 0.5 s intervals, but this was not affected by DHPG or 4CPG. In slices of the superior colliculus, stimulation of the optic tract resulted in a field EPSP recorded from the SSC whose duration was increased in the presence of the GABA antagonists picrotoxin and CGP55845. Application of DHPG (5-100 μM) reduced the field EPSP, and this effect could be reversed by the mGluR1 antagonist LY367385 (200 μM), but not by the mGluR5 antagonist MPEP (5 μM). These data show that activation of mGluR1, but probably not mGluR5, can modulate visual responses of SSC neurones in vivo, and that this could be via presynaptic inhibition of glutamate release from either retinal or, possibly, cortical afferents.
The superior colliculus (SC) is a subcortical structure involved in attention, orientation and integrated responses to novel visual, auditory and somatosensory stimuli (Sparks & Nelson, 1987). The SC has seven alternating fibrous and cellular layers. The three most superficial layers, termed superficial SC (SSC), are concerned with visual processing and receive major afferent connections from the contralateral retina (Lam et al. 1982) and ipsilateral visual cortex (Lund, 1966). Neurones in the SSC project mainly to two thalamic nuclei, the dorsal lateral geniculate nucleus (Brauer et al. 1979) and the lateral posterior-pulvinar complex (Perry, 1980), which in turn send projections to the visual cortex. Neurones in intermediate and deep layers of the SC receive auditory, somatosensory and nociceptive inputs in addition to visual inputs, and the SC generates appropriate behavioural responses (approach or withdrawal) to novel sensory events via efferent connections to motor pathways (Stein & Meredith, 1993).
Previous work in this laboratory has demonstrated that glutamate is a neurotransmitter in the rat SSC, activating both ionotropic glutamate receptors (Roberts et al. 1991; Binns & Salt, 1994) and metabotropic glutamate receptors (mGluRs) (Cirone & Salt, 2000, 2001). Eight mGluRs have been cloned (mGluR1-mGluR8) and these can be divided into three groups based on sequence homology, pharmacology and coupling to second-messenger pathways (Conn & Pin, 1997). Group I receptors couple to inositol phosphate metabolism and have been predominantly associated with postsynaptic locations, whereas Group II and Group III receptors couple to an inhibitory cyclic AMP cascade and have often been associated with presynaptic mechanisms (Conn & Pin, 1997). We have previously described physiological roles for both Group II and III mGluRs (Cirone & Salt, 2000, 2001). There is anatomical evidence for the location of mGluRs of all three groups, including those in Group I (i.e. mGluR1 and mGluR5) in the rat SSC (Martin et al. 1992; Shigemoto et al. 1992, 1993; Romano et al. 1995; Cirone et al. 2002). We thus sought to investigate Group I receptors in the SSC, to determine firstly whether activation of Group I receptors can modulate visual transmission in this area, and secondly whether these receptors are activated physiologically during visual transmission. To achieve these aims we carried out experiments both in vivo and in vitro with the group-selective agonist (S)-3,5-dihydroxyphenylglycine (DHPG) and antagonists selective for Group I receptors. Some of these findings have been presented in abstract form (Cirone et al. 2001).
METHODS
Lister Hooded rats were used throughout these studies. All experiments were carried out in accordance with the UK Animals (Scientific Procedures) Act 1986 and associated guidelines.
In vivo studies
Details of the surgical preparation have been described previously (Binns & Salt, 1997). Extracellular recordings of action potentials were made from single SSC cells using multi-barrelled glass iontophoretic micropipettes in rats anaesthetised with urethane (1.25 g kg−1i.p.). The barrels of the pipette contained one of the following solutions: (S)-3,5-dihydroxyphenylglycine (DHPG, 50 mm in water, pH 3.5), (+)-2-methyl-4-carboxyphenylglycine (LY367385, 25 mm in water, pH 8.5), d,l-α-amino-3-hydroxy-5-methyl-4-isoxazolepropionate (AMPA, 10 mm in 75 mm NaCl, pH 8.5), N-methyl-d-aspartate (NMDA, 200 mm in water, pH 8), (S)-4-carboxyphenylglycine (4CPG 50 mm in water, pH 8.5), 100 mm NaCl (for current controls), 100 mm NaCl-H+ (for pH controls, pH 3.5), 1 m NaCl (for current balancing), 4 m NaCl (for extracellular recording) and Pontamine Sky Blue (2.5 % in 0.5 m NaCl-0.5 m sodium acetate) to mark recording sites. All drugs were retained in the barrels with small positive currents (6-15 nA) and ejected as anions, with the exception of DHPG and NaCl-H+ which were retained with a negative current and ejected as cations. Action potentials were gated with a waveform discriminator and timed and recorded using a CED 1401 computer interface and VS Software (Cambridge Electronic Design, UK) which generated peri-stimulus time histograms (PSTHs). At the end of the experiment, the rat was killed with an overdose of urethane.
Visual stimuli were created by a Picasso visual stimulus generator under computer control, and displayed on a cathode ray tube (CRT, Tektronix) located in the receptive field of the neurone, 15 cm away from the subject's eye. Standard stimulus cycles consisted of 10 presentations of light bars (luminance either 20 or 12.2 cd m−2) on a dark background (3.1 cd m−2), 5 × 10-15 deg moving at 22.5 deg s−1 for 4 s every 10 s. For the habituating stimulus to reliably induce response habituation a stimulus moving for 2 s with a 0.5 s interval between each of five presentations was used (Binns & Salt, 1997). This sequence was presented for five trials with an inter-trial interval of 10 s. The moving bars were of preferred orientation and direction.
Control cycles of visual stimuli were presented to evoke reproducible responses before generation of two or three cycles of visual stimuli during continuous ejection of the substance under investigation. Recovery data were then obtained, before collection of new control data and further drug application. To determine if the Group I antagonist 4CPG and mGluR1 selective antagonist LY367385 blocked the effect of the Group I agonist DHPG, stable responses during application of the antagonists were obtained, before co-application with DHPG (three cycles of visual stimuli). Agonist ejection ceased, whilst antagonist ejection continued for two more cycles of visual stimuli. This allowed assessment of changes in the visual response during and after agonist application in the presence of antagonist. All drug ejection then ceased and two or three more cycles of recovery data were obtained.
Responses to visual stimuli were quantified as counts of action potentials evoked by the stimuli during their presentation. The extent of response habituation (Binns & Salt 1997; Cirone & Salt, 2001) was assessed by expressing the response evoked by the fifth presentation of five repeated stimulus presentations as a percentage of that evoked by the first, using the formula:
Habituation = [1 - (no. of spikes evoked by the fifth presentation/ no. of spikes evoked by first presentation)] × 100.
Responses were observed on-line during collection and analysed off line using Spike2 or VS Software (Cambridge Electronic Design). The effect of a test drug is expressed as the percentage mean of the control cycle responses (or continuous 4CPG or LY367385 ejection). Wilcoxon's signed-rank test was used to test for significant differences between control data and data obtained during drug application as this does not assume that the data have a normal distribution. Results are expressed as a percentage of control ± s.e.m.
In vitro studies
Rats (50-200 g) were anaesthetised with halothane and decapitated. Their brains were then removed rapidly and placed in ice-cold, oxygenated Krebs medium containing (mm): sucrose 202, KCl 2, KH2PO4 1.25, MgSO4 10, CaCl2 0.5, NaHCO3 26, glucose 10. The cerebellum was removed and an angled (ca 45 deg to the midline) cut made across the frontal cortex. The block of brain was glued to the cutting stage of a vibratome from which 300 μm slices of the SC were prepared. In this way the integrity of retinal input to the superficial layers of the SC is maintained as it enters the SC. The slices were transferred to oxygenated Krebs medium containing (mm): NaCl 124, KCl 2, KH2PO4 1.25, MgSO4 5, CaCl2 1, NaHCO3 26, glucose 10. After 1 h, a slice was transferred to an interface recording chamber where it was perfused with Krebs medium containing (mm): NaCl 124, KCl 2, KH2PO4 1.25, MgSO4 1, CaCl2 2, NaHCO3 26, glucose 10.
The retinal input to the SC was stimulated submaximally (0.1 ms, 50-200 μA, 0.1 Hz) via a bipolar tungsten-in-glass electrode positioned in the optic tract approximately 100-200 μm outside of the SC. In this way stimulation of fibres and cell bodies intrinsic to the SC was avoided. Extracellular recordings were made via a Krebs-filled glass micropipette (5-10 μm tip diameter) positioned in the superficial grey layer of the SC. Responses were recorded with an Axoprobe-1A amplifier (Axon Instruments), digitised (10 kHz) via a CED1401 interface and stored on a computer with Spike2 software (Cambridge Electronic Design). Responses to stimuli were waveform averaged (six trials), and peak amplitude and area-under-the-curve measurements made. DHPG and antagonists were added to bathing medium in order to investigate the actions of Group I mGluRs. The effects of these agents were assessed after 10 min contact time with the slice. In order to investigate the effects of mGluR activation on excitatory transmission without contamination from GABAergic potentials, 100 μM picrotoxin and 3 μM CGP55845 (GABAA and GABAB receptor antagonists, respectively) were added to the perfusate in most experiments.
Chemicals
2-Methyl-6-(phenylethynyl)-pyridine (MPEP) and CGP55845 were gifts from Novartis. LY367385 was a gift from Lily Research Labs. DHPG, AMPA, NMDA, 4CPG and picrotoxin were from Tocris Cookson (Bristol, UK).
RESULTS
Activation of Group I mGluRs reduces synaptic responses in vivo
Iontophoretic application of the Group I agonist DHPG (ejection currents +25 to +150 nA) in vivo resulted in a reduction of the visual responses to 71 ± 3.1 % of control values (n = 18, P < 0.05). This inhibition was fully reversible once agonist ejection ceased, as shown in Fig. 1A. In contrast, DHPG had no significant effect upon the rate of spontaneous action potential firing of these neurones (97 ± 5.7 % of control). Interestingly, in two cells application of DHPG caused both inhibition and facilitation of visual responses when different ejection currents were used. When current (+25 to +150 nA) was passed through a barrel containing 100 mm NaCl solution as a current control, the effect of Na+ application did not significantly affect the visual responses (96 ± 3 % of control, n = 8). As some studies have demonstrated that ejection of H+ can have an excitatory effect (Krnjevic & Phillis, 1963), and as the solution of DHPG was at pH 3.5, current was also passed through a barrel containing 100 mm NaCl solution adjusted to the same pH with addition of 1 m HCl. Ejection of H+-Na+ from this barrel (+25 to +100 nA) did not significantly affect the visual responses (102 ± 2.1 % of control, n = 6), as illustrated in Fig. 1B.
Figure 1. Group I activation causes a reduction of visual responses.
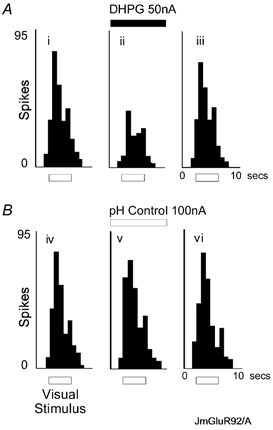
A, iontophoretic application of DHPG (50 nA) reversibly inhibited visual responses. The histograms show cumulative counts of action potential spikes (200 ms epochs) in response to 10 visual stimuli of a neurone under control conditions (i), during DHPG iontophoresis (ii) and recovery from DHPG effects (iii). Visual stimuli were presented during the period marked by the bar, and were 5 by 10 deg bars moving at 22.5 deg s−1 for 4 s every 10 s. The moving bars were of preferred orientation and direction. B, application of H+-Na+ from an acidified saline solution did not affect visual responses of the same neurone as in A.
In order to verify that the actions of DHPG on visual responses were indeed mediated via Group I mGlu receptors, we investigated whether the DHPG effects could be reversed by the broad-spectrum (i.e. mGlu1 and mGlu5 receptors) antagonist 4CPG (Eaton et al. 1993) and also the selective mGlu1 antagonist LY367385 (Clark et al. 1997). Both of these antagonists reversed the inhibitory actions of DHPG on visual responses, as illustrated in Fig. 2, but only 4CPG had a significant direct effect on visual responses when applied alone (Table 1).
Figure 2. Group I antagonists block the effect of the group I agonist DHPG.
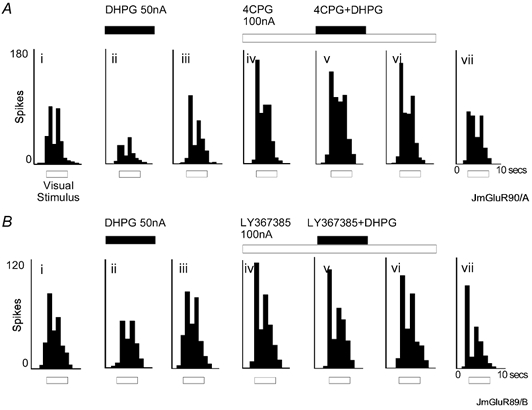
Responses to visual stimuli (for details see Fig. 1) of two neurones (A and B) under control conditions (i), during application of DHPG alone (ii), and recovery from the effect of the agonist (iii). The experimental sequence was then continued with application of either 4CPG (A) or LY367385 (B) (iv-vi) which antagonised the effect of DHPG (v).
Table 1.
Effects of antagonists on DHPG actions in vivo
| Antagonist | DHPG alone | Antagonist alone | DHPG + antagonist | n |
|---|---|---|---|---|
| 4CPG | 72 ± 2.8%* | 131 ± 4.5 %* | 99 ± 4.0 % | 9 |
| LY367385 | 78 ± 3.5 %* | 106 ± 3.0 % | 98 ± 4.8% | 8 |
The table shows the effect of DHPG on visual responses in vivo when applied alone, and when either 4CPG or LY367385 was co-applied with DHPG. All results are expressed as the mean (± S.E.M.) of the control visual response.
P < 0.05 compared to control visual responses.
In order to determine whether application of DHPG in vivo produced its actions via an interaction with ionotropic glutamate receptors, we investigated its effects on responses to iontophoretically applied AMPA (ejection currents −80 to −200 nA) and NMDA (-60 to −200 nA) on eight neurones where DHPG had been found to reduce visual responses. DHPG had no significant effect on responses to either AMPA (116 ± 6.7 % of control) or NMDA (82.5 ± 4.2 % of control).
Activation of Group I mGluRs reduces synaptic responses in vitro
Stimulation of the retinal input with a bipolar tungsten electrode evoked a field potential response manifested as a negative-going potential with a time to peak of 2-3 ms and duration of less than 20 ms. This was reduced in terms of peak amplitude and area under the curve (to 87 ± 7.2 % and 70 ± 5.8 % of control respectively, P < 0.05, n = 5) by addition of 10 μM DHPG to the bathing medium (Fig. 3A). In order to study the actions of DHPG in the absence of possible GABAergic contributions to responses, the GABAA antagonist picrotoxin and GABAB antagonist CGP55845 were added to the perfusate in most experiments. The field EPSP was enhanced in amplitude and duration under these conditions (Fig. 3B). Application of DHPG (1-100 μM) in the presence of the GABA antagonists resulted in reductions of the field EPSP, which reached a maximal effect at 100 μM (Fig. 4). The effects of 10 μM DHPG could be reversed by addition of LY367385 (200 μM) to the bath, but not by addition of the mGlu5 antagonist MPEP (5 μM) (Gasparini et al. 1999) (Figs 4 and 5).
Figure 3. Field potential recordings from SSC in vitro.
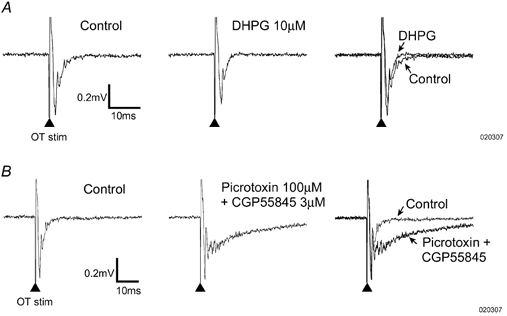
The records show averaged (six trials) field EPSP responses recorded in SSC in response to optic tract stimulation (at the time marked by the arrows). A, the response to stimulation in control medium, during superfusion of 10 μM DHPG, and an overlay of the traces taken under these conditions. B, the effect of superfusing the slice with GABA antagonists on the field EPSP. Note the prominent increase in duration.
Figure 4. Averaged (six trials) field EPSP responses recorded in SSC in response to optic tract stimulation from two different experiments (A and B) where 10 μM DHPG reduced responses.
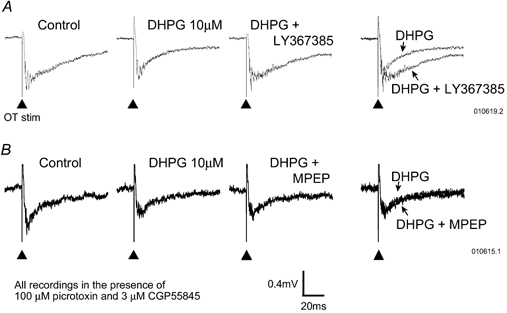
Stimulation was given at the point marked by the arrows. A, the reversal of the DHPG effect by the mGluR1 antagonist LY367385 (200 μM). B, the lack of effect against DHPG of the mGluR5 antagonist MPEP (5 μM). The right hand traces in A and B are overlays of the traces in columns two and three.
Figure 5. Summary histograms of agonist and antagonist effects in the slice preparation.
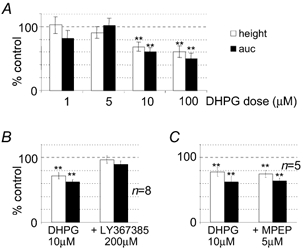
A, the effects of increasing doses of DHPG (1-100 μM) on the field EPSP amplitude, expressed as a percentage of control (mean ± s.e.m.). For comparison, data computed with peak amplitude (height) and area-under-the-curve (auc) measurements are shown. B, the effects of 10 μM DHPG were reversed by LY367385 (200 μM). C, MPEP (5 μM) did not reverse the effects of DHPG. **P < 0.05.
Physiological activation of Group I receptors during visual stimulation
In order to investigate whether the release of endogenous neurotransmitter acting on Group I receptors occurs during visual stimulation, the effect of the antagonist 4CPG on visual responses was studied. Application of 4CPG (-25 to 150 nA) resulted in a significant facilitation of the visual responses in all cases (to 131 ± 4.5 % of control, n = 7, P < 0.05), the opposite effect to that observed with the agonist DHPG on the same neurones, as illustrated in Fig. 6. This indicates that Group I receptors are activated by an endogenous ligand (probably glutamate) during visual transmission in the SSC.
Figure 6. Data from a single neurone showing that the Group I agonist DHPG and Group I antagonist 4CPG have opposing effects on visual responses in vivo.
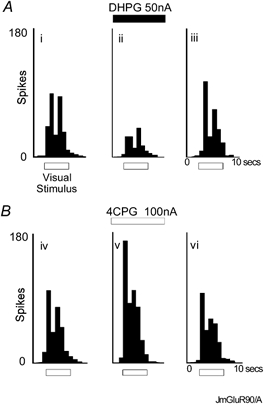
For details of histograms and stimuli see Fig. 1. A, DHPG inhibits visual responses: (i) control, (ii) during DHPG ejection, (iii) recovery, data obtained 120 s after DHPG ejection ceased. B, 4CPG enhances visual responses: (iv) new control, (v) during 4CPG ejection, (vi) recovery, data obtained 120 s after 4CPG ejection ceased.
We have previously reported that the effect of the Group II mGluR antagonist LY341495 is significantly less prominent during presentation of low contrast stimuli than under high contrast conditions, and we have suggested that this may be a reflection of ‘neurotransmitter spillover’ (Scanziani et al. 1997; Rusakov & Kullmann, 1998; Mitchell & Silver, 2000) from the centre of the synaptic cleft (Cirone & Salt, 2001). It is possible to modulate the response magnitude of neurones in the SSC very simply by adjusting the contrast between the stimulus foreground and background. Thus, in the present study, we directly compared the effect of 4CPG under two different stimulus contrast conditions on 10 neurones, and found that the Group I antagonist enhanced visual responses under both stimulus conditions, to a similar extent, as illustrated in Fig. 7. Overall, responses to low contrast stimuli were enhanced to 121 ± 4.7 % of control whereas responses to high contrast stimuli of the same neurones were enhanced to 124 ± 3.4 %. Although these effects on visual responses were significant, there was no significant difference between the effects of 4CPG under low and high contrast conditions.
Figure 7. Similar effects of the antagonist 4CPG under low contrast (A) and high contrast (B) conditions.
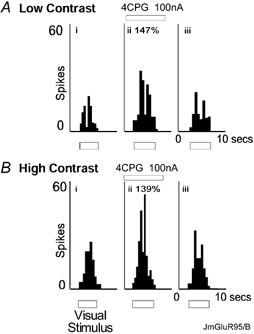
Luminance of foreground object 20 cd m−2 (high contrast) or 12.2 cd m−2 (low contrast). The plots show (i) control, (ii) during antagonist application, (iii) recovery, data obtained 120 s after antagonist ejection.
Previously we have reported that Group III mGluRs specifically modulate response habituation in the SSC (Cirone & Salt, 2001). In view of the reduction of visual responses seen upon DHPG application, we considered the possibility that Group I receptors might also have a role in this process. We thus used the same habituating protocol that we had used in previous studies (Binns & Salt, 1997; Cirone & Salt, 2001) to investigate the possible role of Group I mGluRs in this mechanism. Application of the Group I agonist DHPG or antagonist 4CPG did not significantly affect the extent of response habituation (habituation changed by +1.6 ± 3.9 % and −0.2 ± 2.7 %, respectively, n = 9), as illustrated in Fig. 8.
Figure 8. Group I mGluRs are not involved in response habituation.
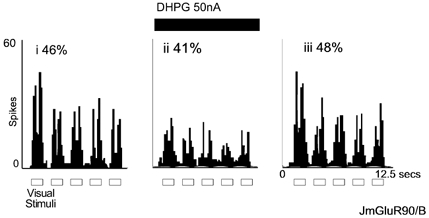
Counts of action potential spikes evoked by five presentations of identical visual stimuli (see Fig. 1 for details) accumulated over five trials. In each panel, the extent of response habituation is shown; (i) control, (ii) reduction of visual response, but little effect on response habituation during DHPG ejection, (iii) recovery, data obtained 75 s after DHPG ejection ceased.
DISCUSSION
Previously, we demonstrated that activation of Group II and III receptors can cause inhibition or facilitation in different cells (Cirone & Salt, 2000, 2001). The present study has demonstrated that activation of Group I receptors causes a reduction of excitatory synaptic transmission in the SSC and that Group I receptors are activated by an endogenous ligand (probably glutamate) during synaptic transmission. In vivo application of DHPG resulted in a reduction of visual responses in all neurones, while in two cells DHPG produced inhibitory and facilitatory effects in the same cell when the agonist was applied at different ejection currents. It may be that this facilitatory effect of DHPG seen in a small number of cases is due to a direct enhancement of transmitter release (Rodriguez-Moreno et al. 1998), or a reduction of GABAergic transmission (Gereau & Conn, 1995). The latter may be more likely, as in vitro, under GABA receptor blockade, only inhibitory effects of DHPG on synaptic potentials were seen. It is thus likely that different effects in vivo result from activation of receptors on different cells, possibly including GABAergic interneurones. The finding that the action of DHPG can be reversed by the subtype-selective antagonist LY367385, both in vivo and in vitro, suggests that the effect of DHPG is mediated primarily via mGluR1.
Evidence from several brain areas suggests that Group I mGluRs are located predominantly in the postsynaptic region (Martin et al. 1992; Shigemoto et al. 1993, 1997; Romano et al. 1995) although presynaptic locations have also been identified (Romano et al. 1995). In the in vivo preparation, it is difficult to determine whether an agonist has an effect at pre- or postsynaptic sites. However, it is possible to detect a possible postsynaptic effect by examining the effect upon responses evoked by application of ionotropic glutamate receptor agonists, and indeed Group I receptor activation has been shown to potentiate such responses in various brain areas (Bond & Lodge, 1995; Salt & Binns, 2000). Nevertheless, in the present study, DHPG did not significantly affect AMPA- or NMDA-evoked responses, suggesting that the Group I receptors involved in synaptic modulation in the SSC are not located in the postsynaptic region of the SSC relay cell and that receptors on presynaptic elements are more likely targets. It is well known that all three groups of mGluRs (Conn & Pin, 1997), including Group I receptors (Gereau & Conn, 1995; Rodriguez-Moreno et al. 1998), can enhance or reduce glutamate release at different synapses. It is therefore possible that the inhibitory effects of DHPG on visual responses in the SSC result, at least partly, from an inhibition of glutamate release, either at the retino-collicular synapse or the cortico-collicular synapse, where there is evidence for mGluR1 (Martin et al. 1992; Shigemoto et al. 1992; Baude et al. 1993; Fotuhi et al. 1993; Hartveit et al. 1995) and mGluR5 (Abe et al. 1992; Shigemoto et al. 1993; Romano et al. 1995). However, it is not possible to exclude postsynaptic actions at present, and it is noteworthy that direct effects of DHPG on collicular neurones in vitro have been noted by other workers (White et al. 2001).
Application of the Group I antagonist 4CPG in vivo produced a facilitation of visual responses indicating that Group I receptors are physiologically activated by endogenous glutamate during transmission of visual information in the SSC. In other brain regions there is ultrastructural evidence for Group I mGluRs being located at the periphery of synapses (Baude et al. 1993; Vidnyanszky et al. 1996; Lujan et al. 1997), although there is no ultrastructural evidence available demonstrating the subsynaptic location of any mGluR in the rat SSC. In vitro data indicate that extrasynaptic receptors may have a modulatory role during increased levels of synaptic activity when they will be activated by diffusion of neurotransmitter from the synaptic cleft (Scanziani et al. 1997; Rusakov & Kullmann, 1998; Mitchell & Silver, 2000). In order to probe the possibility that Group I mGluRs may be differentially activated by different levels of synaptic activity, a comparison of the effect of 4CPG was examined during presentation of low contrast visual stimuli and high contrast stimuli. We have previously reported that Group II mGluRs are differentially activated in this manner (Cirone & Salt, 2001); however, there was no significant difference in effect of the Group I antagonist under these two stimulus conditions. This suggests that activation of Group I mGluRs is not activity dependent under these conditions.
The present study has revealed that Group I receptors produce reduction of visual transmission, probably due to inhibition of glutamate release at the retino-collicular or cortico-collicular synapse. Although this is superficially similar to our previous findings concerning Group II and III receptors (Cirone & Salt, 2000, 2001), there are important differences. We have previously demonstrated that Group III mGluRs mediate a component of response habituation in the SSC (Cirone & Salt, 2001). In contrast, Group I mGluRs do not appear to be involved in modulating response habituation in the SSC as neither DHPG nor 4CPG affected response habituation. This indicates that the different groups of mGluRs have a variety of complex and distinct modulatory effects, some of which are driven by different types of visual stimuli. Glutamate, by activating both ionotropic and metabotropic receptors will therefore be able to evoke a wide range of physiological responses which may ultimately result in modulation of behavioural responses to novel sensory events.
Acknowledgments
This work was supported by the MRC and The Wellcome Trust. We are grateful to Lilly Research Labs and Novartis for generous provision of LY367385, MPEP and CGP55845.
REFERENCES
- Abe T, Sugihara H, Nawa H, Shigemoto R, Mizuno N, Nakanishi S. Molecular characterization of a novel metabotropic glutamate receptor mGluR5 coupled to inositol phosphate/Ca2+ signal transduction. Journal of Biological Chemistry. 1992;267:13361–13368. [PubMed] [Google Scholar]
- Baude A, Nusser Z, Roberts JDB, Mulvihill E, McIlhinney RAJ, Somogyi P. The metabotropic glutamate receptor (mGluR1alpha) is concentrated at perisynaptic membrane of neuronal subpopulations as detected by immunogold reaction. Neuron. 1993;11:771–787. doi: 10.1016/0896-6273(93)90086-7. [DOI] [PubMed] [Google Scholar]
- Binns KE, Salt TE. Excitatory amino acid receptors participate in synaptic transmission of visual responses in the superficial layers of the cat superior colliculus. European Journal of Neuroscience. 1994;6:161–169. doi: 10.1111/j.1460-9568.1994.tb00257.x. [DOI] [PubMed] [Google Scholar]
- Binns KE, Salt TE. Different roles for GABAA and GABAB receptors in visual processing in the rat superior colliculus. Journal of Physiology. 1997;504:629–639. doi: 10.1111/j.1469-7793.1997.629bd.x. [DOI] [PMC free article] [PubMed] [Google Scholar]
- Bond A, Lodge D. Pharmacology of metabotropic glutamate receptor-mediated enhancement of responses to excitatory and inhibitory amino acids on rat spinal neurones in vivo. Neuropharmacology. 1995;34:1015–1023. doi: 10.1016/0028-3908(95)00046-9. [DOI] [PubMed] [Google Scholar]
- Brauer K, Shober W, Winkelmann E. Two morphologically different types of retinal axon terminals in the rat's dorsal lateral geniculate nucleus and their relationships to the X and Y Channel. Experimental Brain Research. 1979;36:523–532. doi: 10.1007/BF00238520. [DOI] [PubMed] [Google Scholar]
- Cirone J, Pothecary CA, Turner JP, Salt TE. Group I metabotropic glutamate receptors (mGluRs) inhibit visual responses in the superior colliculus (SC) Society for Neuroscience Abstracts. 2001;27:723. [Google Scholar]
- Cirone J, Salt TE. Physiological role of group III metabotropic glutamate receptors in visually responsive neurones of the rat superficial superior colliculus. European Journal of Neuroscience. 2000;12:847–855. doi: 10.1046/j.1460-9568.2000.00972.x. [DOI] [PubMed] [Google Scholar]
- Cirone J, Salt TE. Group II and III metabotropic glutamate (mGlu) receptors contribute to different aspects of visual response processing in the superior colliculus. Journal of Physiology. 2001;534:169–178. doi: 10.1111/j.1469-7793.2001.00169.x. [DOI] [PMC free article] [PubMed] [Google Scholar]
- Cirone J, Sharp C, Jeffery G, Salt TE. Distribution of metabotropic glutamate receptors in the superior colliculus of the adult rat, ferret and cat. Neuroscience. 2002;109:779–786. doi: 10.1016/s0306-4522(01)00485-7. [DOI] [PubMed] [Google Scholar]
- Clark BP, Baker SR, Goldsworthy J, Harris JR, Kingston AE. (+)-2-Methyl-4-carboxyphenylglycine ( LY367385) selectively antagonises metabotropic glutamate mGluR1 receptors. Bioorganic and Medicinal Chemistry Letters. 1997;7:2777–2780. [Google Scholar]
- Conn PJ, Pin JP. Pharmacology and functions of metabotropic glutamate receptors. Annual Review of Pharmacology and Toxicology. 1997;37:207–237. doi: 10.1146/annurev.pharmtox.37.1.205. [DOI] [PubMed] [Google Scholar]
- Eaton SA, Jane DE, Jones PLSJ, Porter RHP, Pook PCK, Sunter DC, Udvarhelyi PM, Roberts PJ, Salt TE, Watkins JC. Competitive antagonism at metabotropic glutamate receptors by (S)-4-carboxyphenylglycine (CPG) and (RS)-α-methyl-4-carboxyphenylglycine. European Journal of Pharmacology. 1993;244:195–197. doi: 10.1016/0922-4106(93)90028-8. [DOI] [PubMed] [Google Scholar]
- Fotuhi M, Sharp AH, Glatt CE, Hwang PM, Von Krosigk M, Snyder SH, Dawson TM. Differential localization of phosphoinositide-linked metabotropic glutamate receptor (mGluR1) and the inositol 1,4,5-trisphosphate receptor in rat brain. Journal of Neuroscience. 1993;13:2001–2012. doi: 10.1523/JNEUROSCI.13-05-02001.1993. [DOI] [PMC free article] [PubMed] [Google Scholar]
- Gasparini F, Lingenhohl K, Stoehr N, Flor PJ, Heinrich M, Vranesic I, Biollaz M, Allgeier H, Heckendorn R, Urwyler S, Varney MA, Johnson EC, Hess SD, Rao SP, Sacaan AI, Santori EM, Velicelebi G, Kuhn R. 2-Methyl-6-(phenylethynyl)-pyridine (MPEP), a potent, selective and systemically active mGlu5 receptor antagonist. Neuropharmacology. 1999;38:1493–1503. doi: 10.1016/s0028-3908(99)00082-9. [DOI] [PubMed] [Google Scholar]
- Gereau RW, Conn PJ. Multiple presynaptic metabotropic glutamate receptors modulate excitatory and inhibitory synaptic transmission in hippocampal area CA1. Journal of Neuroscience. 1995;15:6879–6889. doi: 10.1523/JNEUROSCI.15-10-06879.1995. [DOI] [PMC free article] [PubMed] [Google Scholar]
- Hartveit E, Brandstatter JH, Enz R, Wässle H. Expression of the mRNA of seven metabotropic glutamate receptors (mGluR1 to 7) in the rat retina. An in situ hybridization study on tissue sections and isolated cells. European Journal of Neuroscience. 1995;7:1472–1483. doi: 10.1111/j.1460-9568.1995.tb01142.x. [DOI] [PubMed] [Google Scholar]
- Krnjevic K, Phillis JW. Iontophoretic studies of neurones in the mammalian cerebral cortex. Journal of Physiology. 1963;165:274–304. doi: 10.1113/jphysiol.1963.sp007057. [DOI] [PMC free article] [PubMed] [Google Scholar]
- Lam K, Sefton AJ, Bennet MR. Loss of axons from the optic nerve of the rat during early postnatal development. Developmental Brain Research. 1982;3:487–491. doi: 10.1016/0165-3806(82)90014-1. [DOI] [PubMed] [Google Scholar]
- Lujan R, Roberts JDB, Shigemoto R, Ohishi H, Somogyi P. Differential plasma membrane distribution of metabotropic glutamate receptors mGluR1 alpha, mGluR2 and mGluR5, Relative to neurotransmitter release sites. Journal of Chemical Neuroanatomy. 1997;13:219–241. doi: 10.1016/s0891-0618(97)00051-3. [DOI] [PubMed] [Google Scholar]
- Lund RD. The occipitotectal pathway of the rat. Journal of Anatomy. 1966;100:51–62. [PMC free article] [PubMed] [Google Scholar]
- Martin LJ, Blackstone CD, Huganir RL, Price DL. Cellular localization of a metabotropic glutamate receptor in rat brain. Neuron. 1992;9:259–270. doi: 10.1016/0896-6273(92)90165-a. [DOI] [PubMed] [Google Scholar]
- Mitchell SJ, Silver RA. Glutamate spillover suppresses inhibition by activating presynaptic mGluRs. Nature. 2000;404:498–502. doi: 10.1038/35006649. [DOI] [PubMed] [Google Scholar]
- Perry VH. A tectocortical visual pathway in the rat. Neuroscience. 1980;5:915–927. doi: 10.1016/0306-4522(80)90160-8. [DOI] [PubMed] [Google Scholar]
- Roberts WA, Eaton SA, Salt TE. Excitatory amino acid receptors mediate synaptic responses to visual stimuli in superior colliculus neurones of the rat. Neuroscience Letters. 1991;129:161–164. doi: 10.1016/0304-3940(91)90451-x. [DOI] [PubMed] [Google Scholar]
- Rodriguez-Moreno A, Sistiaga A, Lerma J, Sanchez-Prieto J. Switch From facilitation to inhibition of excitatory synaptic transmission by group I mGluR desensitization. Neuron. 1998;21:1477–1486. doi: 10.1016/s0896-6273(00)80665-0. [DOI] [PubMed] [Google Scholar]
- Romano C, Sesma MA, McDonald CT, O'Malley K, Van Den Pol AN, Olney JW. Distribution of metabotropic glutamate receptor mGluR5 immunoreactivity in rat brain. Journal of Comparative Neurology. 1995;355:455–469. doi: 10.1002/cne.903550310. [DOI] [PubMed] [Google Scholar]
- Rusakov DA, Kullmann DM. Extrasynaptic glutamate diffusion in the hippocampus: ultrastructural constraints, uptake, and receptor activation. Journal of Neuroscience. 1998;18:3158–3170. doi: 10.1523/JNEUROSCI.18-09-03158.1998. [DOI] [PMC free article] [PubMed] [Google Scholar]
- Salt TE, Binns KE. Contributions of mGlu1 and mGlu5 receptors to interactions with N-methyl-d-aspartate receptor-mediated responses and nociceptive sensory responses of rat thalamic neurones. Neuroscience. 2000;100:375–380. doi: 10.1016/s0306-4522(00)00265-7. [DOI] [PubMed] [Google Scholar]
- Scanziani M, Salin PA, Vogt KE, Malenka RC, Nicoll RA. Use-dependent increases in glutamate concentration activate presynaptic metabotropic glutamate receptors. Nature. 1997;385:630–634. doi: 10.1038/385630a0. [DOI] [PubMed] [Google Scholar]
- Shigemoto R, Kinoshita A, Wada E, Nomura S, Ohishi H, Takada M, Flor PJ, Neki A, Abe T, Nakanishi S, Mizuno N. Differential presynaptic localization of metabotropic glutamate receptor subtypes in the rat hippocampus. Journal of Neuroscience. 1997;17:7503–7522. doi: 10.1523/JNEUROSCI.17-19-07503.1997. [DOI] [PMC free article] [PubMed] [Google Scholar]
- Shigemoto R, Nakanishi S, Mizuno N. Distribution of the mRNA for a metabotropic glutamate receptor (mGluR1) in the central nervous system: An in situ hybridization study in adult and developing rat. Journal of Comparative Neurology. 1992;322:121–135. doi: 10.1002/cne.903220110. [DOI] [PubMed] [Google Scholar]
- Shigemoto R, Nomura S, Ohishi H, Sugihara H, Nakanishi S, Mizuno N. Immunohistochemical localization of a metabotropic glutamate receptor, mGluR5, in the rat brain. Neuroscience Letters. 1993;163:53–57. doi: 10.1016/0304-3940(93)90227-c. [DOI] [PubMed] [Google Scholar]
- Sparks DL, Nelson JS. Sensory and motor maps in the mammalian superior colliculus. Trends in Neurosciences. 1987;10:312–317. [Google Scholar]
- Stein BE, Meredith MA. The Merging of the Senses. Cambridge, MA, USA: MIT Press; 1993. [Google Scholar]
- Vidnyanszky Z, Görcs TJ, Negyessy L, Kuhn R, Knöpfel T, Hamori J. Immunohistochemical visualization of the mGluR1a metabotropic glutamate receptor at synapses of corticothalamic terminals originating from area 17 of the rat. European Journal of Neuroscience. 1996;8:1061–1071. doi: 10.1111/j.1460-9568.1996.tb01273.x. [DOI] [PubMed] [Google Scholar]
- White A, Irving A, Platt B. Pre- and postsynaptic actions of group I metabotropic glutamate receptors in the rat SC. Society for Neuroscience Abstracts. 2001;27:913. [Google Scholar]