

Abstract
At distal dendritic locations, the threshold for action potential generation is higher and the amplitude of back-propagating spikes is decreased. To study whether these characteristics depend upon Na+ channels, their voltage-dependent properties at proximal and distal dendritic locations were compared in CA1 hippocampal neurons. Distal Na+ channels activated at more hyperpolarized voltages than proximal (half-activation voltages were −20.4 ± 2.4 mV vs. −12.0 ± 1.7 mV for distal and proximal patches, respectively, n = 16, P < 0.01), while inactivation curves were not significantly different. The resting membrane potential of distal regions also appeared to be slightly but consistently more hyperpolarized than their proximal counterpart. Staurosporine, a non-selective protein kinase inhibitor, shifted the activation curves for both proximal and distal Na+ channels to the left so that they overlapped and also caused the resting potentials to be comparable. Staurosporine affected neither the inactivation kinetics of Na+ currents nor the reversal potential for Na+. These results suggest that the difference in the voltage dependence of activation of distal and proximal Na+ channels can be attributed to a different phosphorylation state at the two locations.
Dendritic Na+ channels are responsible for the back-propagation of axonally initiated action potentials into the dendrites and, in some conditions, for the local initiation of dendritic action potentials. Also, Na+ currents in dendrites can, along with Ca2+ currents, amplify or boost distal synaptic inputs (Lipowsky et al. 1996; Gillessen & Alzheimer, 1997) and thus contribute to synaptic integration by decreasing signal attenuation due to passive cable properties (Stuart et al. 1997; Magee et al. 1998). In hippocampal CA1 pyramidal neurons, Na+ channels are found throughout the soma and the dendritic arborization at a constant density (Magee & Johnston, 1995). Somatic and dendritic Na+ channels share rapid activation and inactivation kinetics, but the magnitude of cumulative inactivation increases with distance along the apical dendrites (Colbert et al. 1997; Jung et al. 1997; Mickus et al. 1999). This ‘slow’ or ‘cumulative’ inactivation is responsible for the frequency-dependent attenuation of dendritic action potentials (Callaway & Ross, 1995; Spruston et al. 1995; Colbert et al. 1997), which is strongly reduced by muscarinic agonists (Tsubokawa & Ross, 1997) and by activation of protein kinase C (Colbert & Johnston, 1998).
At distal locations, the ability of dendrites to initiate action potentials is greatly reduced and the amplitude of back-propagating action potentials is decreased (Stuart et al. 1997; Magee et al. 1998). In CA1 pyramidal neurons, this has been attributed primarily to a higher expression of A type K+ channels in distal dendrites (Hoffman et al. 1997), but could be also due to changes in the activation properties of Na+ channels along the dendritic tree. As these properties have not been thoroughly investigated to date, the aim of this work was to compare the voltage dependence of activation and inactivation of Na+ channels at proximal and distal locations. We have found that distal Na+ channels are activated at more hyperpolarized voltages than proximal, while the inactivation curves do not significantly differ. Moreover, staurosporine (a non-specific inhibitor of protein kinases) shifted the activation curve for both proximal and distal Na+ channels to the left, removing their difference.
METHODS
Hippocampal slices, 400 μm thick, were prepared from 7- to 12-week-old Sprague-Dawley rats as previously described (Magee, 1998). According to methods approved by the LSUHSC Institutional Animal Care and Use Committee, rats were given a lethal dose of ketamine and xylazine, perfused through the ascending aorta with an oxygenated solution just before death and decapitated.
Dendrites from hippocampal CA1 pyramidal cells were visualized using a Zeiss Axioskop equipped with infrared video microscopy and differential interference contrast (DIC) optics.
The external solution used for recordings contained (mm): NaCl 125, KCl 2.5, NaHCO3 25, NaHPO4 1.25, CaCl2 2, MgCl2 1 and glucose 25 and was saturated with 95 % O2-5 % CO2 at room temperature. Pipettes (5-10 MΩ) were pulled from borosilicate glass and coated with Sylgard. Cell-attached pipette solution contained (mm): NaCl 110, Hepes 10, CaCl2 2, MgCl2 1, tetraethylammonium chloride 30, 4-aminopyridine 15, glucose 10 (pH 7.4). The data presented here were obtained from a total of 73 proximal and 70 distal patches.
Currents were recorded using an Axopatch 200B amplifier (Axon Instruments, Union City, CA, USA) in the patch configuration. Recordings were filtered at 2 kHz (4-pole low-pass Bessel) and digitized at 50 kHz. At the end of the experiments, the membrane of the patch was ruptured to measure the actual membrane potential, so that voltage steps relative to rest could be converted into absolute voltages. Vm was measured immediately after patch rupture, when dialysis of the intracellular medium was not relevant due to high access resistance (>50 MΩ, Magee & Johnston, 1995).
Ensemble traces were obtained by averaging 10 to 30 sweeps per test potential. Leakage and capacitative currents were subtracted offline by scaling traces evoked from −90 to −60 mV and from −30 to −10 mV for activation and inactivation protocols, respectively. In some (n = 3) experiments tetracaine (50 μM) was added to the bath and blocked channel activity in the patch, showing that only Na+ channels were present in our experimental conditions.
Staurosporine was dissolved in DMSO (final concentration 0.05 %). Staurosporine affected Na+ channels in cell-attached patches within 2-3 min after obtaining the seal and the effect appeared to be complete in 5-10 min. Traces were thus averaged 10-20 min after obtaining the seal for staurosporine experiments.
Curve fittings were performed using a least-square program (IgorPro, WaveMetrics Inc., Lake Oswego, OR, USA). For steady-state activation curves, the chord conductance values at different test potentials (Vt) were calculated using a reversal potential for Na+ (ENa) of +54 mV (see Magee & Johnston, 1995) and normalized to the maximal value. The following single Boltzmann equations were used to fit the values of normalized chord conductance and normalized current amplitude for activation and inactivation plots, respectively, and to obtain the half-maximal voltage, V1/2, and the slope factor, k, for every patch:
and
Data are reported as means ± s.e.m. Statistical comparisons were performed by using Student's t test (unpaired sampled, two-tailed). Means were considered to be significantly different when P < 0.05.
RESULTS
The voltage dependence of activation and inactivation of Na+ channels was studied in cell-attached patches from proximal (40-100 μm) and distal (> 200 μm) dendrites. To study activation properties, a −20 mV holding potential was applied to the patch (from a Vm of about −70 mV) to remove Na+ channel inactivation. Patches were subsequently depolarized for 20 ms to different test voltages (Vt, from −50 to +20 mV in 10 mV increments, every 3 s, Fig. 1Aa). Ensemble traces like those in Fig. 1Ab and c were obtained by averaging 10 to 30 sweeps per test potential. The threshold for activation of Na+ channels appeared to be variable between −50 and −30 mV, depending on the patch and recording location. In general, Na+ channels in the distal patches appeared to have a lower threshold for activation than proximal, as is visible in Fig. 1A for two representative patches. As the patches were stepped to more depolarized Vt, peak current amplitudes increased, reflecting an increase in the open probability and a higher synchronization of openings and the peaks appeared to shift to the left, as activation and inactivation rates became faster. Normalized chord conductance was calculated from peak current values and plotted as a function of Vt to generate individual steady-state activation curves, which were well fitted by Boltzmann functions. The activation curves for distal patches appeared to be more hyperpolarized than for proximal (Fig. 1C). Mean V1/2 obtained from individual steady-state activation curves were −12.0 ± 1.7 mV and −20.4 ± 2.4 mV (P < 0.01), while k were 8.1 ± 0.3 and 8.2 ± 0.4 (P > 0.5) for 16 proximal and 16 distal patches, respectively. To analyse the voltage dependence of inactivation, patches were held for 800 ms at different potentials (from −110 to −40 mV) and then stepped to −10 or 0 mV for 20 ms (Fig. 1Ba). Ensemble current amplitude values obtained from traces like those shown in Fig. 1Bb and c were normalized to the maximal value and plotted as a function of the prepulse potential to generate inactivation plots that were well fitted by Boltzmann functions (Fig. 1C). The inactivation curves did not significantly differ for proximal and distal patches: mean V1/2 of inactivation and k were respectively −66.8 ± 2.6 mV and 6.8 ± 0.3 for proximal patches and −63.6 ± 2.3 mV and 6.3 ± 0.2 for distal patches (n = 13, P > 0.2).
Figure 1. Proximal and distal dendritic Na+ channels differ in their activation voltage dependence.
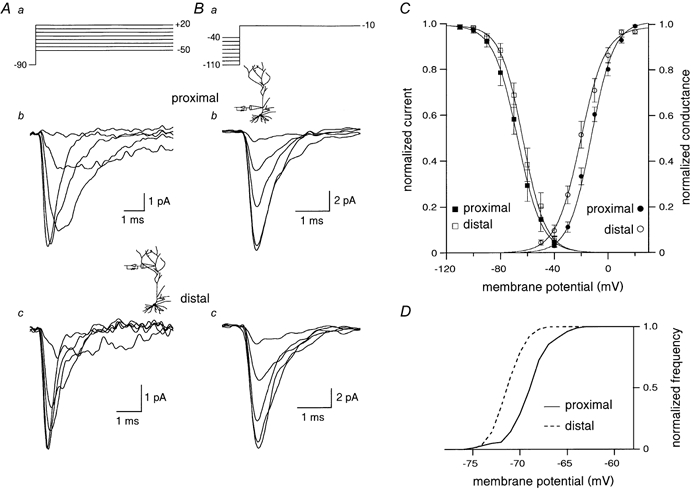
A, Na+ channel steady state activation. Cell-attached patches were voltage clamped at −20 mV with respect to rest and dendritic Na+ channels were activated by 20 ms depolarizing voltage steps. At the end of each experiment, the cell-attached patch was ruptured and the resting membrane potential was measured, so that voltages relative to rest could be converted into absolute values (see protocol in a). Ensemble average traces refer to steps to −37, −27, −17, −7 and +3 mV from a holding potential (Vh) of −87 mV for a proximal (b) and to −39, −29, −19, −9 and +1 mV from a Vh of −89 mV for a distal patch (c). Note that proximal Na+ channels appear to require a higher depolarization to activate. B, Na+ channel steady-state inactivation. The protocol shown in a was used to generate ensemble average traces from proximal (b) and distal (c) patches. Traces shown refer to steps from −90, −80, −70, −60 and −50 mV to −10 mV for b and to −91, −81, −71, −61 and −51 mV to −11 mV for c. C, average steady-state activation (circles) and inactivation (squares) curves. For the activation plot, the values of chord conductance were calculated from traces like those in A for 16 proximal and 16 distal patches, binned in 10 mV intervals, averaged and plotted as a function of Vt. For the inactivation curve, peak amplitudes were measured from 13 distal and 13 proximal patches, normalized, averaged in 10 mV intervals and plotted as a function of the prepulse potential. Curves represent Boltzmann functions fitted to the data points. D, cumulative frequency distribution of resting membrane potentials recorded from proximal and distal patches. Distal regions appeared to be characterized by a more hyperpolarized Vm than proximal.
Proximal and distal recordings were also characterized by different resting membrane potential. As visible from the cumulative frequency distribution in Fig. 1D, distal patches appeared to be more hyperpolarized than proximal (on average, −70.9 ± 0.2 mV vs. −68.8 ± 0.3 mV, P < 10−8, n = 53 and 52, respectively).
A possible explanation for the difference in activation curves could be a different phosphorylative state of Na+ channels at proximal and distal locations, as it has been shown for A-type K+ channels (Hoffmann & Johnston, 1998). In particular, distal Na+ channels could be less phosphorylated than proximal. Since phosphorylation has been reported to slow the inactivation kinetics, we compared the inactivation time constants of proximal and distal Na+ currents. Ensemble current inactivation was best fitted by a single exponential function (Fig. 2A). When the inactivation time constants were binned in 10 mV intervals for both proximal and distal patches, distal currents appeared to inactivate significantly faster at all voltages (Fig. 2B). However, this appeared to be a consequence of the different voltage dependence of activation for the two groups, since when the inactivation time constants for distal and proximal currents were plotted as a function of the fraction of activation of Na+ channels, the distributions for the two groups almost overlapped (Fig. 2C).
Figure 2. Distal and proximal Na+ channels display similar inactivation time constants.
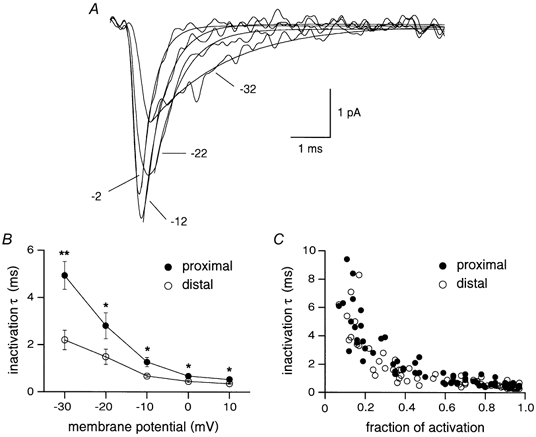
A, ensemble average traces obtained by depolarizing a distal patch from −92 mV to the voltages indicated. Smooth curves represent least-squares fits of ensemble currents to single exponential functions and gave the following values of inactivation time constants: 1.8 ms at −32 mV, 0.9 ms at −22 mV, 0.6 ms at −12 mV and 0.4 ms at −2 mV. B, plot of average inactivation time constants as a function of the membrane potential. Inactivation rates for proximal and distal patches were significantly different at every potential (**P < 0.005, *P < 0.05). C, inactivation time constants for distal and proximal patches appeared to be similarly distributed when plotted against the fraction of activation of Na+ channels.
We have specifically examined the hypothesis that phosphorylation could account for the difference in the activation voltage dependence of Na+ channels in another set of experiments in which staurosporine (0.5 μM) was added to the pipette solution. At this concentration staurosporine is thought to be a non-specific inhibitor of various kinases (Rüegg & Burgess, 1989). First of all, we checked whether staurosporine could change ENa. The calculated ENa did not significantly (P > 0.5, one-way ANOVA) change in the presence of staurosporine, as exemplified by representative traces recorded from proximal and distal locations in control conditions and in the presence of staurosporine (Fig. 3A). In particular ENa was 55.8 ± 3.8 mV (n = 7) and 54.4 ± 1.3 mV (n = 10) in control conditions for proximal and distal locations, respectively. In the presence of staurosporine, the average reversal potential was 54.0 ± 1.4 mV (n = 9) and 57.5 ± 3.8 mV (n = 7) for proximal and distal patches, respectively (Fig. 3B). Nevertheless, staurosporine induced a shift in the activation threshold of Na+ channels, both for proximal and distal patches (Fig. 4A and B). The voltage ranges of activation for both proximal and distal patches were shifted to the left, but the effect was more dramatic for proximal Na+ channels, so that the curves for the two locations tended to overlap (Fig. 4C). The average V1/2 were −28.3 ± 1.0 mV (n = 9) for proximal and −28.4 ± 1.7 mV (n = 7) for distal patches (P > 0.5). The values for the slope factor k were 6.8 ± 0.3 and 7.9 ± 0.5 for proximal and distal patches, respectively (P > 0.05). In addition, staurosporine shifted the membrane potential of proximal recordings to more hyperpolarized voltages, so that it became comparable to distal (Fig. 4D). In particular, the mean Vm recorded after rupturing the patch in the presence of staurosporine were −70.8 ± 0.5 mV (n = 21) for proximal patches and −70.5 ± 0.4 mV (n = 17, P > 0.2) for distal. The analysis of inactivation kinetics showed that inhibition of kinases by staurosporine sped inactivation kinetics and that inactivation time constants for the two groups became comparable at every voltage (P > 0.05, Fig. 4E). However, the hastening of inactivation was merely a consequence of the leftward shift in the activation curves induced by staurosporine, since the distributions of the inactivation time constants as a function of the fraction of activation of Na+ channels overlapped for the four conditions (Fig. 4F).
Figure 3. Staurosporine does not affect ENa.
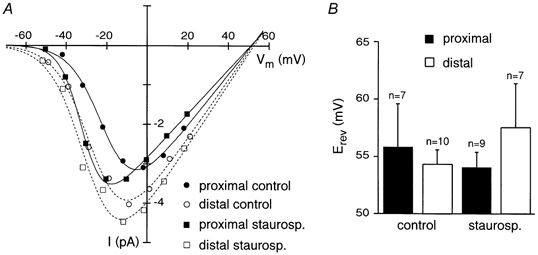
A, I-V relations for four representative patches recorded at proximal and distal locations in control and in the presence of staurosporine. Peak amplitude values at different Vt were interpolated using the equation y0 =Gmax(V - ENa)/(1 + exp((V1/2 - V)/k)) (where Gmax is the maximal conductance of Na+ channels in the patch). B, plot of the mean values of calculated ENa obtained from proximal and distal patches in control conditions and in the presence of staurosporine.
Figure 4. Staurosporine causes a hyperpolarizing shift of the activation curves for both proximal and distal Na+ channels.

A, ensemble average traces obtained by depolarizing a proximal patch to −39, −19, 1 and 21 mV from a holding potential of −89 mV. B, ensemble traces recorded from depolarizing steps to −40, −20, 0 and 20 mV from a Vh of −90 mV in a distal patch. C, average steady-state activation curves obtained from traces like those in A and B from 9 proximal and 7 distal patches. The control activation curves are reported for comparison (dashed lines). D, cumulative frequency distribution for membrane resting potentials recorded from proximal and distal patches. E, plot of average inactivation time constants obtained in the presence of staurosporine as a function of membrane potential. F, plot of inactivation rate constants vs. the fraction of activation for proximal and distal Na+ channels recorded in control conditions and in the presence of staurosporine.
DISCUSSION
We have shown that Na+ channels in distal dendrites are activated at substantially more hyperpolarized voltages compared to those located at proximal regions, while inactivation ranges did not significantly differ. These voltage-dependent properties should allow distal Na+ channels to be more easily activated than proximal channels and should lower the local threshold for action potential generation at distal locations. Despite these properties, Na+-dependent spikes are smaller and more difficult to evoke at distal sites, implying that other elements such as A-type K+ channels, relative proximity to the axonal initiation site and dendrite geometry (Hoffman et al. 1997; Häusser et al. 2000; Vetter et al. 2001) are the major determinants of dendritic action potential threshold and spike back-propagation.
It is worth noting that Magee & Johnston (1995) reported a V1/2 of activation of about −30 mV for dendritic Na+ channels. The differences may be due to the different ages of rats used in the two sets of experiments (2-8 weeks for the previous paper vs. 7-12 weeks for the present study). Interestingly, Na+ channel subunit expression has been reported to change during development (Gong et al. 1999).
What mechanism produces the different activation voltage dependence of distal and proximal dendritic Na+ channels? Na+ channels are an excellent substrate for kinases and phosphatases (Li et al. 1993; Murphy et al. 1993; see Cantrell & Catterall, 2001 for a review). Although this modulation has usually been reported to produce changes in the conductance of Na+ channels (Numann et al. 1991; Cantrell et al. 1997; Maurice et al. 2001), protein kinase C has been observed to shift the activation curve for type IIA Na+ channels to more depolarized values (Dascal & Lotan, 1991). We hypothesize that the differences in the V1/2 of activation for Na+ channels that we have found under control conditions could be attributed to a greater level of phosphorylation at proximal versus distal locations. If this were the case, the inhibition of protein kinases by staurosporine would produce a leftward shift in the activation curves at both locations, with a greater shift at proximal locations, as we have actually observed. However, we cannot exclude the possibility that the distance-dependent shift in activation ranges could arise from the expression of different channels at the two locations. Also, proximal and distal Na+ channels may differentially interact with the cytoskeleton or with accessory proteins that could shift their voltage dependence of activation (Cantrell et al. 1999). In all cases, however, kinases would play an important role in Na+ channel regulation, since their inhibition caused channels in both dendritic locations to show similar voltage dependences.
The activation of protein kinases has also been reported to slow inactivation kinetics for Na+ channels (Numann, 1991; Cantrell et al. 1996). We have actually found that distal Na+ currents inactivated significantly faster than proximal at every voltage. However, this difference is just a consequence of the lower threshold of activation of distal Na+ channels, since the inactivation kinetics in our conditions were determined only by the position of the activation curves. Moreover, the inhibition of kinases by staurosporine did not change the inactivation kinetics, which again were determined only by the degree of activation of Na+ currents (Fig. 4F). This evidence suggests that phosphorylation does not affect inactivation kinetics in our experimental conditions.
We have also found that the resting membrane potential is more hyperpolarized at distal locations under control conditions and that the main effect of staurosporine was to shift the proximal Vm to more hyperpolarized values, thus removing the difference. We hypothesize that the difference in the Vm observed under control conditions could be a consequence of greater tonic phosphorylation activity at proximal dendritic locations, since it could be removed by staurosporine. Protein kinase C has been shown to decrease the activity of inward rectifier K+ channels that are expressed in the hippocampus and could be involved in the control of the resting membrane potential (Henry et al. 1996). Other evidence would suggest that protein kinase activity is higher at proximal sites. Distal A-type K+ currents activate at more hyperpolarized potentials than proximal (Hoffman et al. 1997), but activation of PKC and PKA can shift activation curves recorded at distal sites to more depolarized voltages, so that they become comparable to proximal (Hoffman & Johnston, 1998). Also, activation curves for the hyperpolarization-activated current, Ih, have been shown to be more hyperpolarized at distal sites (Magee, 1998). Since activation ranges for Ih depend on the intracellular concentration of cAMP (Pape, 1996), this would further suggest that the concentration of cAMP, and thus protein kinase A activity, is lower at distal dendritic locations. In conclusion, these data suggest that the modulation of the voltage dependence of activation of Na+ channels by phosphorylation/dephosphorylation may be another way for neurotransmitters to modulate dendritic excitability and synaptic integration.
Acknowledgments
This work was supported by NIH grant NS 39458 and NSF grant NSF/LEQSF 2001-04-RII.
REFERENCES
- Callaway JC, Ross WN. Frequency-dependent propagation of sodium action potentials in dendrites of hippocampal CA1 pyramidal neurons. Journal of Neurophysiology. 1995;74:1395–1403. doi: 10.1152/jn.1995.74.4.1395. [DOI] [PubMed] [Google Scholar]
- Cantrell AR, Catterall WA. Neuromodulation of Na+ channels: An unexpected form of cellular plasticity. Nature Review Neuroscience. 2001;2:397–407. doi: 10.1038/35077553. [DOI] [PubMed] [Google Scholar]
- Cantrell AR, Ma JY, Scheuer T, Catterall WA. Muscarinic modulation of sodium current by activation of protein kinase C in hippocampal neurons. Neuron. 1996;16:1019–1026. doi: 10.1016/s0896-6273(00)80125-7. [DOI] [PubMed] [Google Scholar]
- Cantrell AR, Smith RD, Goldin AL, Scheuer T, Catterall WA. Dopaminergic modulation of sodium current in hippocampal neurons via cAMP-dependent phosphorylation of specific sites in the sodium channel α subunit. Journal of Neuroscience. 1997;17:7330–7338. doi: 10.1523/JNEUROSCI.17-19-07330.1997. [DOI] [PMC free article] [PubMed] [Google Scholar]
- Cantrell AR, Tibbs VC, Westenbroek RE, Scheuer T, Catterall WA. Dopaminergic modulation of voltage-gated Na+ current in rat hippocampal neurons requires anchoring of cAMP-dependent protein kinase. Journal of Neuroscience. 1999;19:1–6. doi: 10.1523/JNEUROSCI.19-17-j0003.1999. RC21. [DOI] [PMC free article] [PubMed] [Google Scholar]
- Colbert CM, Johnston D. Protein kinase C activation decreases activity-dependent attenuation of dendritic Na+ current in hippocampal CA1 pyramidal neurons. Journal of Neurophysiology. 1998;79:491–495. doi: 10.1152/jn.1998.79.1.491. [DOI] [PubMed] [Google Scholar]
- Colbert CM, Magee JC, Hoffman DA, Johnston D. Slow recovery from inactivation of Na+ channels underlies the activity-dependent attenuation of dendritic action potentials in hippocampal CA1 pyramidal neurons. Journal of Neuroscience. 1997;17:6512–6521. doi: 10.1523/JNEUROSCI.17-17-06512.1997. [DOI] [PMC free article] [PubMed] [Google Scholar]
- Dascal N, Lotan I. Activation of protein kinase C alters voltage dependence of a Na+ channel. Neuron. 1991;6:165–175. doi: 10.1016/0896-6273(91)90131-i. [DOI] [PubMed] [Google Scholar]
- Gillessen T, Alzheimer C. Amplification of EPSPs by low Ni2+- and amiloride-sensitive Ca2+ channels in apical dendrites of rat CA1 pyramidal neurons. Journal of Neurophysiology. 1997;77:1639–1643. doi: 10.1152/jn.1997.77.3.1639. [DOI] [PubMed] [Google Scholar]
- Gong B, Rhodes KJ, Bekele-Arcuri Z, Trimmer JS. Type I and type II Na+ channel α-subunit polypeptides exhibit distinct spatial and temporal patterning, and association with auxiliary subunits in rat brain. Journal of Comparative Neurology. 1999;412:342–552. [PubMed] [Google Scholar]
- Häusser M, Spruston N, Stuart GJ. Diversity and dynamics of dendritic signaling. Science. 2000;290:739–744. doi: 10.1126/science.290.5492.739. [DOI] [PubMed] [Google Scholar]
- Henry P, Pearson WL, Nichols CG. Protein kinase C inhibition of cloned inward rectifier (HRK1/KIR2. 3) K+ channels expressed in Xenopus oocytes. Journal of Physiology. 1996;495:681–688. doi: 10.1113/jphysiol.1996.sp021625. [DOI] [PMC free article] [PubMed] [Google Scholar]
- Hoffman DA, Johnston D. Downregulation of transient K+ channels in dendrites of hippocampal CA1 pyramidal neurons by activation of PKA and PKC. Journal of Neuroscience. 1998;18:3521–3528. doi: 10.1523/JNEUROSCI.18-10-03521.1998. [DOI] [PMC free article] [PubMed] [Google Scholar]
- Hoffman DA, Magee JC, Colbert CM, Johnston D. K+ channel regulation of signal propagation in dendrites of hippocampal pyramidal neurons. Nature. 1997;387:869–875. doi: 10.1038/43119. [DOI] [PubMed] [Google Scholar]
- Jung H-Y, Mickus T, Spruston N. Prolonged sodium channel inactivation contributes to dendritic action potential attenuation in hippocampal pyramidal neurons. Journal of Neuroscience. 1997;17:6639–6646. doi: 10.1523/JNEUROSCI.17-17-06639.1997. [DOI] [PMC free article] [PubMed] [Google Scholar]
- Li M, West JW, Numann R, Murphy BJ, Scheuer T, Catterall WA. Convergent regulation of sodium channels by protein kinase C and cAMP-dependent protein kinase. Science. 1993;261:1439–1442. doi: 10.1126/science.8396273. [DOI] [PubMed] [Google Scholar]
- Lipowsky R, Gillessen T, Alzheimer C. Dendritic Na+ channels amplify EPSPs in hippocampal CA1 pyramidal cells. Journal of Neurophysiology. 1996;76:2181–2191. doi: 10.1152/jn.1996.76.4.2181. [DOI] [PubMed] [Google Scholar]
- Magee JC. Dendritic hyperpolarization-activated currents modify the integrative properties of hippocampal CA1 pyramidal neurons. Journal of Neuroscience. 1998;18:7613–7824. doi: 10.1523/JNEUROSCI.18-19-07613.1998. [DOI] [PMC free article] [PubMed] [Google Scholar]
- Magee J, Hoffman D, Colbert C, Johnston D. Electrical and calcium signaling in dendrites of hippocampal pyramidal neurons. Annual Review of Physiology. 1998;60:327–346. doi: 10.1146/annurev.physiol.60.1.327. [DOI] [PubMed] [Google Scholar]
- Magee JC, Johnston D. Characterization of single voltage-gated Na+ and Ca2+ channels in apical dendrites of rat CA1 pyramidal neurons. Journal of Physiology. 1995;487:67–90. doi: 10.1113/jphysiol.1995.sp020862. [DOI] [PMC free article] [PubMed] [Google Scholar]
- Maurice N, Tkatch T, Meisler M, Sprunger LK, Surmeier DJ. D1/D5 dopamine receptor activation differentially modulates rapidly inactivating and persistent sodium currents in prefrontal cortex pyramidal neurons. Journal of Neuroscience. 2001;21:2268–2277. doi: 10.1523/JNEUROSCI.21-07-02268.2001. [DOI] [PMC free article] [PubMed] [Google Scholar]
- Mickus T, Jung H-Y, Spruston N. Properties of slow, cumulative sodium channel inactivation in rat hippocampal CA1 pyramidal neurons. Biophysical Journal. 1999;76:846–860. doi: 10.1016/S0006-3495(99)77248-6. [DOI] [PMC free article] [PubMed] [Google Scholar]
- Murphy BJ, Rossie S, De Jongh KS, Catterall WA. Identification of the sites of selective phosphorylation and dephosphorylation of the rat brain Na+ channel α subunit by cAMP-dependent protein kinase and phosphoprotein phosphatases. Journal of Biological Chemistry. 1993;268:27355–27362. [PubMed] [Google Scholar]
- Numann R, Catterall WA, Scheuer T. Functional modulation of brain sodium channels by protein kinase C phosphorylation. Science. 1991;254:115–118. doi: 10.1126/science.1656525. [DOI] [PubMed] [Google Scholar]
- Pape H-C. Queer current and pacemaker: the hyperpolarization-activated cation current in neurons. Annual Review of Physiology. 1996;58:299–327. doi: 10.1146/annurev.ph.58.030196.001503. [DOI] [PubMed] [Google Scholar]
- Rüegg UT, Burgess GM. Staurosporine, K-252 and UCN-01: potent but nonspecific inhibitors of protein kinases. Trends in Pharmacological Sciences. 1989;10:218–220. doi: 10.1016/0165-6147(89)90263-0. [DOI] [PubMed] [Google Scholar]
- Spruston N, Schiller Y, Stuart G, Sakmann B. Activity-dependent action potential invasion and calcium influx into hippocampal CA1 dendrites. Science. 1995;268:297–300. doi: 10.1126/science.7716524. [DOI] [PubMed] [Google Scholar]
- Stuart G, Spruston N, Sakmann B, Hausser M. Action potential initiation and backpropagation in neurons of the mammalian CNS. Trends in Neurosciences. 1997;20:125–131. doi: 10.1016/s0166-2236(96)10075-8. [DOI] [PubMed] [Google Scholar]
- Tsubokawa H, Ross WN. Muscarinic modulation of spike backpropagation in the apical dendrites of hippocampal CA1 pyramidal neurons. Journal of Neuroscience. 1997;17:5782–5791. doi: 10.1523/JNEUROSCI.17-15-05782.1997. [DOI] [PMC free article] [PubMed] [Google Scholar]
- Vetter P, Roth A, Häusser M. Propagation of action potentials in dendrites depends on dendritic morphology. Journal of Neurophysiology. 2001;85:926–937. doi: 10.1152/jn.2001.85.2.926. [DOI] [PubMed] [Google Scholar]