

Abstract
Short-term (6 weeks) voluntary wheel running exercise in young female rats that were in an active growth phase resulted in whole-heart hypertrophy and myocyte concentric hypertrophy, when compared to sedentary controls. The cross-sectional area of ventricular myocytes from trained rats was significantly greater than for those isolated from sedentary rats, with the greatest change in morphology seen in sub-endocardial cells. There was no statistically significant effect of training on cell shortening in the absence of external mechanical loading, in [Ca2+]i transients, or in myofilament Ca2+ sensitivity (assessed during re-lengthening following tetanic stimulation). Under the external mechanical load of carbon fibres, absolute force developed in myocytes from trained rats was significantly greater than in those from sedentary rats. This suggests that increased myocyte cross-sectional area is a major contractile adaptation to exercise in this model. Training did not alter the passive mechanical properties of myocytes or the relative distribution of titin isomers, which was exclusively of the short, N2B form. However, training did increase the steepness of the active tension-sarcomere length relationship, suggesting an exercise-induced modulation of the Frank-Starling mechanism. This effect would be expected to enhance cardiac contractility. Training lengthened the action potential duration of sub-epicardial myocytes, reducing the transmural gradient in action potential duration. This observation may be important in understanding the cellular causes of T-wave abnormalities found in the electrocardiograms of some athletes. Our study shows that voluntary exercise modulates the morphological, mechanical and electrical properties of cardiac myocytes, and that this modulation is dependent upon the regional origin of the myocytes.
Regular exercise is known to improve cardiac function by eliciting adaptations such as increased myocardial mass and ventricular chamber dimensions, resulting in increased stroke volume (see Moore & Korzick, 1995 for review). Various animal models of exercise have been developed (Moore & Korzick, 1995), including voluntary exercise models where animals have free access to training regimes and whose adaptations to exercise are less likely to be contaminated by the stress-induced responses that can occur with enforced training methods (Rupp, 1989; Yancey & Overton, 1993; Asami et al. 1998; Moraska et al. 2000). At the cellular level, training has been shown to induce hypertrophy in ventricular myocytes. For example, in rats, training led to increased left ventricular myocyte length (Moore et al. 1993; Palmer et al. 1998; Wisloff et al. 2001) and width (White et al. 1988; Natali et al. 2001).
While some studies demonstrated that training increases myocyte contractility (Wisloff et al. 2001), others demonstrated little change (Laughlin et al. 1992; Palmer et al. 1998; Natali et al. 2001) or changes dependent upon experimental conditions (Moore et al. 1993). Training does not seem to be associated with an increase in the amplitude of intracellular calcium ([Ca2+]i) transients (Laughlin et al. 1992; Palmer et al. 1998; Wisloff et al. 2001). However, an increase in myofilament Ca2+ sensitivity has been suggested as a mechanism for increased contractility in some (Moore et al. 1993; Diffee et al. 2001; Wisloff et al. 2001), but not all (Palmer et al. 1998) studies. Although the dependence of contractility on muscle length (the Frank-Starling mechanism) is an important factor in determining the contractility of cardiac muscle (see Calaghan & White, 1999 for review) few studies have investigated the effect of exercise training on this mechanism at a cellular level. Data from Mole (1978) suggested that the slope of the length-tension relationship in papillary muscles was increased following swim training.
In addition to adaptations of mechanical activity, training is also known to alter the electrocardiogram (ECG) of some athletes; effects include a flattened or inverted T-wave, in a way that mimics the ECG in sufferers of hypertrophic cardiomyopathy (HCM, see Pelliccia & Maron, 2001 for review). Because HCM is the most common cause of sudden death in young athletes, the diagnostic distinction between it and non-pathological changes in ECG associated with exercise-induced remodelling is vital, but at present unresolved (Pelliccia et al. 2000). To date, there have been few studies on the effects of exercise training on cellular electrophysiology in normal hearts (see Tibitts et al. 1981; Mokelke et al. 1997; Jew et al. 2001), even though such studies might help reveal the causes of abnormalities in the ECG of some athletes.
Studies on the response of myocytes to exercise usually employ cell populations drawn from the whole ventricular wall. However, it is now known that there are regional differences in the basic electrical (Antzelevitch et al. 1991) and mechanical (Cazorla et al. 2000a, b) properties of myocytes from the sub-epicardium (EPI) and sub-endocardium (ENDO). Furthermore, it has been shown that the responses to certain stimuli are dependent upon the regional origin of the myocyte (Anversa et al. 1986; Shipsey et al. 1997; Natali et al. 2001). Thus, one reason for the variation in the effects of exercise training on single myocytes in previous studies (see above) may be the grouping together of cell populations that possess different basal properties and/or responses to training.
We have reported previously a model of voluntary, wheel-running exercise training in young actively growing female rats that led to heart and myocyte hypertrophy, particularly in ENDO (Natali et al. 2001). The purpose of the study presented here was to test the hypothesis that myocytes from such animals show modified mechanical and electrical characteristics and that these adaptive responses to voluntary exercise are dependent upon the regional origin of the myocytes.
METHODS
All animal experimentation was carried out in accordance with the Animals (Scientific Procedures) Act 1986.
Exercise training model
Female, Sprague-Dawley rats, weight-matched (see Table 1) and age-matched (6 weeks old), were assigned to one of two groups: sedentary (N = 37) and exercise trained (N = 37). All rats were housed individually in plastic cages (25 cm width × 38 cm length × 18 cm height; North Kent Plastic, UK) and had access to standard chow and water ad libitum. Over a 6-7 week period, trained rats had free access to a stainless steel vertical running wheel, 1.12 m in circumference (Lafayette Instruments, West Lafayette, IN, USA), which was attached to their cages. This training period was chosen because we have shown previously that daily running distances peak at 6-7 weeks and then decline (Natali et al. 2001). Running distance was recorded daily and rats were weighed weekly. All animals were housed in a room maintained at 19-21 °C with a 12:12 h light:dark cycle.
Table 1.
Body weight (BW), heart weight (HW), left weight (LVW), right ventricular weight (RVW) and ratios in sedentary and trained rats
| Parameter | Sedentary | Trained |
|---|---|---|
| Initial BW (g) | 98.82 ± 1.93 | 101.35 ± 1.54 |
| Final BW (g) | 221.24 ± 3.14 | 218.73 ± 3.32 |
| HW (mg) | 1023.78 ± 17.21 | 1162.7 ± 26.04* |
| LVW (mg) | 670.54 ± 9.66 | 785.68 ± 14.51* |
| RVW (mg) | 212.97 ± 4.73 | 253.24 ± 7.88* |
| HW:BW (mg/g) | 4.63 ± 0.05 | 5.32 ± 0.09* |
| LVW:BW(mg/g) | 3.04 ± 0.03 | 3.6 ± 0.05* |
| RVW:BW(mg/g) | 0.97 ± 0.02 | 1.16 ± 0.03* |
| N | 37 | 37 |
N = number of animals
P≤ 0.05 vs. sedentary. (Initial body weight, power 7 %; final body weight, power 6 %.)
Cell isolation
After being weighed, rats were humanely killed. The heart was removed rapidly and extraneous tissue was dissected away. The heart was flushed with a modified Hepes-Tyrode solution of the following composition (mm): 130 Na+, 5.4 K+, 1.4 Mg2+, 140 Cl−, 0.75 Ca2+, 5 Hepes, 10 glucose, 20 taurine and 10 creatine, pH 7.3, at room temperature. The heart was then blotted dry and weighed before being mounted on a Langendorff perfusion apparatus.
Single ventricular myocytes were isolated using an enzymatic dispersion technique, as described previously (Frampton et al. 1991). Following perfusion with a solution containing collagenase and protease, the ventricles were separated and weighed. Tissue was dissected from the left ventricular EPI and ENDO for separate isolation of myocytes (Natali et al. 2001).
Measurement of cell dimensions and confocal microscopy
The length and width of all cells under study were measured from their video image. To assess the width:depth (W:D) ratio of the myocytes, some cells were loaded with the voltage-sensitive fluorescent indicator 4-(2-(6-(dioctylamino)-2-naphthalenyl) ethenyl)-1-(3-sulphopropyl)-pyridinium (di-8-ANEPPS; 5 μM for 5 min); this agent allows visualisation of the surface membrane (Kawai et al. 1999). Cells from each of the four groups were imaged with a laser scanning confocal microscope (Leica, TCS NT, excitation 514 nm, emission 600 nm) and cell depth was measured by Z-axis scanning through the upper and lower surfaces of the cell at a central point. Studies have shown that this approach gave the same statistical results as a more lengthy technique based on assessing the appearance and disappearance of half of the upper and lower surfaces of the cell during Z-axis scanning.
Measurement of cell shortening and [Ca2+]i
Cells were placed in the experimental chamber mounted on the stage of an inverted microscope (Nikon Diaphot). The chamber was perfused with a bicarbonate-buffered Tyrode solution of the following composition (mm): 135 Na+, 5 K+, 1 Mg2+, 102 Cl−, 20 HCO3−, 1 SO42-, 1 Ca2+, 20 acetate, 10 glucose, 5 u l−1 insulin (equilibrated with 5 % CO2-95 % O2) pH 7.35. Myocytes were stimulated via platinum bath electrodes with voltage pulses 5 ms in duration and an intensity of approximately 1.25 times threshold. Unless stated otherwise, all experiments in this study were carried out at 37 °C at a stimulation frequency of 1 Hz.
Rod-shaped myocytes, quiescent prior to stimulation, were chosen for study. Unloaded cell shortening was monitored by video edge detection at 200 Hz (Crescent Electronics, Sandy, UT, USA, using a Pulnix TM640 camera in partial scanning mode) and expressed as a percentage of resting cell length. Simultaneous measurements of changes in [Ca2+]i were made by loading cells with the calcium-sensitive indicator fura-2 AM (3 μM for 10 min). The ratio of the emitted fluorescence at 510 nm in response to excitation at 340 and 380 nm (340 nm/380 nm ratio) was our index of [Ca2+]i (see Frampton et al. 1991 and White et al. 1995 for details).
Measurement of myofilament Ca2+ sensitivity
Myofilament Ca2+ sensitivity was assessed using a tetanic contraction technique (Hongo et al. 1998). Briefly, cells were loaded with fura-2 AM and exposed to 1 μM thapsigargin for 15 min to inhibit sarcoplasmic reticulum function. Cells were stimulated for 10 s at 10 Hz in the presence of bicarbonate-buffered Tyrode solution containing 5 mm Ca2+, at 22-24 °C. Following the train of stimulation, cell re-lengthening and the fall in [Ca2+]i (and thus fluorescence) are thought to be in dynamic equilibrium (Spurgeon et al. 1992). Re-lengthening and fura-2-fluorescence are, fortuitously, linearly related, and a shift in the slope of this relationship is an indication of a change in myofilament Ca2+ sensitivity (Hongo et al. 1998).
Mechanical loading and stretching of cells: passive and active tension
In order to mechanically load and stretch myocytes, carbon fibres of known compliance were attached to cells (e.g. White et al. 1995; Cazorla et al. 2000b). Displacement of the fibres during stimulation was used to calculate force developed, which could be normalised to cell cross-sectional area (CSA). Increased sarcomere length (SL) was used as our index of stretch, which was monitored online using a Fourier analysis of the video image of the cell (Gannier et al. 1993; White et al. 1995). The change in tension over the change in SL (δT/δSL) was our index of the slope of the passive and active SL-tension curves (see Cazorla et al. 2000b).
Detection of titin isomer expression
To determine the expression of the two titin isomers (the short and stiffer N2B and the longer more supple N2A, see Cazorla et al. 2000a), tissue samples of rat left ventricle were pulverised in liquid nitrogen and suspended (50 μl μg−1 tissue) in PBS containing a cocktail of protease inhibitors (1 μM pepstatin A, 2 mm phenylmethylsulphonyl fluoride, 10 μM soybean trypsin inhibitor, 10 μM E64 and 100 μM leupeptin). Following centrifugation at 15 000 g, the pellets were re-suspended in sample buffer (Fritz et al. 1989) containing the inhibitors in addition to 0.1 % bromophenol blue to act as a tracer dye. Samples were solubilised at 58 °C for 15 min then clarified by centrifugation at 15 000 g prior to loading a 4 μl sample onto a gel. Excised bovine hearts were obtained from a local abattoir and samples of the left ventricle run alongside those from the rat.
Samples were analysed by SDS-PAGE on a 2-10 % linear gradient gel in a Bio-Rad Mini Protean II electrophoresis cell. A Tris/ glycine/SDS buffer system was used (Laemmli, 1970) and samples were run in the presence of 10 mm 2-mercaptoethanol, at a constant 85 V for 4 h. Protein bands were then visualised using Coomassie Brilliant Blue R-250 stain.
Measurement of action potentials
Cells were impaled with microelectrodes filled with 600 mm KCl (resistance 30-80 MΩ). Membrane blebbing (an indication of excess Cl− loading) was not observed in cells impaled with these electrodes. Cells were stimulated by a suprathreshold current pulse of 1 ms duration, at a stimulation frequency of 1 Hz (Axopatch-1D, Axon Instruments, USA). Resting membrane potential, action potential amplitude and action potential duration (APD) at various stages of repolarisation were measured.
Statistical analysis
Differences between ENDO and EPI cells from sedentary and trained animals were analysed by two-way ANOVA followed by Bonferroni-corrected Student's unpaired t test. In some cases, data from the EPI and ENDO regions of sedentary and trained hearts were combined to test all sedentary cells against all trained cells using Student's unpaired t tests. For body weight, heart weight, ventricular weights and their ratios, differences between sedentary and trained animals were assessed with Student's unpaired t tests. Statistical significance was assumed at P < 0.05. Power calculations were also carried out on all failed tests, and expressed as the percentage change in mean value that would be expected to give a power of 0.8, with an α of 0.05. In each experiment, similar numbers of cells were used from each heart, and EPI and ENDO cells were used from each heart included in the study. Data are expressed as means ± s.e.m., where N = number of animals (identical for EPI and ENDO groups from sedentary or trained animals) and n = number of cells.
RESULTS
The average daily distance run by animals gradually increased until a plateau was reached between 3 and 6 weeks (Fig. 1A). We have reported previously that running distance gradually declines after about 6 weeks (Natali et al. 2001). The ratio of left ventricular weight:body weight was used as an indicator of ventricular hypertrophy. There was a significant positive correlation between distance run and the left ventricular weight:body weight ratio (Fig. 1B).
Figure 1. Daily voluntary running distance and cardiac hypertrophy in female rats.

A, daily running distance for each week of the study (N = 37 animals). B, relationship between daily running distance and left ventricular weight (LVW) to body weight (BW) ratio at cell isolation(LVW:BW; linear regression, R = 0.50, P < 0.05).
Voluntary exercise caused hypertrophy at the organ level, causing a significant increase in heart weight:body weight and left (and right) ventricular weight:body weight ratio (Table 1).
In order to assess whether myocyte hypertrophy had occurred, the length, width and depth ratio of some cells, labelled with di-8-ANNEPS, from the EPI and ENDO region of trained and sedentary hearts were measured using laser scanning confocal microscopy (see Methods). In these cells we observed no difference in the length of the four groups of cells. Although there were significant increases in the width and depth of trained ENDO cells (P < 0.05), the cell width to cell depth ratios (W:D) of the four groups were not significantly different (1.44 ± 0.03, mean ratio ± s.e.m., P > 0.05, power 19 %, n = 153 cells, N = 2 sedentary and 2 trained animals), suggesting that increased cell width was matched by increased cell depth. As such, cell depth could be predicted from a measurement of cell width.
In all other cells, length (L) and width (W) were measured from a video image, and cell volume (V) was calculated using the following formula:
V = L × W × (W/W:D) × 5.4 × 10⁻⁴ pl μm− 3
or V = L × W2/2667 pl−1 μm3,
where V is in picolitres and L and W are in micrometres.
This formula is based on the observation of Satoh et al. (1996) that the shape of a rat ventricular myocytes is an elongated ellipse, the volume of which is equal to 54 % of the volume of a block defined as cell L × W × D (our cell depth being calculated as cell W/W:D).
We found that 6 weeks of voluntary exercise training in young actively growing female rats appears to induce cellular, regional, concentric hypertrophy. The volume of trained cells was significantly greater than that of the sedentary cells from the equivalent region, but the hypertrophy was greatest in the ENDO region (Table 2). Therefore, the major cellular response to exercise was an increase in the width (and by implication depth) of trained ENDO cells. This results in an increased cell volume and a decreased length:width ratio.
Table 2.
Cell dimensions of left ventricular (LV) sub-endocardial (ENDO) and sub-epicardial (EPI) myocytes from sedentary (S) and trained (T) rats
| Cell dimension | ENDO S | EPI S | ENDO T | EPI T |
|---|---|---|---|---|
| Length (μm) | 120.6 ± 1.0 | 121.3 ± 1.0 | 123.8 ± 1.1 | 123.3 ± 1.1 |
| Width (μm) | 20.2 ± 0.2 | 20.1 ± 0.2 | 23.8 ± 0.2* | 20.8 ± 0.2† |
| Depth (μm) | 14.1 ± 0.2 | 13.9 ± 0.1 | 16.5 ± 0.2* | 14.5 ± 0.1† |
| Volume (pl) | 19.0 ± 0.5 | 18.6 ± 0.4 | 26.9 ± 0.6* | 20.5 ± 0.4† |
| Length:Width | 6.1 ± 0.1 | 6.2 ± 0.1 | 5.3 ± 0.1* | 6.0 ± 0.1 |
| N | 37 | 37 | 37 | 37 |
| n | 228 | 240 | 242 | 262 |
N = number of animals, n = number of cells
P≤ 0.05 vs. ENDO S and EPI T
P≤ 0.05 vs. EPI S. (Cell length, power 4 %.)
Although hypertrophy is in itself an adaptive response to exercise, there may also be adaptive modifications to excitation-contraction coupling. However, when we observed the effect of training on Ca2+ handling by simultaneously recording unloaded cell shortening and [Ca2+]i transients of cells loaded with the Ca2+ indicator fura-2, there were no significant differences between the four groups (Fig. 2). In addition, there were no significant differences (P > 0.05) in the time course of the shortening or [Ca2+]i transients measured as the time from stimulation to peak (power 16 % and 10 %, respectively) and from peak to half-resting levels (power 24 % and 11 %, respectively).
Figure 2. Effect of training on the amplitude of [Ca2+]i transients and unloaded cell shortening.
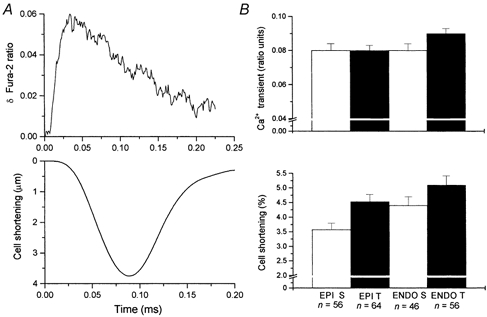
A, fura-2 fluorescence ([Ca2+]i; upper trace) and cell shortening (lower trace) in a representative myocyte. B, mean data for amplitude of the fura-2 transient (upper traces) and cell shortening expressed as a percentage of resting cell length (lower traces). Training condition (T = trained, S = sedentary) and region of origin (EPI = sub-epicardium, ENDO = sub-endocardium) of the cells did not significantly affect these parameters (P > 0.05, power 30 % for shortening and 20 % for fura-2 transient, n = number of cells, N = 10 sedentary and 10 trained animals).
These observations suggest that during normal excitation- contraction coupling the contractile response of the myofilaments to a given level of Ca2+ is not altered. However, there is disagreement in the literature as to whether exercise alters myofilament Ca2+ sensitivity (see Introduction). To test this relationship in our model, we monitored the re-lengthening-fluorescence relationship following tetanic stimulation. A significantly greater slope of this relationship would be consistent with increased myofilament Ca2+ sensitivity (Fig. 3).
Figure 3. Effect of region of origin and training on re-lengthening and fluorescence.

A, change in fura-2 fluorescence and B, cell length in response to stimulation at 10 Hz for 10 s in the presence of 1 μM thapsigargin. C, relationship between fluorescence and cell length during re-lengthening (indicated by arrow) for traces shown in A and B. D, mean slope of re-lengthening-fluorescence (R-F) relationships. Training and region of origin did not significantly affect these parameters (P > 0.05, power 24 %, n = number of cells, N = 4 sedentary and 4 trained animals).
Although slopes for trained animals tended to be larger than those for sedentary animals from the equivalent region, and slopes for EPI were greater than for ENDO cells, these differences were not significant (Fig. 3D). Because slopes for EPI and ENDO cells were not significantly different from each other in either trained or sedentary populations, we combined the cells into single sedentary and trained populations. However, the combined slopes from sedentary and trained cells were still not significantly different from each other (P > 0.05, power, 17 %).
In vivo, cardiac myocytes are mechanically loaded to adjacent cells and develop force during activation. Force development is dependent upon cell CSA, and we have shown this to be increased in trained cells (and to a greater extent in ENDO cells). However, cell CSA is not a factor when unloaded cell shortening is used as the index of contractility. We therefore assessed the ability of myocytes to develop force by first measuring unloaded shortening and then mechanically loading the same cells with carbon fibres and measuring force production (Fig. 4).
Figure 4. Mechanically unloaded cell shortening and force development of representative myocytes.

A, unloaded cell shortening of an ENDO myocyte from a sedentary (S) and trained (T) rat with the same resting cell length and showing a similar degree of shortening. B, force developed by the same myocytes when mechanically loaded with carbon fibres.
Sedentary and trained cells shortened by similar amounts, thus contractility, assessed as a percentage of cell shortening, was not significantly different between the groups (Fig. 5A), or when EPI and ENDO cells from sedentary or trained cells were combined (P > 0.05, power, 10 %). However, the force produced by the same cells when attached to carbon fibres was significantly greater in trained cells, compared to sedentary cells from the same region (Fig. 5B). Thus, the increase in myocyte CSA increases contractility (force production), but this adaptive response is not detected if the percentage of cell shortening is used as the index of contractility.
Figure 5. Mechanically unloaded cell shortening and force development in myocytes.
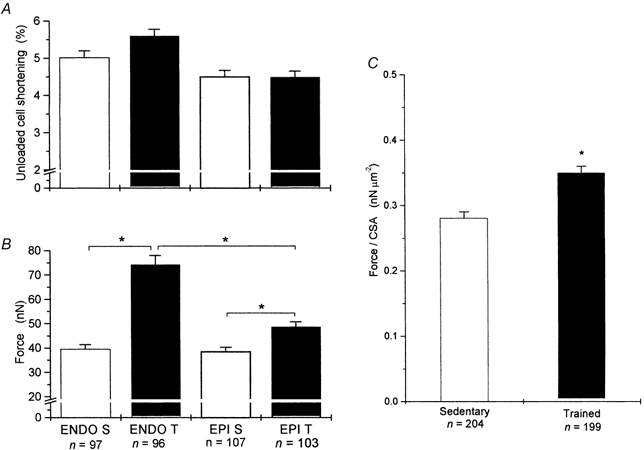
A, mean data for unloaded cell shortening and B, absolute force developed for the four types of cell. Cell shortening was similar in the four groups (P > 0.05, power 17 %), but trained cells developed greater force. C, mean force normalised to cell cross-sectional area. Most, but not all of the greater force in trained cells was due to increased cross-sectional area. (*P < 0.05, n = number of cells, N = 10 sedentary and 10 trained animals.)
To test whether increased force production in trained cells is purely the result of their increased CSA, we normalised force to cell CSA. Although normalised force in trained cells tended to be greater than that of equivalent sedentary cells, there was no significant difference between the four groups (P > 0.05, two-way ANOVA, power 27 %). Thus, it appears that the major reason for the increased absolute force production in trained cells (Fig. 5B) was indeed increased CSA. However, this was not the sole reason, because when normalised force data from EPI and ENDO cells were combined into single sedentary and trained populations we found that normalised force was now significantly greater in the trained cells (Fig. 5C). By contrast, combined data for cell shortening from these cells remained non-significant (P > 0.05, power 10 %; see Discussion).
A steepening of the force-length relationship and/or decreased cellular compliance have been proposed as adaptive mechanisms in response to exercise training. To test whether such mechanisms might occur in our model, we measured the resting and active tension in cells when subjected to stretch; Fig. 6A shows a representative experiment. The change in force/the change in SL was used as an indicator of the length-tension relationship (see Cazorla et al. 2000b). We observed a significant increase in the mean δ active tension/δSL, that is, a change in the active properties of trained ENDO cells compared to the other cell types, suggesting a training-induced modification of the Frank-Starling mechanism in these cells (Fig. 6B).
Figure 6. Effect of stretching on contraction of a single rat left ventricular myocyte.

A, change in cell length (upper panel) and force development (lower panel) following stretch, indicated by arrows to the sarcomere lengths (SL) shown. B, SL-tension relationship for data in A (□, active tension; ▪, resting tension). C, mean slope of active tension-SL relationship (δaT/δSL) for the four groups of cells. (*P < 0.05vs. ENDO S and EPI T, n = number of cells, N = 7 sedentary and 7 trained animals.)
In the ascending limb of the length-tension curve, the passive mechanical properties of the myocardium are determined primarily by the giant elastic protein titin (Granzier & Irving, 1995) and have been reported to be altered by training (e.g. Woodiwiss & Norton, 1995). The rat is reported to express only the short (stiff, N2B) isomer of titin (Cazorla et al. 2000a). Therefore, one mechanism of increasing myocyte compliance in response to exercise would be to express the longer (supple, N2A) titin isomer (see Discussion). We tested this hypothesis by measuring both passive tension in stretched myocytes and expression of titin isomers.
We obtained no evidence to suggest that rat myocytes express the N2A isomer of titin in response to exercise (Fig. 7A, B). As we expected, we could detect both isomers in samples from the bovine ventricular myocardium. In addition, we observed no significant differences in the δ resting tension/δSL for the four cell populations (Fig. 7C).
Figure 7. Effect of exercise on the passive properties of the myocardium.

A, SDS-PAGE gel showing comparison of titin isoforms in bovine (lane 1) and sedentary rat (lane 2) left ventricle indicating that the bovine sample has an additional band (N2A) of higher molecular weight and slower mobility than the major band (N2B). This shows that the gel system can resolve different isoforms of titin and that sedentary rat left ventricle expresses only N2B myosin heavy chain (MHC). B, SDS-PAGE gel loaded with left ventricular myocardium from sedentary and exercised rat showing no difference in the expression of titin isoforms, as confirmed by a mixture of sedentary and exercised samples run in the central position. The faint band visible below N2B is a truncated form that is generally considered to arise from proteolysis (Wang, 1985). C, the mean slopes of resting tension-SL relationship (δrT/δSL) for the four groups of cells were not significantly different from each other (P > 0.05, power 43 %, n = number of cells, N = 7 sedentary and 7 trained animals).
Previous reports have shown changes in the electrical characteristics of the myocardium in response to exercise, but the importance of the regional origin of myocytes in these responses has not been tested (see Introduction). We therefore measured the action potentials of sedentary and trained myocytes with microelectrodes (Table 3).
Table 3.
Action potential characteristics of ENDO and EPI myocytes from sedentary (S) and trained rats (T)
| Parameter | EPI S | ENDO S | EPI T | ENDO T |
|---|---|---|---|---|
| RMP (mV) | 69.3 ± 1.1 | 67.4 ± 0.5 | 67.9 ± 0.7 | 67.2 ± 0.6 |
| Amplitude (mV) | 105.5 ± 3.7 | 98.2 ± 1.4 | 85.2 ± 1.8* | 93.7 ± 2.8 |
| APD25 (ms) | 2.8 ± 0.5 | 6.3 ± 0.5* | 4.7 ± 0.5* | 5.9 ± 0.5 |
| APD75 (ms) | 37.2 ± 4.5 | 68.6 ± 5.6* | 62.7 ± 6.9* | 71.9 ± 6.5 |
| APD90 (ms) | 76.2 ± 4.4 | 107.8 ± 6.9* | 103.8 ± 7.3* | 107.5 ± 6.9 |
| N | 6 | 6 | 6 | 6 |
| n | 16 | 17 | 18 | 14 |
N = number of animals, n = number of cells
P± 0.05 vs. EPI S. RMP, resting membrane potential; APD25, APD75 and APD90, action potential durations at 25%, 75% and 90% repolarisation, respectively.
We found that in sedentary animals the APD was significantly longer in ENDO than in EPI cells, resulting in the expected transmural difference in APD (Fig. 8A). However, in trained cells the APD of ENDO cells was not significantly longer than that of EPI cells (Fig. 8B). The reduction in the transmural difference in APD was due to significant lengthening of the EPI APD in trained cells (Fig. 8C) with little change in ENDO APD (Fig. 8D).
Figure 8. Action potential records from representative myocytes.

A, ENDO S and EPI S myocytes showing regional differences in action potential duration (APD). B, ENDO T and EPI T left ventricular myocytes; note that the regional difference in the late APD is absent. C and D, traces from previous panels emphasising the effect of training results in a lengthening of the APD in EPI cells.
DISCUSSION
Our observations support the original hypothesis, that voluntary exercise training results in a modification of mechanical and electrical characteristics of left ventricular myocytes and that these responses to training are dependent upon the regional origin of the myocytes.
Running model of voluntary exercise
Our 6 week voluntary running exercise regime in young actively growing female rats, was able to provoke changes in cell morphology and physiology and is consistent with previous observations that enforced training regimes are not essential for the study of exercise-induced changes in myocyte physiology. Voluntary regimes are less likely to induce stress responses, which may complicate the outcome of coercive regimes (Rupp, 1989; Yancey & Overton, 1993; Asami et al. 1998; Moraska et al. 2000). The pattern of running activity and the distances run by rats in the present study are in agreement with those from previous studies (Rodnick et al. 1992; Natali et al. 2001). The degree of organ hypertrophy appeared well linked to the level of activity of the individual animals (Fig. 1B).
Whole animal and heart weights and regional concentric hypertrophy in myocytes
Trained animals showed significantly increased heart weight, left and right ventricular weight and ratios of these parameters to body weight, indicating organ hypertrophy (Table 1). Although the measurement of left ventricular weight will be influenced by loss of protein during enzymatic digestion, it seems unlikely that these errors will be dependent upon treatment or regional origin, thus our measurements should remain valid for the comparison of organs and tissue. The observation that the W:D ratio was not different between cell types suggests that cell depth increases in proportion to width, and that the assumption made in the calculation of volume is valid. Voluntary running caused hypertrophy predominantly in the ENDO region, and there is an internal consistency between the 17 % left ventricular hypertrophy (Table 1) and the 40 % ENDO and 10 % EPI myocyte hypertrophy (Table 2) we observed. The major change to myocyte dimensions was an increase in ENDO cell width rather than length, therefore the cellular hypertrophy is regional and concentric in nature. Our observation of concentric cellular hypertrophy is consistent with the concentric response of the whole left ventricle in response to voluntary running reported by Woodiwiss & Norton (1995) and Woodiwiss et al. (1998). However, it should be noted that other studies have not reported such effects in response to voluntary running (e.g. Noble et al. 1999).
Regional effects upon contractility and [Ca2+]i
We observed no significant effect of region or training on cell shortening or [Ca2+]i transients; similar findings for training have been reported previously (Laughlin et al. 1992; Palmer et al. 1998; Natali et al. 2001), but increased contractility has been reported by Wisloff et al. (2001) and by Moore et al. (1993) under certain experimental conditions. Although cells from trained animals tended to show steeper re-lengthening-fluorescence relationships, these did not reach significance, thus providing no evidence for a change in myofibrillar Ca2+ sensitivity in our model, in agreement with Palmer et al. (1998), but in contrast to Diffee et al. (2001) and Wisloff et al. (2001) (but see below). These differences between studies may indicate that the precise method of training and experimentation (e.g. intensity and duration of exercise, sex, developmental stage of the subjects, and experimental techniques used to assess contractility) influences the response. It must also be acknowledged, in common with other studies that must compare myocyte populations in an unpaired manner, that typically only large effects can be detected. This point is demonstrated by our (uncommon) inclusion of power calculations, showing that changes in mean values of less than 10 % would generally be difficult to identify.
Unloaded cell shortening is the most widely used index of contractility in single cardiac myocyte studies. It has been shown that the inotropic response to interventions is qualitatively similar in both multicellular (Lee & Allen, 1989) and single-cell (White et al. 1995) preparations contracting ‘isometrically’ or ‘isotonically’, and that cell shortening is a reliable index of contractility. However, concentric cellular hypertrophy may be an important exception. In this situation the increased width of the hypertrophied cells does not contribute to the degree of cell shortening, but will contribute to the ability of the cell to generate force under a mechanical load. This is shown clearly in Fig. 7, where absolute force production is significantly greater in hypertrophied cells, but cell shortening is not. When force is normalised to cell CSA, the difference in force produced by trained and untrained cells was much less, although the difference was not completely abolished (Fig. 7C). Given that we have no evidence for a change in myofilament Ca2+ sensitivity in this model, one explanation for the increased force/CSA in trained cells is an increase in myofilament packing (see Anversa et al. 1986).
Regional effects upon length-tension relationships
Increased myocardial compliance in response to exercise is thought to be a mechanism that assists ventricular filling (Levine et al. 1991; Woodiwiss & Norton, 1995; Woodiwiss et al. 1998). This could arise from increased compliance of the trained myocytes or extra-myocyte connective tissue. We observed no effect of training on the passive properties of myocytes. In contrast to our previous findings, which were performed at ambient temperature (Cazorla et al. 2000b), we found that although rat ENDO myocytes tended to be stiffer than EPI myocytes (in both trained and sedentary animals), this difference was not significant (although the low power, 43 %, of this data should be noted). The giant elastic protein titin is thought to be responsible for the passive properties of cardiac muscle at physiological SLs (Granzier & Irving, 1995) and it is possible that passive stiffness is related to the relative expression of the short, stiff N2B and longer, supple N2A isomers of titin (Cazorla et al. 2000a; Wu et al. 2000). Although we measured no change in the passive properties of myocytes in response to training, it is difficult to predict what level of change in isomer expression would cause a measurable change in the passive mechanical properties in our system. We therefore measured both passive tension and isomer expression. In agreement with the observations of Cazorla et al. (2000a) we found that sedentary rat myocytes express exclusively the short isomer of titin, and further, that exercise does not provoke expression of the longer, more supple isomer.
Training increased the active-length-tension relationship in ENDO cells (Fig. 6C). Such an effect would complement the increased end diastolic volume observed in response to training in vivo (e.g. Levine et al. 1991), which has been reported to occur in whole hearts (e.g. Woodiwiss & Norton, 1995). It was suggested that the length-tension relationship is enhanced in papillary muscles (i.e. ENDO tissue) from trained rats (Mole 1978). The length-tension relationship is based upon changes in the affinity of troponin C for Ca2+ and increased [Ca2+]i transients (see Calaghan & White, 1999 for review). At present we have no knowledge as to whether stretch-induced changes in [Ca2+]i are affected by training and we saw no evidence for an effect of exercise on myofilament Ca2+ sensitivity (Fig. 3). However, it is interesting to note that these latter experiments were performed at a short SL, whilst the positive effects of training on myofilament Ca2+ sensitivity reported by Diffee et al. (2001) were at long SLs, and thus are consistent with our observation of an effect of training on the length-dependence of active tension.
Regional effects upon APD
Consistent with the heterogeneous effects of exercise on cell morphology and some aspects of mechanical activity, we observed that exercise caused a heterogeneous electrical response. There was selective lengthening of APD in EPI cells that resulted in a reduction of the EPI-ENDO APD gradient. This observation is similar to the finding by Shipsey et al. (1997) using a model of isoprenaline-induced hypertrophy. In the model used by Shipsey et al. (1997), the lengthening of EPI APD was thought to be due to reduced repolarising K+ currents (transient outward current, Ito1 and inward rectifier current, IK1; Bryant et al. 1999). However, Jew et al. (2001) reported greatest reduction in the sustained K+ current Isus in response to exercise training, but this study did not separate cells from different regions of the ventricular wall. Tibitts et al. (1981) reported little effect of training on the APD of papillary muscles, consistent with our observations in ENDO cells. The absence of an increase in APD in the most hypertrophied (i.e. ENDO) region in response to exercise-induced hypertrophy, is in contrast to the APD lengthening commonly associated with pathological hypertrophy (e.g. Marban, 2002). However, abnormal ECGs are associated with some exercise training. Flattening or inversion of the T-wave is one characteristic that is observed, and this mimics the changes in ECG associated with the pathological condition of HCM (Pelliccia & Maron, 2001). Flattening or inversion of the T-wave may be caused by a reduction in the EPI-ENDO APD gradient, and thus our observations may explain some of the ECG abnormalities seen in some athletes. A potential mechanism for our observations would be a reduction in repolarising K+ currents (see Shipsey et al. 1997).
In summary, it appears that in our young, actively growing female rats the responses of myocytes to exercise were dependent upon regional origin. The major mechanical adaptations to exercise in our model that would facilitate an increase in cardiac output are a regional increase in cell size to increase absolute contractile force and a steepening of the Frank-Starling mechanism, which would increase contractility for a given level of ventricular dilation. Regional alterations in ion channel activity seem likely to underlie the alterations seen in APD.
Acknowledgments
A. J. Natali is supported by CAPES (Brazilian Government-Brasilia-Brazil), L. A. Wilson is supported by the British Heart Foundation.
REFERENCES
- Antzelevitch C, Sicouri S, Litovsky SH, Lukas A, Krishnan SC, Di Diego JM, Gintant GA, Liu D-W. Heterogeneity within the ventricular wall: electrophysiology and pharmacology of epicardial, endocardial and M cells. Circulation Research. 1991;69:1427–1449. doi: 10.1161/01.res.69.6.1427. [DOI] [PubMed] [Google Scholar]
- Anversa P, Ricci R, Olivetti G. Quantitative structural analysis of the myocardium during physiologic growth and induced cardiac hypertrophy: a review. Journal of the American College of Cardiology. 1986;7:1140–1149. doi: 10.1016/s0735-1097(86)80236-4. [DOI] [PubMed] [Google Scholar]
- Asami S, Hirano T, Yamaguchi R, Tsurudome Y, Itoh H, Kasai H. Effects of forced and spontaneous exercise on 8-hydroxyguanosine levels in rat organs. Biochemical and Biophysical Research Communications. 1998;24:678–682. doi: 10.1006/bbrc.1998.8166. [DOI] [PubMed] [Google Scholar]
- Bryant SM, Shipsey J, Hart G. Normal regional distribution of membrane current density in the rat left ventricle is altered in catecholamine-induced hypertrophy. Cardiovascular Research. 1999;42:391–400. doi: 10.1016/s0008-6363(99)00033-4. [DOI] [PubMed] [Google Scholar]
- Calaghan SC, White E. The role of calcium in the response of cardiac muscle to stretch. Progress in Biophysics and Molecular Biology. 1999;71:1–31. doi: 10.1016/s0079-6107(98)00037-6. [DOI] [PubMed] [Google Scholar]
- Cazorla O, Freiburg A, Helmes M, Centner T, McNabb M, Wu Y, Trombitas K, Labeit S, Granzier H. Differential expression of cardiac titin isomers and modulation of cellular stiffness. Circulation Research. 2000a;86:59–67. doi: 10.1161/01.res.86.1.59. [DOI] [PubMed] [Google Scholar]
- Cazorla O, LeGuennec J-Y, White E. Regional differences in the length-tension relationship of single ventricular myocytes from rat and ferret hearts. Journal of Molecular and Cellular Cardiology. 2000b;32:735–744. doi: 10.1006/jmcc.2000.1115. [DOI] [PubMed] [Google Scholar]
- Diffee GM, Seversen EA, Titus MM. Exercise training increases the Ca2+ sensitivity of tension in rat cardiac myocytes. Journal of Applied Physiology. 2001;91:309–315. doi: 10.1152/jappl.2001.91.1.309. [DOI] [PubMed] [Google Scholar]
- Frampton JE, Harrison SM, Boyett MR, Orchard CH. Ca2+ and Na+ in rat myocytes showing different force-frequency relationships. American Journal of Physiology. 1991;261:C739–750. doi: 10.1152/ajpcell.1991.261.5.C739. [DOI] [PubMed] [Google Scholar]
- Fritz JD, Swartz DR, Greaser ML. Factors affecting polyacrylamide gel electrophoresis and electroblotting of high molecular weight myofibrillar proteins. Analytical Biochemistry. 1989;180:205–210. doi: 10.1016/0003-2697(89)90116-4. [DOI] [PubMed] [Google Scholar]
- Gannier F, Bernango J-C, Jacquemond V, Garnier D. Measurement of sarcomere dynamics simultaneously with auxotonic force in isolated cardiac cells. IEEE Transactions on Biomedical Engineering. 1993;40:1226–1232. doi: 10.1109/10.250578. [DOI] [PubMed] [Google Scholar]
- Granzier HL, Irving TC. Passive tension in cardiac muscle: contributions of collagen, titin, microtubules, and intermediate filaments. Biophysical Journal. 1995;68:1027–1044. doi: 10.1016/S0006-3495(95)80278-X. [DOI] [PMC free article] [PubMed] [Google Scholar]
- Hongo K, Kusakari Y, Konishi M, Kurihara S, Mochiziki S. Estimation of myofibrillar responsiveness to Ca2+ in isolated rat ventricular myocytes. Pflügers Archiv. 1998;436:639–645. doi: 10.1007/s004240050683. [DOI] [PubMed] [Google Scholar]
- Jew KN, Olsson MC, Mokelke EA, Palmer BM, Moore RL. Endurance training alters K+ current characteristics in rat cardiocytes. Journal of Applied Physiology. 2001;90:1327–1333. doi: 10.1152/jappl.2001.90.4.1327. [DOI] [PubMed] [Google Scholar]
- Kawai M, Hussain M, Orchard CH. Excitation-contraction coupling in rat ventricular myocytes after formamide-induced detubulation. American Journal of Physiology. 1999;277:H603–609. doi: 10.1152/ajpheart.1999.277.2.H603. [DOI] [PubMed] [Google Scholar]
- Laemmli UK. Cleavage of structural proteins during the assembly of the head of bacteriophage T4. Nature. 1970;227:680–685. doi: 10.1038/227680a0. [DOI] [PubMed] [Google Scholar]
- Laughlin MH, Schaefer ME, Sturek M. Effect of exercise training on intracellular free Ca transients in ventricular myocytes. Journal of Applied Physiology. 1992;73:1441–1448. doi: 10.1152/jappl.1992.73.4.1441. [DOI] [PubMed] [Google Scholar]
- Lee JA, Allen DG. Comparison of the effects of inotropic interventions on isometric tension and shortening in isolated ferret ventricular muscle. Cardiovascular Research. 1989;23:748–755. doi: 10.1093/cvr/23.9.748. [DOI] [PubMed] [Google Scholar]
- Levine BD, Laane LD, Buckey JC, Friedman DB, Blomqvist CG. Left ventricular pressure-volume and Frank-Starling relations in endurance athletes. Implications for orthostatic tolerance and exercise performance. Circulation. 1991;84:1016–1023. doi: 10.1161/01.cir.84.3.1016. [DOI] [PubMed] [Google Scholar]
- Marban E. Cardiac channelopathies. Nature. 2002;415:213–218. doi: 10.1038/415213a. [DOI] [PubMed] [Google Scholar]
- Mokelke EA, Palmer BM, Cheung JY, Moore RL. Endurance training does not affect intrinsic calcium current characteristics in rat myocardium. American Journal of Physiology. 1997;273:H1193–1197. doi: 10.1152/ajpheart.1997.273.3.H1193. [DOI] [PubMed] [Google Scholar]
- Mole PA. Increased contractile potential of papillary muscle from exercise-trained rats hearts. American Journal of Physiology. 1978;234:H421–425. doi: 10.1152/ajpheart.1978.234.4.H421. [DOI] [PubMed] [Google Scholar]
- Moore RL, Korzick DH. Cellular adaptations of the myocardium to chronic exercise. Progress in Cardiovascular Disease. 1995;37:371–396. doi: 10.1016/s0033-0620(05)80019-2. [DOI] [PubMed] [Google Scholar]
- Moore RL, Musch TI, Yelamarty RV, Scaduto JRC, Semanchick AM, Elensky M, Cheung JY. Chronic exercise alters contractility and morphology of isolated rat cardiac myocytes. American Journal of Physiology. 1993;264:C1180–1189. doi: 10.1152/ajpcell.1993.264.5.C1180. [DOI] [PubMed] [Google Scholar]
- Moraska A, Deak T, Spencer RL, Roth D, Fleshner M. Treadmill running produces both positive and negative physiological adaptations in Sprague-Dawley rats. American Journal of Physiology - Regulatory, Integrative and Comparative Physiology. 2000;279:R1321–1329. doi: 10.1152/ajpregu.2000.279.4.R1321. [DOI] [PubMed] [Google Scholar]
- Natali AJ, Turner DL, Harrison SM, White E. Regional hypertrophy induced by voluntary exercise and contraction-frequency relationships in single ventricular myocytes of rats. Journal of Experimental Biology. 2001;204:1191–1199. doi: 10.1242/jeb.204.6.1191. [DOI] [PubMed] [Google Scholar]
- Noble EG, Moraska A, Mazzeo RS, Roth DA, Olsson MC, Moore RL, Fleshner M. Differential expression of stress proteins in rat myocardium after free wheel of treadmill run training. Journal of Applied Physiology. 1999;86:1696–1701. doi: 10.1152/jappl.1999.86.5.1696. [DOI] [PubMed] [Google Scholar]
- Palmer BM, Trayer AM, Snyder SM, Moore RL. Shortening and [Ca2+] dynamics of left ventricular myocytes isolated from exercise-trained rats. Journal of Applied Physiology. 1998;85:2159–2168. doi: 10.1152/jappl.1998.85.6.2159. [DOI] [PubMed] [Google Scholar]
- Pellicia A, Maron BJ. Athlete's heart electrocardiogram mimicking hypertrophic cardiomyopathy. Current Cardiology Reports. 2001;3:147–151. doi: 10.1007/s11886-001-0042-9. [DOI] [PubMed] [Google Scholar]
- Pellicia A, Maron BJ, Culasso F, Di Paolo FM, Spataro A, Biffi A, Caselli G, Piovano P. Clinical significance of abnormal electrocardiographic patterns in trained athletes. Circulation. 2000;102:278–284. doi: 10.1161/01.cir.102.3.278. [DOI] [PubMed] [Google Scholar]
- Rodnick KJ, Reaven GM, Haskell WL, Sims CR, Mondom CE. Variations in running activity and enzymatic adaptations in voluntary running rats. Journal of Applied Physiology. 1992;66:1250–1257. doi: 10.1152/jappl.1989.66.3.1250. [DOI] [PubMed] [Google Scholar]
- Rupp H. Differential effect of physical exercise routines on ventricular myosin and peripheral catecholamine stores in normotensive and spontaneously hypertensive rats. Circulation Research. 1989;65:370–377. doi: 10.1161/01.res.65.2.370. [DOI] [PubMed] [Google Scholar]
- Satoh H, Delbridge LMD, Blatter LA, Bers DM. Surface:volume relationship in cardiac myocytes studied with confocal microscopy and membrane capacitance measurements: species-dependence and development effects. Biophysical Journal. 1996;70:1494–1504. doi: 10.1016/S0006-3495(96)79711-4. [DOI] [PMC free article] [PubMed] [Google Scholar]
- Shipsey SJ, Bryant SM, Hart G. Effects of hypertrophy on regional action potential characteristics in the rat ventricle: a cellular basis for T-wave inversion? Circulation. 1997;96:2061–2068. doi: 10.1161/01.cir.96.6.2061. [DOI] [PubMed] [Google Scholar]
- Tibbits GF, Barnard RJ, Baldwin KM, Cugaig N, Roberts NK. Influence of exercise on excitation-contraction coupling in rat myocardium. American Journal of Physiology. 1981;240:H472–480. doi: 10.1152/ajpheart.1981.240.4.H472. [DOI] [PubMed] [Google Scholar]
- Wang K. Sarcomere-associated cytoskeletal lattices in striated muscle. Review and hypothesis. Cell and Muscle Motility. 1985;6:315–369. doi: 10.1007/978-1-4757-4723-2_10. [DOI] [PubMed] [Google Scholar]
- White E, Boyett MR, Orchard CH. The effect of mechanical loading and changes of length on single guinea-pig ventricular myocytes. Journal of Physiology. 1995;482:93–107. doi: 10.1113/jphysiol.1995.sp020502. [DOI] [PMC free article] [PubMed] [Google Scholar]
- White FC, Breisch EA, Nimmo LA, Witzel G, Bloor CM. Regional capillary and myocyte distribution in normal and exercise trained male and female rat hearts. American Journal of Cardiac Pathology. 1988;2:247–253. [PubMed] [Google Scholar]
- Wisloff U, Loennechen JP, Falck G, Beisvag V, Currie S, Smith G, Ellingsen O. Increased contractility and calcium sensitivity in cardiac rat myocytes isolated from endurance trained rats. Cardiovascular Research. 2001;50:495–508. doi: 10.1016/s0008-6363(01)00210-3. [DOI] [PubMed] [Google Scholar]
- Woodiwiss AJ, Norton GR. Exercise-induced cardiac hypertrophy associated with an increased myocardial compliance. Journal of Applied Physiology. 1995;78:1303–1311. doi: 10.1152/jappl.1995.78.4.1303. [DOI] [PubMed] [Google Scholar]
- Woodiwiss AJ, Oosthuyse T, Norton GR. Reduced cardiac stiffness following exercise is associated with preserved myocardial collagen characteristics in the rat. European Journal of Applied Physiology. 1998;78:148–154. doi: 10.1007/s004210050400. [DOI] [PubMed] [Google Scholar]
- Wu Y, Cazorla O, Labeit D, Labeit S, Granzier H. Changes in titin and collagen expression underlie diastolic stiffness diversity of cardiac muscle. Journal of Molecular and Cellular Cardiology. 2000;32:2111–2114. doi: 10.1006/jmcc.2000.1281. [DOI] [PubMed] [Google Scholar]
- Yancey SL, Overton JM. Cardiovascular responses to voluntary and treadmill exercise in rats. Journal of Applied Physiology. 1993;75:1334–1340. doi: 10.1152/jappl.1993.75.3.1334. [DOI] [PubMed] [Google Scholar]