Abstract
This study compared directly the post-ischaemic behaviour of sensory and motor axons in the human median nerve, focusing on the excitability changes produced by ischaemia and its release and by continuous polarizing DC. The decrease in threshold during ischaemia for 13 min was greater, the post-ischaemic increase in threshold was more rapid, and the return to the pre-ischaemic excitability took longer in sensory axons. However, a transient depolarizing threshold shift developed in sensory axons a few minutes after release of ischaemia. This pattern could not be reproduced by polarizing currents designed to mimic the probable pump-induced changes in membrane potential, even though the applied currents produced greater changes in threshold. Hyperpolarizing currents of equivalent intensity produced a greater increase in threshold for motor axons than sensory axons and, in studies of threshold electrotonus using graded hyperpolarizing DC, accommodation was greater in sensory than motor axons. The post-ischaemic changes in threshold were not uniform for axons of different threshold, whether sensory or motor, the threshold increase was usually less prominent for low-threshold axons. A transient post-ischaemic depolarization could be produced in motor axons with ischaemia of 20 min duration. Greater ischaemic and post-ischaemic changes in threshold for sensory axons could reflect greater dependence on the electrogenic Na+-K+ pump to maintain resting membrane potential and/or greater extracellular K+ accumulation in ischaemic sensory axons. Inward K+ currents due to extracellular K+ accumulation would then be more likely to trigger a depolarizing shift in membrane potential, the degree of K+ accumulation and pump activity being dependent on the duration of ischaemia. In sensory axons the greater tendency to accommodate to hyperpolarizing stimuli presumably contributes to shaping their post-ischaemic behaviour but is probably insufficient to explain why their behaviour differs from that of motor axons.
Physiological evidence has been presented for a number of biophysical differences between human sensory and motor axons. Strength-duration time constant (τSD) is longer and rheobase (Irh) lower (Panizza et al. 1994; Mogyoros et al. 1996; Bostock & Rothwell, 1997), possibly because a very slowly inactivating persistent Na+ conductance (INaP) contributes more to the total nodal Na+ conductance in sensory axons than in motor axons (Bostock & Rothwell, 1997). In addition, sensory axons have been reported to accommodate more to long-lasting hyperpolarizing currents than motor axons, suggesting greater expression of the hyperpolarization-activated cation current (IH) responsible for inward rectification in axons (Bostock et al. 1994). The changes in excitability during the relatively refractory, supernormal and late subnormal periods following a single conditioning discharge are greater for motor axons than sensory (Kiernan et al. 1996). However, despite the differences detailed above, there is no consistent evidence for a difference in resting membrane potential for these axons (Burke et al. 1997; Bostock et al. 1998), possibly because adequate compensation can be achieved by, e.g. adjusting the activity of the electrogenic Na+-K+ pump.
The evidence for these biophysical differences is indirect, largely based on studies of physiological responses. Nevertheless, these differences have been invoked to explain the behaviour of sensory and motor axons and their tendency to develop ectopic activity during ischaemia (Mogyoros et al. 1997), after release of ischaemia (Bostock et al. 1991a, b, 1994) and when they conduct prolonged impulse trains (Bostock & Bergmans, 1994; Kiernan et al. 1997a, b; Vagg et al. 1998). They have also been invoked as factors likely to produce a greater susceptibility of motor axons to undergo conduction block in acquired demyelinating neuropathies (Burke et al. 1997; Vagg et al. 1998; Cappelen-Smith et al. 2000; Kaji et al. 2000).
There is only one report in the literature directly addressing differences in accommodation of sensory and motor axons to hyperpolarizing stimuli, a study undertaken on ulnar nerve axons to explain why post-ischaemic behaviour was different (Bostock et al. 1994). As raised in Discussion, there have been refinements of threshold tracking techniques since this study (Bostock et al. 1998; Kiernan et al. 2000), but there has been no confirmation of this important finding or demonstration that it applies to other upper limb nerves.
The primary process underlying post-ischaemic behaviour is the hyperpolarization associated with resumption of activity by the electrogenic Na+-K+ pump, but this may be modified by the extent of extracellular K+ accumulation (Bostock et al. 1991b) and by differences in biophysical properties of the sensory and motor axons (Bostock et al. 1994). The present study was undertaken to dissect the mechanisms that underlie the differences in post-ischaemic behaviour of sensory and motor axons, the hypothesis being that differences in these mechanisms can predispose axons of different modality to dysfunction when subjected to physiological or pathological disturbances. Unexpectedly, it was found that the threshold decrease during ischaemia was greater, and the threshold increase after ischaemia was of longer duration for sensory axons. If, due to greater dependence on pump activity to maintain membrane potential, an inward K+ current might be more likely in post-ischaemic sensory axons (seeBostock et al. 1991b). Reassuringly, sensory axons underwent greater accommodation to hyperpolarizing currents, even when recently appreciated technical issues were addressed, and the responses of axons of different threshold following ischaemia of different duration suggested that the differences between sensory and motor axons were quantitative rather than qualitative.
METHODS
Eighty-three experiments were performed on 12 healthy subjects (6 females, 6 males, aged 18-56 years), all of whom gave informed written consent to the procedures which had been approved by the Committee on Experimental Procedures Involving Human Subjects of the University of New South Wales, in accordance with the Declaration of Helsinki. In each subject, identical studies were performed on sensory and motor axons in the median nerve at the wrist.
In all experiments, threshold and other indices of excitability of sensory and motor axons were followed using threshold tracking. The techniques used and the principles of threshold tracking have been described in full previously (Bostock & Baker, 1988; Bostock et al. 1998). Experiments were performed: (i) to compare axonal behaviours during and after ischaemia for 13 min or during continuous polarizing DC for 13 min, (ii) to measure threshold electrotonus using graded hyperpolarizing currents, and (iii) to assess the responses of axons of different threshold during and after ischaemia of different duration.
The median nerve was stimulated using ‘non-polarizable’ surface electrodes (Red-Dot; 3M Canada, London, Ontario, Canada), with the cathode at the wrist and an anode 4 cm proximal when measuring excitability during and after ischaemia. The stimulating site and conditions were therefore identical for sensory and motor axons in the nerve. When measuring threshold electrotonus and changes to polarizing DC, a dispersive anode was placed over forearm muscle some 10-20 cm proximal to the cathode. The compound sensory action potential (CSAP) was recorded antidromically from the index finger in response to stimulation at the wrist, as described previously (Grosskreutz et al. 1999, 2000). The compound muscle action potential (CMAP) was recorded using surface electrodes over the abductor pollicis brevis, with the active electrode at the motor point and the reference on the proximal phalanx. Stimuli were delivered using a PC running the QTRAC programme (Professor H. Bostock, Institute of Neurology, London, UK) to control a constant-current source that delivered different stimuli or stimulus combinations in a regular sequence. In most experiments, proportional tracking was used to determine the threshold current necessary to produce a CSAP/CMAP that was 50 % of maximum. With proportional tracking, increases or decreases in the intensity of a test stimulus are proportional to the error between the CSAP/CMAP recorded in the immediately preceding stimulus cycle and the target CSAP/CMAP (50 % of maximum in 55 of the 83 experiments). In 28 experiments, the thresholds for CSAPs or CMAPs of 10-90 % of maximum were followed during and after ischaemia to determine whether all axons contributing to the CSAP or CMAP behaved in a uniform manner.
Conditioning stimuli and stimulation protocols
Ischaemia
In eight subjects the changes in threshold, supernormality and strength-duration time constant (τSD) of median sensory and motor axons were tracked simultaneously before, during and after ischaemia for 13 min produced by a sphygmomanometer cuff wrapped around the upper arm and inflated to >200 mmHg. A total of 10 stimuli (5 for sensory axons and 5 for motor axons) were delivered in a repeating sequence at 0.5 s intervals from a constant-current source, such that each measure was updated every 5 s.
The maximal CSAP and CMAP were measured using supramaximal stimuli on two separate channels (one for sensory axons and one for motor axons), and the amplitude of the target potentials for the other stimulus channels were set to be a fixed percentage of the appropriate maximal potentials. This recently introduced feature minimized the effects of changes in amplitude of, particularly, the CSAP due to dispersion of the compound volley (Lin et al. 2002), but the option was not available for previous studies (Bostock et al. 1991a, b, 1994; Mogyoros et al. 1997). The current that produces a compound sensory or motor action potential of fixed amplitude (usually 50 % of maximum) is referred to as the ‘threshold’ for that potential and was measured using unconditioned test stimuli of 0.1 and 1.0 ms duration. Supernormality was measured as the increase in excitability produced by a maximal conditioning stimulus, 7 ms before the test stimulus. The test stimuli were thus timed to sample the peak of supernormal excitability following the conditioning discharge (Kiernan et al. 1996; Lin et al. 2000). For these data, the test potential was measured on-line after subtraction of the maximal potential produced on the supramaximal stimulus channel. The extent of supernormality was expressed as the normalized decrease in threshold current necessary to produce the target potential (i.e. (conditioned threshold current minus unconditioned threshold current) divided by unconditioned threshold current as a percentage). Strength-duration properties were quantified as the ratio of the thresholds to unconditioned test stimuli of 0.1 and 1 ms duration (I0.1 and I1.0, respectively), hence ‘threshold ratio’. In addition, strength-duration time constant (τSD) was calculated from I0.1 and I1.0, in accordance with Weiss' formula (Mogyoros et al. 1997; Bostock et al. 1998; Grosskreutz et al. 1999, 2000). τSD is a nodal property that reflects the extent to which threshold current decreases as the duration of the test stimulus increases.
Changes in membrane potential produced by continuous DC
In six subjects, the changes in excitability of sensory and motor axons during a continuous depolarizing DC ramp followed by a continuous hyperpolarizing DC ramp were measured (Fig. 3). The strength of the continuous depolarizing DC increased linearly to 30 % of resting I1.0 over 13 min, reversed to 30 % hyperpolarizing over 20 s, and then decreased linearly to zero over 13 min. In a separate set of experiments on these subjects, the hyperpolarization was held constant at 30 % of resting I1.0 for 5 min before decaying to zero over 13 min (Fig. 3C). To ensure that sensory and motor axons were subjected to equivalent polarizing currents, these experiments were repeated with the strength of the continuous DC polarization as a percentage of rheobasic threshold (Irh). The Irh values were calculated for sensory and motor axons based on the resting threshold currents to I0.1 and I1.0 using the following formula derived from Weiss' Law (Bostock & Bergmans, 1994):
Figure 3. Responses to continuous depolarizing and hyperpolarizing current ramps.
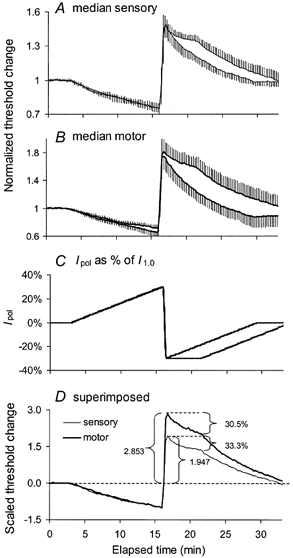
Mean data for 6 subjects (± s.e.m.). A, normalized threshold changes for median sensory axons in response to the two polarizing current profiles shown in C. B, median motor responses to the polarization in C. The polarizing sequences had the same depolarizing ramp to a maximum of 30 % of I1.0, but different hyperpolarization ramps, one decaying immediately from peak hyperpolarization (30 % of I1.0), the other holding that level for 5 min before decaying to zero. D, superimposition of the mean responses to sustained hyperpolarization in A and B after scaling so that the extent of depolarization was 1.0 for sensory and motor axons. Note that equivalently strong currents produced much greater threshold increases than threshold decreases, and that this was particularly so for motor axons.
Threshold electrotonus
This was measured for sensory and motor axons, as described by Bostock & Baker (1988) and Baker & Bostock (1989). The full threshold electrotonus waveforms in the hyperpolarizing direction only were determined by measuring the changes in threshold produced by hyperpolarizing current lasting 300 ms (with intensities of −40 and −80 % of the unconditioned threshold) before, and at various intervals during and after the conditioning current. In eight subjects, the threshold changes were measured 100 and 300 ms after the onset of a hyperpolarizing current pulse lasting 330 ms. These intervals were chosen because the threshold increase to hyperpolarizing current was maximal at ≈100 ms (see Fig. 5A), and the accommodative changes in threshold due to the hyperpolarization-activated conductance (IH) are well developed at 300 ms. The intensity of the hyperpolarizing current was changed from 0 to −100 % in steps of 10 %.
Figure 5. Threshold electrotonus to hyperpolarizing currents.

A, threshold electrotonus of median sensory (○) and motor (•) axons from a single subject. The changes in threshold were produced by hyperpolarizing currents of 300 ms duration with intensities of - 40 and - 80 % of the unconditioned threshold as shown in the lower panel. The thresholds start to diverge ≈30 ms after the onset of the hyperpolarizing current (unlabelled vertical arrows). The changes in threshold were maximal at ≈100 ms (dashed vertical line). The extent of accommodation (S3) was calculated as the threshold increase at 100 ms minus that at 300 ms (the end of the current pulse). B, the relationship between S3 accommodation and threshold change (S1). Mean data (± s.e.m.) for eight subjects. S3 accommodation is the difference between thresholds measured at 100 and 300 ms (horizontal dashed lines in A) after the onset of the hyperpolarizing current. S1 is the threshold measured 100 ms after the onset of the hyperpolarizing current minus the fast (F) threshold change, presumably reflecting the spread of hyperpolarization to the internode. The sloping lines link sensory and motor data for the equivalent polarizing strength. Accommodation (S3) was consistently greater for sensory axons. When S1 was approximately −230 %, the difference in S3 was statistically significant (P = 0.0011).
Responses of sensory and motor axons of different threshold to ischaemia and its release
In three subjects, the responses of axons of different threshold (i.e. the currents required to produce compound action potentials with amplitudes from 10 to 90 % of maximum, in steps of 10 %) were followed before, during and after ischaemia for 13 min. In these experiments, the nine thresholds were tracked simultaneously (rather than derived from interpolation on repeated measurements of the stimulus- response curve - as used in previous studies, see Bostock et al. 1991b, 1994). To determine whether the difference in behaviour to ischaemia for 13 min was a qualitative difference or merely a quantitative difference dependent on the duration of ischaemia, these experiments were repeated using ischaemia of different duration.
Due to the possibility of long-lasting effects on axonal excitability, the above experiments were performed on separate days, at intervals of, usually, 1 week. In 12 additional experiments on six subjects the effects of ischaemia for 2, 5 and 10 min were assessed in the same experiments, with studies on sensory and motor axons performed on different days.
Changes in excitability under the cuff
In three subjects, the sphygmomanometer was placed around the wrist, and the threshold for CMAPs of 10-90 % of maximum was measured before, during and after cuff inflation for 13 min. These studies were undertaken to confirm whether there was a greater change in excitability under the cuff and, if so, whether this was associated with a transient post-ischaemic depolarizing threshold change in some motor axons.
Skin temperature was measured at the stimulus site and kept constant, greater than 32 °C, within ± 0.5 °C using radiant heat and blankets, when necessary. All data are given as the mean ± s.e.m.
RESULTS
Responses to ischaemia and its release
Changes in threshold, supernormality and strength- duration time constant (τSD) of median sensory and motor axons were measured in eight healthy subjects before, during and after ischaemia for 13 min. Prior to ischaemia, threshold was higher for the 50 % CMAP than the 50 % CSAP (I1.0, 4.98 ± 0.69 mA for motor axons and 3.00 ± 0.36 mA for sensory axons). To compare changes during and after release of ischaemia, the threshold changes were normalized to the pre-ischaemic level. At rest, supernormality produced a greater threshold decrease in motor axons than sensory axons (Fig. 1B; sensory, −13.1 ± 1.1 %; motor axons, −19.7 ± 1.2 %), and strength-duration properties were different (Fig. 1C; threshold ratios (I0.1 : I1.0) of 3.89 ± 0.09 for sensory axons and 3.68 ± 0.09 for motor axons, consistent with τSD for sensory of 0.48 ± 0.02 ms, motor, 0.43 ± 0.02 ms), much as reported previously (Kiernan et al. 1996; Mogyoros et al. 1996).
Figure 1. Changes in threshold (A), supernormality (B) and τSD (C) in median sensory and motor axons before, during and after ischaemia for 13 min.
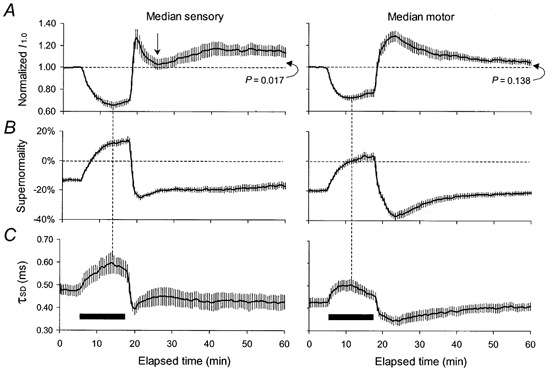
Mean data for 8 subjects (± s.e.m.). The duration of ischaemia is indicated by the filled horizontal bars, starting at 5 min. A, threshold changes measured using 1.0 ms test stimuli normalized to the pre-ischaemic values for median sensory axons (left column) and median motor axons (right column). B, supernormality, expressed as the decrease in threshold for the conditioned potential as a percentage of the unconditioned threshold when the conditioning-test interval was 7 ms. C, τSD, calculated off-line using unconditioned test stimuli of 0.1 and 1.0 ms duration. At 60 min (i.e. 42 min after the release of ischaemia), threshold was still significantly greater than the pre-ischaemic level for sensory axons but not for motor axons. Note that the ‘notch’ on the sensory threshold (indicated by the vertical arrow) is associated with appropriate changes in τSD and, less obviously, supernormality.
Ischaemic changes
The decrease in threshold during ischaemia was greater for sensory axons (indicated by vertical dashed lines in Fig. 1A; sensory decrease, 0.36 ± 0.03; motor, 0.30 ± 0.02; P = 0.02, paired Student's t test). Thereafter, threshold increased slightly but the decreases in I1.0 after ischaemia for 13 min were still significantly different (sensory, 0.31 ± 0.02; motor, 0.23 ± 0.03; P = 0.011). Supernormality decreased gradually during ischaemia, by more for sensory axons (≈27 %) than for motor axons (≈23 %), presumably reflecting the greater change in threshold. After 13 min sensory and motor axons had both become refractory at the 7 ms conditioning-test interval, by 14.26 ± 2.03 % and 3.45 ± 2.62 %, respectively (Fig. 1B). The threshold ratio changed, consistent with an increase in τSD by 0.122 ms to a maximum of 0.60 ± 0.05 ms for sensory axons and by 0.08 ms to 0.51 ± 0.03 ms for motor axons (Fig. 1C), the extent of the changes again reflecting the difference in the ischaemic changes in threshold. In Fig. 1, the dashed vertical lines between panels A and C show that the decrease in threshold and the increase in τSD reached maxima at the same time, but this occurred at ≈8-9 min for sensory axons and ≈6 min for motor axons. This difference is more obvious in the superimposed plots of Fig. 6D, and was significant (P = 0.003). The subsequent ‘accommodation’ of threshold and τSD have been the subject of a separate report (Lin et al. 2002).
Figure 6. Changes in threshold of median sensory and motor axons before, during and after ischaemia for 2, 5, 10 and 13 min.
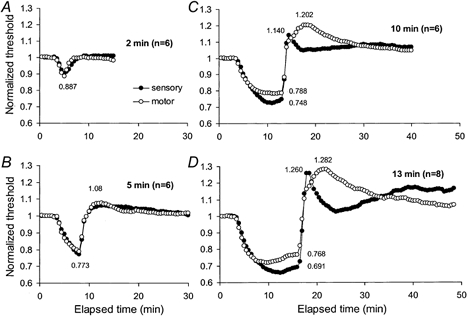
Mean thresholds for sensory (•) and motor (○) axons for 6 subjects for the 50 % compound-action potentials for ischaemia of 2, 5 and 10 min duration (A-C), and the data for 13 min from Fig.1 for 8 subjects (D). Thresholds were normalized to pre-ischaemic values. There was no significant difference between the responses of sensory and motor axons to ischaemia for 2 or 5 min. Differences became apparent with ischaemia for 10 min, and these were qualitatively similar to those with 13 min.
Post-ischaemic changes
Following release of ischaemia for 13 min, there was, with sensory axons, evidence of a rapidly developing long-lasting hyperpolarization, on which was superimposed a transient depolarizing change (or ‘notch’) in threshold. As expected from previous studies (Bostock et al. 1994, Mogyoros et al. 2000), paraesthesiae occurred in association with the depolarizing notch. The response of motor axons lacked this transient depolarizing threshold change, the duration of the decrease in threshold was shorter, and no subject experienced fasciculation. Instead, after an initial rapid change that brought threshold above the pre-ischaemic level (but below sensory threshold), there was a slow increase to a peak ≈5 min after the cuff deflation. Over the initial few minutes after the release of ischaemia, prior to the development of the notch, the threshold increase was greater for sensory axons.
In sensory axons, threshold reached its peak of 1.26 ± 0.09 some 1-2 min after cuff deflation and then decreased to 1.02 ± 0.05, some 7-8 min after cuff deflation (indicated by the arrow in Fig. 1A). At this time, threshold was significantly lower for sensory than motor axons (motor, 1.23 ± 0.05; P < 0.01). As the transient decrease in threshold waned, the threshold for sensory and motor axons changed in opposite directions over the 15 min beginning 7 min after cuff deflation, there being a slow increase for sensory axons and a slow decrease for motor axons. At the end of the traces in Fig. 1, 42 min after cuff deflation, sensory threshold was still significantly elevated (1.14 ± 0.04; P = 0.017) while motor threshold had returned to control levels (1.05 ± 0.03; P = 0.138). These differences in the post-ischaemic threshold trajectories were accompanied by appropriately different changes in supernormality and τSD.
Relationship of supernormality and τSD to I1.0
Supernormality and strength-duration properties are dependent on membrane potential, and there should be appropriate changes in them during and after ischaemia, such changes being driven by the changes in membrane potential. The relationships between supernormality and I1.0 had much the same profile and slope during ischaemia (Fig. 2A), but the slopes differed for 15 min after the peak of the post-ischaemic hyperpolarization, significantly less steep than during ischaemia for sensory axons only (Fig. 2B). The data for sensory axons are consistent with the findings of Grosskreutz et al. (1999). For τSD, the relationships were similar for both sensory and motor axons during and after ischaemia (Fig. 2C and D).
Figure 2. Relationships of supernormality and τSD to normalized threshold for sensory and motor axons during and after ischaemia.
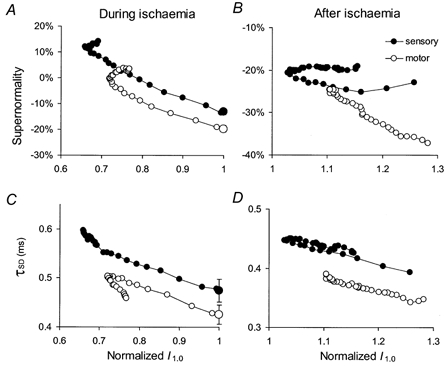
Mean data from Fig. 1B and C for median sensory (•) and median motor (○) axons are plotted against the normalized threshold (from Fig. 1A) during ischaemia (left column) and for 15 min after the peak in the post-ischaemic period (right column). The pre-ischaemic values are indicated by the large symbols at the threshold of unity (mean ± s.e.m.) in A and C. Apart from the baseline shift, the relationships for sensory and motor axons are generally similar, except in B, where the relationship for the sensory axons is less steep than for motor axons. In B and D, the threshold changes for sensory axons reflect the transient notch (indicated by the arrow in Fig. 1A) during which threshold rose to a peak, decreased then increased again.
Responses to depolarizing and hyperpolarizing DC
To determine the extent to which the post-ischaemic changes in threshold of sensory and motor axons could be attributed only to pump-induced hyperpolarization, three sets of experiments were performed in six subjects using continuous DC polarization. The first involved an increasing ramp of continuous depolarizing DC lasting 13 min to a maximum of 30 % of I1.0, immediately switching to a decreasing ramp of continuous hyperpolarizing DC, maximally 30 % of I1.0, decaying to zero over 13 min. The resulting threshold changes largely followed the polarizing currents (Fig. 3A and B). As the change in membrane potential following release of prolonged ischaemia could involve sustained hyperpolarization for some minutes before the decay to resting values, the experiments were repeated with the same polarizing ramps but holding the hyperpolarizing currents at 30 % of the I1.0 for 5 min before allowing it to decay to zero over 13 min. With this profile of polarization, thresholds decayed during the steady hyperpolarizing current, but did so for both sensory and motor axons.
When the strength of the polarizing currents was calculated as a percentage of I1.0 (as in Fig. 3), the normalized threshold changes were greater for motor axons for both depolarizing and hyperpolarizing current ramps. To compare the responses to the hyperpolarization in sensory and motor axons, the data were scaled such that depolarization produced threshold changes of 1.0 at the end of the depolarizing ramps (panel D). Following the rapid change from depolarization to hyperpolarization, scaled threshold increased to a maximum of 2.9 for motor axons and 1.9 for sensory axons before the decay (P < 0.001). Despite the relatively greater hyperpolarizing change in threshold for motor axons, the ‘sag’ occurring during the sustained hyperpolarization was similar for sensory axons (33.3 %) and motor axons (30.5 %).
Referring continuous polarizing currents to I1.0 would produce comparable changes in membrane potential only if the strength-duration properties for sensory and motor axons were identical. However, they are not (Mogyoros et al. 1996), and it is possible that this contributes to the greater threshold changes for motor axons for both the depolarizing and hyperpolarizing currents seen in Fig. 3. The experiments were therefore repeated with the polarizing current calculated as a percentage of rheobase, arguably a more appropriate reference, the maximal current being 50 % of Irh. In Fig. 4, the resulting changes in threshold for sensory and motor axons are superimposed in the upper panel, and the peak depolarization and peak hyperpolarization are plotted as histograms in the lower panel. Peak depolarization was similar for sensory and motor axons, but the peak of the hyperpolarization was significantly greater for motor axons (P = 0.003).
Figure 4. Responses to continuous depolarizing and hyperpolarizing currents ramps that were the same percentage of Irh.
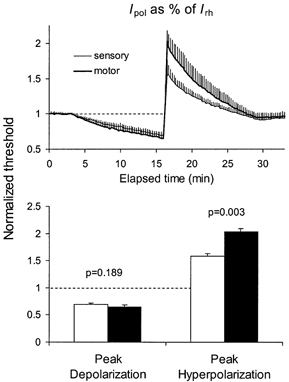
Mean data of 6 subjects (± s.e.m.). For each subject, Irh was calculated for sensory and for motor axons from the thresholds measured prior to polarization using stimuli of 0.1 and 1.0 ms duration. The applied polarizing currents were maximally ±50 % of these rheobasic values. There was no significant differences in the maximal threshold reduction produced by the depolarizing ramps but the threshold increases to hyperpolarizing current was much greater for motor axons. Open histograms: normalized thresholds for sensory axons; filled histograms: normalized thresholds for motor axons.
In Fig. 4, the threshold changes to depolarization and hyperpolarization are asymmetrical, there being a clear sag in the hyperpolarizing threshold increase and a less clear tendency to plateau in the depolarizing threshold decrease. These data suggest that accommodative mechanisms limit the full extent of the changes in threshold, and that any accommodative mechanisms are similar for sensory and motor axons during depolarization but quantitatively different during hyperpolarization.
Threshold electrotonus to hyperpolarizing currents
Bostock et al. (1994) demonstrated that accommodation to hyperpolarizing currents was greater on sensory than on motor axons in the ulnar nerve. There are no confirmatory reports in the literature, but the data in Fig. 3 and Fig. 4 are consistent with their report. The full threshold electrotonus response was therefore measured in three subjects in response to hyperpolarizing currents with intensities of 40 and 80 % of the unconditioned threshold (I1.0). The recordings for one subject are illustrated in Fig. 5A. In agreement with Bostock et al. (1994), the initial part of the threshold change was similar for sensory and motor axons, but a divergence began ≈33 ms after the onset of the polarizing current, as indicated by the vertical arrows. There was a clear difference in the threshold change and the accommodation to equivalent hyperpolarizing currents, with greater changes in threshold (i.e. greater peak of S1) and less accommodation to hyperpolarizing currents (S3) for motor axons than sensory axons.
As is conventional for threshold electrotonus, the 300 ms polarizing current was determined as a percentage of I1.0, and this raises the possibility that the applied currents may not have been truly equivalent (see Fig. 4). To control for this problem, additional studies were performed in eight subjects, in whom threshold electrotonus was measured at specific intervals (100 and 300 ms) in response to hyperpolarizing currents of graded intensity, from 0 to −100 % of I1.0 in steps of 10 % (Fig. 5B). The threshold change measured at 100 ms (S1) was greater for motor than sensory axons in response to equivalent hyperpolarizing currents, but accommodation to the hyperpolarizing change in membrane potential (S3) was consistently less in motor axons when the changes in threshold were matched. The threshold change in motor axons produced by the 90 % hyperpolarizing current was similar to the threshold change in sensory axons with the 100 % hyperpolarizing current (indicated by the vertical arrow in Fig. 5B at −230 %), but accommodation was much less for motor axons (P = 0.0011; paired Student's t -test). These findings confirm those of Bostock et al. (1994) for a different upper limb nerve and demonstrate that the apparently greater accommodation of sensory axons is not an artifact due to non-equivalence of the applied current.
Responses of axons of different threshold to brief ischaemia
The data above suggest that sensory axons undergo greater ischaemic depolarization and then a longer-lasting probably greater, pump-induced hyperpolarization (but with greater accommodation to the hyperpolarizing changes in membrane potential). To determine whether the greater threshold changes for sensory axons were apparent with shorter periods of ischaemia that did not produce the complicated post-ischaemic threshold trajectory in sensory axons, ischaemia was performed for 2, 5 and 10 min, in the same experiments, but on separate days for sensory and motor axons. Figure 6 shows the mean threshold for six subjects for the 50 % potentials together with the data for 13 min from Fig. 1 for eight subjects. Figure 7 and Figure 8 show the thresholds for potentials 10-90 % of maximum.
Figure 7. Responses of motor axons of different threshold to ischaemia for 2, 5 and 10 min.
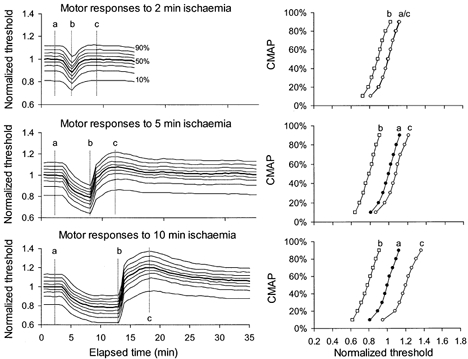
Mean data for 6 subjects, averaged after normalization so that the 50 % threshold was unity prior to ischaemia (thick line in left panel). Threshold changes during and after ischaemia for 2, 5 and 10 min showed a uniform pattern of behaviour for axons of different threshold. Stimulus-response curves at time intervals a, b and c are plotted in the right panels for the different durations of ischaemia. At interval c, the lowest-threshold axons were hyperpolarized less than higher-threshold axons following ischaemia for 5 and 10 min.
Figure 8. Responses of sensory axons of different threshold to ischaemia for 2, 5 and 10 min.
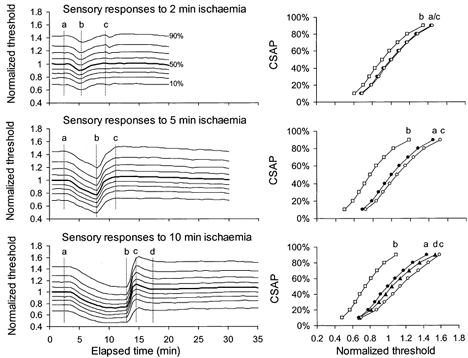
Mean data for 6 subjects, averaged after normalization to the 50 % threshold (thick line). Threshold changes during and after ischaemia for 2, 5 and 10 min all showed a uniform pattern of behaviour for axons of different threshold. Stimulus-response curves at time intervals a, b, c and d are plotted in the right panels.
There was no significant difference between the responses of sensory and motor axons to ischaemia lasting 2 or 5 min (Fig. 6A and B). The differences in Fig.1 with ischaemia for 13 min were present but quantitatively less with ischaemia for 10 min (Fig. 6C and D). The stimulus-response curves were flatter for sensory axons (compare right panels in Fig. 7 and Fig. 8), but the ischaemic decrease in threshold was much the same, i.e. ≈20 % with the 5 min ischaemia. With the 10 min ischaemia, sensory axons underwent a greater ischaemic decrease in threshold and a more abrupt increase in their threshold following release of ischaemia. In addition the return of threshold to the control level was slower than in motor axons (Fig. 6C), differences that are qualitatively similar to those seen with ischaemia for 13 min.
Post-ischaemic responses of axons of different threshold to prolonged ischaemia
Bostock et al. (1991b) explained post-ischaemic fasciculation on the accumulation of extracellular K+ ions in the restricted diffusion space under the myelin, creating a regenerative inward current when membrane potential was more negative than the equilibrium potential for K+. This explanation was supported by the studies of David et al. (1992, 1993) and Kapoor et al. (1993). Accordingly, the differences in behaviour of sensory and motor axons with ischaemia for ≥10 min might be quantitative rather than qualitative. Studying the behaviour of only those axons contributing to the 50 % compound potentials might not reveal qualitatively similar behaviour in axons of different threshold. In addition, more similar responses might be recorded if the duration of ischaemia was prolonged for motor axons.
In three subjects, the changes in excitability of axons of different threshold (10-90 % of maximal CSAP/CMAP) were measured before, during and after ischaemia for 13 min, the experiments being performed on different days. As in Fig. 7 and Fig. 8, all data were normalized to the threshold that produced a CSAP/CMAP that was 50 % of maximum prior to ischaemia so that changes could be compared across subjects.
Much as is shown in Fig. 8 for mean data following ischaemia for 10 min, median sensory axons of different threshold behaved uniformly during and after ischaemia for 13 min in 2 subjects (Fig. 9A). Nevertheless, the stimulus-response curves reveal that the transient post-ischaemic depolarization had a greater effect on lower threshold axons, such that threshold for the most excitable 10 % decreased below the pre-ischaemic level (interval c). In the third subject, axons of different threshold did not behave uniformly. The depolarizing ‘notch’ was less prominent than in subject A and was not present for the axons contributing to the 90 % CSAP, i.e. those of highest threshold. The stimulus-response curves show that, at interval c, the 70-90 % thresholds did not behave in the same manner as at intervals a and b.
Figure 9. Responses of sensory axons of different threshold to ischaemia for 13 min and its release for two subjects.
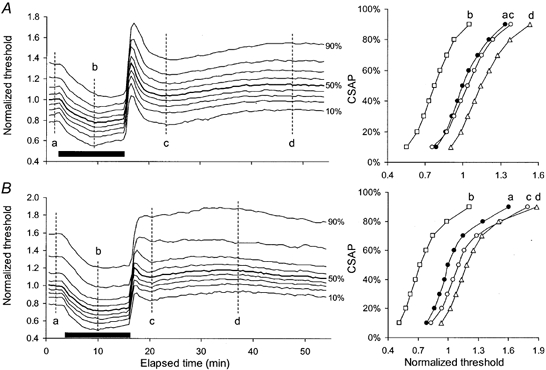
In A and B, the curves represent the changes in threshold for axons of different threshold (10 −90 %) contributing to the CSAP (on the left) with stimulus-response curves at the indicated times (plotted on the right). The data in A are from one subject but a similar pattern was seen in 2 of 3 subjects: axons of different threshold behaved uniformly during and after 13 min of ischaemia (indicated by the filled bar). The data on the right are stimulus-response curves at the times indicated by the vertical dashed lines: a, b, c and d. Panel B shows data from the third subject: axons of different threshold did not behave uniformly. The depolarizing notch is less obvious than in subject A and was not present for the axons of highest threshold.
In the three subjects motor axons of different threshold showed a uniform pattern of response following the release of ischaemia for 13 min. The average normalized data are illustrated in Fig. 10A, and show that, after an initial rapid rise above the pre-ischaemic level, threshold then increased more slowly, taking 5 min to reach maximum (as in Fig. 1). These experiments were repeated on different days (to avoid any long-lasting effects of ischaemia on axonal excitability), using ischaemia for 8 min (to see if the maximal threshold increase would occur earlier; see data for 2 subjects in Fig. 11) and for 20 min (to see if a post-ischaemic depolarizing ‘notch’ occurred in motor axons following a more intense, long-lasting stimulus, see Fig. 10B). The former did not occur (Fig. 11), but the latter did (Fig. 10 and Fig. 11). Figure 10B shows the average data for motor axons of different threshold, with a small notch after release of ischaemia, the extent of which differed for axons of different threshold. Stimulus-response curves in the right panel demonstrate that low-threshold axons became hyperexcitable during the notch at interval b. Between intervals c and d, there was a tendency for low-threshold axons to become less excitable as high-threshold axons became more excitable.
Figure 10. Responses of motor axons of different threshold to ischaemia for 13 min (A) and 20 min (B).
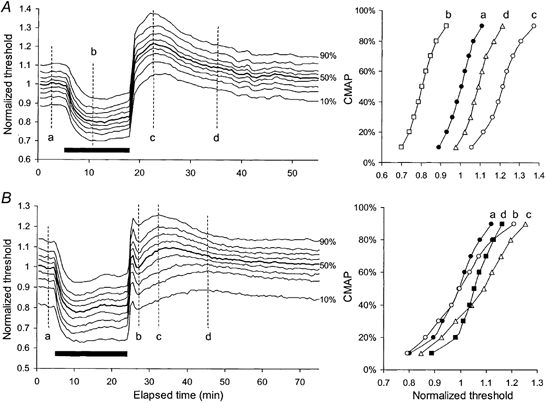
Mean data for 3 subjects, averaged after normalization so that the 50 % threshold was unity prior to ischaemia. A, threshold changes during and after ischaemia for 13 min showing a uniform pattern of behaviour for axons of different threshold. The stimulus-response curves at time intervals a, b, c and d are plotted in the right panel. B, following ischaemia for 20 min, the responses of motor axons of different threshold showed a small ‘notch’ after release of ischaemia (b). The extent of threshold change in the notch differed for high-threshold and low-threshold axons. Stimulus-response curves in the right panel demonstrate that low-threshold axons became hyperexcitable during the notch (b) and confirm contrasting threshold changes between c and d, with low-threshold axons becoming less excitable as high-threshold axons became more excitable.
Figure 11. Effects of ischaemia for 8, 13 and 20 min on motor axons in two subjects.
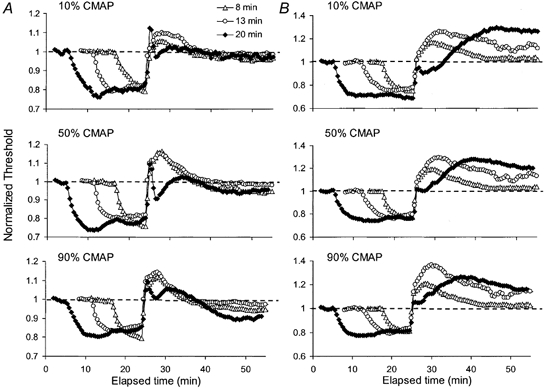
Thresholds required to produce compound muscle action potentials (CMAPs) of 10, 50 and 90 % of maximum were followed in two subjects during and after ischaemia for 8 min (▵), 13 min (○) and 20 min (♦). Threshold changes were normalized to the pre-ischaemic values and are aligned to the end of the ischaemia.
Figure 11 shows, for 2 of the 3 subjects, the threshold currents for CMAPs of 10, 50 and 90 % of maximum following ischaemia for 8, 13 and 20 min, normalized to the pre-ischaemic values, superimposed and aligned to the end of the ischaemia. The important features are that the depolarizing ‘notch’ was of briefer duration than in sensory axons; occurred with all axons contributing to the CMAP (though less so in those of highest threshold) and occurred only with the 20 min ischaemic insult. In subject B, it appears as if the ‘notch’ (with 20 min ischaemia) and the slowing of the rate of increase of the hyperpolarization (with 8 and 13 min) could represent gradations of the same phenomenon. Fasciculation was not noted following release of periods of ischaemia of 13 min duration or less, and it can be concluded that ‘notches’ and spontaneous activity arise more readily in sensory than motor axons.
Changes in excitability under the cuff
In three subjects the sphygmomanometer cuff was at the wrist over the stimulating electrodes so that the changes in excitability of motor axons under the cuff could be measured. Cuff inflation and deflation produced unavoidable artifactual transients. To compensate for the inflation/deflation artifact, threshold in the first 30 s after inflation was adjusted to the mean pre-inflation control value, and a comparable compensation was undertaken with cuff deflation. If anything this would have minimized the extent of threshold changes, but it would not have altered the pattern of the post-ischaemic changes. In all three subjects, the ischaemic and post-ischaemic changes in threshold in motor axons were greater for axons of different size but, in one subject (Fig. 12), there was a disproportionately smaller post-ischaemic increase in threshold for the axons of lowest threshold, contributing to the first 10 % of the CMAP. As a result, the threshold trajectories had a bimodal appearance for >10 min after the cuff deflation. A tendency for the post-ischaemic increase in threshold to be less for the lowest-threshold axons is apparent in other figures (e.g. Figs 7–10), even when there was no notch.
Figure 12. Threshold changes proximal to the cuff and under the cuff during and after ischaemia for 13 min in one subject.
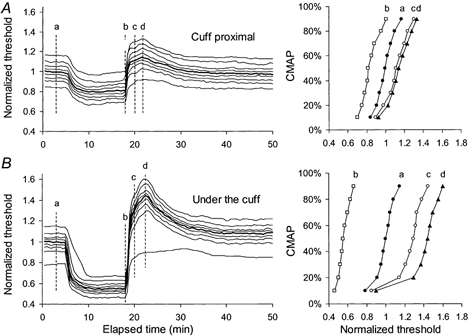
Responses of motor axons of different threshold to ischaemia for 13 min and its release were measured distal to the cuff (A) and under the cuff (B) in experiments on different days. All data were normalized to the 50 % threshold values. For the data in B, the thresholds were adjusted to compensate for the artifact produced by cuff inflation/deflation. Stimulus-response curves at time intervals a, b, c and d are plotted on the right. The ischaemic and post-ischaemic changes in excitability were greater under the cuff. The post-ischaemic threshold increase was less in low-threshold axons than high-threshold axons.
DISCUSSION
This study has analysed further the differences in behaviour of sensory and motor axons to ischaemic disturbances, continuous polarizing DC and long-lasting hyperpolarizing current pulses, extending the work of previous studies. The significant findings are: (i) ischaemic depolarization is greater for sensory axons with ischaemia ≥10 min, (ii) the post-ischaemic hyperpolarization may be greater for sensory axons following prolonged ischaemia (though the complex post-ischaemic trajectories complicate the interpretation), (iii) the failure of supernormality to vary with threshold following release of ischaemia occurs with sensory but not motor axons, (iv) hyperpolarizing currents of equivalent intensity produce a greater increase in threshold for motor axons than sensory axons, (v) accommodation to equivalent hyperpolarizing currents is greater in sensory than motor axons (presumably due to greater expression of IH in sensory axons), (vi) extreme or prolonged hyperpolarizing changes in membrane potential are insufficient by themselves to produce the transient depolarizing notch, (vii) sensory axons develop the transient post-ischaemic depolarization more readily than motor axons, but a notch can be induced in motor axons with longer ischaemic insults, and (viii) post-ischaemic changes in threshold are not uniform for axons of different threshold, whether sensory or motor.
Technical differences from other studies
The present study used recently introduced technical advances in threshold tracking (Bostock et al. 1998). First, test potentials were referenced to the supramaximal potential, which was updated each stimulus cycle. This ensured that the test potentials remained the same percentage of maximum, a necessary precaution because ischaemia decreases the size of the maximal potential (see Lin et al. 2002). Initially the changes in amplitude are due to dispersion (and this should have a greater effect on the CSAP than the CMAP), but ischaemia of long duration produces conduction block. Such referencing could not be done in previous studies using threshold tracking with the programmes then available (Bostock et al. 1991a,b, 1994; Mogyoros et al. 1997), and this may explain why the differences in the ischaemic changes in threshold were not apparent in the two reports that studied the responses of both types of axon (Bostock et al. 1994; Mogyoros et al. 1997). Secondly, when comparing responses of different fibre groups to polarizing current (whether continuous DC or long pulses for threshold electrotonus), it is more appropriate to refer the current to Irh rather than I1.0. Sensory axons have a lower rheobase than motor axons (Mogyoros et al. 1996) and, to ensure that sensory and motor axons undergo the same degree of polarization, the polarizing currents should be referred to Irh when their duration exceeds the latency of the rheobasic response (< 20 ms, see Bostock et al. 1991b; Mogyoros et al. 2000). The polarizing current in all previous threshold electrotonus studies has been referred to I1.0, and this was the case in the only previous study that documented a difference in accommodation to hyperpolarizing current between sensory and motor axons (Bostock et al. 1994). The present study used multiple polarizing levels (Fig. 5B) to obviate this problem with, reassuringly, findings that confirm the original conclusion. In addition, the present study extends these findings to a different upper-limb nerve (the median).
Ischaemic and post-ischaemic changes in threshold of sensory and motor axons are different
The greater changes in threshold for sensory axons with ischaemia for 10 min or more were probably the result of greater changes in membrane potential for sensory axons, because they were accompanied by greater changes in supernormality and τSD, both of which vary with membrane potential. This difference could reflect greater reliance of sensory rather than motor axons on the electrogenic Na+-K+ pump to maintain membrane potential.
Bostock & Rothwell (1997) concluded that there was a greater expression of persistent Na+ currents (INaP) in sensory axons than motor axons (2.5 and 1 % of the total Na+ conductance, respectively). INaP is active at rest and should contribute to the setting of resting membrane potential, and thereby play an important role in regulating axonal excitability around firing threshold. Differences in the expression of INaP are thought to explain the difference in strength-duration properties of sensory and motor axons (Mogyoros et al. 1996, 1997; Bostock & Rothwell, 1997), a difference confirmed in the present study. Inhibition of the electrogenic Na+-K+ pump leads to depolarization by around 10 mV (Schneider et al. 1993; Kiernan & Bostock, 2000). Sensory axons could be more dependent on pump activity than motor axons to maintain resting membrane potential given their greater INaP. This would explain the greater threshold changes in sensory axons with ischaemia.
However, other factors could contribute to greater ischaemic depolarization in sensory axons. In Fig. 4, the asymmetry between the threshold changes produced by depolarizing and hyperpolarizing currents is quite striking, especially for motor axons. This is consistent with limitation of the threshold change during depolarization by accommodative processes, presumably activation of K+ channels and inactivation (or blockage) of Na+ channels. However, the similarity of the threshold decreases in Fig. 4 suggests that voltage-dependent accommodative processes are equally active on sensory and motor axons and that the difference in the decreases in threshold during ischaemia is not due primarily to voltage-dependent membrane properties. Similarly, as mentioned earlier, the lesser threshold increase of sensory axons during hyperpolarization is consistent with greater accommodative mechanisms (presumably IH) on sensory rather than motor axons.
Mechanisms involved in the post-ischaemic excitability changes
Bostock et al. (1991b) presented evidence that a regenerative inward K+ current can be created when two conditions are met: first, extracellular K+ concentration is elevated so that the electrochemical gradient favours K+ influx and, second, the axons are hyperpolarized beyond the equilibrium potential for K+. They presented computer models indicating that, in hyperpolarized axons with high extracellular K+ concentration, minor alterations of pump activity could produce abrupt large changes in membrane potential, and this was sufficient to produce ‘bi-stability’ with motor axons flipping between a hyperpolarized state and a depolarized state. They suggested that post-ischaemic fasciculations involve transitions between two equilibrium states, occurring in axons with high extracellular potassium and high electrogenic pump activity. Direct evidence that K+ accumulation in the restricted diffusion space under the myelin can have profound effects on excitability has been presented by David et al. (1992, 1993) and Kapoor et al. (1993): elevation of the K+ concentration can lead to spontaneous spike activity through the rhythmic activation of internodal K+ currents. The K+ current may be activated either by the depolarizing effects of raised periaxonal K+ concentration or by brief extracellular negative current pulses.
These findings suggest that the transient increase in post-ischaemic excitability may be due to a combination of extracellular K+ accumulation and pump-induced hyperpolarization. While sensory responses are presumably modified by the greater expression of IH, the major cause of the difference in behaviour of sensory and motor axons would then be the extent of dependence on pump activity and/or the extent of extracellular K+ accumulation. The similarity of the ischaemic and post-ischaemic responses of sensory and motor axons to brief periods of ischaemia suggests that a factor that accumulates could be important in the differences seen with longer periods of ischaemia. It was reasoned that, if the differences between sensory and motor axons are quantitative rather than qualitative, the behaviour might become more similar when motor axons were subjected to ischaemia of longer duration (assuming that this did not cause conduction block). As shown in Fig. 10B and Fig. 11, when the duration of ischaemia was increased for motor axons, a notch could be demonstrated in the post-ischaemic threshold plots.
The present study raises the possibility that sensory axons may have a greater dependence on pump activity than motor axons, resulting in a difference in susceptibility to extracellular K+ accumulation. Alternatively, ischaemia could result in greater extracellular K+ accumulation in sensory axons. Either way, the extent to which differences in IH need to be invoked to explain the differences in post-ischaemic responses may be less than previously appreciated.
Functionally, it is unlikely that the differences described limit axonal function during natural behaviour: indeed, they may well result from adaptations designed to optimize normal function. However, as raised in Introduction, this may not be the case when the safety margin for impulse conduction is impaired by disease.
Acknowledgments
This study was supported by the National Health and Medical Research Council of Australia, the National Multiple Sclerosis Association of Australia, and Uehara Memorial Foundation (Japan).
REFERENCES
- Baker M, Bostock H. Depolarization changes the mechanism of accommodation in rat and human motor axons. Journal of Physiology. 1989;411:545–561. doi: 10.1113/jphysiol.1989.sp017589. [DOI] [PMC free article] [PubMed] [Google Scholar]
- Baker M, Bostock H. Inactivation of macroscopic late Na+ current and characteristics of unitary late Na+ currents in sensory neurons. Journal of Neurophysiology. 1998;80:2538–2549. doi: 10.1152/jn.1998.80.5.2538. [DOI] [PubMed] [Google Scholar]
- Bostock H, Baker M. Evidence for two types of potassium channel in human motor axons in vivo. Brain Research. 1988;462:354–358. doi: 10.1016/0006-8993(88)90564-1. [DOI] [PubMed] [Google Scholar]
- Bostock H, Bergmans J. Post-tetanic excitability changes and ectopic discharges in a human motor axon. Brain. 1994;117:913–928. doi: 10.1093/brain/117.5.913. [DOI] [PubMed] [Google Scholar]
- Bostock H, Rothwell JC. Latent addition in motor and sensory fibres of human peripheral nerve. Journal of Physiology. 1997;498:277–294. doi: 10.1113/jphysiol.1997.sp021857. [DOI] [PMC free article] [PubMed] [Google Scholar]
- Bostock H, Baker M, Grafe P, Reid G. Changes in excitability and accommodation of human motor axons following brief periods of ischaemia. Journal of Physiology. 1991a;441:513–535. doi: 10.1113/jphysiol.1991.sp018765. [DOI] [PMC free article] [PubMed] [Google Scholar]
- Bostock H, Baker M, Reid G. Changes in excitability of human motor axons underlying post-ischaemic fasciculations: evidence for two stable states. Journal of Physiology. 1991b;441:537–557. doi: 10.1113/jphysiol.1991.sp018766. [DOI] [PMC free article] [PubMed] [Google Scholar]
- Bostock H, Burke D, Hales JP. Differences in behaviour of sensory and motor axons following release of ischaemia. Brain. 1994;117:225–234. doi: 10.1093/brain/117.2.225. [DOI] [PubMed] [Google Scholar]
- Bostock H, Cikurel K, Burke D. Threshold tracking techniques in the study of human peripheral nerve. Muscle and Nerve. 1998;21:137–158. doi: 10.1002/(sici)1097-4598(199802)21:2<137::aid-mus1>3.0.co;2-c. [DOI] [PubMed] [Google Scholar]
- Burke D, Kiernan M, Mogyoros I, Bostock H. Susceptibility to conduction block: differences in the biophysical properties of cutaneous afferents and motor axons. In: Kimura J, Kaji R, editors. Physiology of ALS and Related Diseases. Amsterdam: Elselvier; 1997. pp. 43–53. [Google Scholar]
- Cappelen-Smith C, Kuwabara S, Lin CS-Y, Mogyoros I, Burke D. Activity-dependent hyperpolarization and conduction block in chronic inflammatory demyelinating polyneuropathy. Annals of Neurology. 2000;48:826–832. [PubMed] [Google Scholar]
- David G, Barrett JN, Barrett EF. Evidence that action potentials activate an internodal potassium conductance in lizard myelinated axons. Journal of Physiology. 1992;445:277–301. doi: 10.1113/jphysiol.1992.sp018924. [DOI] [PMC free article] [PubMed] [Google Scholar]
- David G, Barrett JN, Barrett EF. Activation of internodal potassium conductance in rat myelinated axons. Journal of Physiology. 1993;472:177–202. doi: 10.1113/jphysiol.1993.sp019942. [DOI] [PMC free article] [PubMed] [Google Scholar]
- Grosskreutz J, Lin C, Mogyoros I, Burke D. Changes in excitability indices of cutaneous afferents produced by ischaemia in human subjects. Journal of Physiology. 1999;518:301–314. doi: 10.1111/j.1469-7793.1999.0301r.x. [DOI] [PMC free article] [PubMed] [Google Scholar]
- Grosskreutz J, Lin CS-Y, Mogyoros I, Burke D. Ischaemic changes in refractoriness of human cutaneous afferents under threshold-clamp conditions. Journal of Physiology. 2000;523:807–815. doi: 10.1111/j.1469-7793.2000.t01-1-00807.x. [DOI] [PMC free article] [PubMed] [Google Scholar]
- Kaji R, Bostock H, Kohara N, Murase N, Kimura J. Activity-dependent conduction block in multifocal motor neuropathy. Brain. 2000;123:1602–1611. doi: 10.1093/brain/123.8.1602. [DOI] [PubMed] [Google Scholar]
- Kapoor R, Smith KJ, Felts PA, Davies M. Internodal potassium currents can generate ectopic impulses in mammalian myelinated axons. Brain Research. 1993;611:165–169. doi: 10.1016/0006-8993(93)91790-y. [DOI] [PubMed] [Google Scholar]
- Kiernan MC, Bostock H. Effects of membrane polarization and ischaemia on the excitability properties of human motor axons. Brain. 2000;123:2542–2551. doi: 10.1093/brain/123.12.2542. [DOI] [PubMed] [Google Scholar]
- Kiernan MC, Hales JP, Gracies JM, Mogyoros I, Burke D. Paraesthesiae induced by prolonged high frequency stimulation of human cutaneous afferents. Journal of Physiology. 1997a;501:461–471. doi: 10.1111/j.1469-7793.1997.461bn.x. [DOI] [PMC free article] [PubMed] [Google Scholar]
- Kiernan MC, Mogyoros I, Burke D. Differences in the recovery of excitability in sensory and motor axons of human median nerve. Brain. 1996;119:1099–1105. doi: 10.1093/brain/119.4.1099. [DOI] [PubMed] [Google Scholar]
- Kiernan MC, Mogyoros I, Hales JP, Gracies JM, Burke D. Excitability changes in human cutaneous afferents induced by prolonged repetitive axonal activity. Journal of Physiology. 1997b;500:255–264. doi: 10.1113/jphysiol.1997.sp022015. [DOI] [PMC free article] [PubMed] [Google Scholar]
- Lin CS-Y, Grosskreutz J, Burke D. Effects of sodium channel inactivation on the excitability of human cutaneous afferents during ischaemia. Journal of Physiology. 2002;538:435–446. doi: 10.1113/jphysiol.2001.012478. [DOI] [PMC free article] [PubMed] [Google Scholar]
- Lin CS-Y, Mogyoros I, Burke D. Recovery of excitability of cutaneous afferents in the median and sural nerves following activity. Muscle and Nerve. 2000;23:763–770. doi: 10.1002/(sici)1097-4598(200005)23:5<763::aid-mus14>3.0.co;2-d. [DOI] [PubMed] [Google Scholar]
- Mogyoros I, Kiernan MC, Burke D. Strength- duration properties of human peripheral nerve. Brain. 1996;119:439–447. doi: 10.1093/brain/119.2.439. [DOI] [PubMed] [Google Scholar]
- Mogyoros I, Kiernan MC, Burke D, Bostock H. Excitability changes in human sensory and motor axons during hyperventilation and ischaemia. Brain. 1997;120:317–325. doi: 10.1093/brain/120.2.317. [DOI] [PubMed] [Google Scholar]
- Mogyoros I, Lin CS-Y, Kuwabara S, Cappelen-smith C, Burke D. Strength-duration properties and their voltage dependence as measures of a threshold conductance at the node of Ranvier of single motor axons. Muscle and Nerve. 2000;23:1719–1726. doi: 10.1002/1097-4598(200011)23:11<1719::aid-mus8>3.0.co;2-w. [DOI] [PubMed] [Google Scholar]
- Panizza M, Nilsson J, Roth BJ, Rothwell J, Hallet M. The time constants of motor and sensory peripheral nerve fibers measured with the method of latent addition. Electroencephalography and Clinical Neurophysiology. 1994;93:147–54. doi: 10.1016/0168-5597(94)90078-7. [DOI] [PubMed] [Google Scholar]
- Schneider U, Quasthoff S, Mitrovic N, Grafe P. Hyperglycaemic hypoxia alters after-potential and fast K+ conductance of rat axons by cytoplasmic acidification. Journal of Physiology. 1993;465:679–697. doi: 10.1113/jphysiol.1993.sp019700. [DOI] [PMC free article] [PubMed] [Google Scholar]
- Vagg R, Mogyoros I, Kiernan MC, Burke D. Activity-dependent hyperpolarization of human motor axons produced by natural activity. Journal of Physiology. 1998;507:919–925. doi: 10.1111/j.1469-7793.1998.919bs.x. [DOI] [PMC free article] [PubMed] [Google Scholar]


