

Abstract
The objective of this study was to examine the effect of β-adrenergic stimulation upon voltage- and Ca2+-induced inactivation of native cardiac L-type Ca2+ channels. Whole-cell currents were recorded from guinea-pig isolated ventricular myocytes. Total and voltage-dependent inactivation was separated by replacing extracellular Ca2+ with Mg2+. L-type Ca2+ channel behaviour was monitored with outward Ca2+ channel currents. First, the voltage dependence of inactivation was studied at fixed times (50 and 1000 ms) after activation. This showed that under control conditions Ca2+ contributed little to inactivation. In isoproterenol (isoprenaline), voltage-dependent inactivation was markedly reduced and Ca2+ contributed largely to total inactivation. Second, the time dependence of inactivation was studied at a fixed voltage (+10 mV). In control conditions the fast phase of inactivation (τf ≈15 ms) was reduced to the same extent by ryanodine (τf ≈30 ms) and the absence of Ca2+ (τf ≈30 ms) while the slow phase of inactivation (τs ≈70 ms) was reduced by ryanodine (τs ≈160 ms) and further reduced in the absence of Ca2+ (τs≈300 ms). In isoproterenol, biphasic inactivation of Ca2+ currents (τf ≈4 ms, τs ≈60 ms) was replaced by a single slow (τ ≈450 ms) phase of inactivation in the absence of Ca2+. It is concluded that, under control conditions Ca2+ channel current decay is largely dominated by rapid voltage-dependent inactivation, while in isoproterenol this is replaced by Ca2+-induced inactivation.
Inactivation of L-type Ca2+ currents in native cardiac myocytes results from processes associated with membrane voltage and intracellular Ca2+ (Lee et al. 1985; Sanguinetti et al. 1986; Hadley & Hume, 1987; Hadley & Lederer, 1991). This mechanism serves to limit Ca2+ influx during the cardiac action potential and coordinate coupling between electrical excitation and mechanical contraction. The relative contributions of membrane voltage and Ca2+ flux to the decay of L-type Ca2+ currents have been extensively investigated (Pelzer et al. 1990) though it remains to be determined whether these represent two independent mechanisms or two means of activating a common physical reaction (Anderson, 2001). The critical point in any practical investigation of this problem is the method used to prevent Ca2+-induced inactivation and thus to effectively isolate the contribution of membrane voltage. The most commonly used approach has been to replace Ca2+ with Ba2+. Ba2+ has been considered incapable of substituting for Ca2+ in the Ca2+-induced inactivation process (Lee et al. 1985) while it adequately replaces Ca2+ to support current flow through sarcolemmal Ca2+ channels (Lee & Tsien, 1984). The extent to which these assumptions are true has recently been questioned. Ferreira et al. (1997) provided evidence for a contribution of Ba2+ to ion-induced inactivation. Findlay (2002) suggested that while Ba2+ current decay could be described by a voltage-dependent process under control conditions, following β-adrenergic stimulation an ion-dependent process was indicated. Since it is of obvious interest to investigate the regulation of L-type Ca2+ channels under different physiological conditions (Kamp & Hell, 2000), it is important that the criteria applied to isolate different components of decay are consistent.
An alternative method of avoiding interference with Ca2+-induced inactivation is to replace divalent cation flow through Ca2+ channels by monovalent cation flux (Tsien et al. 1987). There is no evidence that monovalent cations influence the process of Ca2+-induced inactivation to date. This procedure has been adopted in a number of studies where it served to represent the contribution of voltage-dependent inactivation in evaluations of the behaviour of native cardiac L-type Ca2+ currents (Linz & Meyer, 1998; Puglisi et al. 1999; Sun et al. 2000). It was not appreciated until recently (Mitarai et al. 2000) that β-adrenergic stimulation, or its equivalent in terms of experimental conditions which includes the addition of cAMP to an ‘intracellular’ solution, might influence voltage-dependent inactivation of Ca2+ channels. Thus two classic studies of monovalent cation flux through Ca2+ channels (Fukushima & Hagiwara, 1985; Matsuda, 1986) which presented Na+ current decay as exceedingly slow by comparison with Ca2+ current, in fact described what was the equivalent of voltage-dependent inactivation following β-adrenergic stimulation. Mitarai et al. (2000) showed that under control conditions the voltage-dependent inactivation of Na+ current through Ca2+ channels could be fast and Findlay (2002) showed that decay of Na+ currents through Ca2+ channels under control conditions could rival that of currents carried by divalent cations at equivalent membrane voltages.
In 1987, Hadley and Hume illustrated a method of recording the current through L-type Ca2+ channels in the absence of extracellular Ca2+. This consisted of replacing extracellular Ca2+ by the Ca2+ channel-blocking and impermeant divalent cation Mg2+ (Fukushima & Hagiwara, 1985). Extracellular Mg2+ blocks monovalent cation influx via Ca2+ channels, but its block of monovalent cation efflux is relieved by membrane voltage and/or the driving force for cations leaving the cell (Fukushima & Hagiwara, 1985; Ellinor et al. 1995; Dang & McCleskey, 1998). The result is rectification of current flow through the Ca2+ channel (Hess et al. 1986). Thus below +20 mV there is no current flow; above +10 mV outwardly rectified currents are carried by K+ (see Fig. 1). This method was used in this study to separate voltage-dependent inactivation of L-type Ca2+ channels from total inactivation associated with voltage and Ca2+.
Figure 1. Inward and outward Ca2+ channel currents.
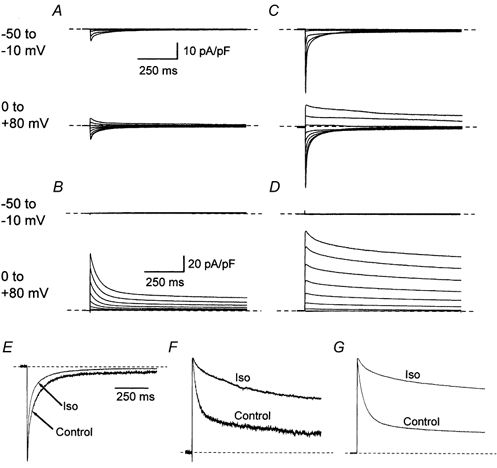
1000 ms duration voltage clamp steps to between −50 and +80 mV in 10 mV increments were used to evoke whole-cell currents. The currents shown here were recorded from two representative isolated ventricular myocytes under either control conditions (A and B) or in the presence of 100 nm isoproterenol (C and D). The myocytes were bathed in either normal extracellular solution (A and C) or zero calcium extracellular solution (B and D). The records represent superimposed cell current traces which were separated into two groups corresponding to currents recorded during voltage steps to between −50 and −10 mV, and to between 0 and +80 mV as indicated to the left of the traces. In each set of traces the dashed line indicates the 0 pA current level. The time and current scale bars in A and B are appropriate for traces in A and C, and B and D, respectively. E-G, individual cell currents from the two cells (control, A, B and isoproterenol (Iso), C, D) were normalised to their peak amplitude and superimposed. Cell currents were recorded in normal extracellular solution during voltage steps to either +10 mV (E) or +80 mV (F). G, cell currents were recorded in zero calcium extracellular solution during voltage steps to +80 mV.
The discovery that β-adrenergic stimulation can profoundly influence voltage-dependent inactivation of L-type Ca2+ currents in cardiac myocytes (Mitarai et al. 2000; Findlay, 2002) has not yet been integrated into descriptions of cardiac electrophysiology. This study was therefore undertaken as the first step towards delimiting the contributions of voltage- and Ca2+-induced inactivation of L-type Ca2+ channel currents in native cardiac myocytes and their modulation by β-adrenergic stimulation. The results show that under control conditions, membrane voltage plays a very large part in the decay of Ca2+ channel currents. The suppression of this rapid voltage-dependent decay by isoproterenol then leaves Ca2+-induced inactivation to take over the responsibility for the decay of Ca2+ channel currents following β-adrenergic stimulation. This is the first time that such a separation of functions has been suggested for L-type Ca2+ channel inactivation.
METHODS
Cell preparation
All animal experiments were conducted according to the ethical standards of the Ministére Français de l'Agriculture (Licence number B37-261-4). Male guinea-pigs (250-400 g) were killed by cervical dislocation and the hearts were removed. Single ventricular myocytes were isolated using collagenase and protease digestion as described elsewhere (Le Guennec et al. 1993). Myocytes isolated from the left ventricle were aliquoted into 35 mm diameter plastic Petri dishes that served as experimental chambers. The storage solution consisted of the standard extracellular solution described below. Dishes that contained myocytes were kept on the laboratory bench and used within 6-8 h of isolation.
Experimental procedures
Whole-cell current voltage clamp experiments were conducted with an Axon Instruments 202A patch clamp amplifier in resistive feedback mode (Axon Instruments, CA, USA). Pipettes were fabricated from thin walled borosilicate glass capillary tubes (Clark Electromedical Instruments, Pangbourne, UK) with a Narishige PB7 double-stage puller (Narishige Instruments, Tokyo, Japan). Pipettes were coated with Sylgard (Dow Corning, MI, USA) and then heat polished. Finished pipettes had a resistance of < 2 MΩ when filled with standard intracellular solution. Experimental voltage clamp protocols and data acquisition were controlled with Acquis1 software (Dipsi Industrie, Chatillon, France) installed upon a 386-20 PC computer. Data were filtered at either 1 or 2 kHz and acquired at 2 or 5 kHz respectively. Cell capacitance and series resistance were compensated (≈80 %) with the Axon Instruments amplifier. Data analysis was performed with Acquis1 and Origin 4.1 (Microcal Software, MA, USA). Once the whole-cell configuration of the patch clamp cell current recording technique (Hamill et al. 1981) had been achieved isolated myocytes were voltage-clamped at −80 mV. Voltage clamp protocols were delivered to the cells from this holding potential. Each voltage clamp protocol was preceded by a voltage step to −50 mV for a period of 1000 ms. This prior voltage step served to inactivate any residual Na+ current remaining after the application of 10 μM TTX and to inactivate any T-type Ca2+ current in ventricular myocytes of the guinea-pig (Balke et al. 1992). Plastic Petri dishes which contained isolated myocytes were placed upon the stage of an Olympus CK2 inverted microscope. Isolated myocytes were superfused with experimental solutions via a parallel pipes system lowered into the vicinity of the cells. Fluid flow was maintained by gravity from syringe barrel reservoirs and the exchange of solutions was achieved by manual displacement of the pipes. Solution exchange around the myocyte was estimated to be complete in 4-5 s. All experiments were conducted at room temperature (≈23 °C). Voltage-gated currents through L-type Ca2+ channels were defined as currents sensitive to 200 μM CdCl2. Linz & Meyer (1998) discuss the limitations of this method. The cell current records obtained in the presence of Cd2+ were digitally subtracted from those recorded in the absence of Cd2+ using Acquis1.
Experimental solutions
The standard extracellular solution used to fill the Petri dishes and store myocytes prior to experiments contained (mm): 140 NaCl, 5 KCl, 2 CaCl2, 1 MgCl2, 10 glucose, 10 Hepes, pH adjusted to 7.4 with NaOH. Tetrodotoxin (TTX citrate salt, 10 μM, from either Alomone Labs, Jerusalem, Israel or Latoxan, Valence, France) was added to this standard solution when it was used to superfuse cells during experiments. Calcium-free (zero calcium) extracellular solution contained 250 μM EGTA-NaOH, 3 mm MgCl2 and no added Ca2+. The standard intracellular solution used to fill the patch pipettes contained (mm): 140 KCl, 10 NaCl, 5 EGTA-KOH, 1.4 MgCl2, 0.1 CaCl2, 2 ATP-Mg2+, 10 glucose, 10 Hepes, pH adjusted to 7.3 with KOH. The estimated free concentrations of Mg2+ and Ca2+ in this solution were 1 mm and 1 nm, respectively. In experiments where β-adrenergic stimulation was to be applied to the myocytes, the pipette solutions also contained 100 μM GTP. Isoproterenol was prepared daily as a 100 μM stock solution in distilled water and added to extracellular solutions to give a final concentration of 100 nm. Ryanodine was dissolved as a 1 mm stock solution in distilled water and added to the extracellular solution to give a final concentration of 5 μM.
RESULTS
Figure 1 illustrates Ca2+ channel currents recorded in isolated cardiac myocytes in the presence and absence of extracellular Ca2+. In the presence of 2 mm extracellular Ca2+, inward voltage-gated currents were evoked by voltage steps to between −40 and +50 mV while voltage steps to +60 mV or more positive voltages evoked outward currents (Figs 1A and C). The reversal potential for these L-type Ca2+ currents in the presence of 2 mm extracellular Ca2+ was ≈+55 mV, and it was not affected by β-adrenergic stimulation. When extracellular Ca2+ was replaced by Mg2+ (Hadley & Hume, 1987) in zero calcium extracellular solution, voltage steps to between −40 and +10 mV evoked no current through Ca2+ channels, either under control conditions, or following β-adrenergic stimulation (Figs 1B and D). In zero calcium solution steps to voltages more positive than +10 mV evoked outwardly rectified time-dependent (Figs 1B and D) currents. Both inward and outward currents recorded in the presence and absence of extracellular Ca2+ were enhanced by β-adrenergic stimulation (Fig. 1). The normalised cell current records shown in Fig.1E-G illustrate that β-adrenergic stimulation has profoundly different effects upon the time-dependent decay of Ca2+ channel currents when these are inwardly or outwardly directed. The decay of inwardly directed Ca2+ channel currents is enhanced by isoproterenol (Fig. 1E). Isoproterenol reduces the decay of outwardly directed Ca2+ channel currents, whether these currents are recorded in the presence (Fig. 1F) or absence (Fig. 1G) of extracellular Ca2+. The results clearly illustrate the divergent effect of β-adrenergic stimulation upon inactivation of L-type Ca2+ channels.
Voltage-dependent inactivation of Ca2+channel currents
Figure 2 illustrates myocyte currents recorded during a double-pulse voltage clamp protocol that was utilised to examine the isochronic voltage dependence of inactivation of Ca2+ channel currents (Fig. 3). These traces show that the amplitude of the test pulse current is reduced by a 1000 ms duration pre-pulse to +10 mV. Inactivation of the Ca2+ current occurred in the presence (Figs 2A and C) and the absence (Figs 2B and D) of Ca2+ influx, both under control conditions (Figs 2A and B) and following β-adrenergic stimulation (Figs 2C and D). Strong inactivation occurred following Ca2+ influx under both control conditions (Fig. 2A) and in the presence of isoproterenol (Fig. 2C). However, in the absence of Ca2+, inactivation was severely reduced by β-adrenergic stimulation (Fig. 2D) compared with control conditions (Fig. 2B). The full availability-voltage (A-V) relationships obtained from these experiments are shown in Figs 3A and B. With a 1000 ms duration pre-pulse there would appear to be little difference between Ca2+ current A-V curves recorded in the presence and absence of Ca2+ under control conditions (Fig. 3A) while there seems to be a very marked difference between them following β-adrenergic stimulation (Fig. 3B). It is unusual to use a test pulse voltage as positive as +80 mV to examine Ca2+ channel current availability. This voltage, which evokes current via Ca2+ channels in the presence and absence of extracellular Ca2+, avoids difficulties which may arise when data are compared from different test pulses (Gera & Byerly, 1999). Control experiments (not shown) examined the effect of a test pulse voltage step to +80 mV upon the A-V relation by comparing isochronic Ca2+ channel A-V relationships recorded with test pulse voltage steps to +10 mV and +80 mV in the presence of extracellular Ca2+. No difference was found for the isochronic voltage dependence (V0.5) of Ca2+ current availability derived from fitting the Boltzmann relation to the data obtained using these two methods under either control conditions (V0.5 −23 mV and −22 mV, respectively: n = 8) or in the presence of isoproterenol (V0.5 −32 mV and −32 mV, respectively: n = 6). The method of using a voltage step to +80 mV as witness of the availability of the Ca2+ current, which has been adapted from Hadley & Hume (1987), therefore provides a valid measure of the effects of Ca2+ flux and no cation flux upon Ca2+ channel current inactivation.
Figure 2. The effects of Ca2+ and β-adrenergic stimulation upon voltage-dependent inactivation of Ca2+ channel currents.
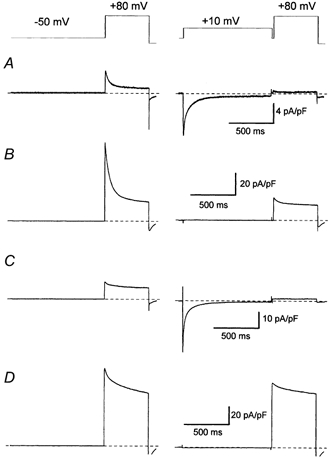
These cell currents were recorded from two representative ventricular myocytes, one myocyte under control conditions (A and B) and another myocyte which was bathed in 100 nm isoproterenol (C and D). The double-pulse voltage-clamp protocol is indicated schematically above the cell current records. Records were obtained from the myocytes in the presence (A and C) and absence (B and D) of extracellular Ca2+. The dashed lines indicate the 0 pA current level. The time and current scale bars are applicable to each pair of traces.
Figure 3. The effects of Ca2+ and β-adrenergic stimulation upon isochronic Ca2+ channel current availability-voltage (A-V) relationships.
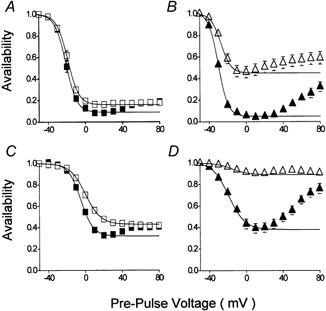
A-V relationships were obtained with a double-pulse voltage clamp protocol (see insets, Fig. 2), which consisted of pre-pulse voltage steps to between −50 and +80 mV in 10 mV increments followed by a test pulse voltage step to +80 mV. An interval of 10 ms at −50 mV separated pre- and test-pulse voltage steps. The amplitude of the current evoked by test pulse voltage steps was normalised to that which had been recorded following a pre-pulse voltage step to −50 mV. Symbols and bars represent mean ± s.e.m. values of results obtained from n myocytes. A and B, cell current A-V relations were recorded following 1000 ms duration pre-pulses in control conditions (A: squares: n = 10) and in the presence of 100 nm isoproterenol (B: triangles: n = 12). Each myocyte was tested in the presence (solid symbols) and absence (open symbols) of extracellular Ca2+. The lines represent fits of the data to the Boltzmann relation (see Methods). The characteristics of the Boltzmann relations were as follows: control with Ca2+, maximum (A1) 1.00, minimum (A2) 0.09, V0.5−21 mV, slope 5.8 mV; control without Ca2+, max 1.00, min 0.16, V0.5−19 mV, slope 5.9 mV; isoproterenol with Ca2+, max 1.01, min 0.05, V0.5−30 mV, slope 5.1 mV; isoproterenol without Ca2+, max 1.00, min 0.45, V0.5−27 mV, slope 5.3 mV. C and D, cell current A-V relationships recorded following 50 ms pre-pulses in control conditions (C: squares: n = 11) and in the presence of 100 nm isoproterenol (D: triangles: n = 15). Symbols and analysis as for A and B. The characteristics of the Boltzmann relations were as follows: control with Ca2+, max 1.00, min 0.32, V0.5−5 mV, slope 6.7 mV; control without Ca2+, max 1.00, min 0.43, V0.5 0 mV, slope 8.3 mV; isoproterenol with Ca2+, max 1.01, min 0.38, V0.5−19 mV, slope 8.8 mV; isoproterenol without Ca2+, max 1.00, min 0.89, V0.5−15 mV, slope 8.8 mV.
Under control conditions (Fig. 3A) the differences between the A-V relationships recorded in the presence and absence of extracellular Ca2+ were respectively a slightly more negative V0.5 (-21 versus -19 mV), slightly greater inactivation (minimum availability of 0.09 and 0.16) and a U-shaped versus a sigmoid relationship with membrane voltage. A Boltzmann relation could describe the sigmoid relationship between availability and voltage recorded in the absence of Ca2+ over the entire voltage range between −50 and +80 mV (open squares in Fig. 3A). In the presence of Ca2+ the Boltzmann relation could only be fitted to data between the maximum (-50 mV) and minimum values (+20 mV) of the relation (filled squares in Fig. 3A). It was noteworthy that the rising phase of the availability curve recorded above +20 mV in the presence of Ca2+ attained but did not pass that recorded in the absence of Ca2+ following pre-pulse voltage steps to between +60 and +80 mV. Thus following pre-pulses which evoked outward currents in the presence or absence of extracellular Ca2+ (Fig. 1), availability is the same.
In the presence of isoproterenol (Fig. 3B) there was a very clear distinction between the A-V relationships recorded in the presence and absence of extracellular Ca2+, there was respectively a more negative V0.5 (-30 versus -27 mV) and, in particular, markedly more inactivation (minimum availability of 0.05 versus 0.45). Compared with control conditions the A-V relationship recorded in the presence of Ca2+ was shifted by −9 mV while maximum inactivation was only slightly increased. In the absence of Ca2+, although the A-V relationship had been shifted by −8 mV the amount of inactivation recorded after 1000 ms was greatly reduced. It was also noticeable that whereas the A-V relationship recorded in the absence of Ca2+ was sigmoid under control conditions (Fig. 3A), in isoproterenol it was U-shaped (Fig. 3B) and a Boltzmann relation could now only be fitted between the maximum (-50 mV) and the minimum (0 mV) values. Furthermore, whereas under control conditions the A-V curves recorded in the presence and absence of Ca2+ came together at between +50 and +80 mV (Fig. 3A), in isoproterenol, although the curves approached with increasing depolarisation they did not join within the range of voltages tested here (Fig. 3B). Therefore, although pre-pulse voltages to between +60 and +80 mV evoked outward Ca2+ channel currents carried by intracellular monovalent cations (Fig. 1), availability of the test pulse current was less in the presence of extracellular Ca2+ than in its absence. This would suggest that following β-adrenergic stimulation extracellular Ca2+per se had an influence upon inactivation (Sun et al. 2000). An alternative explanation could be that Ca2+ influx at voltages negative to the equilibrium potential for Ca2+, ECa, though positive to the reversal potential of total ion flux through Ca2+ channels (Zhou & Bers, 2000), had provoked inactivation. This hypothesis could not be tested under these experimental conditions since steps to voltages more positive than +80 mV provoked voltage-dependent unblock of extracellular Cd2+ and an accurate estimation of the amplitude of the Ca2+ channel current could not be obtained.
Attention was focused upon the apparent minor difference between A-V relationships in the presence and absence of extracellular Ca2+ seen under control conditions (Fig. 3A). This could be taken to suggest a minor role for Ca2+ in the development of inactivation of L-type Ca2+ channels. However, a 1000 ms pre-pulse step could also be considered to provide a quasi-steady-state estimation of Ca2+ channel availability when both Ca2+-dependent and independent processes of inactivation would have run their course. In this case, the observation that there was little difference in the ‘final’ A-V relationships recorded from the same cells in the presence and absence of extracellular Ca2+ would not be very surprising. It was decided to repeat these experiments with a shorter pre-pulse duration in order to look for more clear distinctions between Ca2+-dependent and Ca2+-independent processes of inactivation.
Figure 3C and D illustrates A-V relationships recorded with a double-pulse voltage clamp protocol with a 50 ms pre-pulse duration. Less inactivation is recorded. In control conditions (Fig. 3C) there was a larger difference between the data recorded in the presence and absence of Ca2+ than was seen with 1000 ms pre-pulses (Fig. 3A). In the presence of isoproterenol after only 50 ms (Fig. 3D) there was an even more marked difference between the extent of inactivation recorded in the presence or absence of Ca2+ than was seen with 1000 ms pre-pulses (Fig. 3B). Thus in the absence of Ca2+ after 50 ms a maximum of ≈10 % of the current inactivated, while in the presence of Ca2+ a maximum of > 60 % inactivation occurred (Fig. 3D).
These results show markedly different contributions of Ca2+ to inactivation under control conditions and following β-adrenergic stimulation. Ca2+-induced inactivation can arise from Ca2+ entry and from Ca2+-induced-Ca2+ release (CICR) from the sarcoplasmic reticulum (Adachi-Akahane et al. 1996; Sham, 1997). These experiments were therefore repeated in ryanodine (Fig. 4) in order to isolate Ca2+ entry as the instigator of Ca2+-induced inactivation. Without effect upon availability recorded in the absence of Ca2+ (open symbols in Fig. 4), ryanodine clearly reduced the difference between A-V relations recorded in the presence and absence of Ca2+ after 50 ms (Fig. 4A) and to some extent after 1000 ms (Fig. 4C) compared with equivalent experiments conducted in the absence of ryanodine (Fig. 3A and C). In isoproterenol, ryanodine reduced total inactivation after 50 ms (Fig. 4B) while after 1000 ms (Fig. 4D) its effect principally concerned inactivation at negative voltages.
Figure 4. The effect of ryanodine upon isochronic Ca2+ channel current A-V relationships.
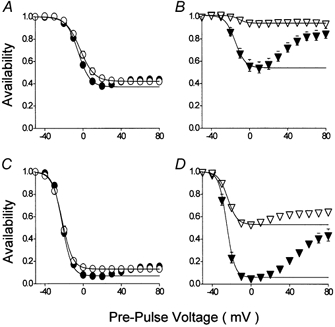
Experimental protocols and analysis were as described for Fig. 3. All experimental solutions contained 5 μM ryanodine. A and B, A-V relationships recorded following 50 ms duration pre-pulses under control conditions (A: circles: n = 9) and in the presence of 100 nm isoproterenol (B: inverted triangles: n = 9). The characteristics of the Boltzmann relations were as follows: control with Ca2+, max 1.00, min 0.37, V0.5−5 mV, slope 6.1 mV; control without Ca2+; max 1.00, min 0.42, V0.5−1 mV, slope 7.3 mV; isoproterenol with Ca2+, max 1.01, min 0.54, V0.5−15 mV, slope 5.2 mV; isoproterenol without Ca2+, max 1.01, min 0.94, V0.5−11 mV, slope 4.1 mV. C and D, A-V relationships recorded following 1000 ms duration pre-pulses under control conditions (C: circles: n = 12) and in the presence of 100 nm isoproterenol (D: inverted triangles: n = 9). The characteristics of the Boltzmann relations were as follows: control with Ca2+, max 1.01, min 0.07, V0.5−21 mV, slope 5.0 mV; control without Ca2+, max 1.00, min 0.13, V0.5−20 mV, slope 5.4 mV; isoproterenol with Ca2+, max 1.00, min 0.06, V0.5−24 mV, slope 4.0 mV; isoproterenol without Ca2+, max 1.00, min 0.53, V0.5−22 mV, slope 4.8 mV.
Figure 5 examines the contribution of Ca2+ to the inactivation of Ca2+ channel currents by expressing the difference between the A-V data recorded in the presence and absence of Ca2+ as the proportion of the total. Under control conditions (Fig. 5, squares) the proportion of inactivation associated with Ca2+ declines with time. The data recorded following a 50 ms pre-pulse (Fig. 5A, squares) showed a bell-like relationship between inactivation associated with Ca2+ and membrane voltage, inactivation was maximal at −10 mV. The contribution of Ca2+ to total inactivation after 50 ms was reduced by ryanodine (Fig. 5A, circles), particularly at negative membrane potentials and now the peak of inactivation occurred at 0 mV. The asymmetric difference between the data recorded in the presence and absence of ryanodine probably represents the ‘gain’ of CICR with membrane voltage according to the ‘local control theory’ of Ca2+-induced inactivation (Stern, 1992; Sham, 1997; Song et al. 2001). The data recorded under control conditions following 1000 ms (Fig. 5B, squares) pre-pulses showed that the relationship between inactivation and voltage was even more skewed towards negative voltages in the absence of ryanodine. It was also clear that after this time Ca2+ entry itself was responsible for very little inactivation of Ca2+ channels. On the other hand, the contribution of Ca2+ to the inactivation of Ca2+ channel currents following β-adrenergic stimulation was very large (Fig. 5, triangles), essentially voltage-independent over the range ±40 mV and largely sustained. Ryanodine was without effect under these conditions (Fig. 5, inverted triangles) except to inhibit inactivation due to Ca2+ at the lowest membrane voltages.
Figure 5. The contribution of Ca2+ to the voltage dependence of inactivation of Ca2+ channel currents.
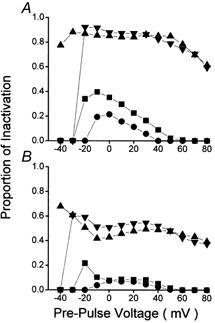
Data were obtained from A-V relationships recorded following 50 ms (A) and 1000 ms (B) duration pre-pulses. The difference between data recorded in the presence (e.g. filled symbols in Figs 3 and 4) and absence (e.g. open symbols in Figs 3 and 4) of Ca2+ was expressed as their proportion of total inactivation (filled symbols in Figs 3 and 4). The squares represent data recorded under control conditions (Fig. 3), the circles represent control conditions with ryanodine (Fig. 4), triangles represent data recorded in 100 nm isoproterenol (Fig. 3), and inverted triangles represent data recorded in 100 nm isoproterenol with ryanodine (Fig. 4).
Time-dependent inactivation of Ca2+ channel currents
The data shown in Fig. 5 represents the process of inactivation occurring over a range of voltages at particular times following activation of the L-type Ca2+ current. It clearly shows that the contribution of Ca2+ to the inactivation of Ca2+ channel currents was time-dependent. In order to obtain more detail of this process it was decided to examine the time course of the development of Ca2+ and voltage-dependent inactivation with an envelope type of voltage clamp protocol (see inset in Fig. 6). This double-pulse protocol consisted of pre-pulse voltage steps to a fixed voltage for different periods of time before the application of the test pulse voltage step to +80 mV. The pre-pulse voltage was +10 mV. This voltage was chosen since it is close to the maximum for inward current carried by Ca2+, it is close to the voltage associated with maximum inactivation (Fig. 5) and it is the highest voltage which, in the absence of extracellular Ca2+, does not result in current flow through Ca2+ channels (Fig. 1). It would therefore be expected that this protocol would provide the most distinct difference between the time course of inactivation observed in the presence and absence of extracellular Ca2+ and thus between total inactivation and voltage-dependent inactivation respectively. The difference would then represent Ca2+-dependent inactivation. The progress of inactivation under control conditions could be described by a bi-exponential process in both the presence and absence of extracellular Ca2+ (Fig. 6A). The addition of ryanodine had no effect upon the time course of inactivation due to voltage, though it slowed the time course of total inactivation recorded in the presence of Ca2+ (Fig. 6B). It was noteworthy that there was little difference between the rapid phases of inactivation, τf, in ryanodine in the presence, τf = 30 ms, and absence, τf = 35 ms, of Ca2+ (Fig. 6B) and both values were very similar to the rapid phase of inactivation recorded under control conditions in the absence of Ca2+, τf = 30 ms (Fig. 6A). These data would suggest that, in the absence of CICR, which was blocked by ryanodine, rapid inactivation of the Ca2+ channel current was largely a Ca2+-independent process. The slow phase of inactivation, τs, showed a clear dependence upon Ca2+, both derived from CICR, τs = 74 ms in control and 162 ms with ryanodine, and from Ca2+ entry, τs = 162 ms in calcium and ryanodine and 317 ms in zero calcium.
Figure 6. The effects of Ca2+ and β-adrenergic stimulation upon the time dependence of Ca2+ channel current availability.
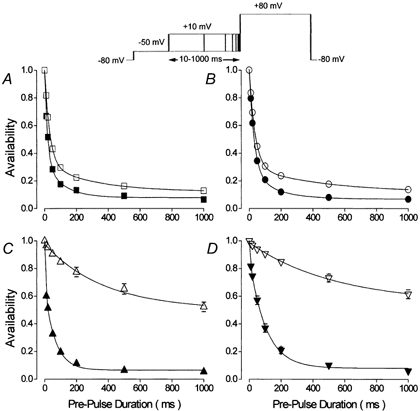
The double-pulse voltage-clamp protocol used to obtain these results is shown schematically at the head of the figure. The amplitude of the test pulse current was normalised to that recorded in the absence of a pre-pulse voltage step to +10 mV. Each myocyte was examined in the presence (filled symbols) and absence (open symbols) of extracellular Ca2+. Symbols and bars represent mean ±s.e.m. values of results obtained from n myocytes. The lines are fits to the data of a double-exponential function (τf and τs), except for the open symbols in C and D where the lines are fits of a single exponential function (τs). A, control conditions (n = 9), calcium, τf = 15 ms, τs = 74 ms; zero calcium, τf = 30 ms, τs = 303 ms. B, control conditions with 5 μM ryanodine (n = 11), calcium, τf = 30 ms, τs = 162 ms; zero calcium, τf = 35 ms, τs = 317 ms. C, 100 nm isoproterenol (n = 9), calcium, τf = 4 ms, τs = 60 ms; zero calcium, τs = 380 ms. D, 100 nm isoproterenol with 5 μM ryanodine (n = 9), calcium, τf = 4 ms, τs = 103 ms; zero calcium, τs = 540 ms.
The difference between inactivation recorded in the presence and absence of extracellular Ca2+ under control conditions (Figs 6A and B) was much less marked than that seen following β-adrenergic stimulation (Figs 6C and D). In isoproterenol, in the absence of Ca2+, the time course of the development of inactivation could be described by a single slow exponential function (Fig. 6C). Although the addition of ryanodine appeared to further slow the time course of inactivation recorded in the absence of Ca2+ (Fig. 6D), this is not regarded as being significant on this time scale where in either case inactivation did not attain 50 % of the current within 1000 ms. In the presence of Ca2+, inactivation apparently proceeded with a bi-exponential time course (Figs 6C and D) whose initial phase was faster than under control conditions (Figs 6A and B). A particular detail of the time course of inactivation in the presence of Ca2+ following β-adrenergic stimulation is worthy of note. The apparent rapid phase of inactivation, τf, defined by a bi-exponential function fit to the data corresponded to the difference between no pre-pulse voltage step and the first 10 ms pre-pulse to +10 mV. This accounted for ≈40 % of the inactivation in isoproterenol alone (Fig. 6C). The addition of ryanodine reduced this to ≈20 % of inactivation (Fig. 6D). In both experimental conditions (Figs 6C and D), inactivation recorded after 10 ms could be described by single exponential functions, τs, of which that recorded in ryanodine was slower, τs = 103 ms versus 60 ms.
Further information was extracted from these data. The time course of the decline of the availability of Ca2+ channel currents shown in Fig. 6 was described by exponential functions. These functions were used to simulate the time course of the development of inactivation of Ca2+ channel currents (Fig. 7). The data recorded in the absence of Ca2+ with and without ryanodine were combined (control, Figs 6A and B, n = 20, τf = 34 ms, τs = 375 ms; isoproterenol, Figs 6C and D, n = 18, τs = 470 ms) and considered to represent inactivation associated with membrane voltage (Figs 7B and D). The difference between the data recorded in the absence of Ca2+ and the data recorded in Ca2+ with ryanodine was considered to represent inactivation due to Ca2+ entry via L-type Ca2+ channels (Figs 7A and C). The difference between the data recorded in the presence of Ca2+ with and without ryanodine was considered to represent inactivation due to CICR (Figs 7A and C). The sum of data due to CICR and Ca2+ entry then represented inactivation due to Ca2+ (Figs 7B and D). The sum of data due to Ca2+ and voltage represented total inactivation (Figs 7B and D). Linz & Meyer (1998) used similar procedures to extract the elements involved in the inactivation of cardiac L-type Ca2+ channels. In both control conditions (Fig. 7A) and following β-adrenergic stimulation (Fig. 7C) CICR was associated with inactivation over a comparatively short time scale while inactivation associated with Ca2+ entry was sustained for at least 1000 ms, the limit of time tested in these experiments. β-adrenergic stimulation (Fig. 7C) was associated with an increase in the contributions of both CICR and Ca2+ entry to inactivation of Ca2+ channel currents. B and D in Fig. 7 compare the contribution of Ca2+ (the sum of CICR and Ca2+ entry) and voltage to total inactivation of Ca2+ channel currents. In control conditions (Fig. 7B) this analysis would suggest that the contribution of Ca2+ towards inactivation reached a peak of ≈20 % after ≈40 ms and that the major part of inactivation was due to membrane voltage. In isoproterenol (Fig. 7D), inactivation associated with Ca2+ peaked at ≈70 % after ≈150 ms and declined only slowly and therefore dominated total inactivation.
Figure 7. Simulations of the time course of the contributions of Ca2+ and voltage to the inactivation of Ca2+ channel currents.
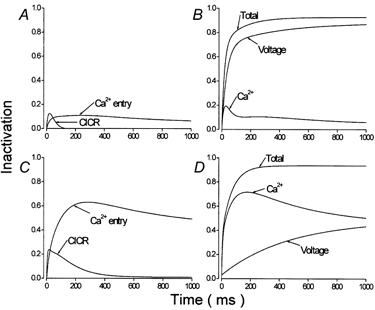
The exponential functions fitted to the data shown in Fig. 6 were used to simulate the time course of the loss of availability of Ca2+ channel currents at +10 mV (Origin 4.1). The data obtained from these simulations of inactivation obtained under the different experimental conditions were then subtracted and/or added to extract the different elements, voltage, Ca2+ entry and CICR, involved in inactivation of Ca2+ channel currents. See text for further details. A and B represent results obtained under control conditions. C and D represent results obtained in 100 nm isoproterenol.
Figure 8 expresses the data shown in Fig. 7 as their proportion of ongoing total inactivation. At the onset of inactivation under control conditions (Fig. 8A) Ca2+ contributed ≈60 % of inactivation. This contribution declined rapidly, largely due to the narrow time scale of CICR, such that after 200 ms it contributed only ≈10 %. In isoproterenol (Fig. 8B) Ca2+ rapidly assumed ≈80 % of inactivation and that level declined only slowly.
Figure 8. Simulation of the contribution of Ca2+ to inactivation of Ca2+ channel currents under control conditions (A) and following β-adrenergic stimulation (B).
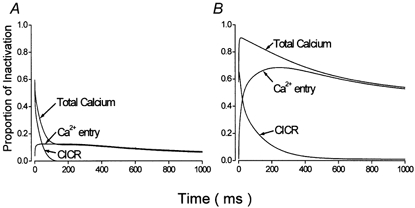
These data were obtained by expressing the data corresponding to inactivation induced by Ca2+ shown in Fig. 7 as their proportion of ongoing total inactivation.
DISCUSSION
The question posed by this study is, by what mechanism is the contribution of Ca2+ to inactivation of L-type Ca2+ channel currents in native cardiac myocytes radically altered by β-adrenergic stimulation? Whether inactivation was assessed over a range of voltages at particular points in time (Fig. 5), which provided snap-shots of the progress of inactivation, or whether inactivation was assessed at a given voltage over a range of time (Fig. 6), it was clear that following β-adrenergic stimulation, inactivation was dominated by Ca2+. This result coincides with the general consensus of opinion concerning the contribution of Ca2+ to inactivation of L-type Ca2+ channel currents in native mammalian cardiac myocytes. This is a consensus which has been largely based upon studies which used different means to ‘maximise’ Ca2+ channel currents and which in their different ways were often the equivalent of maximal β-adrenergic stimulation (Fukushima & Hagiwara, 1985; Bechem & Pott, 1985; Matsuda, 1986; Imredy & Yue, 1994; Linz & Meyer, 1998). It was the study of Mitarai et al. (2000) which brought to light the very large difference between the voltage dependence of inactivation of cardiac muscle L-type Ca2+ channels recorded under control conditions and following β-adrenergic stimulation. This study and a previous investigation (Findlay, 2002) confirm the results of Mitarai et al. (2000) where voltage-dependent inactivation is shown to dominate decay of Ca2+ channels under control conditions.
The data shown in Fig. 7 and Fig. 8 suggest that β-adrenergic stimulation results in a large increase in the contribution of Ca2+-induced inactivation to the decay of Ca2+ channel currents. This could derive from a number of different mechanisms. The amplitude of whole-cell Ca2+ currents is increased by isoproterenol (Pelzer et al. 1990), which would increase Ca2+ entry and thus sub-sarcolemmal Ca2+ concentration. But in this case, the dependence of inactivation upon Ca2+ should show either an inverse relationship with voltage that would correspond to the amplitude of single channel currents (Stern, 1992) or a bell-shaped relationship with voltage that correlates with the whole-cell current density (Argibay et al. 1988), neither alternative is true (Fig. 5). CICR is enhanced during β-adrenergic stimulation (Hussain & Orchard, 1997; Song et al. 2001; Viatchenko-Karpinski & Gyorke, 2001) and this clearly contributes to Ca2+-induced inactivation (Fig. 7) (Adachi-Akahane et al. 1996; Sham, 1997) but ryanodine has little effect upon the voltage dependence of the contribution of Ca2+ to inactivation in isoproterenol (Fig. 5). The major part of the difference between Ca2+-dependent inactivation in control conditions and with isoproterenol is shown to arise from Ca2+ entry (Fig. 7 and Fig. 8), rather than CICR as was suggested by Adachi-Akahane et al. (1996). It is currently understood that Ca2+-induced inactivation of L-type (CaV1.2) Ca2+ channels involves calmodulin and the cytoplasmic C-terminus of the α1C subunit of the channel (Hamilton et al. 2000; Anderson, 2001). It is possible that β-adrenergic stimulation, via protein kinase A phosphorylation of the channel protein (Kamp & Hell, 2000), enhances Ca2+-induced inactivation by increasing the sensitivity to intracellular Ca2+ or by increasing the efficacy of the mechanism. It should be noted, however, that if the contribution of Ca2+-induced inactivation to the total decay of Ca2+ channel currents has been greatly increased by isoproterenol, this does not coincide with an equivalent very large increase in the actual decay of Ca2+ currents upon β-adrenergic stimulation (Fig. 1E). Some studies even fail to show a marked increase in the rate of decay of cardiac Ca2+ currents upon β-adrenergic stimulation (Sako et al. 1997).
To the eye it would seem that the effect of isoproterenol upon the decay of currents recorded in the absence of Ca2+ (Fig. 1 and Fig. 2) is to slow down the process of inactivation. Analysis of the time course of inactivation of currents recorded in the absence of Ca2+ (Fig. 6 and see Mitarai et al. 2000) reveals a different picture. In control conditions, inactivation progresses with a bi-exponential time course (Fig. 6A). In isoproterenol, inactivation progresses with a single, slow, exponential time course (Fig. 6C). The rapid voltage-dependent inactivation, which under control conditions, accounts for ≈70 % of the amplitude of inactivation (Figs 6A and B) is absent from data recorded in isoproterenol (Figs 6C and D). Mitarai et al. (2000) came to a similar conclusion concerning the effects of β-adrenergic stimulation upon Ca2+ channel currents carried by Na+ and not subjected to Ca2+-induced inactivation. Under control conditions, Ca2+ entry has very little influence upon the fast phase of inactivation of the Ca2+ channel current (Figs 6A and B). Instead, Ca2+ entry had a distinct effect upon the slow phase of inactivation (Figs 6A and B). Rather than suggest sub-groups of Ca2+-sensitive and Ca2+-insensitive ion channels, it is proposed that these distinctions arise from the respective kinetics of voltage- and Ca2+-induced inactivation. Thus under control conditions fast voltage-dependent inactivation could occur before Ca2+ entry induced inactivation. Ca2+ entry could induce inactivation before the slow phase of voltage-dependent inactivation. This model could account for the apparently enhanced Ca2+-induced inactivation observed in isoproterenol (Fig. 7) when β-adrenergic stimulation suppressed the rapid phase of voltage-dependent inactivation (Fig. 6 and Mitarai et al. 2000). It is concluded that the contribution of Ca2+-induced inactivation to the decay of L-type Ca2+ channel activity in native cardiac myocytes is determined by the kinetic behaviour resulting from membrane voltage.
Acknowledgments
I thank Alain Moreau and Helen Henri for isolating myocytes. My thanks go also to Drs J. Argibay, J. Lignon, C. Malecot and N. Peineau for their constructive criticism of this text. This work was financed by grants from the Region Centre.
REFERENCES
- Adachi-Akahane S, Leemann L, Morad M. Cross-signalling between L-type Ca2+ channels and ryanodine receptors in rat ventricular myocytes. Journal of General Physiology. 1996;108:435–454. doi: 10.1085/jgp.108.5.435. [DOI] [PMC free article] [PubMed] [Google Scholar]
- Anderson ME. Ca2+-dependent regulation of cardiac L-type Ca2+ channels: is a unifying mechanism at hand? Journal of Molecular and Cellular Cardiology. 2001;33:639–650. doi: 10.1006/jmcc.2000.1354. [DOI] [PubMed] [Google Scholar]
- Balke CW, Rose WC, Marban E, Wier WG. Macroscopic and unitary properties of physiological ion flux through T-type Ca2+ channels in guinea-pig heart cells. Journal of Physiology. 1992;456:247–265. doi: 10.1113/jphysiol.1992.sp019335. [DOI] [PMC free article] [PubMed] [Google Scholar]
- Bechem M, Pott L. Removal of Ca2+ current inactivation in dialysed guinea-pig atrial cardioballs by Ca chelators. Pflügers Archiv. 1985;404:10–20. doi: 10.1007/BF00581485. [DOI] [PubMed] [Google Scholar]
- Dang TX, McCleskey EW. Ion channel selectivity through stepwise changes in binding affinity. Journal of General Physiology. 1998;111:185–193. doi: 10.1085/jgp.111.2.185. [DOI] [PMC free article] [PubMed] [Google Scholar]
- Ellinor PT, Yang J, Sather WA, Zhang J-F, Tsien RW. Ca2+ channel selectivity at a single locus for high-affinity Ca2+ interactions. Neuron. 1995;15:1121–1132. doi: 10.1016/0896-6273(95)90100-0. [DOI] [PubMed] [Google Scholar]
- Ferreira G, Yi J, Rios E, Shirokov R. Ion-dependent inactivation of barium current through L-type calcium channels. Journal of General Physiology. 1997;109:449–461. doi: 10.1085/jgp.109.4.449. [DOI] [PMC free article] [PubMed] [Google Scholar]
- Findlay I. Voltage and cation dependent inactivation of L-type Ca2+ channel currents in guinea pig ventricular myocytes. Journal of Physiology. 2002;541:731–740. doi: 10.1113/jphysiol.2002.019729. [DOI] [PMC free article] [PubMed] [Google Scholar]
- Fukushima Y, Hagiwara S. Currents carried by monovalent cations through calcium channels in mouse neoplastic B lymphocytes. Journal of Physiology. 1985;358:255–284. doi: 10.1113/jphysiol.1985.sp015550. [DOI] [PMC free article] [PubMed] [Google Scholar]
- Gera S, Byerly L. Measurement of calcium channel inactivation is dependent upon the test pulse potential. Biophysical Journal. 1999;76:3076–3088. doi: 10.1016/S0006-3495(99)77460-6. [DOI] [PMC free article] [PubMed] [Google Scholar]
- Hadley RW, Hume JR. An intrinsic potential-dependent inactivation mechanism associated with calcium channels in guinea-pig myocytes. Journal of Physiology. 1987;389:205–222. doi: 10.1113/jphysiol.1987.sp016654. [DOI] [PMC free article] [PubMed] [Google Scholar]
- Hadley RW, Lederer WJ. Ca2+ and voltage inactivate Ca2+ channels in guinea-pig ventricular myocytes through independent mechanisms. Journal of Physiology. 1991;444:257–268. doi: 10.1113/jphysiol.1991.sp018876. [DOI] [PMC free article] [PubMed] [Google Scholar]
- Hamill OP, Marty A, Neher E, Sakmann B, Sigworth FJ. Improved patch-clamp techniques for high resolution current recording from cells and cell-free membrane patches. Pflügers Archiv. 1981;391:85–100. doi: 10.1007/BF00656997. [DOI] [PubMed] [Google Scholar]
- Hamilton SL, Serysheva I, Strasburg GM. Calmodulin and excitation-contraction coupling. News in Physiological Sciences. 2000;15:281–284. doi: 10.1152/physiologyonline.2000.15.6.281. [DOI] [PubMed] [Google Scholar]
- Hess P, Lansman JB, Tsien RW. Calcium channel selectivity for divalent and monovalent cations. Journal of General Physiology. 1986;88:293–318. doi: 10.1085/jgp.88.3.293. [DOI] [PMC free article] [PubMed] [Google Scholar]
- Hussain M, Orchard CH. Sarcoplasmic reticulum Ca2+ content, L-type Ca2+ current and the Ca2+ transient in rat myocytes during β-adrenergic stimulation. Journal of Physiology. 1997;505:385–402. doi: 10.1111/j.1469-7793.1997.385bb.x. [DOI] [PMC free article] [PubMed] [Google Scholar]
- Imredy JP, Yue DT. Mechanism of Ca2+-sensitive inactivation of L-type Ca2+ channels. Neuron. 1994;12:1301–1318. doi: 10.1016/0896-6273(94)90446-4. [DOI] [PubMed] [Google Scholar]
- Kamp TJ, Hell JW. Regulation of cardiac L-type calcium channels by protein kinase A and protein kinase C. Circulation Research. 2000;87:1095–1102. doi: 10.1161/01.res.87.12.1095. [DOI] [PubMed] [Google Scholar]
- Lee KS, Marban E, Tsien RW. Inactivation of calcium channels in mammalian heart cells: joint dependence on membrane potential and intracellular calcium. Journal of Physiology. 1985;364:395–411. doi: 10.1113/jphysiol.1985.sp015752. [DOI] [PMC free article] [PubMed] [Google Scholar]
- Lee KS, Tsien RW. High selectivity of calcium channels in single dialysed heart cells of the guinea-pig. Journal of Physiology. 1984;354:253–272. doi: 10.1113/jphysiol.1984.sp015374. [DOI] [PMC free article] [PubMed] [Google Scholar]
- Le Guennec J-Y, Peineau N, Esnard F, Lacampagne A, Gannier F, Argibay J, Gauthier F, Garnier D. A simple method for calibrating collagenase/pronase E ratio to optimise heart cell isolation. Biology of the Cell. 1993;79:161–165. doi: 10.1111/j.1768-322x.1993.tb00906.x. [DOI] [PubMed] [Google Scholar]
- Linz KW, Meyer R. Control of L-type calcium current during the action potential of guinea-pig ventricular myocytes. Journal of Physiology. 1998;513:425–442. doi: 10.1111/j.1469-7793.1998.425bb.x. [DOI] [PMC free article] [PubMed] [Google Scholar]
- Matsuda H. Sodium conductance in calcium channels of guinea-pig ventricular cells induced by removal of external calcium ions. Pflügers Archiv. 1986;407:465–475. doi: 10.1007/BF00657502. [DOI] [PubMed] [Google Scholar]
- Mitarai S, Kaibara M, Yano K, Taniyama K. Two distinct inactivation processes related to phosphorylation in cardiac L-type Ca2+ channel currents. American Journal of Physiology. 2000;279:C603–C610. doi: 10.1152/ajpcell.2000.279.3.C603. [DOI] [PubMed] [Google Scholar]
- Pelzer D, Pelzer S, McDonald TF. Properties and regulation of calcium channels in muscle cells. Reviews of Physiology, Biochemistry and Pharmacology. 1990;114:107–207. doi: 10.1007/BFb0031019. [DOI] [PubMed] [Google Scholar]
- Puglisi JL, Yuan W, Bassani JWM, Bers DM. Ca2+ influx through Ca2+ channels in rabbit ventricular myocytes during action potential clamp: influence of temperature. Circulation Research. 1999;85:1–10. doi: 10.1161/01.res.85.6.e7. [DOI] [PubMed] [Google Scholar]
- Sako H, Green SA, Icranias EG, Yatani A. Modulation of cardiac Ca2+ channels by isoproterenol studied in transgenic mice with altered SR Ca2+ content. American Journal of Physiology. 1997;273:C1666–1672. doi: 10.1152/ajpcell.1997.273.5.C1666. [DOI] [PubMed] [Google Scholar]
- Sanguinetti MC, Krafte DS, Kass RS. Voltage-dependent modulation of Ca channel current in heart cells by BAY K8644. Journal of General Physiology. 1986;88:369–392. doi: 10.1085/jgp.88.3.369. [DOI] [PMC free article] [PubMed] [Google Scholar]
- Sham JSK. Ca2+ release-induced inactivation of Ca2+ current in rat ventricular myocytes: evidence for local Ca2+ signalling. Journal of Physiology. 1997;500:285–295. doi: 10.1113/jphysiol.1997.sp022020. [DOI] [PMC free article] [PubMed] [Google Scholar]
- Song L-S, Wang S-Q, Xiao R-P, Spurgeon M, Lakatta EG, Cheng H. β-Adrenergic stimulation synchronises intracellular Ca2+ release during excitation-contraction coupling in cardiac mycoytes. Circulation Research. 2001;88:794–801. doi: 10.1161/hh0801.090461. [DOI] [PubMed] [Google Scholar]
- Stern M. Theory of excitation-contraction coupling in cardiac muscle. Biophysical Journal. 1992;63:497–517. doi: 10.1016/S0006-3495(92)81615-6. [DOI] [PMC free article] [PubMed] [Google Scholar]
- Sun L, Fan J-S, Clark JW, Palade PT. A model of the L-type Ca2+ channel in rat ventricular myocytes: ion selectivity and inactivation mechanisms. Journal of Physiology. 2000;529:139–158. doi: 10.1111/j.1469-7793.2000.00139.x. [DOI] [PMC free article] [PubMed] [Google Scholar]
- Tsien RW, Hess P, McCleskey EW, Rosenberg RL. Calcium channels: mechanisms of selectivity, permeation and block. Annual Reviews of Biophysics and Biophysical Chemistry. 1987;16:265–290. doi: 10.1146/annurev.bb.16.060187.001405. [DOI] [PubMed] [Google Scholar]
- Viatchenko-Karpinski S, Gyorke S. Modulation of the Ca2+-induced Ca2+ release cascade by β-adrenergic stimulation in rat ventricular myocytes. Journal of Physiology. 2001;533:837–848. doi: 10.1111/j.1469-7793.2001.t01-1-00837.x. [DOI] [PMC free article] [PubMed] [Google Scholar]
- Zhou Z, Bers DM. Ca2+ influx via L-type Ca2+ channel during tail current and above current reversal potential in ferret ventricular myocytes. Journal of Physiology. 2000;523:57–66. doi: 10.1111/j.1469-7793.2000.t01-2-00057.x. [DOI] [PMC free article] [PubMed] [Google Scholar]