

Abstract
The on- and off-transient (i.e. phase II) responses of pulmonary oxygen uptake (V̇O2) to moderate-intensity exercise (i.e. below the lactate threshold, θL) in humans has been shown to conform to both mono-exponentiality and ‘on-off’ symmetry, consistent with a system manifesting linear control dynamics. However above θL the V̇O2 kinetics have been shown to be more complex: during high-intensity exercise neither mono-exponentiality nor ‘on-off’ symmetry have been shown to appropriately characterise the V̇O2 response. Muscle [phosphocreatine] ([PCr]) responses to exercise, however, have been proposed to be dynamically linear with respect to work rate, and to demonstrate ‘on-off’ symmetry at all work intenisties. We were therefore interested in examining the kinetic characteristics of the V̇O2 and [PCr] responses to moderate- and high-intensity knee-extensor exercise in order to improve our understanding of the factors involved in the putative phosphate-linked control of muscle oxygen consumption. We estimated the dynamics of intramuscular [PCr] simultaneously with those of V̇O2 in nine healthy males who performed repeated bouts of both moderate- and high-intensity square-wave, knee-extension exercise for 6 min, inside a whole-body magnetic resonance spectroscopy (MRS) system. A transmit-receive surface coil placed under the right quadriceps muscle allowed estimation of intramuscular [PCr]; V̇O2 was measured breath-by-breath using a custom-designed turbine and a mass spectrometer system. For moderate exercise, the kinetics were well described by a simple mono-exponential function (following a short cardiodynamic phase for V̇O2,), with time constants (τ) averaging: τV̇O2,on 35 ± 14 s (± s.d.), τ[PCr]on 33 ± 12 s, τV̇O2,off 50 ± 13 s and τ[PCr]off 51 ± 13 s. The kinetics for both V̇O2 and [PCr] were more complex for high-intensity exercise. The fundamental phase expressing average τ values of τV̇O2,on 39 ± 4 s, τ[PCr]on 38 ± 11 s, τV̇O2,off 51 ± 6 s and τ[PCr]off 47 ± 11 s. An associated slow component was expressed in the on-transient only for both V̇O2 and [PCr], and averaged 15.3 ± 5.4 and 13.9 ± 9.1 % of the fundamental amplitudes for V̇O2 and [PCr], respectively. In conclusion, the τ values of the fundamental component of [PCr] and V̇O2 dynamics cohere to within 10 %, during both the on- and off-transients to a constant-load work rate of both moderate- and high-intensity exercise. On average, ≈90 % of the magnitude of the V̇O2 slow component during high-intensity exercise is reflected within the exercising muscle by its [PCr] response.
Current considerations of the on- and off-transient (i.e. phase II) responses of pulmonary oxygen uptake (V̇O2) to moderate-intensity exercise (i.e. below the lactate threshold, θL) in humans suggest that the response manifests both mono-exponentiality and ‘on-off’ symmetry (Linnarsson, 1974; Paterson & Whipp, 1991; Özyener et al. 2001); i.e. consistent with a system manifesting linear control dynamics (e.g. Milsum, 1966; Lamarra et al. 1983).
Above θL, however, the V̇O2 response is more complex (Whipp & Wasserman, 1972; Linnarsson, 1974; Hughson & Morrisey, 1982; Barstow & Molé, 1991; Paterson & Whipp, 1991) with the on-transient supra-θL V̇O2 response consisting of two main components: (1) a ‘fundamental’ phase (phase II) well described by an exponential, and (2) a subsequent delayed phase yielding a slowly developing supplemental rise in V̇O2 (e.g. Barstow & Molé, 1991; Paterson & Whipp, 1991), which has been termed ‘excess’ V̇O2 or the V̇O2 slow component (V̇O2,sc) (Whipp, 1987). That is, neither mono-exponentiality nor ‘on-off’ symmetry characterise the V̇O2 response (Linnarsson, 1974; Cerretelli et al. 1977; Paterson & Whipp, 1991; Gerbino et al. 1996; MacDonald et al. 1997; Bohnert et al. 1998; Langsetmo & Poole, 1999; Özyener et al. 2001).
However, the dynamics of putative phosphate-linked controllers of muscle oxygen consumption (Q·O2), such as intramuscular [phosphocreatine] ([PCr]) (e.g. Meyer, 1988), have received far less attention. Consequently, it is not known whether the asymmetries in the V̇O2 responses to different exercise intensites are also evident in these intramuscular responses, or whether the dynamic ‘on-off’ V̇O2 asymmetry (i.e. with the slow component being evident at the on- but not, or much less prominent at, the off-transient; Paterson & Whipp, 1991; Özyener et al. 2001) is a consequence of similar features in intramuscular [PCr] profiles.
Although standard biopsy techniques have allowed [PCr] and levels of related high-energy phosphate metabolites to be determined at discrete points during the transient and steady-states of exercise (e.g. Piiper et al. 1968; Piiper & Spiller, 1970; Holloszy et al. 1971; Crow & Kushmerick, 1982; Bangsbo, 1996), the high temporal resolution provided by 31P magnetic resonance spectroscopy (31P-MRS) has allowed robust kinetic characterisations of the intramuscular responses for both the on- and off-transients (e.g. Meyer, 1988; Kushmerick et al. 1992; Conley et al. 2001; Jubrais et al. 2001). Muscle [PCr] responses to exercise have been reported to be dynamically linear with respect to work rate (Meyer, 1988; Barstow et al. 1994), including ‘on-off’ symmetry (Meyer, 1988). However, the [PCr] and V̇O2 responses to exercise of different intensities have not been determined in concert nor with sufficient sensitivity to discriminate possible small, but real differences between their kinetics. We were therefore interested in examining: (1) the degree to which the different kinetic characteristics of the V̇O2 responses to moderate- and high-intensity square-wave exercise reflected those of the simultaneously measured [PCr] responses, and (2) the relationship between the on- and off-transient kinetic responses of V̇O2 and [PCr]. We elected to make repeated measurements of the variables in order to provide high-confidence estimation of the kinetic parameters (Lamarra et al. 1987; Rossiter et al. 2000).
METHODS
The experimental methods are summarised here, having been previously described by Whipp et al. (1999) and Rossiter et al. (1999).
Subjects
Nine healthy male volunteers with average age of 26 years (range 20-58 years) provided informed consent to participate in the study (as approved by the Local Research Ethics Committee for Human Experimentation in accordance with the Declaration of Helsinki). The subjects' characteristics are given in Table 1.
Table 1.
Subject characteristics
| Subject | Age (years) | Height (cm) | Weight(kg) |
|---|---|---|---|
| 1 | 24 | 178 | 75 |
| 2 | 25 | 183 | 95 |
| 3 | 22 | 186 | 90 |
| 4 | 58 | 185 | 86 |
| 5 | 20 | 196 | 97 |
| 6 | 21 | 187 | 80 |
| 7 | 21 | 180 | 70 |
| 8 | 23 | 185 | 81 |
| 9 | 24 | 181 | 71 |
| Mean | 26 | 185 | 83 |
| s.d. | 11.9 | 5.2 | 9.9 |
Exercise protocols
During comprehensive habituation tests in the Laboratory of Human Physiology: (a) subjects were familiarised, and (b) moderate- and high-intensity work rates were identified, i.e. demarcation of V̇O2 responses either conforming to mono-exponential characteristics (moderate) or associated with a slow phase of V̇O2 kinetics typically leading to fatigue after ≈10 min (high).
Simultaneous determination of pulmonary V̇O2 and intramuscular [PCr] was made from 70 experiments (an average of eight visits by each subject) with the subjects lying prone inside the bore of the 1.5 Tesla super-conducting magnet (Signa Advantage, GE, Milwaukee, USA) with their feet suspended in the rubber stirrups of a custom-designed ergometer (Whipp et al. 1999). The rubber stirrups were tailored to each subject to permit either moderate- or high-intensity square-wave exercise by means of rhythmic alternate-leg knee-extensions (32 pulses min−1 for each leg). The required work rates for each subject were estimated (≈W·) by the methods of Whipp et al. (1999) (Table 2). The contraction phase of the knee extensors of the non-dominant leg occurred in unison with the 31P-MRS acquisition of the quadriceps of the relaxed dominant leg. The subject was ‘strapped down’ to the scanner table by means of a broad non-distensible strap placed over the hips throughout, to minimise extraneous movements.
Table 2.
On- and off-transient PCr and V̇O2 amplitudes during moderate and high-intensity exercise
| Moderate | High | |||||||||
|---|---|---|---|---|---|---|---|---|---|---|
| Subject | Ẇ(W) | ΔV̇O2ss,on(1 min−1) | ΔV̇O2,ss,off(1 min−1) | Δ PCrss,on(%Δ) | ΔPCrss,off(%Δ) | Ẇ (W) | ΔV̇O2ss,on(1 min−1) | ΔV̇O2,ss,off(1 min−1) | Δ PCrss,on(%Δ) | ΔPCrss,off(%Δ) |
| 1 | 80 | 0.82 | 0.84 | 13.3 | 13.7 | 120 | 1.07 | 1.07 | 25.4 | 27.6 |
| 2 | 30 | 0.32 | 0.34 | 12.3 | 10.5 | 120 | 1.21 | 1.20 | 33.2 | 31.4 |
| 3 | 30 | 0.33 | 0.32 | 8.8 | 9.2 | 50 | 0.46 | 0.50 | 17.3 | 15.4 |
| 4 | 30 | 0.26 | 0.27 | 12.0 | 10.0 | 50 | 0.57 | 0.63 | 20.9 | 24.2 |
| 5 | 60 | 0.65 | 0.68 | 11.1 | 13.4 | 100 | 0.95 | 1.07 | 22.0 | 19.2 |
| 6 | 60 | 0.69 | 0.69 | 12.3 | 12.9 | 120 | 1.14 | 1.06 | 14.3 | 14.5 |
| 7 | 30 | 0.23 | 0.23 | 9.5 | 9.5 | 80 | 0.86 | 1.02 | 44.6 | 49.0 |
| 8 | 30 | 0.17 | 0.18 | 6.7 | 6.3 | 80 | 0.74 | 0.91 | 27.9 | 37.4 |
| 9 | 30 | 0.33 | 0.33 | 14.0 | 14.2 | 120 | 1.10 | 1.13 | 20.3 | 21.6 |
| Mean | 42 | 0.42 | 0.43 | 11.1 | 11.1 | 93 | 0.90 | 0.95 | 25.1 | 26.7 |
| s.d. | 19.2 | 0.2 | 0.2 | 2.3 | 2.6 | 29.6 | 0.3 | 0.2 | 9.2 | 11.2 |
Subjects performed between three and five repetitions (each on a different day) of both moderate- and high-intensity exercise in a square-wave exercise protocol consisting of 4 min at rest, 6 min of exercise at the pre-determined level, and then 6 min rest (recovery). The number of repeats required for each subject was governed by the extent to which increasing test repeats improved the overall signal-to-noise characteristics of the averaged V̇O2 and [PCr] responses, therefore allowing appropriate convergence and confidence limits (Rossiter et al. 2000) for the subsequent parameter estimation procedures.
31P-MRS sequence
A one-pulse 31P-MRS acquisition was employed using a surface coil tuned to a frequency of 25.85 MHz for phosphorus, placed under the quadriceps muscle of the dominant leg (in all cases the right leg). The coil was securely fastened to the table. Prior to the 31P data acquisition, a series of axial gradient-recalled echo images of the thigh were acquired. Shimming was performed with an automated shimming package to the proton signal of muscle water (GE, Milwaukee, USA). The 31P-radio frequency excitation pulse was set at a level to give maximum [PCr] signals at a 5 s repetition rate from a 80 mm thick axial ‘slice’ of muscle. Throughout the entire test protocol (rest-exercise-recovery), free induction decays (FIDs) for 31P spectra were collected every 1875 ms with a spectral width of 2500 Hz and 512 data points. 31P-MRS data were averaged over eight acquisitions to estimate every 15 s the relative signal intensities of the three ATP peaks (α, β and γ), PCr and Pi.
Signal intensities of each resonance were calculated (as a batch job) by means of the time-domain variable-projection fitting program, VARPRO (van der Veen et al. 1988), using the appropriate prior knowledge of the ATP multiplets (Stubbs et al. 1996). The T1 saturation factor was assumed to remain constant for each resonance throughout the experiment. Intramuscular pH was estimated from the relative chemical shift of the Pi peak towards the PCr peak:
| (1) |
where δ is the relative chemical shift of [Pi] to [PCr] (Moon et al. 1973).
Pulmonary gas exchange measurement
V̇O2 responses were determined breath-by-breath (Clinical and Scientific Equipment, CaSE, Gillingham, Kent, UK) (Beaver et al. 1973; Whipp et al. 1999). Inspired and expired volume were measured by a bi-directional turbine (VMM, Interface Associates, Laguna Niguel, CA, USA), calibrated with a 3 l syringe over a range of flows (Hans Rudolph, Kansas City, MO, USA). The concentrations of respired gases (O2, CO2 and N2) were measured every 20 ms using a quadrupole mass spectrometer (QP9000, CaSE, Gillingham, Kent, UK), which was calibrated against precision-analysed gas mixtures. Respired gas was drawn continuously from the mouthpiece along the extended 45 ft capillary sampling line to the mass spectrometer, yielding a transit delay of 1.9 s and a 5-95 % rise time of < 80 ms (e.g. Whipp et al. 1999).
Kinetic analysis
The kinetic features of both the V̇O2 and [PCr] responses to moderate- and high-intensity exercise were estimated in a similar fashion. There were, however, a few key differences. The [PCr] data were initially converted to relative changes established from the resting baseline (%Δ), the value of the resting control phase being taken as 100 %. Both the V̇O2 and [PCr] responses have been shown to conform to the structure of a ‘pure’ underlying response superimposed with an uncorrelated ‘noise’ function that is Gaussian and independent of metabolic rate (Lamarra et al. 1987; Rossiter et al. 2000). This not only allows our editing procedure (Lamarra et al. 1987; Rossiter et al. 2000) to eliminate those data lying outside 4 standard deviations of the local mean (arising from coughs, sighs or swallows in the case of V̇O2 or associated to the inherently poor signal-to-noise characteristics of [PCr] measurement by 31P MRS), but also provides the justification for averaging the responses of like-exercise transitions for each subject to reduce the influence of the ‘noise’ on the subsequent parameter estimation. Thus the like-exercise V̇O2 and [PCr] responses were time-aligned to the onset of exercise (corresponding to time zero), interpolated on a second-by-second basis, and then superimposed and averaged for each subject; the V̇O2 responses were averaged every 10 s, and the [PCr] responses every 15 s (i.e. at their MRS sample frequency).
The resulting V̇O2 and [PCr] responses were modelled with non-linear least-squares fitting procedures (Microcal, Origin) to an exponential response, with the duration, time window and delay characteristics of the fitting being dependent on both the variable and the exercise intensity.
The on-transients of both variable responses to moderate-intensity exercise were modelled as a mono-exponential: for [PCr], beginning at time zero and falling to a new steady state; for V̇O2, beginning after the ‘cardiodynamic’ (or phase I) duration and increasing to a new steady state (Whipp et al. 1982):
| (2) |
and
| (3) |
where V̇O2,0 and PCr0 are the values of V̇O2 and [PCr] at t = 0, ΔV̇O2,ss and ΔPCrss are the asymptotic values to which V̇O2 and [PCr] project, τ is the time constant of the responses and δ is a delay term similar to (but not equal to), the phase I - phase II transition time (Whipp et al. 1982; Whipp & Özyener, 1998). (N.B. the phase I, or ‘cardiodynamic’ region of the V̇O2 response has been shown to arise from increased lung perfusion (Whipp et al. 1982; cf. Krogh & Lindhard, 1913) and is thought not to be related to muscle O2 consumption; the subsequent phase II region has been demonstrated to be related to the arrival at the lung of the venous effluent from the exercising muscle (Casaburi et al. 1979; Grassi et al. 1996) and is therefore considered the relevant region for comparison with the intramuscular [PCr] dynamics.) As the corresponding δ term for [PCr] has been shown not to differ significantly from zero, it was not included in the modelling process (Rossiter et al. 1999). Similar models for the off-transient were used:
| (4) |
and
| (5) |
The confidence limits for the parameter estimation (Rossiter et al. 2000) and the χ2 value were also obtained; confidence was set at 95 % and tolerance at 5 % (i.e. P < 0.05).
In the case of high-intensity exercise, the fitting strategy was designed to identify, a posteriori, the onset of a putative delayed ‘slow component’ in the V̇O2 and [PCr] responses. The entire 6 min were therefore not automatically included in the data field for the fit. Rather, the fitting window extended from exercise onset (i.e. t = 0 s for [PCr]; t = time at the end of phase I for V̇O2) initially only 60 s into the exercise. The window was lengthened iteratively, until the exponential model fit demonstrated a discernible and consistent departure from the measured response profiles. However, as the goodness-of-fit cannot be extracted using the approach of Lamarra et al. (1987), two alternative indices were used: (1) the maintenance of the flat profile of the residual plot (i.e. signifying a good fit to the measured data), as judged by visual inspection, and (2) the demonstration of a local ‘threshold’ for increase in the χ2 value. Once the exponential model fit diverged from the measured data, the fitting field was moved back in time by one datum to isolate the fundamental component of the response and the best-fit exponential was then established (see above). This gave extrapolated steady-state values for [PCr] and V̇O2 that were above and below (respectively) the final value actually attained. The magnitude of the V̇O2 and [PCr] slow components (V̇O2,sc and [PCr]sc) were taken as the difference between the amplitude of the final measured value (relative to the pre-exercise resting baseline, averaged for the last 30 s) (ΔV̇O2,end, Δ[PCr]end) and the estimated steady-state amplitude of the fundamental (ΔV̇O2,ss and Δ[PCr]ss). The percentage contribution of the slow component to the total response of variable y thus equals: ((Δyend - Δyss)/Δyss) ×100, where y is V̇O2or [PCr].
The differences between parameter values were examined by repeated-measures ANOVA, across intensity (moderate vs. high), transition (on- vs. off-transition) and by variable (V̇O2vs. PCr). Significance of all the fits to the responses were also estimated using the χ2 goodness-of-fit test (Huntsberger, 1961). Values are given as means and standard deviations, or 95 % confidence intervals (C95) where indicated; a threshold P value of less than 0.05 was used to establish significance.
RESULTS
Moderate-intensity exercise
A representative stack plot of the sequential MR spectra is given in Fig. 1A. The relative concentrations of the three phosphoryl residues of ATP (α, β and γ) remained constant throughout the on- and off-transients while [PCr] declined to a new steady-state level after approximately 3 min of exercise. The temporal response V̇O2 and [PCr] profiles (for subject 4) for the moderate-intensity (and high-intensity) on-transitions are shown in Fig. 2. An early cardiodynamic region (phase I) was evident for the V̇O2 response but not for [PCr] at both moderate- and high-intensity exercise.
Figure 1. Example stack plots of the 31P spectra during moderate- (A) and high-intensity (B) rest-exercise-rest transitions.
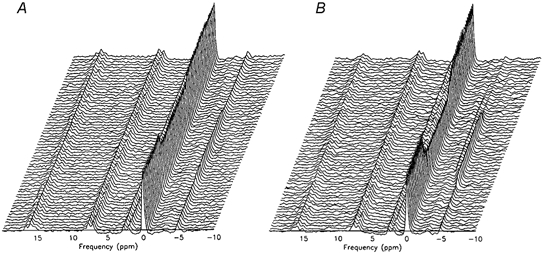
The stack plots are presented here in a reversal of the conventional format in order to visualise the dynamics of the [Pi] peak, which would otherwise be obscured by that of [PCr]. With this format and with the [PCr] peak used as the reference (0 p.p.m.), the [ATP] peaks appear positive and the [Pi] negative (≈−5 p.p.m.).
Figure 2. V̇O2 and [PCr] responses (for subject 2) with model fits and residuals.
A, moderate-intensity exercise; B, high-intensity exercise with the entire response modelled with a mono-exponential; C, high-intensity exercise with the mono-exponential fit limited to the fundamental phase, i.e. accounting for the early ‘cardiodynamic phase’ - see Methods for further elaboration.
Mono-exponential modelling of the fundamental response (i.e. the entire 6 min response for [PCr], and following the phase I region for V̇O2) provided an adequate characterisation of the responses (Fig. 2A) in every case. The individual steady-state V̇O2 increments (ΔV̇O2,ss) were, as expected, dependent on the work rate (W·) performed, with those subjects who were able to maintain the highest subthreshold work rate also reaching the highest V̇O2 (Table 2). This, however, was not always the case with the PCr response (Δ[PCr]ss), possibly reflecting differences in the resting absolute [PCr] concentrations within the region of interest across subjects and/or differences in the underlying τ for oxidative metabolism. For the group as a whole, ΔV̇O2,ss averaged 420 ± 200 ml min−1 and Δ[PCr]ss was 11.1 ± 2.3 % (Fig. 2A; Table 2). The mean ΔPCrss (11.1 ± 2.6 %) and ΔV̇O2,ss (430 ± 200 ml min−1) at the off-transient, were, as expected, not significantly different from those measured at the on-transient; i.e. both [PCr] and V̇O2 recovered to, or close to, 100 % of the pre-exercise baseline values within 6 min, in all cases.
The on-transient time constants for the individual responses averaged 33 ± 12 and 35 ± 14 s for [PCr] and V̇O2, respectively, and their associated confidence intervals (C95) were less than ± 3 s (Table 3). Similarly, the off-transient kinetics were also well characterised by a mono-exponential function (see below, Fig. 4); however, in all but one case, the off-transient time constants were significantly longer than the corresponding on-transient τ, both for [PCr] and V̇O2 (P < 0.05). The off-transient τ values averaged 51 ± 13 and 50 ± 13 s for [PCr] and V̇O2, respectively (Table 3). Again, the narrow C95 bands illustrated the high confidence of the parameter estimation (C95 averaged ± 2.6 s). Despite the differences observed between the on- and off-transient τ values for V̇O2 and [PCr], the on-transient τV̇O2 and τ[PCr] were not statistically different; this was the also the case for the off-transient (Table 3).
Table 3.
Moderate-intensity time constants (τ) for on- and off-transient PCr and V̇O2
| On | Off | |||||||
|---|---|---|---|---|---|---|---|---|
| Subject | τPCr | C95 | τV̇O2 | C95 | τPCr | C95 | τV̇O2 | C95 |
| 1 | 35 | 3.1 | 30 | 2.5 | 39 | 2.2 | 35 | 3.0 |
| 2 | 27 | 2.1 | 29 | 1.8 | 43 | 2.2 | 43 | 2.6 |
| 3 | 64 | 4.6 | 68 | 4.6 | 42 | 2.7 | 43 | 4.0 |
| 4 | 33 | 5.1 | 28 | 3.1 | 60 | 5.6 | 56 | 3.3 |
| 5 | 31 | 6.3 | 39 | 3.0 | 61 | 5.6 | 53 | 3.9 |
| 6 | 30 | 3.5 | 36 | 3.4 | 46 | 5.3 | 45 | 4.1 |
| 7 | 20 | 3.5 | 20 | 4.7 | 72 | 8.5 | 72 | 4.8 |
| 8 | 31 | 4.6 | 35 | 4.1 | 32 | 4.8 | 36 | 4.6 |
| 9 | 30 | 7.4 | 32 | 7.7 | 60 | 9.4 | 65 | 9.0 |
| Mean | 33 | 4.5 | 35 | 3.9 | 51 | 5.1 | 50 | 4.4 |
| s.d. | 12.2 | 1.6 | 13.5 | 1.7 | 13.1 | 2.6 | 12.7 | 1.9 |
Figure 4. On-off asymmetry between the V̇O2 and [PCr] responses to moderate- (○, dashed lines) and high-intensity (•, continuous lines) exercise.
The responses have been normalised to the fundamental amplitudes to enable kinetic comparison of the responses at the two different intensities.
High-intensity exercise
An example of the ‘stack plot’ of the sequential spectra for subject 2 is shown in Fig. 1B. As with moderate exercise, [ATP] remained constant throughout the on- and off-transients. However, unlike moderate exercise, the [PCr] fall could be seen to continue throughout the exercise bout and did not come to a steady state (Fig. 2B and C). The response of the [Pi] peak was not consistent between subjects; however, in the example shown (Fig. 1B), [Pi] clearly ‘decomposed’ into two separate peaks during exercise (cf. Yoshida & Watari, 1994). This phenomenon was apparent in four of the nine subjects during the high-intensity exercise and was not observed during moderate-intensity exercise in any subject.
As expected, the mono-exponential fit to the on-transient V̇O2 responses for high-intensity exercise was not adequate to characterise the response (Fig. 2B), and the fit was therefore limited to the fundamental exponential region (see Methods, Kinetic analysis). Interestingly, this was also the case for the on-transient of the [PCr] response (Fig. 2B), and thus the [PCr] responses were treated similarly to V̇O2.
An example of resulting model fits to the fundamental component are shown in Fig. 2C, and the associated response amplitudes and time constants in Tables 2 and 4, respectively. The amplitudes for [PCr] and V̇O2 were larger than for the moderate-intensity exercise (Table 2): the fundamental Δ[PCr]ss averaged was 25.1 ± 9.2 %, and ΔV̇O2,ss was 900 ± 300 ml min−1. The approximate doubling of the fundamental amplitude of V̇O2 between moderate- and high-intensity exercise was reflected in a similar ratio of the fundamental [PCr] decrement. The off-transient fundamental amplitudes averaged 26.7 ± 11.2 % and 950 ± 200 ml min−1 for Δ[PCr]ss and ΔV̇O2,ss, respectively.
Table 4.
High-intensity ‘fundamental’ component time constants (τ) for on- and off-transient PCr and V̇O2
| On | Off | |||||||
|---|---|---|---|---|---|---|---|---|
| Subject | τPCr | C95 | τV̇O2 | C95 | τPCr | C95 | τV̇O2 | C95 |
| 1 | 38 | 5.9 | 41 | 9.0 | 36 | 3.8 | 58 | 3.6 |
| 2 | 38 | 8.0 | 43 | 9.8 | 46 | 3.4 | 45 | 1.5 |
| 3 | 63 | 11.2 | 44 | 9.5 | 49 | 6.4 | 44 | 5.3 |
| 4 | 38 | 8.5 | 38 | 6.8 | 41 | 3.5 | 62 | 6.5 |
| 5 | 30 | 5.7 | 35 | 8.6 | 70 | 8.7 | 53 | 5.8 |
| 6 | 23 | 8.5 | 31 | 3.0 | 36 | 9.3 | 47 | 4.2 |
| 7 | 39 | 3.3 | 36 | 5.3 | 55 | 5.5 | 55 | 3.8 |
| 8 | 39 | 2.5 | 39 | 3.3 | 43 | 2.6 | 46 | 2.1 |
| 9 | 32 | 7.1 | 42 | 7.0 | 46 | 8.3 | 51 | 7.3 |
| Mean | 38 | 6.7 | 39 | 6.9 | 47 | 5.7 | 51 | 4.5 |
| s.d. | 10.9 | 2.7 | 4.2 | 2.6 | 10.6 | 2.6 | 6.3 | 1.9 |
Limiting the analysis to the fundamental region of the responses produced average on-transient τ values of 38 ± 11 and 39 ± 4 s for [PCr] and V̇O2, respectively (Table 4), and while the shorter fitted region (average 191 ± 37 and 159 ± 23 s for [PCr] and V̇O2, respectively) in the high-intensity exercise led to a larger confidence interval for parameter estimation, the C95 limits still remained within ± 4 s on average. The off-transient responses of both [PCr] and V̇O2 for high-intensity exercise were well characterised by a mono-exponential function (again with a delay arising from the early cardiodynamic region for V̇O2) in contrast to the corresponding on-transient responses at this intensity. This finding is consistent with those of the V̇O2 responses to heavy-intensity exercise during cycle ergometry reported by Özyener et al. (2001). The off-transient fundamental τ values averaged 47 ± 11 and 51 ± 6 s for [PCr] and V̇O2 respectively (Table 4). The associated confidence intervals were further improved, as essentially all of the entire 6 min transient was included in the fitting field (C95 averaged less than ± 3 s).
The final amplitude of [PCr] during the ‘slow component’ region of high-intensity exercise was, on average, 13.9 ± 9.1 % of the fundamental amplitude. The corresponding magnitude of the slow component of V̇O2 was 15.3 ± 5.4 %, thus illustrating that approximately 91 % of the V̇O2,sc magnitude was evident in an intramuscular measure of oxidative metabolism (Table 5). A Student's paired t test did not reveal any significant difference between the magnitude of V̇O2,sc and [PCr]sc. However, the wide standard deviations illustrate that in some cases (e.g. subjects 1, 4, 8 and 9) almost the entire V̇O2 slow component was reflected intramuscularly, whereas in other cases as little as 17 % (subject 6) of the V̇O2 slow component magnitude was manifest in the [PCr] profile.
Table 5.
Magnitude of the slow components of [PCr] and V̇O2
| Subject | [PCr]sc (% phase II amplitude) | V̇O2,sc(% phase II amplitude) |
|---|---|---|
| 1 | 8.2 | 5.8 |
| 2 | 5.7 | 16.4 |
| 3 | 8.3 | 10.9 |
| 4 | 13.9 | 9.1 |
| 5 | 12.4 | 17.2 |
| 6 | 2.9 | 16.8 |
| 7 | 17.9 | 19.6 |
| 8 | 28.7 | 20.4 |
| 9 | 27.1 | 21.2 |
| Mean | 13.9 | 15.3 |
| sd | 9.1 | 5.4 |
Calculation of [PCr]sc and V̇O2,sc is described in Methods.
Intramuscular pH
During moderate-intensity exercise intramuscular pH, as determined by frequency of the [Pi] peak relative to the [PCr] peak (eqn (1)), followed a similar characteristic time course in all subjects. An example (for subject 1) is shown in Fig. 3. Prior to exercise, the intramuscular pH averaged 7.06 ± 0.02 for the nine subjects. At the onset of exercise there was typically a small rise in pH, peaking at approximately 30 s after exercise onset and averaging 7.11 ± 0.03 (Fig. 3). The steady-state exercise pH value of 7.05 ± 0.05 was not significantly different from rest, either pre- or post-exercise. pH fell immediately at exercise offset, reaching a nadir of 6.98 ± 0.07 approximately 30 s later (Fig. 3). This nadir of 0.07 pH units below the resting value was similar in magnitude to the pH peak seen for the exercise on-transient, the mean of which was 0.05 pH units above resting.
Figure 3. Intramuscular pH responses to moderate- and high-intensity constant load exercise in a subject without Pi peak splitting (subject 1).
However, for high-intensity exercise, estimation of the pH was complicated by the non-consistent behaviour of the [Pi] peak at this intensity. For the four subjects who expressed a clearly discernible splitting of the [Pi] peak during this exercise, two distinct regional pH values could be estimated; these averaged 6.62 ± 0.13 and 7.05 ± 0.04 at end-exercise, compared with the pre-exercise baseline of 7.06 ± 0.02 (Fig. 1B). Those subjects who did not clearly express a consistent splitting of the [Pi] peak during the exercise showed only a small degree of acidosis; i.e. an average decrement of 0.1 ± 0.03 pH units at end-exercise (Fig. 3). As previously described by Bendahan et al. (1990), the off-transient pH dynamics in our study could not typically be distinguished, as the characteristic reduction of [Pi] to values below resting in this phase, and in some cases apparently zero, precluded estimation of the chemical shift.
Cross-variable and cross-intensity comparisons
It is salient to note that during the exercise on-transients, the fundamental responses of both variables demonstrated similar average time constants of 33 and 35 s during moderate exercise, and of 38 and 39 s during high-intensity exercise for [PCr] and V̇O2, respectively. Although this close kinetic coupling was maintained at the off-transient, the τ values were typically greater than those at the on-transient (51 and 50 s during moderate exercise and 47 and 51 s during high-intensity exercise for [PCr] and V̇O2, respectively). Repeated-measures ANOVA revealed that there was no effect of either intensity (i.e. moderate or high) or of variable (i.e. PCr or V̇O2) on the values of the fundamental τ. However, a significant effect of transition (i.e. on- or off-transient) was established (P < 0.01).
Also, the increment in the response amplitude above the fundamental, which has been previously well described for V̇O2 (i.e. the V̇O2 slow component), was shown to be evident in the profile of [PCr] (e.g. Fig. 2C). However, the off-transient responses did not express a discernible slow component in either variable. This is illustrated in Fig. 4, where the normalised and phase-aligned on- and off-transient V̇O2 and [PCr] responses of subject 2 from moderate- and high-intensity exercise may be compared. The close temporal relationships between the fundamental region of the on-transients of [PCr] and V̇O2 is clearly demonstrated at both exercise intensities. Furthermore, the slow components of both variables express a similar relative magnitude and time of onset. The off-transient responses, however, clearly did not differ between intensity: neither variable expressed a discernible influence of the on-transient slow component during high-intensity exercise. This inter-intensity dynamic linearity between the off-transients of V̇O2 and [PCr] responses was a typical and striking feature of the off-transient kinetics, with the V̇O2 and [PCr] kinetics from both intensities typically being indistinguishable.
DISCUSSION
Influence of exercise intensity on the V̇O2 and [PCr] kinetics for the fundamental component
As type II fibres in skeletal muscle have been demonstrated to have up to two-thirds fewer mitochondria than type I fibres (Meyer et al. 1985), and also to manifest both a low oxidative efficiency and slow kinetics in response to square-wave exercise, the fundamental V̇O2 dynamics for high-intensity exercise might reasonably be expected to slow as the force contribution from type II fibres increases (Crow & Kushmerick, 1982; Barstow et al. 1996). Although there was a tendency for the fundamental responses of V̇O2 or [PCr] to be faster in moderate- compared with high-intensity exercise, this difference was not statistically significant. Our observations are consistent with the findings of Barstow & Molé (1991), Burnley et al. (2001) and of Özyener et al. (2001) for the fundamental V̇O2 kinetics during cycle ergometry. Furthermore, they add support to the suggestions of Barstow et al. (1990), Grassi et al. (1996) and Rossiter et al. (1999) that Q·O2 and V̇O2 are not dissociated by more than 10 %, in contrast to the suggestions of Cerretelli & di Prampero (1987), who considered the mean response time of the entire response rather than just the phase II component (for further discussion, see Rossiter et al. 1999).
While the proportion of fibre types contributing to force production during moderate- and high-intensity exercise in these studies is not known, it is appears likely that the control of the fundamental component is independent of intensity over this range (consistent with previous suggestions by Barstow & Molé, 1991; Burnley et al. 2001; Özyener et al. 2001), and that the subsequent slow component of both V̇O2 and [PCr] corresponds to a supplemental influence exerted on the fundamental kinetics. Furthermore, the equality between τV̇O2 and τ[PCr] that we have demonstrated for both intensities supports the notion that the fundamental V̇O2 kinetics are determined by an intramuscular mechanism(s) (Mahler, 1980; Hogan, 2001) rather than by muscle perfusion per se, as suggested by Hughson & Morrisey (1982), at least over the range of work rates investigated in this study. Our previous findings did not demonstrate such a striking identity between τV̇O2 and τPCr in every subject (Rossiter et al. 2001) during high-intensity exercise. It is possible that subject variability and/or exercise intensity may contribute to these differences.
Dynamic asymmetry between on- and off-transient responses
In the present study, we have demonstrated a consistent ‘on-off’ asymmetry in the V̇O2 response kinetics for moderate-intensity exercise, with the off-transient τ being longer than the on-transient (Table 3, Fig. 4). At first sight, this appears at odds with earlier reports of on-off symmetry for cycle ergometry (e.g. Linnarsson, 1974; Lamarra et al. 1983, 1987; Griffiths et al. 1986; Paterson & Whipp, 1991; Özyener et al. 2001). However, this may prove to be an overly simplistic description. For example, small but consistent deviations from dynamic linearity in the V̇O2 response to moderate-intensity cycling have been reported by Brittain et al. (2001) during square-wave transitions in different regions of the moderate-intensity domain (cf. Hughson & Morrisey, 1982); Fukuoka et al. (1997) during sinusoidal exercise; and Miyamoto & Niizeki (1992) for incremental and decremental ramps. Less is known about the dynamic linearity of [PCr] kinetics in this intensity domain: on-off [PCr] symmetry has been reported during electrically evoked exercise in rat muscle (Meyer, 1988); a small kinetic asymmetry was reported in isolated perfused dog muscle (Piiper et al. 1968; Piiper & Spiller, 1970).
Other potential influences on the symmetry of the on- and off-transient V̇O2 and [PCr] repsonses must not be discounted, however, for example: (1) an involvement of a component of obligatory anaerobiosis arising from the dynamics of cardiac output (Q·) (Yoshida & Whipp, 1994); (2) asymmetries of intramuscular pH similar to those estimated here. However, these would be expected to be more marked at high- compared with moderate-intensity exercise; (3) the influence of a higher-order control system (Jeneson et al. 1996), or ‘feedforward’ control of Q·O2 (Timmons et al. 1996); (4) influences of asymmetric [Pi] kinetics (e.g. Bendahan et al. 1990) to respiratory control mechanism(s) or (5) challenges to the underlying assumption that the constant-load work rate leads to a constant ATP requirement during the exercise period (Boska, 1994; Bangsbo et al. 2001; Rossiter et al. 2001; Giannesini et al. 2002). However, recently Kushmerick (1998) has clearly demonstrated the potential for kinetic asymmetry in the [PCr] response to exercise due to alterations in the creatine kinase (CK) equilibrium associated with changes in ATP utilisation that are close to those reported in the present results during knee-extensor exercise in humans (e.g. Table 3; Fig. 4). The mechanism(s) underlying the measured asymmetry in the present study, however, await(s) resolution.
Inferences from the V̇O2 and [PCr] slow components
The V̇O2,sc has been shown to be a dynamic feature of V̇O2 that is superimposed onto the fundamental response to a square-wave work rate increase (Whipp & Mahler, 1980; Barstow & Molé, 1991; Paterson & Whipp, 1991; Poole et al. 1994; Özyener et al. 2001). This component of V̇O2 appears to be intimately related to the fatigue process, although its precise causes are poorly understood. By measuring blood flow and arterio-venous O2 content difference across an exercising limb, Poole et al. (1991) showed that the V̇O2 slow component (i.e. from 3 min after onset to the end of exercise) was significantly associated with limb Q·O2. These authors thus suggested that ≈86 % of the slow component of V̇O2 arose in the exercising muscle. Others (Billat et al. 1998; Özenyer et al. 1999) have suggested a more crucial role of increases in unmeasured work done by the arms and other stabilising muscles during heavy-intensity cycling exercise. Furthermore, many other mechanisms have been suggested, such as increases in respiratory muscle work (Hagberg et al. 1978; Wasserman et al. 1995), increases in exercising muscle (or body) temperature via the Q10 effect causing up to an ≈8 % increase in absolute V̇O2 with a 1 °C increase in muscle temperature, assuming a Q10 of 2.2 (Wilkie, 1968; Poole et al. 1988; Willis & Jackman, 1994; Koga et al. 1997), increases in interstitial potassium levels (Barnes, 1988; Medbo & Sejersted, 1990), and/or adrenaline and noradrenaline (Gollnick, 1978) stimulating metabolism. The slow component may also be due to alteration in CK activity rates (Kushmerick, 1998), possibly modulated by the ensuing acidosis associated with high-intensity exercise. However, the underlying mechanistic link(s) to V̇O2,sc of such putative mediators have yet to be demonstrated. The present investigation has demonstrated that a similar slow component is evident in intramuscular [PCr] and the V̇O2 only at high-intensity work rates, where moderate-intensity exercise in the same subjects expresses first-order mono-exponential on-kinetics.
This demonstration of [PCr]sc is consistent with the suggestion by Conley et al. (2001) that [PCr] and pH interact via the CK reaction to ‘set’ [ADP] in contracting muscle. These authors have suggested that in order to stave off the effects of ensuing fatigue the muscle should ‘keep [PCr] low and/or keep pH high’. This would have the effect of potentially maintaining [ADP], which, if it were the predominant feedback controller for oxidative phosphorylation, would avoid an inexorable rise in Q·O2. At work rates that lead to a metabolic acidosis, where pH is low or continually falling (as in high-intensity exercise in these studies), a reduction in [PCr] would be necessary in order to maintain ADP supply and therefore balance ATP supply to demand. However, it is interesting that this view is apparently not manifest during the fundamental phase of both V̇O2 and [PCr], as during this component of the responses the kinetics are manifest with an apparently invariant time course, i.e. moderate- and high-intensity τ was the same in the on-transient fundamental phase, despite a falling pH during high-intensity exercise.
Our data suggest that the fundamental V̇O2 component gain is approximately constant for each individual (i.e. ΔV̇O2,ss/Δ W· reflects the Δ Q·O2,ss/Δ W·) and does not differ at different exercise intensities, consistent with the results of cycle ergometer exercise (e.g. Barstow & Molé, 1991; Paterson & Whipp, 1991; Özyener et al. 2001). However, the slow component appears to be superimposed upon this fundamental response, which causes a reduction in the oxygen utilisation efficiency of the muscular work (or an increase in gain i.e. ΔV̇O2,ss/Δ W· or Δ[PCr]ss/ΔW·). This slow-onset supplementary component is observable in the exercising muscle as an increase in the rate of [PCr] utilisation, reflecting a high phosphate cost of force production, rather than a high O2 cost of phosphate production. These current findings are in broad agreement with those of Poole et al. (1991) for V̇O2. The data from our investigations, however, also show good dynamic association between the onset of the V̇O2,sc and that of [PCr] (to within ≈30 s). Furthermore, as well as this close temporal association, the magnitude of the [PCr]sc corresponds to 91 % on average of that for the V̇O2,sc when normalised to the amplitude of the fundamental phase (despite a large standard deviation), the remainder of the response presumably residing in other mechanisms, such as intramuscular inefficiency of oxidative phosphorylation (as suggested by Meyer & Foley, 1996) or extra O2 cost from other sites.
From their investigations of the V̇O2 slow component in both running and cycling for groups of highly trained athletes familiar with both modalities (triathletes), Billat et al. (1998) have implicated additional unmeasured work from auxiliary muscles (e.g. in the arms) as contributing to the ‘excess’ V̇O2 during cycling, as the slow phase was markedly less prominent during treadmill exercise. However, the highly trained status of the subjects in the study of Billat et al. (1998) may be of some importance, as Williams et al. (2001) have recently measured a considerable V̇O2,sc during treadmill running in ‘less-elite’ athletes.
In conclusion, we have demonstrated, firstly, that the time constants of the fundamental component for simultaneously determined [PCr] and V̇O2 dynamics cohere to within 10 %, during both the on- and off-transients to square-wave exercise of both moderate and high intensity. This is consistent with the notion that there is an apparent ‘fundamental’ phase of V̇O2, the kinetics of which is independent of the energy requirement (i.e. the work rate imposed), as previously suggested (Barstow et al. 1996; Burnley et al. 2001; Özyener et al. 2001). Furthermore, it is possible that the dynamic asymmetry between the on- and off-transient responses in both [PCr] and V̇O2 at both intensities investigated could be a consequence of alterations in the CK equilibrium during the transition (cf. Kushmerick, 1998); however, why these asymmetries are not consistently demonstrated during cycle ergometry is, at present, unclear. Hence the dynamic responses of V̇O2 and [PCr] could retain linear first-order control, but via a transfer function that is dependent on CK equilibrium. Finally, our results demonstrate that ≈90 %, on average, of the magnitude of the V̇O2 slow component during high-intensity exercise is reflected within the exercising muscle by its [PCr] response, consistent with previous suggestions of the origin of the V̇O2 slow component (Poole et al. 1991), and that the fundamental and slow component kinetics of V̇O2 reflect an intramuscular signal for oxidative metabolism.
Acknowledgments
This work was supported by The Wellcome Trust, grant number 058420. H. B. R. is supported by The Wellcome Trust-International Prize Travelling Fellowship.
REFERENCES
- Bangsbo J. Oxygen deficit: A measure of the anaerobic energy production during intense exercise? Canadian Journal of Applied Physiology. 1996;21:350–363. doi: 10.1139/h96-031. [DOI] [PubMed] [Google Scholar]
- Barnes WS. Depressing effect of calcium antagonists on oxygen consumption in isolated skeletal muscle during potassium depolarisation. Canadian Journal of Physiology and Pharmacology. 1988;66:836–840. doi: 10.1139/y88-134. [DOI] [PubMed] [Google Scholar]
- Barstow TJ, Buchthal S, Zanconato S, Cooper DM. Muscle energetics and pulmonary oxygen uptake kinetics during moderate exercise. Journal of Applied Physiology. 1994;77:1742–1749. doi: 10.1152/jappl.1994.77.4.1742. [DOI] [PubMed] [Google Scholar]
- Barstow TJ, Jones AM, Nguyen PH, Casaburi R. Influence of muscle fiber type and pedal frequency on oxygen uptake kinetics of heavy exercise. Journal of Applied Physiology. 1996;81:979–989. doi: 10.1152/jappl.1996.81.4.1642. Barstow, T. J., Lamarra, N. & Whipp, B. J. (1990). Modulation of muscle and pulmonary O2 uptakes by circulatory dynamics during exercise. Journal of Applied Physiology68. [DOI] [PubMed] [Google Scholar]
- Barstow TJ, Molé PA. Linear and non-linear characteristics of oxygen uptake kinetics during heavy exercise. Journal of Applied Physiology. 1991;71:2099–2106. doi: 10.1152/jappl.1991.71.6.2099. [DOI] [PubMed] [Google Scholar]
- Beaver WL, Wasserman K, Whipp BJ. On-line computer analysis and breath-by-breath graphical display of exercise function tests. Journal of Applied Physiology. 1973;34:128–132. doi: 10.1152/jappl.1973.34.1.128. [DOI] [PubMed] [Google Scholar]
- Bendahan D, Confort-Gouny S, Kozak-Reiss G, Cozzone PJ. Pi trapping in glycogenolytic pathway can explain transient Pi disappearance during recovery from muscular exercise. FEBS Letters. 1990;269:402–405. doi: 10.1016/0014-5793(90)81203-z. [DOI] [PubMed] [Google Scholar]
- Billat VL, Richard R, Binsse VM, Koralsztein JP, Haouzi P. The V̇O2 slow component for severe exercise depends on type of exercise and is not correlated with time to fatigue. Journal of Applied Physiology. 1998;85:2118–2124. doi: 10.1152/jappl.1998.85.6.2118. [DOI] [PubMed] [Google Scholar]
- Bohnert B, Ward SA, Whipp BJ. Effects of prior arm exercise on pulmonary gas exchange kinetics during high-intensity leg exercise in humans. Journal of Applied Physiology. 1998;83:557–570. doi: 10.1113/expphysiol.1998.sp004138. [DOI] [PubMed] [Google Scholar]
- Boska M. ATP production rates as a function of force level in the human gastrocnemius/soleus using 31P MRS. Magnetic Resonance in Medicine. 1994;32:1–10. doi: 10.1002/mrm.1910320102. [DOI] [PubMed] [Google Scholar]
- Brittain CJ, Rossiter HB, Kowalchuk JM, Whipp BJ. The kinetics of O2 uptake in different regions of the moderate exercise intensity domain in humans. Journal of Physiology. 2001;531.P:44P. [Google Scholar]
- Burnley M, Doust JH, Carter H, Jones AM. Effects of prior exercise and recovery duration on oxygen uptake kinetics during heavy exercise in humans. Experimental Physiology. 2001;86:417–425. doi: 10.1113/eph8602122. [DOI] [PubMed] [Google Scholar]
- Casaburi R, Weissman ML, Huntsman DJ, Whipp BJ, Wasserman K. Determinants of gas exchange kinetics during exercise in the dog. Journal of Applied Physiology. 1979;46:1054–1060. doi: 10.1152/jappl.1979.46.6.1054. [DOI] [PubMed] [Google Scholar]
- Cerretelli P, Di Prampero PE. Handbook of Physiology, section 3, The Respiratory System, Gas Exchange. IV. Bethesda, MD, USA: American Physiological Society; 1987. Gas exchange in exercise. The Respiratory System. Gas Exchange; pp. 297–340. chap. 16. [Google Scholar]
- Cerretelli P, Shindell D, Pendergast DP, Di Prampero PE, Rennie DW. Oxygen uptake transients at the onset and offset of arm and leg work. Respiration Physiology. 1977;30:81–97. doi: 10.1016/0034-5687(77)90023-8. [DOI] [PubMed] [Google Scholar]
- Conley KE, Kemper WF, Crowther GJ. Limits to sustainable muscle performance: interaction between glycolysis and oxidative phosphorylation. Journal of Experimantal Biology. 2001;204:3189–3194. doi: 10.1242/jeb.204.18.3189. [DOI] [PubMed] [Google Scholar]
- Crow MT, Kushmerick MJ. Chemical energetics of slow- and fast-twitch muscles of the mouse. Journal of General Physiology. 1982;79:147–166. doi: 10.1085/jgp.79.1.147. [DOI] [PMC free article] [PubMed] [Google Scholar]
- Fukuoka Y, Shigematsu M, Fukuba Y, Koga S, Ikegami H. Dynamics of respiratory response to sinusoidal work load in humans. International Journal of Sports Medicine. 1997;18:264–269. doi: 10.1055/s-2007-972631. [DOI] [PubMed] [Google Scholar]
- Giannesini B, Izquierdo M, Le Fur Y, Cozzone PJ, Bendahan D. In vivo reduction in ATP cost of contraction is not related to fatigue level in stimulated rat gastrocnemius muscle. Journal of Physiology. 2002;536:905–915. doi: 10.1111/j.1469-7793.2001.00905.x. [DOI] [PMC free article] [PubMed] [Google Scholar]
- Gerbino A, Ward SA, Whipp BJ. Effects of prior exercise on pulmonary gas-exchange kinetics during high-intensity exercise in humans. Journal of Applied Physiology. 1996;80:99–107. doi: 10.1152/jappl.1996.80.1.99. [DOI] [PubMed] [Google Scholar]
- Gollnick PD. Delivery and uptake of substrates. In: Landry F, Orban WAR, editors. Third International Symposium on Biochemistry and Exercise. Miami, FL, USA: Symposia Specialists; 1978. pp. 87–97. [Google Scholar]
- Grassi B, Poole DC, Richardson RS, Knight DR, Erickson BK, Wagner PD. Muscle O2 uptake kinetics in humans: implications for metabolic control. Journal of Applied Physiology. 1996;80:988–998. doi: 10.1152/jappl.1996.80.3.988. [DOI] [PubMed] [Google Scholar]
- Griffiths TL, Henson LC, Whipp BJ. Influence of peripheral chemoreceptors on the dynamics of the exercise hyperpnoea in man. Journal of Physiology. 1986;380:387–403. doi: 10.1113/jphysiol.1986.sp016292. [DOI] [PMC free article] [PubMed] [Google Scholar]
- Hagberg JM, Mullin JP, Nagle FJ. Oxygen consumption during constant-load exercise. Journal of Applied Physiology. 1978;45:381–384. doi: 10.1152/jappl.1978.45.3.381. [DOI] [PubMed] [Google Scholar]
- Hogan MC. Fall in intracellular PO2 at the onset of contractions in Xenopus single skeletal muscle fibers. Journal of Applied Physiology. 2001;90:1871–1876. doi: 10.1152/jappl.2001.90.5.1871. [DOI] [PubMed] [Google Scholar]
- Holloszy JO, Oscai LB, Molé PA, Don IJ. Biochemical adaptations to endurance exercise in skeletal muscle. In: Pernow B, Saltin B, editors. Advances in Experimental Medicine and Biology, Muscle Metabolism during Exercise. Vol. 11. London, UK: Plenum Press; 1971. pp. 51–62. [Google Scholar]
- Hughson RL, Morrsisey M. Delayed kinetics of respiratory gas exchange in the transition from prior exercise. Journal of Applied Physiology. 1982;52:921–929. doi: 10.1152/jappl.1982.52.4.921. [DOI] [PubMed] [Google Scholar]
- Huntsberger DV. Elements of Statistical Inference. Boston, USA: Allyn and Bacon Inc.; 1961. [Google Scholar]
- Jeneson JAL, Wiseman RW, Westerhoff HV, Kushmerick MJ. The signal transduction function for oxidative phosphorylation is at least second order in ADP. Journal of Biological Chemistry. 1996;271:27995–27998. doi: 10.1074/jbc.271.45.27995. [DOI] [PubMed] [Google Scholar]
- Jubrais SA, Esselman PC, Price LB, Cress ME, Conley KE. Large energetic adaptations of elderly muscle to resistance and endurance training. Journal of Applied Physiology. 2001;90:1663–1670. doi: 10.1152/jappl.2001.90.5.1663. [DOI] [PubMed] [Google Scholar]
- Koga S, Shiojiri T, Konda N, Barstow TJ. Effect of increased muscle temperature on oxygen uptake kinetics during exercise. Journal of Applied Physiology. 1997;83:1333–1338. doi: 10.1152/jappl.1997.83.4.1333. [DOI] [PubMed] [Google Scholar]
- Krogh A, Lindhard J. The regulation of respiration and circulation during the initial stages of muscular work. Journal of Physiology. 1913;47:112–136. doi: 10.1113/jphysiol.1913.sp001616. [DOI] [PMC free article] [PubMed] [Google Scholar]
- Kushmerick MJ. Energy balance in muscle activity: Simulations of ATPase coupled to oxidative phosphorylayion and to creatine kinase. Comparative Biochemistry and Physiology B. 1998;120:109–123. doi: 10.1016/s0305-0491(98)00026-1. [DOI] [PubMed] [Google Scholar]
- Kushmerick MJ, Meyer RA, Brown TR. Regulation of oxygen consumption in fast- and slow-twitch muscle. American Journal of Physiology. 1992;263:C598–606. doi: 10.1152/ajpcell.1992.263.3.C598. [DOI] [PubMed] [Google Scholar]
- Lamarra N, Whipp BJ, Blemenberg M, Wasserman K. Model-order estimation of cardiorespiratory dynamics during moderate exercise. In: Whipp BJ, Wiberg DM, editors. Modelling and Control of Breathing. Oxford, UK: Elsevier Biomedical; 1983. [Google Scholar]
- Lamarra N, Whipp BJ, Ward SA, Wasserman K. Effect of interbreath fluctuations on characterizing exercise gas exchange kinetics. Journal of Applied Physiology. 1987;62:2003–2012. doi: 10.1152/jappl.1987.62.5.2003. [DOI] [PubMed] [Google Scholar]
- Langsetmo I, Poole DC. V̇O2 recovery in the horse following moderate, heavy and severe exercise. Journal of Applied Physiology. 1999;86:1170–1177. doi: 10.1152/jappl.1999.86.4.1170. [DOI] [PubMed] [Google Scholar]
- Linnarsson D. Dynamics of pulmonary gas exchange and heart rate changes at the start and end of exercise. Acta Physiologica Scandinavica. 1974;suppl., 415:1–68. [PubMed] [Google Scholar]
- MacDonald M, Pedersen PK, Hughson RL. Acceleration of O2 kinetics in submaximal heavy exercise by hyperoxia and prior high-intensity exercise. Journal of Applied Physiology. 1997;83:1318–1325. doi: 10.1152/jappl.1997.83.4.1318. [DOI] [PubMed] [Google Scholar]
- Mahler M. Kinetics and control of oxygen consumption in skeletal muscle. In: Cerretelli P, Whipp BJ, editors. Exercise Bioenergetics and Gas Exchange. Amsterdam, The Netherlands: Elsevier/North-Holland Biomedical Press; 1980. pp. 53–66. [Google Scholar]
- Medbo JI, Sejersted OM. Plasma potassium changes with high-intensity exercise. Journal of Physiology. 1990;421:105–122. doi: 10.1113/jphysiol.1990.sp017935. [DOI] [PMC free article] [PubMed] [Google Scholar]
- Meyer RA. A linear model of muscle respiration explains mono-exponential phosphocreatine changes. American Journal of Physiology. 1988;254:C548–553. doi: 10.1152/ajpcell.1988.254.4.C548. [DOI] [PubMed] [Google Scholar]
- Meyer RA, Brown TR, Kushmerick MJ. Phosphorus nuclear magnetic resonance of fast- and slow-twitch muscle. American Journal of Physiology. 1985;248:C279–287. doi: 10.1152/ajpcell.1985.248.3.C279. [DOI] [PubMed] [Google Scholar]
- Meyer RA, Foley JM. Cellular processes integrating the metabolic response to exercise. In: Rowell LB, Shepherd JT, editors. Handbook of Physiology, section 12, Exercise: Regulation and Integration of Multiple Systems. Bethesda, MD, USA: American Physiological Society; 1996. pp. 841–869. chap. 18. [Google Scholar]
- Milsum JH. Biological Control System Analysis. New York: McGraw Hill; 1966. Transient response characteristics; pp. 115–138. [Google Scholar]
- Miyamoto Y, Niizeki K. Dynamics of ventilation, circulation and gas exchange to incremental and decremental ramp exercise. Journal of Applied Physiology. 1992;72:2244–2254. doi: 10.1152/jappl.1992.72.6.2244. [DOI] [PubMed] [Google Scholar]
- Moon RB, Richards JH. Determination of intracellular pH by 31P magnetic resonance. Journal of Biological Chemistry. 1973;248:7276–7278. [PubMed] [Google Scholar]
- Özyener F, Rossiter HB, Ward SA, Whipp BJ. Influence of exercise intensity on the on- and off-transient kinetics of pulmonary oxygen uptake in humans. Journal of Physiology. 2001;533:891–902. doi: 10.1111/j.1469-7793.2001.t01-1-00891.x. [DOI] [PMC free article] [PubMed] [Google Scholar]
- Özyener F, Ward SA, Whipp BJ. Contribution of arm muscle oxygenation to the ‘slow component’ of pulmonary oxygen uptake during leg-exercise cycle ergometry. Journal of Physiology. 1999;515.P:73P. [Google Scholar]
- Paterson DH, Whipp BJ. Asymmetries of oxygen uptake transients at the on- and offset of heavy exercise in humans. Journal of Physiology. 1991;443:575–586. doi: 10.1113/jphysiol.1991.sp018852. [DOI] [PMC free article] [PubMed] [Google Scholar]
- Piiper J, Di Prampero PE, Cerretelli P. Oxygen debt and high-energy phosphates in gastrocnemius muscle of the dog. American Journal of Phsyiology. 1968;215:523–531. doi: 10.1152/ajplegacy.1968.215.3.523. [DOI] [PubMed] [Google Scholar]
- Piiper J, Spiller Repayment of O2 debt and resynthesis of high-energy phosphates in gastrocnemius muscle of the dog. Journal of Applied Physiology. 1970;28:657–662. doi: 10.1152/jappl.1970.28.5.657. [DOI] [PubMed] [Google Scholar]
- Poole DC, Barstow TJ, Gaesser GA, Willis WT, Whipp BJ. V̇O2 slow component: physiological and functional significance. Medicine and Science in Sports and Exercise. 1994;26:1354–1358. [PubMed] [Google Scholar]
- Poole DC, Schaffartzik W, Knight DR, Derion T, Kennedy B, Guy HJ, Prediletto R, Wagner PD. Contribution of exercising legs to the slow component of oxygen uptake kinetics in humans. Journal of Applied Physiology. 1991;71:1245–1253. doi: 10.1152/jappl.1991.71.4.1245. [DOI] [PubMed] [Google Scholar]
- Poole DC, Ward SA, Gardner GW, Whipp BJ. Metabolic and respiratory profile of the upper limit for prolonged exercise in man. Ergonomics. 1988;31:1265–1279. doi: 10.1080/00140138808966766. [DOI] [PubMed] [Google Scholar]
- Rossiter HB, Ward SA, Doyle VL, Howe FA, Griffiths JR, Whipp BJ. Inferences from pulmonary O2 uptake with respect to intramuscular [PCr] kinetics during moderate exercise in humans. Journal of Physiology. 1999;518:921–932. doi: 10.1111/j.1469-7793.1999.0921p.x. [DOI] [PMC free article] [PubMed] [Google Scholar]
- Rossiter HB, Howe FA, Ward SA, Kowalchuk JM, Griffiths JR, Whipp BJ. Inter-sample [PCr] fluctuations by 31P-MRS and parameter estimation of metabolic responses to exercise in humans. Journal of Physiology. 2000;528:359–369. doi: 10.1111/j.1469-7793.2000.t01-1-00359.x. [DOI] [PMC free article] [PubMed] [Google Scholar]
- Stubbs M, Van Den Boogaart A, Bashford CL, Miranda PMC, Rodrigues LM, Howe F, Griffiths JR. 31P-Magnetic resonance spectroscopy studies of nucleated and non-nucleated erythrocytes; time domain data analysis (VARPRO) incorporating prior knowledge can give information on the binding of ADP. Biochimica et Biophysica Acta. 1996;1291:143–148. doi: 10.1016/0304-4165(96)00058-x. [DOI] [PubMed] [Google Scholar]
- Timmons JA, Poucher SM, Constantin-Teodosiu D, Worrall V, MacDonald IA, Greenhaff PL. Increased acetyl group availability enhances contractile function of canine skeletal muscle during ischemia. Journal of Clinical Investigtion. 1996;97:879–883. doi: 10.1172/JCI118490. [DOI] [PMC free article] [PubMed] [Google Scholar]
- van Der Veen JWC, De Beer R, Luyten PR, Ormnidt D. Accurate quantification of in vivo31P MRS signals using the variable projection method and prior knowledge. Magnetic Resonance in Medicine. 1988;6:92–98. doi: 10.1002/mrm.1910060111. [DOI] [PubMed] [Google Scholar]
- Wasserman K, Stringer WW, Casaburi R. Is the slow component of V̇O2 a respiratory adaptation to anaerobiosis? Advances in Experimental Medicine and Biology. 1995;393:187–194. [PubMed] [Google Scholar]
- Whipp BJ, Mahler M. Dynamics of pulmonary gas exchange during exercise. In: West JB, editor. Pulmonary Gas Exchange, Organism and Environment. II. NY: Academic Press Inc.; 1980. pp. 33–96. [Google Scholar]
- Whipp BJ, Özyener F. The kinetics of exertional oxygen uptake: assumptions and inferences. Medicina Dello Sport. 1998;51:139–149. [Google Scholar]
- Whipp BJ, Rossiter HB, Ward SA, Avery D, Doyle VL, Howe FA, Griffiths JR. Simultaneous determination of muscle 31phosphate and O2 uptake kinetics during whole-body NMR spectroscopy. Journal of Applied Physiology. 1999;86:742–747. doi: 10.1152/jappl.1999.86.2.742. [DOI] [PubMed] [Google Scholar]
- Whipp BJ, Ward SA, Lamarra N, Davis JA, Wasserman K. Parameters of ventilatory and gas exchange dynamics during exercise. Journal of Applied Physiology. 1982;52:1506–1513. doi: 10.1152/jappl.1982.52.6.1506. [DOI] [PubMed] [Google Scholar]
- Whipp BJ, Wasserman K. Oxygen uptake kinetics for various intensities of constant load work. Journal of Applied Physiology. 1972;33:351–356. doi: 10.1152/jappl.1972.33.3.351. [DOI] [PubMed] [Google Scholar]
- Wilkie DR. Tissues subserving movement and conduction. In: Davson H, Eggleton M, editors. Principles of Human Physiology. Philadelphia, USA: Lea & Febiger; 1968. pp. 778–893. [Google Scholar]
- Williams CA, Carter H, Jones AM, Doust JH. Oxygen uptake kinetics during treadmill running in boys and men. Journal of Applied Physiology. 2001;90:1700–1706. doi: 10.1152/jappl.2001.90.5.1700. [DOI] [PubMed] [Google Scholar]
- Willis WT, Jackman MR. Mitochondrial function during heavy exercise. Medicine and Science in Sport and Exercise. 1994;26:1347–1354. [PubMed] [Google Scholar]
- Yoshida T, Watari H. Exercise-induced splitting of the inorganic phosphate peak: investigation by time-resolved 31P-nuclear magnetic resonance spectroscopy. European Journal of Applied Physiology. 1994;69:465–473. doi: 10.1007/BF00239861. [DOI] [PubMed] [Google Scholar]
- Yoshida T, Whipp BJ. Dynamic asymmetries of cardiac output transients in response to muscular exercise in man. Journal of Physiology. 1994;480:355–359. doi: 10.1113/jphysiol.1994.sp020365. [DOI] [PMC free article] [PubMed] [Google Scholar]