

Abstract
A confocal Ca2+ imaging technique has been used to detect ATP release from individual sympathetic varicosities on the same nerve terminal branch. Varicose nerve terminals and smooth muscle cells in mouse vas deferens were loaded with the Ca2+ indicator Oregon Green 488 BAPTA-1. Field (nerve) stimulation evoked discrete, focal increases in [Ca2+] in smooth muscle cells adjacent to identified varicosities. These focal increases in [Ca2+] have been termed ‘neuroeffector Ca2+ transients’ (NCTs). NCTs were abolished by α,β-methylene ATP (1 μM), but not by nifedipine (1 μM) or prazosin (100 nm), suggesting that NCTs are generated by Ca2+ influx through P2X receptors without a detectable contribution from L-type Ca2+ channels or α1-adrenoceptor-mediated pathways. Action potential-evoked ATP release was highly intermittent (mean probability 0.019 ± 0.002; range 0.001-0.10) at 1 Hz stimulation, even though there was no failure of action potential propagation in the nerve terminals. Twenty-eight per cent of varicosities failed to release transmitter following more than 500 stimuli. Spontaneous ATP release was very infrequent (0.0014 Hz). No Ca2+ transient attributable to noradrenaline release was detected even in response to 5 Hz stimulation. There was evidence of local noradrenaline release as the α2-adrenoceptor antagonist yohimbine increased the probability of occurrence of NCTs by 55 ± 21 % during trains of stimuli at 1 Hz. Frequency-dependent facilitation preferentially occurred at low probability release sites. The monitoring of NCTs now allows transmitter release to be detected simultaneously from each functional varicosity on an identified nerve terminal branch on an impulse-to-impulse basis.
The vas deferens receives a dense sympathetic innervation (see Stjärne, 1989). Following nerve stimulation, the co-transmitters ATP (Burnstock, 1976; Morris & Gibbins, 1992), which acts on P2X1 receptors (Mulryan et al. 2000), and noradrenaline (NA), which acts on α1-adrenoceptors, are released. P2X1 receptors are ligand-gated cation channels that are permeable to cations including Ca2+ (Benham & Tsien, 1987). In contrast, α1-adrenoceptors are G protein coupled and their activation in many smooth muscle cells leads to the production of inositol trisphosphate (IP3), which in turn releases Ca2+ from intracellular stores (Hashimoto et al. 1986). Given that the two principal co-transmitters in the vas deferens are generally assumed to increase Ca2+ concentration ([Ca2+]) in smooth muscle cells, the measurement of postjunctional [Ca2+] provides a potential approach for the detection of transmitter release with a high spatial and temporal resolution.
Transmitter release from autonomic nerve terminals following nerve stimulation has previously been detected by measuring either contraction, the overflow of transmitters or their metabolites (Loewi, 1936; Peart, 1949; Brown & Gillespie, 1957), intracellular recording of junction potentials (Burnstock & Holman, 1961), focal extracellular recording of excitatory junctional currents (Brock & Cunnane, 1987, 1988) or amperometry (Mermet et al. 1990). These techniques have allowed the measurement of the average release probability per action potential per varicosity, and have shown that transmitter release is highly intermittent at neuroeffector junctions. By measuring transmitter overflow and counting the number of varicosities per unit volume of smooth muscle, the average probability of release was first estimated to be 0.01-0.03 (Folkow et al. 1967). Very similar probabilities (0.002-0.03; Cunnane & Stjärne, 1984) were determined by measuring ‘discrete events’ in excitatory junction currents. These release probabilities are, however, considerably lower than those determined from measurement of focal extracellular currents using small diameter electrodes (mean probability of 0.25; Lavidis & Bennett, 1992). The discrepancies among measurements of release probability may arise because of the significant difficulties involved in estimating the number of release sites that are sampled with each technique. Hence a technique that enables the detection of transmitter release from single varicosities would allow a more accurate measurement of release probability.
Here we report on the development of a novel technique to detect ATP release from individual sympathetic varicosities on the same nerve terminal branch on an impulse-to-impulse basis. Using this technique, we have determined the characteristic physiological and pharmacological features of evoked and spontaneous transmitter release from single varicosities on the same nerve terminal branch in mouse isolated vas deferens.
METHODS
Indicator loading
Vasa deferentia were removed from 8- to 12-week-old Balb/c mice (Harlan, UK), which had been killed by cervical fracture. All efforts were made to minimise the number of animals used; all experiments were in accordance with the European Communities Council Directives (86/609/EEC of 24 November 1986). The cut prostatic end of the vas deferens was secured in a glass micropipette containing the Ca2+ indicator Oregon Green 488 BAPTA-1 10 kDa dextran (Molecular Probes, OR, USA), using a protocol similar to that previously described (Brain & Bennett, 1997). Less than 1 mm of the length of the vas deferens was drawn into the pipette. The loading procedure filled many varicose postganglionic nerve terminals and, within 2 mm of the cut end of the vas deferens, a subset of smooth muscle cells. Nerve terminals and smooth muscle cells were identified based on their characteristic morphology. The concomitant loading of a population of smooth muscle cells was an unexpected finding as the dextran conjugates of Ca2+ indicators have low membrane permeability and are unlikely to traverse the gap junctions that couple smooth muscle cells. One possible explanation for smooth muscle cell loading is uptake of the indicator by pinocytosis during the long loading period.
In initial experiments, 2.5 % Triton X-100 was added to the indicator solution, as it had been thought that this detergent would make axons more permeable to the indicator. To avoid permeabilisation of the smooth muscle cells, subsequent preparations were loaded in the absence of Triton X-100. There was no detectable diminution of indicator loading into either nerve terminals or smooth muscle cells in the absence of Triton X-100.
Image acquisition
Images were acquired using a Leica inverted confocal microscope. All field stimuli (pulse width 0.06 ms; amplitude 50 V; 0.1-5 Hz) were synchronised with the start of image acquisition, so that the interval between each stimulus and recording was fixed. The high stimulus voltage maximised the chance that the nerve terminal action potential would be reliably initiated, which was particularly important in the experiments where the nerve terminal [Ca2+] could not be monitored. Confocal images were captured in sets of either 60 or 200, with a 2 min interval between each set. In each experiment, eight sets of images were recorded as controls. Preparations were exposed to each drug under investigation for 20 min to ensure adequate equilibration, and then a further eight sets of images were recorded. Unless stated otherwise, images were captured at twice the stimulus frequency, so that a stimulus occurred on every second frame. This protocol provided a control image prior to every stimulus and hence allowed the detection of consecutive [Ca2+] transients from the same location.
Image analysis
Image analysis was performed with NIH Image (from URL http://rsb.info.nih.gov/nih-image/) or Image SXM (from URL http://reg.ssci.liv.ac.uk/). Local, discrete changes in Ca2+ concentration in smooth muscle cells ([Ca2+]sm) were detected using custom-written macros based upon the ‘Particle Analysis’ algorithm of NIH Image. From the raw images, the ratios of the fluorescent intensity between consecutive recordings were calculated on a pixel-by-pixel basis without any averaging of the controls. The Particle Analysis algorithm was used to detect focal changes in the ratio of fluorescence intensities of 50 % over a continuous area of at least 2.5 μm2. A threshold was set, based on the background signal of the image, below which the algorithm did not search for events. Each event was manually checked to confirm that there was no lateral or focal plane shifts that might have caused over-counting; such aberrant events were manually excluded from the analysis.
When measuring the amplitude or kinetics of a focal [Ca2+]sm transient, the change in fluorescence signal was measured within a rectangular region (area 20-60 μm2), which completely enclosed the [Ca2+]sm transient. The measurement box was larger than the area of the [Ca2+]sm transient so that the entire change in fluorescence signal was measured even if small local contractions shifted the position of the image laterally during the period of recording. The effects of movement were further reduced by using the ‘Auto Register’ facility of Image SXM, i.e. the use of a cross-correlation algorithm, based on the fast fourier transform of each image, to align all images in a set.
The frequency of spontaneous [Ca2+]sm transients was so low that, when determining the probability of evoked [Ca2+]sm transients, no correction was made for their occurrence, except for experiments involving α,β-methylene ATP and saxitoxin.
Drugs and statistical analysis
All drugs were obtained from Sigma-Aldrich (Dorset, UK). Saxitoxin was freshly prepared on each experimental day from commercially available pre-packaged 10 μg lots. Other drugs were prepared from 10 mm stock solutions, frozen in aliquots at −20 °C. Unless otherwise stated, statistical tests are Student's two-tailed paired t tests. Where the term ‘abolished’ is used, the probability was not significantly different from zero (P > 0.05).
RESULTS
Neurogenic focal [Ca2+] transients in smooth muscle cells
When the Ca2+ concentration in the smooth muscle cells ([Ca2+]sm) was monitored during trains of nerve stimuli at 2 Hz, discrete, focal increases in [Ca2+]sm were intermittently detected (Fig. 1A; see the supplementary material data for an animation of more of this image set; number of smooth muscle cells, nsm = 194; number of preparations, np = 30). Each of these focal [Ca2+]sm transients was synchronous with a field stimulus (nsm = 194; np = 30). The focal [Ca2+]sm transients were spatially clustered within each smooth muscle cell. The distance between the clusters of focal [Ca2+]sm transients was similar to the distance between nerve terminal varicosities on the same nerve terminal branch. Saxitoxin, which blocks voltage-gated Na+ channels and hence blocks the nerve terminal action potential, abolished the electrically evoked [Ca2+]sm transients (100 nm; number of clusters, nc = 31; nsm = 6; np = 3).
Figure 1. Discrete and intermittent smooth muscle [Ca2+] transients follow nerve stimulation.
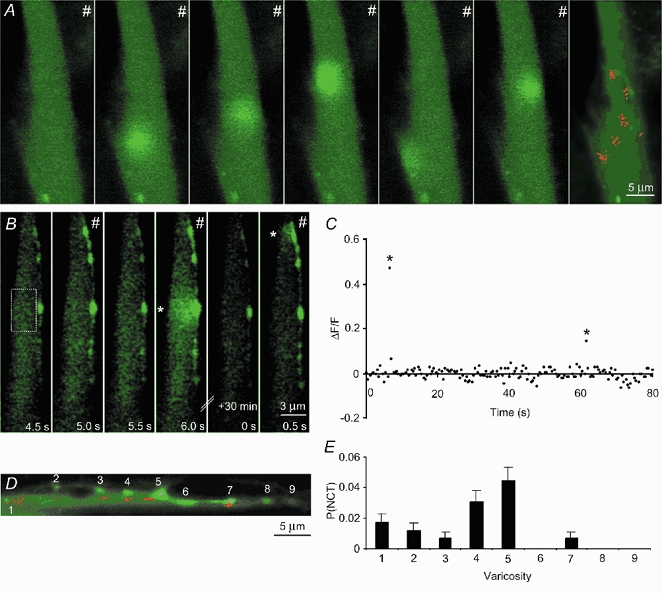
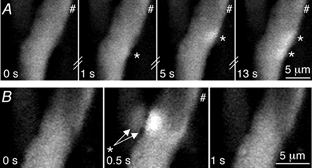
A, the first six frames show selected images of the same smooth muscle cell taken during 2 Hz stimulation (#). There is no response to most stimuli (frame 1). Other stimuli evoke focal [Ca2+] transients in the smooth muscle cell (frames 2-6). Green represents the fluorescence of the Ca2+ indicator Oregon Green 488 BAPTA-1. The final frame was obtained from a confocal section 3 μm above that of the preceding images, and shows an overlying nerve terminal varicosity (also filled with the indicator). Each red dot denotes the location (centre) of a single smooth muscle [Ca2+] transient occurring at some time during 8 sets of recordings. B, consecutive confocal images of a smooth muscle cell and an adjacent nerve terminal. Field (nerve) stimulation occurred at 1 Hz. Following every stimulus the nerve terminal showed an increase in [Ca2+]. Discrete Ca2+ transients (*) are occasionally detected in the smooth muscle cell. C, the relative change in fluorescence intensity of the Ca2+ indicator in the region marked in B monitored over time. The first significant event in B (frame 4) corresponds to the first significant event in C. D, map of the occurrence of smooth muscle [Ca2+] transients in a different preparation. E, the probability of evoking a focal [Ca2+] transient adjacent to these varicosities, as numbered in D.
Simultaneous measurement of [Ca2+] transients in nerve and smooth muscle
In some preparations, regions could be found in which both the nerve terminal varicosities and the underlying smooth muscle cell were labelled with the Ca2+ indicator. Nerve terminals and smooth muscle cells could be distinguished on the basis of their characteristic size, shape and differences in the resting fluorescence (Fig. 1A, B and D). In such preparations it is likely that there were nearby nerve terminals that were unlabelled or poorly labelled with the indicator. Following field stimulation, [Ca2+] transients in varicose nerve terminals ([Ca2+]v) were elicited in response to every action potential (Fig. 1B), as previously reported (Brain & Bennett, 1997; Brain et al. 2001). In favourable circumstances, nerve terminal branches traversing the long axis of a smooth muscle cell were aligned within the focal plane of the microscope. In such smooth muscle cells, the focal [Ca2+]sm transients arose in direct apposition to indicator-filled varicosities (Fig. 1B, frames 4 and 6; Fig. 1D and E). As these intermittent, focal [Ca2+]sm transients occur immediately adjacent to nerve terminal varicosities it is likely that they are generated by the intermittent release of transmitter from the same varicosities. These evoked, intermittent, focal [Ca2+]sm transients have been termed ‘neuroeffector Ca2+ transients’ (NCTs). NCTs arising from the same tightly grouped cluster are attributed to the focal release of transmitter from a single varicosity, which presumably makes close contact with the smooth muscle cell and forms a neuroeffector junction.
Probability of release from a single varicosity
By measuring the probability of evoking an NCT in an identified cluster it is possible to estimate the probability of transmitter release from a single varicosity. The mean probability of detecting an NCT at a junction following a nerve action potential (PNCT) was 0.019 ± 0.002, with the distribution skewed towards low probabilities (range 0.001-0.10; number of clusters, nc = 195; nsm = 28; np = 18; mean ± s.e.m. for all results). Interestingly, at most junctions the probability of occurrence was less than 0.01 (Fig. 2A). The probability of occurrence of NCTs varied from varicosity to varicosity on the same nerve terminal branch (Fig. 1E). The probability of occurrence of NCTs from junctions in which the overlying varicosity was filled with the indicator (nc = 16; nsm = 6; np = 6) was not significantly lower than in junctions where no nearby indicator-filled varicosity could be identified (ΔPNCT = −0.002 ± 0.004; one-tailed unpaired t test, P = 0.63), although this experiment does not have sufficient statistical power to detect a 25 % change in PNCT.
Figure 2. Neuroeffector Ca2+ transients reflect intermittent ATP release.
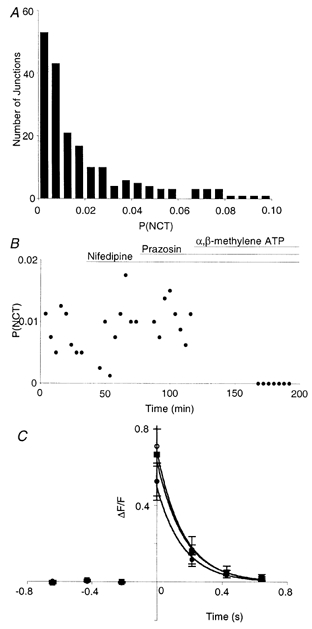
A, NCT probability per junction when stimulated at 1 Hz (np = 13). B, average NCT probability per junction in a single smooth muscle cell as nifedipine (1 μM), then prazosin (100 nm) and finally α,β-methylene ATP (1 μM) were added. Only the latter drug abolished these events, although this took up to 1 h. C, average change in fluorescence signal during NCTs from a single junction (▪; n = 6 NCTs). The time of detection of each NCT was set to 0 s. The temporal resolution of xy-scanning (214 ms) is such that the time of stimulus, the peak of the response, and the time of detection, are synchronous. Nifedipine (○; n = 17) and then prazosin (•; n = 12) had no significant effect on the amplitude.
Nature of the transmitter generating NCTs
The competitive α1-adrenoceptor antagonist prazosin (100 nm) had no effect on PNCT (ΔPNCT = 0.001 ± 0.002; Fig. 2B; nc = 63; nsm = 9; np = 5; P = 0.25) and no effect on the amplitude of NCTs (increased by 12 ± 32 %; Fig. 2C; nc = 6; nsm = 3; np = 2). In cells previously exposed to prazosin, bath application of α,β-methylene ATP (1 μM), which desensitises P2X receptors, abolished NCTs (Fig. 2B; nc = 40; nsm = 6; np = 3). In the presence of α,β-methylene ATP (1 μM) alone, NCTs were also abolished (nc = 57; nsm = 8; np = 4) and indeed no change in the [Ca2+]sm was detected. The first exposure of the preparation to α,β-methylene ATP did not elicit any detectable [Ca2+]sm change. It should be noted that the bath application of α,β-methylene ATP does not in any way mimic the rapid, focal, high ATP concentration that follows nerve stimulation.
It was surprising that no change in [Ca2+]sm was detected in the presence of α,β-methylene ATP, as noradrenergic transmission should be intact and NA is widely believed to trigger contraction by elevating [Ca2+]sm. In order to increase the effective junctional concentration of NA, the catecholamine transporter uptake-1 was blocked using desmethylimipramine. In the presence of α,β-methylene ATP (1 μM) and desmethylimipramine (1 μM), no significant change in [Ca2+]sm was detected during trains of stimuli at 5 Hz for 30 s (nsm = 5; np = 3). Higher frequency stimulation was attempted, but the data could not be reliably interpreted as the smooth muscle cells moved out of the plane of focus as the vas deferens contracted. Whether the smooth muscle cells under investigation contracted, or whether other cells within the vas deferens contracted, could not be determined.
It may be that the activation of P2X receptors is necessary, but not sufficient, for the generation of NCTs. For example, influx of Na+ through P2X receptors may locally depolarise the smooth muscle cell and activate voltage-gated Ca2+ channels. In order to test this hypothesis the L-type Ca2+ channel blocker nifedipine was used (Fig. 2B and C). Nifedipine (1 μM) had no effect on the probability of evoking NCTs (ΔPNCT) = 0.001 ± 0.001; nc = 40; nsm = 6; np = 3; P = 0.45) and no effect on their amplitude (increased by 11 ± 23 %; nc = 6; nsm = 3; np = 2).
The occurrence of NCTs adjacent to stimulated varicosities, and their clustering, intermittence and sensitivity to α,β-methylene ATP, strongly indicates that NCTs are elicited by the focal release of ATP from individual varicosities.
Correlating nerve terminal [Ca2+]v transients with NCTs
Some varicosities (28 % of 50; nsm = 8; np = 7) showed no adjacent NCTs in response to trains of more than 500 action potentials at 1 Hz, despite being directly apposed to a smooth muscle cell that responded to other varicosities on the same nerve terminal branch (Fig. 1D and E). This finding suggests that some varicosities have a very low (possibly zero) probability of transmitter release. Given the finite number of recordings, it can only be stated (with 95 % confidence) that the release probability from these junctions is less than 0.006 (which is 1 − 0.050.002).
Given that Ca2+ influx into the nerve terminal is necessary to trigger transmitter release, it might be predicted that there would be a positive correlation between the amplitude of the [Ca2+]v transient evoked by the nerve action potential and the probability of release from that varicosity. When the amplitude of the [Ca2+]v transient in response to the first action potential in a train at 1 Hz was compared with the probability of detecting NCTs in the adjacent smooth muscle during the train, no significant correlation was detected (95 % confidence interval for correlation coefficients of −0.77 to 0.06; nc = 16; np = 4). Impulse-to-impulse monitoring of the [Ca2+]v transient amplitude was not carried out, as the [Ca2+]v does not completely return to its resting concentration between stimuli during trains of impulses at 1 Hz. As the fluorescence of the high-affinity indicator Oregon Green 488 BAPTA-1 is not proportional to the change in [Ca2+]v over a large range, analysis of the amplitude of the fluorescence signal change following each impulse in a train of impulses cannot be interpreted with any degree of confidence.
Kinetics of NCTs
When recorded with a temporal resolution of 214 ms, the NCTs showed a peak [Ca2+]sm on the first frame after the stimulus, which thereafter rapidly returned to the resting concentration. When sampled between 50 and 100 ms after the stimulus, the NCTs extended over an area of 12 ± 2 μm2 (defined as the area in which the change in fluorescence signal was greater than 1/e of its maximum; nc = 4; nsm = 3; np = 3). As each NCT is bounded and constrained by the plasma membrane on one side, the shape of the NCT is approximately hemispherical or circular (with a radius of 2.8 ± 0.2 μm). NCTs could also be detected with a Nipkow disc-scanning microscope (20 ms temporal resolution; nsm = 4; np = 1; data not shown).
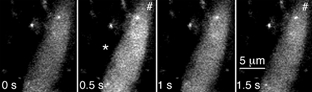
In order to study the kinetics of NCTs at a greater temporal resolution, line scanning confocal microscopy was performed. Line scans (1 ms resolution) through regions of smooth muscle cells generating NCTs confirmed that the [Ca2+]sm rises close to the plasma membrane and then diffuses further into the smooth muscle cell (Fig. 3). When the adjacent nerve terminal varicosity lay along the axis of the line scan, the [Ca2+]v increase always preceded the NCT. When the fluorescence signal from within 2 μm of the edge of the smooth muscle cell was measured, there was a delay between the stimulus and the first detectable increase in [Ca2+]sm of 6.0 ± 1.3 ms (nc = 8; np = 4). This delay reflects the time for action potential propagation in the nerve, junctional delay and the time for the [Ca2+]sm to rise to a detectable concentration. The time-to-peak of the NCTs was 30 ± 2 ms (nc = 8; np = 4). The fluorescence then recovered with first-order kinetics with a time constant of 120 ± 19 ms (nc = 8; np = 4). When the kinetics of NCTs were monitored during xy-scanning over an area of 20-60 μm2, the NCTs recovered with first-order kinetics with a time constant of 280 ± 90 ms (nc = 7; np = 4). The large difference between these two time constants suggests that diffusion of Ca2+ into the smooth muscle cytoplasm contributes to recovery of the [Ca2+] close to the site of entry.
Figure 3. Line scanning confocal microscopy simultaneously monitors nerve terminal [Ca2+]v and NCTs.
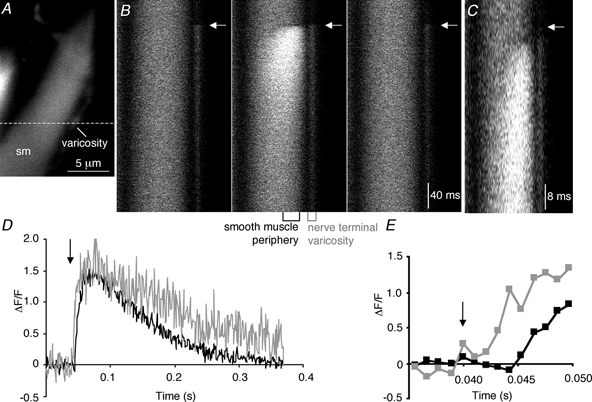
A, xy-scan showing the position (dashed line) of the line scan images through a smooth muscle cell (sm) and an overlying varicosity. B, three consecutive line scan images through the smooth muscle cell and an adjacent nerve terminal varicosity shown in A. The arrow marks the time of the stimulus. The central panel is shown again in C, but with greater temporal resolution around the time of the stimulus. D, quantification of the changes in fluorescence from a region at the right edge of the smooth muscle cell and from the overlying varicosity. E, magnified view, demonstrating that the [Ca2+] in the varicosity rises before that in the smooth muscle cell.
Does the amplitude of NCTs vary at a single neuroeffector junction?
It is generally believed that each vesicle releases a similar number of transmitter molecules, i.e. that the quantal size is similar. If the change in [Ca2+]sm is proportional to the amount of ATP released, then the amplitude of each NCT should vary over a small range from the mean at a given neuroeffector junction. However, during xy-scanning the amplitude of NCTs at a given site was found to vary more than 9-fold (nc = 6; nsm = 3; np = 3). The variance of the amplitude distribution was much greater than the variance of the noise (F-test P value of < 0.0001 at each neuroeffector junction; nc = 6; nsm = 3; np = 3), which suggests that the recording method was not entirely responsible for the wide range of NCT amplitudes from a given junction.
Spontaneous NCTs
As the evoked release of ATP generates NCTs, it was intriguing to discover whether spontaneous transmitter release could similarly be detected. Spontaneous focal [Ca2+]sm transients were occasionally observed. These focal [Ca2+]sm transients usually occurred (80 % of the time) in the same location as evoked NCTs (Fig. 4A) and were abolished by α,β-methylene ATP (1 μM; nsm = 8; np = 4). They are likely to result from the spontaneous release of packets of ATP from nerve terminal varicosities and will be referred to as spontaneous NCTs (sNCTs). Such sNCTs had amplitudes that were within the range of the amplitudes of evoked NCTs from the same site. Precise interpretation of the amplitude of the sNCTs is difficult because the time between transmitter release and recording is unknown and uncontrolled, while the sampling interval (214 ms) is similar to the rate of decay of sNCTs. sNCTs occurred with a frequency of 0.0014 Hz per junction (range 0-0.02 Hz; nc = 259; nsm = 37; np = 22), i.e. about one event every 12 min. The low frequency of occurrence makes the study of sNCTs difficult at present. Junctions that showed sNCTs had a slightly greater evoked NCT probability than those showing no spontaneous activity (ΔPNCT = 0.005 ± 0.001; nc = 259; nsm = 37; np = 22; unpaired t test, P < 0.05).
Figure 4. NCTs occur spontaneously at a low frequency.
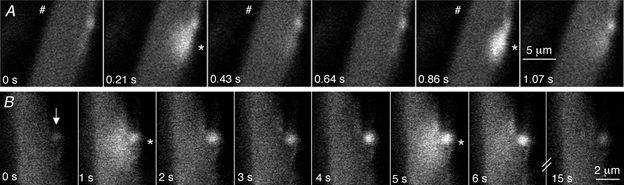
A, spontaneous focal [Ca2+] transients (*) are occasionally recorded (frame 2). These spontaneous focal [Ca2+] transients are similar to evoked NCTs (frame 5), in this case arising adjacent to an indicator-filled varicosity. These images were acquired during a long train of stimuli at high frequency (2.3 Hz), during which the [Ca2+]v accumulated to such an extent that the indicator begins to be saturated and hence the action potential-induced change in [Ca2+]v is not apparent. B, a smooth muscle cell and an adjacent nerve terminal varicosity (arrow) are shown in a series of confocal images. The [Ca2+] in the varicosity rises to a plateau and is associated with spontaneous NCTs at t = 1 and 5 s. Hence spontaneous nerve terminal [Ca2+] transients are sometimes associated with local, spontaneous ATP release.
In previous studies it has been reported that spontaneous changes in [Ca2+]v lasting 1-10 s intermittently occurred in a small subset of nerve terminal varicosities (Brain & Bennett, 1997), and it has been speculated that such [Ca2+]v transients might transiently increase the probability of spontaneous transmitter release. In the present study, similar slow [Ca2+]v transients were also observed. sNCTs in the adjacent smooth muscle cells preferentially occurred during these spontaneous [Ca2+]v transients (nsm = 4; np = 4; Fig. 4B; Fisher's exact test, P < 0.05 for each cell). In each of these cells sNCTs were recorded rarely, so a quantitative comparison of the probability of sNCTs, with and without spontaneous [Ca2+]v transients, has not been made. These observations suggest that spontaneous elevations in [Ca2+]v sometimes precede, and therefore presumably initiate, transmitter release.
Non-regenerative smooth muscle [Ca2+] waves
NCTs at a small minority of neuroeffector junctions (nc = 4; nsm = 3; np = 3) characteristically initiated a [Ca2+]sm transient that propagated within the smooth muscle cell over a distance of 5-10 μm, before collapsing within 0.6-1 s. This propagation was often unidirectional along the longitudinal axis of the cell, with the direction consistent among events arising from the same focus. Such unidirectional propagation may be due to a local diffusion barrier or due to the local and non-uniform triggering of Ca2+ release from within the smooth muscle cell in a manner that was subthreshold for maintaining regenerative Ca2+ waves.
Local contraction
In some smooth muscle cells (nsm = 8 of a series of 38; np = 7) NCTs initiated a twitch, demonstrating that local transmitter release is capable of causing local contraction.
Independence of NCTs from adjacent junctions
NCTs are sufficiently small, compared with the distance between varicosities on the same nerve terminal branch, that when NCTs occur synchronously at adjacent junctions, these NCTs can be resolved (Fig. 5A). This ability to resolve synchronous NCTs indicates that the measurement of transmitter release probabilities is not underestimated simply by a failure to distinguish the simultaneous release of transmitter from adjacent varicosities. At some junctions, the occurrence of an NCT in one smooth muscle cell was strongly correlated with the simultaneous occurrence of an NCT in an adjacent smooth muscle cell (Fig. 5B; Fisher's exact P < 0.001; number of pairs = 6; np = 4). The existence of such synchronous NCTs strongly suggests that ATP, locally released from one varicosity, can act on more than one smooth muscle cell.
Figure 5. NCTs from adjacent sites.
A, selected images of two smooth muscle cells taken during a train of 1 Hz stimuli (#), recorded at a frequency of 2 Hz. NCTs from adjacent regions of the smooth muscle cell (frames 2 and 3) can be resolved, even when they occur synchronously (frame 4). B, the same two adjacent smooth muscle cells in which adjacent regions show simultaneous NCTs (frame 2).
Effects of stimulus frequency on NCTs
Excitatory junction potentials and currents in the mouse vas deferens, and many other tissues, show frequency-dependent facilitation, so it was of interest to determine whether an analogous increase in the probability of detecting an NCT following nerve stimulation (PNCT) occurred as the frequency of stimulation increased. PNCT at 1 Hz was 60 ± 20 % greater than when stimulating at 0.1 Hz (Fig. 6A; nc = 64; nsm = 8; np = 5; P < 0.05), demonstrating that there is frequency-dependent facilitation of transmitter release as reported by the detection of NCTs.
Figure 6. Facilitation and autoinhibition of NCTs.
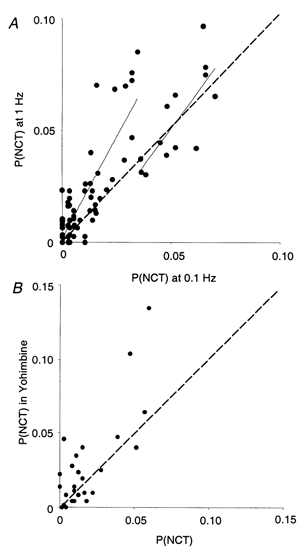
A, NCT probability in response to trains of stimuli at 1 Hz, compared with 0.1 Hz stimulation, in 6 preparations, following more than 200 stimuli with each protocol. Each point represents one neuroeffector junction. The NCT probabilities, when stimulated at 0.1 and 1 Hz, were positively correlated (correlation coefficient 0.84; 95 % confidence interval 0.77 −0.89). Those junctions with a lower initial release probability show more facilitation. The continuous lines are linear curve fits to the data when PNCT < 0.02 at 0.1 Hz, and when PNCT > 0.35 at 0.1 Hz. The dashed line is where the two probabilities are equal. B, in the presence of the α2-antagonist yohimbine (10 μM) during 1 Hz stimulation, however, there is a more uniform elevation in release probability, demonstrating that locally released endogenous NA modulates ATP release from most secretory varicosities. There was a positive correlation between PNCT in the control and in the presence of yohimbine (correlation coefficient 0.87; 95 % confidence interval 0.76-0.93).
It was of great interest to determine whether facilitation of transmission occurred at all junctions and whether the initial release probability from a given junction influenced its capacity to facilitate. To distinguish between junctions with a high or low probability of release (when stimulated at 0.1 Hz), an arbitrary threshold probability of PNCT = 0.02 was chosen (which is close to the mean probability). Low release probability junctions (PNCT < 0.02 at 0.1 Hz) showed an increase in PNCT of 130 ± 30 % (nc = 51) when stimulated at 1 Hz. Higher release probability junctions (PNCT > 0.02 at 0.1 Hz), however, showed only a 38 ± 16 % increase in PNCT at 1 Hz (nc = 13). This difference in the frequency dependence of PNCT between low (< 0.02) and higher (> 0.02) release probability junctions is significant (unpaired t test, P < 0.05), implying that frequency-dependent facilitation of transmitter release preferentially occurs from varicosities that initially have a low probability of release. The results also suggest that most functional neuroeffector junctions contribute to facilitation.
Local autoinhibition of transmitter release
Sympathetic neurotransmission is modulated by neurally released NA acting at prejunctional α2-adrenoceptors. In order to determine whether NA was locally released and to investigate autoregulation with a high spatial resolution, this pathway was interrupted using the competitive α2-adrenoceptor antagonist yohimbine. At 1 Hz, yohimbine (10 μM) increased PNCT by 55 ± 21 % (Fig. 6B; nc = 35; nsm = 4; np = 3; P < 0.05). The proportional increase in PNCT was not significantly different between low and high release probability junctions (unpaired two-tailed t test, P = 0.66). These findings indicate that NA is released locally and that both high and low release probability junctions undergo α2-adrenoceptor-mediated autoinhibition.
Intermittent whole-cell increases in [Ca2+]sm
Some smooth muscle cells (nsm = 17; np = 12) exhibited intermittent, whole-cell increases in [Ca2+]sm in response to nerve stimulation (Fig. 7). In these cells, the average probability of occurrence of whole-cell [Ca2+]sm transients following a single nerve terminal action potential was 0.029 ± 0.009 (nsm = 9; np = 7). These whole-cell [Ca2+]sm elevations could be abolished by either α,β-methylene ATP (1 μM; nsm = 2; np = 1) or nifedipine (1 μM; nsm = 5; np = 4). No pairs of nearby smooth muscle cells were found in which whole-cell increases in [Ca2+]sm synchronously occurred at a rate greater than that predicted by chance.
Figure 7. Intermittent whole-cell [Ca2+] transients.
Whole-cell [Ca2+] increases (*) are intermittently evoked in some smooth muscle cells. These events can be used to detect smooth muscle action potentials.
DISCUSSION
Neuroeffector Ca2+ transients are generated as a result of local ATP release from nerve terminal varicosities
The present work has established a technique for detecting and monitoring the release of transmitter with high spatial resolution by using postjunctional smooth muscle cells as a biological detector. The occurrence of focal [Ca2+]sm transients following field stimulation, their clustering and the observation that such events are abolished when the nerve terminal action potential is abolished (with saxitoxin), imply that they are generated by the release of transmitter from nerve terminals. The clustering of NCTs and their frequent apposition to nerve terminal varicosities strongly suggests that they are generated by the discrete release of transmitter from varicosities that presumably make close contact with the smooth muscle cell. This is the first direct evidence for the release of transmitter from varicosities rather than inter-varicose segments.
The changes in [Ca2+] in the smooth muscle cells and nerve terminal varicosities can be clearly distinguished because the former: (1) are abolished by α,β-methylene ATP; (2) occur within a smooth muscle cell, identified on the basis of its size and shape; (3) are highly intermittent rather than occurring without failure; (4) occur over a much larger area (12 ± 2 μm2 compared with the 1-2 μm2 reported by Brain & Bennett, 1997); (5) occur at a later time after the stimulus (during line scanning); and (6) do not have sharply demarked boundaries, except at the boundary of the smooth muscle cell.
NCTs arise following the activation of P2X receptors (Fig. 8), as they were abolished by prolonged exposure to the P2X receptor agonist α,β-methylene ATP (1 μM), which desensitises P2X receptors and induces receptor internalisation (Ennion & Evans, 2001). Focal [Ca2+] transients, occurring in response to exogenous ATP acting on P2X receptors, have been previously reported in rat isolated portal vein smooth muscle cells (Mironneau et al. 2001), but there have been no similar studies on endogenous ATP release in intact organs. Purinergic transmission in the guinea-pig bladder induces Ca2+ waves that propagate between bundles of smooth muscle cells (Hashitani et al. 2000), but it is not known whether these waves are preceded by more focal Ca2+ transients.
Figure 8. A schematic illustrating the intermittent release of ATP, which generates NCTs.
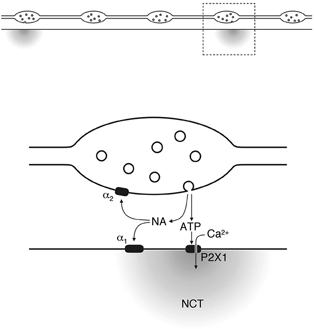
Each nerve terminal action potential invades every varicosity, but a packet of ATP, and presumably NA, is only rarely released. The ATP acts on P2X receptors, triggering the entry of Ca2+. Locally released NA mediates prejunctional autoinhibition.
Activation of α1-adrenoceptors was not involved in generating NCTs, as the NCTs were not affected by prazosin (100 nm). The varicosities from which these purinergic NCTs originate are probably sympathetic, as vasa deferentia taken from mice pretreated with 6-hydroxydopamine do not have purinergic excitatory junction potentials (Allcorn et al. 1986).
NCTs do not depend on the influx of Ca2+ through L-type voltage-gated Ca2+ channels, which are the only significant high-voltage-activated Ca2+ channels found on smooth muscle cells (Knöckner, 1996), as nifedipine (1 μM) had no effect on them. The lack of effect of nifedipine is consistent with the observation that nifedipine does not affect excitatory junction potentials in the vas deferens (Beattie et al. 1986; Stjärne et al. 1991). While we have not tested for a potential contribution from T-type (low-voltage-activated) Ca2+ channels, it is unlikely that depolarisation can be sufficiently spatially confined to yield local depolarisation within a few square micrometres of smooth muscle cell membrane without similarly depolarising the rest of the smooth muscle cell. Whether or not intracellular Ca2+ stores are involved in amplifying the Ca2+ influx through P2X receptors is at present under investigation.
The confocal microscope has sufficient spatial resolution to distinguish between release from adjacent varicosities on the same nerve terminal branch. Given that the NCTs have a radius of 2.8 ± 0.2 μm at the time they have been sampled and that the length of a varicosity is about 1 μm (Cottee et al. 1996), the current studies do not allow us to determine whether or not there is more than one active zone in each varicosity.
Intermittence of transmitter release
The intermittence of NCTs, and hence transmitter release, might be due to intermittent failure of action potential propagation in the nerve terminal. However, in preparations where both the varicose nerve terminals and the smooth muscle cells were labelled, the action potential-evoked [Ca2+]v transient occurred in response to every stimulus, confirming that intermittence of release is not due to failure of action potential propagation in the axon or secretory nerve terminals (Brock & Cunnane, 1988; Brain & Bennett, 1997; Jackson et al. 2001).
The measurement of postsynaptic [Ca2+] as a tool to determine release probability has recently been used in the dendritic spines of hippocampal neurons (Emptage et al. 1999; Kovalchuk et al. 2000). To our knowledge there have been no previous studies of simultaneous presynaptic (or prejunctional) and postsynaptic (or postjunctional) [Ca2+] with the resolution to detect transmitter release from sequential strings of individual varicosities or boutons on the same nerve terminal branch.
The probability of transmitter release reported in the present study (0.001-0.1; median 0.01; mean 0.019 ± 0.002) is consistent with early estimates from transmitter overflow studies of 0.01-0.03 (Folkow et al. 1967), and very similar to probabilities determined from ‘discrete events’ (0.002-0.03; Cunnane & Stjärne, 1984). These release probabilities are, however, considerably lower than those determined from measurement of focal extracellular currents (mean of 0.25; Lavidis & Bennett, 1992). Transmitter release from a single varicosity has been recorded on one occasion from one site, when excitatory junctional currents were recorded with an electrode of very small tip size and the nerve terminal varicosities were labelled with 3-3-diethyloxardicarbocyanine iodide (Lavidis & Bennett, 1992). Their experiment yielded a probability of transmitter release of 0.12 for this varicosity, in a bath Ca2+ concentration of 4 mm and Mg2+ concentration of 1.2 mm. However, under most recording conditions focal extracellular electrodes do not have sufficient spatial resolution to distinguish transmitter release from nearby nerve terminal varicosities in this preparation.
One reasonable concern is that the presence of a Ca2+ indicator in the nerve terminal could affect the probability of release. One can test this hypothesis by comparing the PNCT of varicosities that contained the indicator with those that did not. In the present experiments there was no significant difference in PNCT from neuroeffector junctions where the indicator was present in the varicosity, compared with those where it was not (i.e. where the varicosity could not be seen). This suggests that the concentration of the Ca2+ indicator in labelled nerve terminals was insufficient to modify transmitter release. However, there can be no doubt that a high intraterminal concentration of fast Ca2+ buffers can decrease the probability of exocytosis from sympathetic nerve terminals, at least in the guinea-pig vas deferens (Hardy & Brock, 2001).
Some varicosities failed to generate adjacent NCTs, even though they responded to nerve terminal action potentials with a rise in [Ca2+]v, and were on a nerve terminal branch where other varicosities elicited NCTs. These failures may reflect an extremely low (or zero) release probability from these varicosities, or it may be that the regions of the smooth muscle cells adjacent to these varicosities were insensitive to ATP. The latter hypothesis is possible as P2X receptors may not be uniformly distributed over the surface of smooth muscle cells. In the mouse vas deferens it has been reported that P2X receptors cluster adjacent to nerve terminals (Barden et al. 1999), while in the rat vas deferens, dopamine β-hydroxylase-labelled structures are sometimes juxtaposed to P2X receptor clusters (Vulchanova et al. 1996). Other authors have found no significant clustering of receptors under nerve terminal varicosities in the mouse vas deferens (Liang et al. 2001). The present work cannot determine whether P2X receptor clusters occur in mouse vas deferens. If receptor clusters exist, then the size of NCTs implies that, under most circumstances, only one P2X receptor cluster on a given smooth muscle cell is activated following transmitter release. If there are no receptor clusters, then the size of NCTs suggests that only those P2X receptors within a few micrometres of the release site are activated following transmitter release.
It is possible that some varicosities released ATP, but there were no nearby P2X receptors and hence no NCT was generated. This requirement for functional P2X receptors is also shared by other experimental methods that measure transmitter release, including intracellular and focal extracellular recording. Hence these experimental approaches do not measure transmitter release per se, but rather transmitter release from sites that are functionally coupled to smooth muscle cells.
The probability of occurrence of NCTs varies along the length of a nerve terminal (Fig. 1E), as does the probability of occurrence of excitatory junctional currents (Lavidis & Bennett, 1992, 1993). The amplitude of [Ca2+]v transients in response to single action potentials has been reported to vary significantly among varicosities on the same branch (while [Ca2+]v transients from a given varicosity are more consistent), and it has been hypothesised that those varicosities with a high amplitude [Ca2+]v transient might have a high release probability (Brain & Bennett, 1997). This hypothesis is also supported by the supralinear relationship between extracellular [Ca2+] and release probability in the mouse vas deferens (Macleod et al. 1994). In the present work, there was no correlation between the amplitude of the [Ca2+]v transient following the first stimulus in a train and the subsequent probability of NCTs in the adjacent smooth muscle cell. Thus the amplitude of the first [Ca2+]v transient in a train is not a reliable determinant of what the probability of transmitter release from a given varicosity will be.
It is interesting to note that only 20 % of cells had neuroeffector junctions in which some NCTs were able to initiate a local twitch. This finding suggests that the release of transmitter from a single varicosity does not inevitably trigger contraction of the cell it innervates, despite the local [Ca2+]sm transient. The whole organ twitch following single impulses or short trains of impulses is augmented by the flux of Ca2+ through L-type Ca2+ channels as nifedipine reduces, but does not abolish, this component of contraction in the mouse vas deferens (Rae & Calixto, 1989).
Spontaneous transmitter release
Sympathetic varicosities release transmitter in the absence of stimulation, detected by the measurement of spontaneous excitatory junction potentials (SEJPs; Burnstock & Holman, 1961). In the present inquiry, the frequency of discrete [Ca2+]sm elevations that were not preceded by a stimulus (sNCTs) was very low (about one every 12 min). It was also found that the frequency of sNCTs was weakly correlated with the probability of evoked transmitter release from the same site. This may reflect the presence of some varicosities with either a large number of vesicles or a greater proportion of vesicles available for both evoked and spontaneous transmitter release.
The origin of slow, spontaneous [Ca2+]v transients (Brain & Bennett, 1997) has not been determined. Similar [Ca2+]v transients were also noted in the present study. These [Ca2+]v transients were occasionally associated with sNCTs in the adjacent smooth muscle cell, which implies that spontaneous transmitter release is sometimes associated with spontaneous [Ca2+]v transients. It is unlikely that these spontaneous transients cause an increase in the whole varicosity [Ca2+] that is sufficient to directly trigger exocytosis, as their mean amplitude has been estimated at 120 nm (Brain & Bennett, 1997). It is quite possible that there are associated focal increases in [Ca2+] that trigger exocytosis, but these cannot be spatially resolved with light microscopy or detected with a high-affinity Ca2+ indicator. Alternatively, it is possible that a prolonged elevation in [Ca2+]v increases the probability of spontaneous exocytosis by a mechanism similar to that proposed for the residual Ca2+ hypothesis for short-term facilitation (Zucker, 1989, 1999).
A single packet of ATP acts on more than one smooth muscle cell
NCT detection was strongly correlated between some pairs of adjacent smooth muscle cells. The most likely explanation is that a packet of ATP released from one varicosity can act upon receptors on adjacent cells. It is unlikely that Ca2+ rapidly diffused through local gap junctions, as the amplitudes of synchronous NCTs in such adjacent cells were similar. The synchronicity of such NCT doublets implies that even though smooth muscle cells may possess postjunctional specialisations for purinergic transmission (Vulchanova et al. 1996; Barden et al. 1999), more than one such specialisation may be associated with each putative prejunctional specialisation. Hence a ‘neuromuscular junction’ in the vas deferens can involve more than one smooth muscle cell.
Facilitation depends on the basal release probability
During short trains of nerve terminal action potentials, the probability of transmitter release increases (Burnstock et al. 1964; Bennett & Florin, 1975) until a steady state is reached. Whether this facilitation of transmitter release is due to an increase in the release probability from all varicosities, or whether there is preferential recruitment of low probability (or silent) varicosities, was unknown. In the present study, junctions with a low probability of release (< 0.02) exhibited more facilitation than those with a higher (> 0.02) probability. Hence low probability release sites facilitate more than high probability release sites, even though the probability of release remains much less than one, and indeed less than 0.1. In future studies, it will be of great interest to investigate facilitation of transmitter release at higher frequencies of nerve stimulation.
Noradrenaline and autoinhibition
It is perhaps surprising that NCTs are solely generated by the release of ATP, and that at present we cannot detect any local [Ca2+]sm transient attributable to NA. NA and ATP are generally thought to be co-released as they are found in the same vesicles (Fried, 1980) and the overflow of these transmitters from autonomically innervated tissues following nerve stimulation is similar (Westfall et al. 1978; but see Stjärne, 2001).
One of the effects of locally released NA is the inhibition of subsequent transmitter release by action at prejunctional α2-adrenoceptors (Illes & Starke, 1983). In the present study, it was found that the α2-adrenoceptor antagonist yohimbine increased the probability of occurrence of NCTs during trains of stimuli at 1 Hz. This finding implies that NA was released from, or close to, the nerve terminal varicosities that generate purinergic NCTs. The similar increase in release probabilities among all release sites suggests that all secretory varicosities are exposed to a similar pool of NA and are equipped with functional α2-mediated inhibitory mechanisms.
Smooth muscle [Ca2+] transients during noradrenergic transmission in intact tissues have been previously reported in the rat tail artery (Iino et al. 1994), while there are many reports of smooth muscle Ca2+ transients in response to exogenously applied adrenoceptor agonists (for example, see Mauban et al. 2001) in preparations including the guinea-pig vas deferens (Kato et al. 2000). In the rat tail artery, noradrenergic transmission evoked by field stimulation elicits waves and oscillation of the [Ca2+]sm within the smooth muscle cell (Iino et al. 1994). No such Ca2+ transients were observed in the present study, at stimulus frequencies of 5 Hz and below, even in the presence of desmethylimipramine, which blocks the catecholamine transporter uptake-1. It may be that the subset of cells loaded with the Ca2+ indicator are amongst a minority of cells which fail to respond to NA, that the stimulus was subthreshold for the generation of Ca2+ waves, or that the mouse vas deferens differs from other smooth muscle cells in the mechanisms by which NA causes contraction.
The most commonly used explanation for excitation- contraction coupling in smooth muscle cells is an increase in intracellular [Ca2+]sm through either L-type Ca2+ channels or the release of Ca2+ from intracellular stores (Berridge, 1993). However, there is apparently little contribution to NA-induced contraction from intracellular stores in the vas deferens, at least in the rat, as perturbing intracellular Ca2+ stores with ryanodine, cyclopiazonic acid or thapsigargin had little effect on NA-induced contraction (Amobi et al. 1999). Smooth muscle contraction that is independent of an increase in [Ca2+]sm has previously been reported and appears to involve an increase in the sensitivity of the contractile apparatus to Ca2+ (Collins et al. 1992; Morgan et al. 1992), which may involved a Rho-kinase-mediated pathway (Somlyo & Somlyo, 2000).
Smooth muscle action potentials
In some cells, evoked, low amplitude, whole-cell increases in [Ca2+]sm were intermittently detected. These were abolished by either nifedipine (1 μM) or α,β-methylene ATP (1 μM), suggesting that such transients arise when purinergic neurotransmission triggers a smooth muscle action potential. While most smooth muscle cells display Ca2+ action potentials (see Kuriyama et al. 1982; Hirst et al. 1986; Mostwin, 1986; Lang et al. 1998), smooth muscle action potentials in the mouse vas deferens are mediated by fast voltage-gated Na+ channels (Holman et al. 1977, 1995). It is likely that the whole-cell increases in [Ca2+]sm reported in the present study are generated when the smooth muscle cell is depolarised by the Na+ action potentials. The depolarisation triggers an influx of Ca2+ through L-type Ca2+ channels, causing an increase in [Ca2+]sm. It is not possible to confirm that the whole-cell [Ca2+]sm transients arise following Na+ action potentials by blocking voltage-gated Na+ channels, as this intervention abolishes the nerve terminal action potential and hence transmitter release.
If the smooth muscle cells of the mouse vas deferens are electrically coupled, one would expect to find nearby pairs of smooth muscle cells with synchronous smooth muscle action potentials. As no such pairs of smooth muscle cells were found, it may be that smooth muscle cells that fire action potentials are electrically isolated from surrounding cells, as has previously been suggested for the mouse vas deferens (Blakeley et al. 1989). As only a small proportion of smooth muscle cells were labelled in any one preparation, we cannot rule out the existence of weak electrical coupling.
Conclusions
The approach described here provides a high-resolution method to study simultaneously, on an impulse-to-impulse basis, intravaricosity [Ca2+] and the intermittent release of ATP from individual varicosities on the same nerve terminal branch. By counting the action potential-evoked, packeted release of ATP, this approach now allows the physiology and pharmacology of autonomic transmission to be explored with a degree of resolution previously unobtainable. The detection of local smooth muscle [Ca2+] transients following purinergic transmission suggests that Ca2+ flux thought P2X receptors may contribute to the purinergic ‘twitch’ component of contraction in smooth muscle.
Acknowledgments
K.L.B. is supported by an Oxford Nuffield Medical Fellowship; S.J.T. is supported by The Wellcome Trust.
Supplementary material
The online version of this paper can be found at:
http://www.jphysiol.org/cgi/content/full/541/3/849/DC1
and contains supplementary material entitled:
Neuroeffector Ca2+ transients
The left panel shows consecutive confocal images of part of a smooth muscle cell within an intact mouse vas deferens during field stimulation. The sampling frequency was 4 Hz; the stimulus (#) frequency was 2 Hz. The right panel shows a cumulative map of the focal [Ca2+]sm transients, here termed Neuroeffector Ca2+ Transients (NCTs). Moving the plane of focus by 3 μm revealed an overlying varicose nerve terminal. Each nerve terminal varicosity aligns well with a cluster of NCTs, the locations of occurrence of which are marked with dots.
REFERENCES
- Allcorn RJ, Cunnane TC, Kirkpatrick K. Actions of α,β-methylene ATP and 6-hydroxydopamine on sympathetic neurotransmission in the vas deferens of the guinea-pig, rat and mouse: support for cotransmission. British Journal of Pharmacology. 1986;89:647–659. doi: 10.1111/j.1476-5381.1986.tb11169.x. [DOI] [PMC free article] [PubMed] [Google Scholar]
- Amobi NI, Sugden D, Smith IC. Pharmacomechanical coupling in rat vas deferens: effects of agents that modulate intracellular release of calcium and protein kinase C activation. Life Sciences. 1999;65:145–156. doi: 10.1016/s0024-3205(99)00231-3. [DOI] [PubMed] [Google Scholar]
- Barden JA, Cottee LJ, Bennett MR. Vesicle-associated proteins and P2X receptor clusters at single sympathetic varicosities in mouse vas deferens. Journal of Neurocytology. 1999;28:469–480. doi: 10.1023/a:1007053004771. [DOI] [PubMed] [Google Scholar]
- Beattie DT, Cunnane TC, Muir TC. Effects of calcium channel antagonists on action potential conduction and transmitter release in the guinea-pig vas deferens. British Journal of Pharmacology. 1986;89:235–244. doi: 10.1111/j.1476-5381.1986.tb11140.x. [DOI] [PMC free article] [PubMed] [Google Scholar]
- Benham CD, Tsien RW. A novel receptor-operated Ca2+-permeable channel activated by ATP in smooth muscle. Nature. 1987;328:275–278. doi: 10.1038/328275a0. [DOI] [PubMed] [Google Scholar]
- Bennett MR, Florin T. An electrophysiological analysis of the effect of Ca ions on neuromuscular transmission in the mouse vas deferens. British Journal of Pharmacology. 1975;55:97–104. doi: 10.1111/j.1476-5381.1975.tb07616.x. [DOI] [PMC free article] [PubMed] [Google Scholar]
- Berridge MJ. Inositol trisphosphate and calcium signalling. Nature. 1993;361:315–325. doi: 10.1038/361315a0. [DOI] [PubMed] [Google Scholar]
- Blakeley AG, Dunn PM, Petersen SA. Properties of excitatory junction potentials and currents in smooth muscle cells of the mouse vas deferens. Journal of the Autonomic Nervous System. 1989;27:47–56. doi: 10.1016/0165-1838(89)90128-8. [DOI] [PubMed] [Google Scholar]
- Brain KL, Bennett MR. Calcium in sympathetic varicosities of mouse vas deferens during facilitation, augmentation and autoinhibition. Journal of Physiology. 1997;502:521–536. doi: 10.1111/j.1469-7793.1997.521bj.x. [DOI] [PMC free article] [PubMed] [Google Scholar]
- Brain KL, Trout SJ, Jackson VM, Dass N, Cunnane TC. Nicotine induces calcium spikes in single nerve terminal varicosities: A role for intracellular calcium stores. Neuroscience. 2001;106:395–403. doi: 10.1016/s0306-4522(01)00280-9. [DOI] [PubMed] [Google Scholar]
- Brock JA, Cunnane TC. Relationship between the nerve action potential and transmitter release from sympathetic postganglionic nerve terminals. Nature. 1987;326:605–607. doi: 10.1038/326605a0. [DOI] [PubMed] [Google Scholar]
- Brock JA, Cunnane TC. Electrical activity at the sympathetic neuroeffector junction in the guinea-pig vas deferens. Journal of Physiology. 1988;399:607–632. doi: 10.1113/jphysiol.1988.sp017099. [DOI] [PMC free article] [PubMed] [Google Scholar]
- Brown GL, Gillespie JS. The output of sympathetic transmitter from the spleen of the cat. Journal of Physiology. 1957;138:81–102. doi: 10.1113/jphysiol.1957.sp005839. [DOI] [PMC free article] [PubMed] [Google Scholar]
- Burnstock G. Do some nerve cells release more than one neurotransmitter? Neuroscience. 1976;1:239–248. doi: 10.1016/0306-4522(76)90054-3. [DOI] [PubMed] [Google Scholar]
- Burnstock G, Holman ME, Kuriyama H. Facilitation of transmission from autonomic nerves to smooth muscle of guinea-pig vas deferens. Journal of Physiology. 1964;172:31–49. doi: 10.1113/jphysiol.1964.sp007401. [DOI] [PMC free article] [PubMed] [Google Scholar]
- Collins EM, Walsh MP, Morgan KG. Contraction of single vascular smooth muscle cells by phenylephrine at constant Ca2+i. American Journal of Physiology. 1992;262:H754–762. doi: 10.1152/ajpheart.1992.262.3.H754. [DOI] [PubMed] [Google Scholar]
- Cottee LJ, Lavidis NA, Bennett MR. Spatial relationships between sympathetic varicosities and smooth muscle cells in the longitudinal layer of the mouse vas deferens. Journal of Neurocytology. 1996;25:413–425. doi: 10.1007/BF02284812. [DOI] [PubMed] [Google Scholar]
- Cunnane TC, Stjärne L. Transmitter secretion from individual varicosities of guinea-pig and mouse vas deferens: highly intermittent and monoquantal. Neuroscience. 1984;13:1–20. doi: 10.1016/0306-4522(84)90255-0. [DOI] [PubMed] [Google Scholar]
- Emptage N, Bliss TVP, Fine A. Single synaptic events evoke NMDA receptor-mediated release of calcium from internal stores in hippocampal dendritic spines. Neuron. 1999;22:115–124. doi: 10.1016/s0896-6273(00)80683-2. [DOI] [PubMed] [Google Scholar]
- Ennion SJ, Evans RJ. Agonist-stimulated internalisation of the ligand-gated ion channel P2X(1) in rat vas deferens. FEBS Letters. 2001;489:154–158. doi: 10.1016/s0014-5793(01)02102-0. [DOI] [PubMed] [Google Scholar]
- Folkow B, Häggendal J, Lisander B. Extent of release and elimination of noradrenaline at peripheral adrenergic nerve terminals. Acta Physiologica Scandinavica. 1967;suppl. 307:1–38. [PubMed] [Google Scholar]
- Fried G. Small noradrenergic storage vesicles isolated from rat vas deferens - biochemical and morphological characterization. Acta Physiologica Scandinavica. 1980;suppl. 493:1–28. [PubMed] [Google Scholar]
- Hardy TA, Brock JA. Effects of modulating Ca2+ entry and activating prejunctional receptors on facilitation of excitatory junction potentials in the guinea-pig vas deferens in vitro. Naunyn-Schmiedeburg's Archives of Pharmacology. 2001;363:515–525. doi: 10.1007/s002100000394. [DOI] [PubMed] [Google Scholar]
- Hashimoto T, Hirata M, Itoh T, Kanmura Y, Kuriyama H. Inositol 1, 4, 5-trisphosphate activates pharmacomechanical coupling in smooth muscle of the rabbit mesenteric artery. Journal of Physiology. 1986;370:605–618. doi: 10.1113/jphysiol.1986.sp015953. [DOI] [PMC free article] [PubMed] [Google Scholar]
- Hashitani H, Bramich NJ, Hirst GD. Mechanisms of excitatory neuromuscular transmission in the guinea-pig urinary bladder. Journal of Physiology. 2000;524:565–579. doi: 10.1111/j.1469-7793.2000.t01-2-00565.x. [DOI] [PMC free article] [PubMed] [Google Scholar]
- Hirst GD, Silverberg GD, Van Helden DF. The action potential and underlying ionic currents in proximal rat middle cerebral arterioles. Journal of Physiology. 1986;371:289–304. doi: 10.1113/jphysiol.1986.sp015975. [DOI] [PMC free article] [PubMed] [Google Scholar]
- Holman ME, Taylor GS, Tomita T. Some properties of the smooth muscle of mouse vas deferens. Journal of Physiology. 1977;266:751–764. doi: 10.1113/jphysiol.1977.sp011791. [DOI] [PMC free article] [PubMed] [Google Scholar]
- Holman ME, Tonta MA, Parkington HC, Coleman HA. Tetrodotoxin-sensitive action potentials in smooth muscle of mouse vas deferens. Journal of the Autonomic Nervous System. 1995;52:237–240. doi: 10.1016/0165-1838(94)00157-f. [DOI] [PubMed] [Google Scholar]
- Iino M, Kasai H, Yamazawa T. Visualization of neural control of intracellular Ca2+ concentration in single vascular smooth muscle cells in situ. EMBO Journal. 1994;13:5026–5031. doi: 10.1002/j.1460-2075.1994.tb06831.x. [DOI] [PMC free article] [PubMed] [Google Scholar]
- Illes P, Starke K. An electrophysiological study of presynaptic α-adrenoceptors in the vas deferens of the mouse. British Journal of Pharmacology. 1983;78:365–373. doi: 10.1111/j.1476-5381.1983.tb09402.x. [DOI] [PMC free article] [PubMed] [Google Scholar]
- Jackson VM, Trout SJ, Brain KL, Cunnane TC. Characterization of action potential-evoked calcium transients in mouse postganglionic sympathetic axon bundles. Journal of Physiology. 2001;537:3–16. doi: 10.1111/j.1469-7793.2001.0003k.x. [DOI] [PMC free article] [PubMed] [Google Scholar]
- Kato K, Furuya K, Tsutsui I, Ozaki T, Yamagishi S. Cyclic AMP-mediated inhibition of noradrenaline-induced contraction and Ca2+ influx in guinea-pig vas deferens. Experimental Physiology. 2000;85:387–398. [PubMed] [Google Scholar]
- Knöckner U. Voltage-dependent L-type calcium channels in smooth muscle cells. In: Bolton TB, Tomita T, editors. Smooth Muscle Excitation. London: Academic Press; 1996. pp. 1–12. [Google Scholar]
- Kovalchuk Y, Eilers J, Lisman J, Konnerth A. NMDA receptor-mediated subthreshold Ca2+ signals in spines of hippocampal neurons. Journal of Neuroscience. 2000;20:1791–1799. doi: 10.1523/JNEUROSCI.20-05-01791.2000. [DOI] [PMC free article] [PubMed] [Google Scholar]
- Kuriyama H, Ito Y, Suzuki H, Kitamura K, Itoh T. Factors modifying contraction-relaxation cycle in vascular smooth muscles. American Journal of Physiology. 1982;243:H641–662. doi: 10.1152/ajpheart.1982.243.5.H641. [DOI] [PubMed] [Google Scholar]
- Lang RJ, Exintaris B, Teele ME, Harvey J, Klemm MF. Electrical basis of peristalsis in the mammalian upper urinary tract. Clinical and Experimental Pharmacology and Physiology. 1998;25:310–321. doi: 10.1111/j.1440-1681.1998.tb02357.x. [DOI] [PubMed] [Google Scholar]
- Lavidis NA, Bennett MR. Probabilistic secretion of quanta from visualized sympathetic nerve varicosities in mouse vas deferens. Journal of Physiology. 1992;454:9–26. doi: 10.1113/jphysiol.1992.sp019252. [DOI] [PMC free article] [PubMed] [Google Scholar]
- Lavidis NA, Bennett MR. Probabilistic secretion of quanta from successive sets of visualized varicosities along single sympathetic nerve terminals. Journal of the Autonomic Nervous System. 1993;43:41–50. doi: 10.1016/0165-1838(93)90320-t. [DOI] [PubMed] [Google Scholar]
- Liang SX, Motin L, Moussa CEH, Lavidis NA, Phillips WD. Spatial distribution and developmental appearance of postjunctional P2X(1) receptors on smooth muscle cells of the mouse vas deferens. Synapse. 2001;42:1–11. doi: 10.1002/syn.1094. [DOI] [PubMed] [Google Scholar]
- Loewi O. Quantitative und qualitative untersuchungen uber den sympathicusstoff. Pflügers Archiv. 1936;237:504–514. [Google Scholar]
- Macleod GT, Lavidis NA, Bennett MR. Calcium dependence of quantal secretion from visualized sympathetic nerve varicosities on the mouse vas deferens. Journal of Physiology. 1994;480:61–70. doi: 10.1113/jphysiol.1994.sp020340. [DOI] [PMC free article] [PubMed] [Google Scholar]
- Mauban JR, Lamont C, Balke CW, Wier WG. Adrenergic stimulation of rat resistance arteries affects Ca2+ sparks, Ca2+ waves, and Ca2+ oscillations. American Journal of Physiology - Heart and Circulatory Physiology. 2001;280:H2399–2405. doi: 10.1152/ajpheart.2001.280.5.H2399. [DOI] [PubMed] [Google Scholar]
- Mermet C, Gonon FG, Stjärne L. On-line electrochemical monitoring of the local noradrenaline release evoked by electrical stimulation of the sympathetic nerves in isolated rat tail artery. Acta Physiologica Scandinavica. 1990;140:323–329. doi: 10.1111/j.1748-1716.1990.tb09006.x. [DOI] [PubMed] [Google Scholar]
- Mironneau J, Coussin F, Morel JL, Barbot C, Jeyakumar LH, Fleischer S, Mironneau C. Calcium signalling through nucleotide receptor P2X1 in rat portal vein myocytes. Journal of Physiology. 2001;536:339–350. doi: 10.1111/j.1469-7793.2001.0339c.xd. [DOI] [PMC free article] [PubMed] [Google Scholar]
- Morgan KG, Khalil RA, Suematsu E, Katsuyama H. Calcium-dependent and calcium-independent pathways of signal transduction in smooth muscle. Japanese Journal of Pharmacology. 1992;58:247–253P. [PubMed] [Google Scholar]
- Morris JL, Gibbins IL. Co-transmission and neuromodulation. In: Burnstock G, Hoyle CHV, editors. Autonomic Neuroeffector Mechanisms. Switzerland: Harwood Academic; 1992. pp. 33–119. [Google Scholar]
- Mostwin JL. The action potential of guinea-pig bladder smooth muscle. Journal of Urology. 1986;135:1299–1303. doi: 10.1016/s0022-5347(17)46079-4. [DOI] [PubMed] [Google Scholar]
- Mulryan K, Gitterman DP, Lewis CJ, Vial C, Leckie BJ, Cobb AL, Brown JE, Conley EC, Buell G, Pritchard CA, Evans RJ. Reduced vas deferens contraction and male infertility in mice lacking P2X1 receptors. Nature. 2000;403:86–89. doi: 10.1038/47495. [DOI] [PubMed] [Google Scholar]
- Peart WS. The nature of splenic sympathin. Journal of Physiology. 1949;108:491–501. doi: 10.1113/jphysiol.1949.sp004352. [DOI] [PMC free article] [PubMed] [Google Scholar]
- Rae GA, Calixto JB. Interactions of calcium antagonists and the calcium channel agonist Bay K 8644 on neurotransmission of the mouse isolated vas deferens. British Journal of Pharmacology. 1989;96:333–340. doi: 10.1111/j.1476-5381.1989.tb11822.x. [DOI] [PMC free article] [PubMed] [Google Scholar]
- Somlyo AP, Somlyo AV. Signal transduction by G-proteins, Rho-kinase and protein phosphatase to smooth muscle and non-muscle myosin II. Journal of Physiology. 2000;522:177–185. doi: 10.1111/j.1469-7793.2000.t01-2-00177.x. [DOI] [PMC free article] [PubMed] [Google Scholar]
- Stjärne L. Basic mechanisms and local modulation of nerve impulse-induced secretion of neurotransmitters from individual sympathetic nerve varicosities. Reviews of Physiology, Biochemistry and Pharmacology. 1989;137:1121–1137. doi: 10.1007/BFb0027496. [DOI] [PubMed] [Google Scholar]
- Stjärne L. Novel dual ‘small’ vesicle model of ATP- and noradrenaline-mediated sympathetic neuromuscular transmission. Autonomic Neuroscience: Basic and Clinical. 2001;87:16–36. doi: 10.1016/S1566-0702(00)00246-0. [DOI] [PubMed] [Google Scholar]
- Stjärne L, Stjärne E, Msghina M, Bao JX. K+ and Ca2+ channel blockers may enhance or depress sympathetic transmitter release via a Ca2+-dependent mechanism ‘upstream’ of the release site. Neuroscience. 1991;44:673–692. doi: 10.1016/0306-4522(91)90087-5. [DOI] [PubMed] [Google Scholar]
- Vulchanova L, Arvidsson U, Riedl M, Wang J, Buell G, Surprenant A, North RA, Elde R. Differential distribution of two ATP-gated channels (P2X receptors) determined by immunocytochemistry. Proceedings of the National Academy of Sciences of the USA. 1996;93:8063–8067. doi: 10.1073/pnas.93.15.8063. [DOI] [PMC free article] [PubMed] [Google Scholar]
- Westfall DP, Stitzel RE, Rowe JN. The postjunctional effects and neural release of purine compounds in the guinea-pig vas deferens. European Journal of Pharmacology. 1978;50:27–38. doi: 10.1016/0014-2999(78)90250-9. [DOI] [PubMed] [Google Scholar]
- Zucker RS. Short-term synaptic plasticity. Annual Review of Neuroscience. 1989;12:13–31. doi: 10.1146/annurev.ne.12.030189.000305. [DOI] [PubMed] [Google Scholar]
- Zucker RS. Calcium- and activity-dependent synaptic plasticity. Current Opinion in Neurobiology. 1999;9:305–313. doi: 10.1016/s0959-4388(99)80045-2. [DOI] [PubMed] [Google Scholar]
Associated Data
This section collects any data citations, data availability statements, or supplementary materials included in this article.