

Abstract
Different changes in glomerular filtration rates (GFR) in deep and superficial glomeruli have been suggested to influence renal NaCl excretion and concentrating ability. Angiotensin II (AngII) has been implicated in such changes, but the experimental evidence has been conflicting, probably because of the methodological limitation of just one ‘snapshot’ measurement of local GFR per kidney. We have therefore studied the effect of AngII and AT1-receptor blockade on glomerular filtration in outer, middle and inner cortex (OC, MC and IC, respectively) in pentobarbitone-anaesthetised rats using the aprotinin (Ap) method, providing control and experimental measurements in the same kidney. Glomerular filtration rate per gram cortical tissue was measured based on ‘free’ glomerular filtration of Ap followed by complete tubular uptake and a 20 min sojourn in the proximal tubular cells before breakdown and incipient return to the plasma.125I-labelled Ap was injected i.v. to determine control Ap clearance, followed after 13 min by injection of AngII or the A1 type AngII receptor blocker losartan and 2 min thereafter by 131I-labelled Ap to determine clearance in the experimental period. Tracer activity in frequent blood samples and in tissue samples allowed calculation of GFR in the two periods. Mean GFR control values were: 1.13 ml min−1 in whole kidney and 1.44, 1.27 and 0.76 ml min−1 per gram cortical tissue in OC, MC and IC, respectively. The most sensitive and comprehensive measure of altered GFR distribution is the ratio between the relative filtration change in inner versus that in outer cortex, F = (ICE/ICC)/(OCE/OCC), where subscripts E and C stand for experimental and control, respectively. F values greater than 1.00 directly indicate and quantify a relatively greater increase of filtration rate in inner than in outer cortex. We found in salt-replete rats that at practically unchanged total GFR, intravenous and intra-arterial infusion of AngII increased F to 1.07 and 1.04 (P < 0.05) whereas losartan reduced F to 0.99. After pretreatment with the inhibitor of nitric oxide production L-NAME, losartan increased total GFR by 8 % and F fell to 0.95 (P < 0.05). In salt-depleted rats losartan reduced F to 0.95 (P < 0.05) at unchanged total GFR. All IC/OC changes induced by losartan were significantly different from that obtained by AngII infusions. We conclude that deep nephrons have higher postglomerular AngII tone and also higher AngII sensitivity than superficial nephrons. The better preserved GFR in deep cortex during AngII action may contribute towards maintaining the renal concentrating ability by providing NaCl for reabsorption by the ascending limb of the loop of Henle.
Exogenous angiotensin II (AngII) has a marked vasoconstrictor effect on most vascular beds, including the kidney. More important, a constant intrarenal formation of AngII, regulated mainly through renin release by the juxtaglomerular apparatus, provides a sustained contribution to vascular tone and resistance. A large number of studies have shown that AngII infusion causes relatively greater reduction of renal blood flow (RBF) than of glomerular filtration rate (GFR) and an increase in the filtration fraction, suggesting a preferential vasoconstriction in postglomerular resistance vessels (Navar et al. 1996). More conflicting results have been obtained on a possible preferential reduction of RBF in deep or superficial cortical layers, possibly due to a variable counter-regulation by prostaglandins or nitric oxide (NO) formation (Aiken & Vane, 1973; Aukland, 1976; Mattson & Roman, 1991; Hura & Stein, 1992; Pallone, 1994; Navar et al. 1996).
In the 1970s many GFR distribution studies were performed using the Hanssen ferrocyanide technique (Hanssen, 1963) to test the hypothesis that renal sodium chloride excretion could be determined by the relative filtration rate in deep and superficial cortex. As summarized by Lameire et al. (1977) the results obtained in rats on varying salt intake were conflicting. One obvious reason for the discrepancies is the limitation of the ferrocyanide technique, permitting only one 5-10 s measurement of snGFR (single nephron GFR) in many nephrons, but not allowing repeated measurements in the same kidney. This drawback has recently been overcome by the development of the aprotinin method, by which two subsequent measurements of local GFR per gram tissue of several minutes duration can be made by estimating the local tubular uptake of 125I- and 131I-labelled aprotinin (Ap) injected, respectively, in a control state and in a subsequent experimental situation (Tenstad et al. 1994a, b). Thus, acute changes in vascular AngII sensitivity and endogenous AngII tone in deep and superficial nephrons should be detectable by infusing AngII and an AT1-receptor blocker, respectively. Of special interest is the GFR in the deep cortex containing the juxtamedullary glomeruli, which provide the whole blood flow to the medullary vasa recta and a major proportion of the tubular fluid to the long loops of Henle in the inner medulla (Kriz et al. 1972).
METHODS
Experiments were performed in male Sprague-Dawley rats (Möllegaard, Copenhagen, Denmark), 350-400 g body weight (BW), with free access to food and water. One group of rats was fed a low salt diet (C1036, B & K International, Nittedal, Norway), which contained less than 0.5 g (kg dry weight)−1, for 2 weeks, while the standard diet (BK-RM2) fed to the remaining groups contained 2-4 g kg−1. All procedures were performed in accordance with the guidelines of and approved by the Norwegian State Board for Biological Experiments with Living Animals. Anaesthesia was induced with intraperitoneal sodium pentobarbitone (50 mg kg−1). Maintenance doses of 5-10 mg kg−1 were given intravenously when arousal was indicated by irregularities in the respiration or arterial blood pressure traces. At the end of the experiment, whilst still under deep anaesthesia, the rats were killed by i.v. injection of 0.5 ml saturated KCl solution.
Catheters were inserted in the right femoral artery for recording of mean arterial blood pressure (PA) with a pressure transducer (SensoNor, Horten, Norway), in the right femoral vein for infusions, and in the right carotid artery for blood sampling. The left kidney was exposed through an abdominal incision, and the renal artery was dissected free and supplied with a 1 mm Transonic flow probe connected to a Transonic T206 flowmeter (Transonic Systems, Ithaca, NY, USA). Renal blood flow and arterial pressure were recorded continuously with a Gould recorder (8000 Series). In one group of rats a PE 50 catheter with a tapered tip was introduced 1-2 mm into the left renal artery via the right femoral artery and aorta.
To maintain plasma volume during surgery, 0.2-0.5 ml of 5 % bovine serum albumin (BSA) in 0.9 % saline was injected i.v. 2-4 times per hour in order to maintain plasma volume and protein concentration. After finishing the surgery at least 30 min were allowed for equilibration, and no infusions were given in the last 15 min. Rectal temperature was kept at 37 ± 1 °C by placing the rat under a heating lamp.
Aprotinin (Ap) was obtained from Sigma (Catalogue No. A4529, MW 6513). Labelling with 125I and 131I by the Iodo-Gen technique was initially performed in the Norwegian Institute for Energy Technology (Kjeller, Norway) and later performed in our own laboratory. A Biogel-P10 column (Bio-Rad, CA, USA) was used to determine the amount of free iodine in the stock solutions. The free fraction was kept below 2 % of total activity by weekly dialysis. The same column was used to estimate plasma content of protein bound I-Ap or Ap aggregates, free iodine, or other low molecular weight breakdown products of Ap in plasma.
Blood sampling
Arterial blood samples of 70-80 μl were collected in microhaematocrit tubes after withdrawal of ≈5 times the catheter dead space. The blood sample volume was replaced by injecting a similar volume of 5 % BSA in 0.9 % NaCl together with the dead space blood. The blood samples were spun in a haematocrit centrifuge, and plasma was transferred to tared counting vials, weighed, and the 125I- and 131I-activity was measured for 10 min in a Cobra 2 Autogamma gamma counter (Packard Instruments, Meriden, CT, USA), with automatic correction for spillover. Plasma protein was measured by refractometer (American Optical).
Cortical tissue samples
Ten seconds before inducing cardiac arrest 0.5 ml of a 4 % Alcian Blue (Fluka Chemie AG, Buchs, Switzerland) was injected into the aorta through the carotid artery catheter in order to stain the glomeruli. The left, or both, kidneys were ligated immediately after injection of KCl, excised, weighed, and placed in 4 % paraformaldhyde in 0.1 m sodium phosphate buffer (pH 7.4). The following day the fixed kidney was placed in mineral oil and dissected with a scalpel under low magnification. As described previously (Wang et al. 1995), two or three 2 mm thick slices were cut out perpendicular to the long axis, and therefrom five or six radial sectors were dissected. The cortex was separated from the medulla at the level of the arcuate arteries, leaving only occasional Alcian Blue-stained glomeruli in the medulla. Then each sector was divided into three zones of equal thickness, outer, middle and inner cortex (OC, MC and IC, respectively). After removal of the mineral oil by wiping, the tissue samples were immediately placed in tared counting vials and weighed. Mean (± s.d.) sample weights were 6.1 ± 0.3, 5.6 ± 0.3 and 5.8 ± 0.2 mg in OC, MC and IC, respectively. The radioactivity of the tissue samples was then measured concomitantly with plasma samples.
Measurement of total and zonal GFR
As described in previous studies, the strongly positively charged polypeptide aprotinin (Ap, MW 6500) is filtered in the glomeruli without steric hindrance. However, the aprotinin concentration in filtrate relative to plasma is lowered by about 35 % due to the Donnan potential resulting from the non-filtrable negatively charged plasma proteins (Tenstad et al. 1994b). With the Ap doses of ≈20 μg used in the present study, less than 1 % of the filtered iodinated Ap appears in the urine, while 99 % is taken up in the first half of the proximal tubules. No activity can be demonstrated in the pars recta. The activity per gram of tissue in the outer medulla is only ≈1 % of that in the cortex and is entirely accounted for by the low activity in plasma and interstitium at the time of kidney removal (Tenstad et al. 1994a, b). Twenty to thirty minutes after i.v. injection the first breakdown products of I-Ap, including free iodine, begin to be delivered back to the peritubular plasma. Thus, within this period, the total and zonal Ap clearance (ClAp) can be calculated as the amount accumulated in the kidney (QAp) divided by the time integrated plasma concentration of Ap (∫PAp), corrected for a mean plasma protein binding of 5 %:
| (1) |
GFR, assumed to be equal to 51Cr-EDTA clearance, can then be obtained by the empirical formula developed by Tenstad et al. (1994b):
| (2) |
where 0.006Pr is a correction for the Donnan distribution of the strongly positively charged Ap across the glomerular membrane induced by the negatively charged plasma proteins expressed in mg ml−1 (Pr). Thus, at a normal plasma protein concentration of 50 mg ml−1, GFR = ClAp/0.65.
Estimates of local GFR were obtained similarly from eqns (1) and (2), using the Ap content per gram cortical tissue from outer, middle and inner cortex. Each tissue sample contained 100-300 glomeruli.
As illustrated in Fig. 1, integrated plasma concentrations of Ap were obtained from a series of arterial blood samples drawn at 0.25, 1, 3, 5 and 10 min after i.v. bolus injection (4-6 s). Because Ap is rapidly distributed in the extracellular space, the plasma concentration shows an initial rapid fall, reaching 10-15 % of the initial level in the course of 10 min. This means that an experimental alteration of GFR during the following 10 min will have little influence on the total amount of Ap from the first injection (Ap I) accumulated in the kidney, whereas the alteration in GFR is fully reflected by the accumulation of a differently labelled Ap injected in the subsequent experimental period. The order of injecting 125I- and 131I-labelled Ap was varied randomly.
Figure 1. Effect of i.v. infusion of AngII in one experiment.
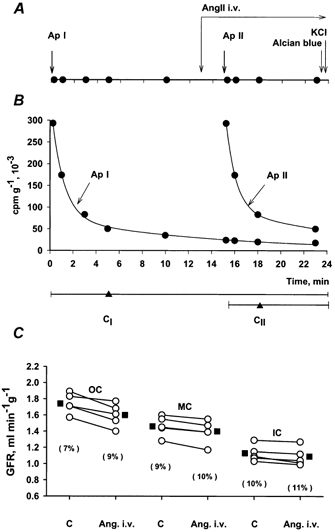
A, experimental protocol showing: bolus injections of differently labelled Ap at time 0 and at 15 min, constant i.v. infusion of AngII (14 ng min−1) from time 13 min and intra-aortic infusion of Alcian Blue 10 s before stopping the heart with i.v. KCl. Filled circles indicate arterial blood samples. Common time axis for A and B. B, arterial plasma concentration curves for Ap I and Ap II. Horizontal lines below show the two clearance periods (CI and CII) with ‘weighted midpoints’ (time for 50 % Ap uptake) indicated by triangles. C, GFR in five tissue samples from outer (OC), middle (MC), and inner cortex (IC) estimated from clearances of Ap I and Ap II, before and during i.v. AngII infusion. Average shown by filled squares. Values in parentheses indicate coefficients of variation.
It should be noted that absolute zonal GFR values reflect filtration per gram cortical tissue and not per glomerulus. As discussed elsewhere (Wang et al. 1995; Barandoust & Aukland, 1996; Treeck & Aukland, 1997), the low GFR obtained in the inner cortex reflects (1) a low glomerular density in the inner cortex, and (2) that on average the proximal tubule is located more superficially than its parent glomerulus. This spatial dissociation between filtration and tubular uptake of Ap should not influence the paired estimate of relative GFR changes in the various zones.
Renal vascular resistance
Renal vascular resistance (R) was calculated as the ratio of mean arterial pressure and renal blood flow, PA/RBF, expressed in mmHg ml−1 min. When PA and RBF are altered concomitantly by infusion of AngII or by blocking endogenous AngII, the observed change in resistance (ΔRT) may be the combined result of renal autoregulation (ΔRAu) and a direct renovascular effect of AngII (ΔRAngII):
| (3) |
The minimum fraction of total resistance change that could be attributed to an AngII response (the non-autoregulated fraction) was calculated on the assumption that autoregulation alone would have maintained unchanged RBF:
| (4) |
where the subscripts C and E refer to control and experimental values, respectively, PA is mean arterial pressure and F renal blood flow.
Experimental protocols
The effect of exogenous AngII was studied by continuous infusion of AngII intravenously (n = 8 rats) or into the left renal artery (n = 10). Three experimental series were designed to study the endogenous AngII influence on GFR by i.v. injection of losartan (10 mg (kg BW)−1), in 14 rats on normal diet with (n = 7) or without (n = 7) pretreatment with l-NAME (Sigma Chemical Co.), and in one group on low salt diet (n = 8). In addition a vehicle control series was obtained in five rats by i.v. infusion of saline only. The timing of blood samples for estimating integrated plasma aprotinin concentration shown in Fig. 1A was used in all experiments.
Statistics
The significance of changes in zonal GFR induced by AngII and losartan was evaluated in each series by the Wilcoxon paired rank test. P < 0.05 was considered significant.
RESULTS
Haemodynamic control values
As shown in Table 1 the control values were similar in the vehicle and the experimental groups, with the exception of the group pretreated with l-NAME. As measured continuously, l-NAME caused a marked rise in mean arterial pressure and a reduction in RBF. GFR was not measured before l-NAME because we needed two clearance periods for post-l-NAME and post-AngII.
Table 1.
Haemodynamic control values
| n | PA (mmHg) | RBF (ml min−1) | GFR (ml min−1) | OC (ml min−1 g−1) | MC (ml min−1 g−1) | IC (ml min−1 g−1) | |
|---|---|---|---|---|---|---|---|
| Vehicle | 5 | l26 ± 7 | 12.0 ± 0.9 | 1.07 ± 0.08 | 1.38 ± 0.07 | 1.18 ± 0.06 | 0.58 ± 0.06 |
| Exper. groups | 33 | 120 ± 2 | 10.0 ± 0.6 | 1.13 ± 0.02 | 1.44 ± 0.05 | 1.27 ± 0.04 | 0.76 ± 0.03 |
| Pre-L-NAME | 7 | 128 ± 2 | 11.3 ± 1.2 | — | — | — | — |
| Post-L-NAME | 7 | 148 ± 4 | 8.6 ± 0.8 | 1.31 ± 0.04 | 1.70 ± 0.08 | 1.44 ± 0.08 | 0.88 ± 0.06 |
n, number of rats; PA, mean arterial pressure; RBF, renal blood flow; GFR, glomerular filtration rate; OC, outer cortex; MC, middle cortex; IC, inner cortex. Values represent means ± S.E.M.
Acute effects of AngII
Intravenous AngII infusion
Angiotensin II was infused continuously at a rate of 13.5 ng min−1, starting 2 min before giving the second Ap injection. PA increased on average from 118 ± 3 to 142 ± 5 mmHg whereas total RBF fell by 22 %. This indicates an increase in renal vascular resistance of 55 %, of which at least two-thirds reflects a renal vasoconstrictor effect of AngII. The absolute values for zonal GFR in one of the eight experiments are shown in Fig. 1C, including, for illustration of the clearance procedure, the timing of blood samples and AngII infusion (Fig. 1A), as well as the plasma Ap concentration curves (Fig. 1B). In Fig. 1C the data points represent GFR in five tissue samples from each zone in the same experiment, showing that the changes in GFR were small and similar in spite of considerable scatter in control values among the five samples. The average zonal GFR before and during i.v. AngII infusion in the eight experiments is shown in Fig. 2. While the changes in all layers are small, the increase in GFR of ≈5 % in MC and IC was, as shown in Fig. 3, significantly different from the 1 % reduction in OC (P < 0.05).
Figure 2. Left kidney GFR in OC, MC, and IC before and during i.v. infusion of AngII.
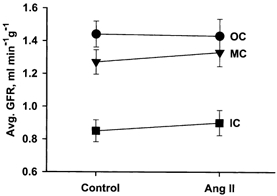
Each point represents the mean ± s.e.m. of five samples from each zone in eight experiments.
Figure 3. Percentage change in GFR in OC, MC and IC induced by AngII.
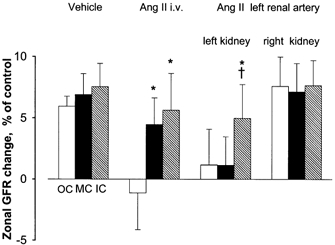
Columns and error bars indicate means and s.e.m.* Significantly different from OC (P < 0.05). † Significantly different from MC (P < 0.05).
Vehicle control group
Intravenous vehicle infusion (5 % BSA in 0.9 % saline) caused no change in arterial pressure or renal blood flow, but increased total GFR by ≈7 % (P < 0.05). A 2 % greater increase in IC than in OC (Fig. 3) did not reach statistical significance (P = 0.20).
Intra-arterial AngII infusion
To avoid the confounding hypertensive effect we also studied the effect of AngII infusion into the left renal artery in ten rats, with a protocol similar to that used for i.v. infusion. In a brief test infusion at least 15 min before the experiment the infusion rate was adjusted to reduce left kidney RBF by 15-20 %, (similar to that obtained by i.v. infusion), leading to a mean dose of ≈2 ng min−1. Arterial pressure remained practically unchanged, while RBF in the left kidney fell by 16 %, indicating that the resistance increase of 18 % was solely attributable to AngII. Inner cortical GFR increased by 5 %, significantly more than middle and outer cortical GFR which remained practically unchanged (Fig. 3). In the right non-infused kidney total GFR increased by 6 % with unaltered distribution between OC, MC and IM.
Acute effect of losartan
Losartan (10 mg (kg BW)−1), was injected i.v.13 min after the first i.v. aprotinin injection and 2 min before the second. The second clearance period lasted 8 min.
In salt-replete rats (n = 7) losartan reduced mean arterial pressure from 124 to 106 mmHg and increased RBF by 19 %. Thus, renal resistance fell by 28 %, half of which might reflect autoregulation. Whole kidney GFR fell on average by 4 %, with quite large scatter between different rats. As shown in Fig. 4 a similar reduction in local GFR was slightly more pronounced in deep than in superficial cortex (not significant).
Figure 4. Percentage change in GFR in OC, MC and IC induced by losartan.
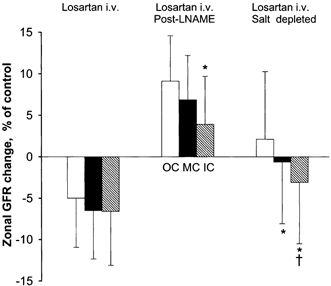
Mean and s.e.m.* Significantly different from OC (P < 0.05). † Significantly different from MC (P < 0.05).
Salt-depleted rats (n = 7) showed greater circulatory responses to losartan. Arterial pressure fell from 128 to 96 mmHg and RBF increased from 7.9 to 11.5 ml min−1. Thus, renal resistance fell by 49 %, half of which might be accounted for by autoregulation. On average whole kidney GFR was unchanged while GFR in IC fell relative to that in OC and MC (P < 0.05) (Figs 3–5)
Figure 5. Influence of AngII and losartan (Los) on the inner/outer and middle/outer cortical filtration ratios (F).
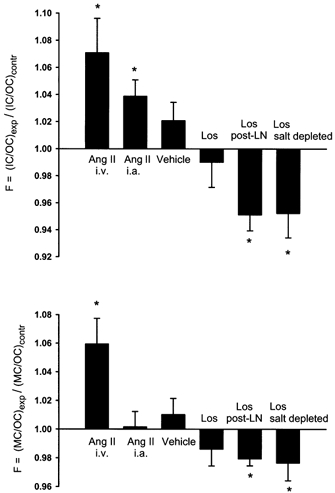
LN, l-NAME. Values above 1.00 indicate an increase in filtration in inner cortex or middle cortex relative to that in outer cortex. *P < 0.05.
The interaction between NO and AngII was tested in ten salt-replete rats by i.v. injection of l-NAME (19 mg (kg BW)−1) 10 min before beginning the first Ap-clearance period. l-NAME increased PA from 128 to 148 mmHg and reduced RBF from 11.3 to 8.6 ml min−1, giving ≈50 % increase in renal vascular resistance, of which at most one-third could be accounted for by autoregulation (see Table 1). No GFR measurement was made before l-NAME injection, but the total GFR of 1.31 ml min−1 after l-NAME was within the normal range, in agreement with our previous observation of no significant effect of l-NAME on total or zonal GFR (Treeck & Aukland, 1997). After the l-NAME premedication, losartan caused only a slight reduction in PA (-5 %), whereas renal resistance fell and RBF increased similarly to those changes seen with losartan alone. Total and zonal GFR now increased, and was most pronounced in the outer cortex, versus an average 5 % reduction in the series of salt-replete rats not given l-NAME. As shown in Fig. 3, GFR in the outer cortex increased slightly more than that in MC and IC, with experimental/control ratios of 1.09, 1.07 and 1.04, respectively, the OC value being significantly different from both the MC and IC values (P < 0.05).
It should be noted that the overall scatter of GFR indicated by error bars in Fig. 3 and Fig. 4 does not exclude similar relative responses in OC, MC and IC in individual kidneys. This is addressed in Fig. 5 by paired comparison of the relative experimental (E) to control (C) ratio in inner cortex, ICE/ICC, with that in outer cortex (OCE/OCC):
(may also be written as F = (ICE/OCE)/(ICC/OCC)).
A rise in F above 1.00 directly shows a relatively greater increase of GFR in IC than in OC, whereas a value below one indicates a relative reduction in IC. As summarized for the different experimental groups in Fig. 5, AngII and losartan showed opposite effects on F, strongly corroborating the significant differences calculated in each experimental series. A similar relationship was found for MC versus OC, but here with weaker significance (Fig. 5).
DISCUSSION
During reduction of PA, glomerular filtration in all cortical layers of the rat kidney is maintained relatively constant (Wang et al. 1995). However, under the influence of vasoactive substances, including AngII, GFR is usually altered less than RBF (Baylis & Brenner, 1978; Alberola et al. 1994; Navar et al. 1996). The general explanation is that glomerular capillary pressure is kept fairly constant at altered arterial pressure by autoregulatory preglomerular constriction or dilatation, and during the influence of renal nerve activity, hormones or vasoactive drugs, by a well balanced pre- and postglomerular resistance response. The maintenance of this balance is quite remarkable considering the striking anatomical differences between the resistance vessels in deep and superficial cortical layers. In deep cortex the preglomerular resistance is provided almost solely by the afferent arterioles, whereas in superficial layers the interlobular arteries are responsible for almost one-half of the preglomerular resistance (Heyeraas & Aukland, 1987). The postglomerular resistance vessels also differ, with efferent arterioles dominating in superficial layers, while the descending part of the vasa recta may contribute appreciable resistance in the juxtamedullary nephrons (Göransson et al. 1986; Pallone, 1994). Although micropuncture measurements in rats have shown equal glomerular capillary pressure in cortical and juxtamedullary nephrons under control conditions (Aukland et al. 1977; Iversen et al. 1998), there might still be appreciable local differences in the regulation of blood flow and filtration rate. And, indeed, beginning with Trueta et al. (1947) and up to the middle 1970s a large number of studies of local renal blood flow indicated that deep and superficial layers responded differently to many interventions. Many of these results undoubtedly reflected misinterpretations and/or inadequate methods (Aukland et al. 1976; Hura & Stein, 1992). However, more recent studies using computer tomography, laser Doppler techniques or other methods indicate that the juxtamedullary circulation, and especially the papillary circulation, may react differently from the rest of the kidney (Pallone et al. 1990; Mattson & Roman, 1991; Nobes et al. 1991; Lerman et al. 1995; Bergström et al. 1998; Evans et al. 2000; Pallone & Silldorff, 2001).
The whole kidney GFR measurements in the present study confirm the marked tendency for GFR to remain relatively unchanged in spite of large alterations in RBF elicited by AngII infusion or blockade of AT-1 receptors (Figs 2–4). However, of greater interest were the zonal measurements, showing small, but significantly different alterations in GFR in outer, middle and inner cortex (Fig. 4). Admittedly, it is not possible to obtain exactly equal thickness of all tissue samples, but the dissection of cortex is greatly facilitated by staining the glomeruli and by fixation of the kidney in formalin. However, the ability to detect small changes in GFR distribution described above is clearly due to the high sensitivity of the Ap method, resulting from comparison of tubular uptake of Ap in control and experimental periods in the same tissue samples. That means that errors in tissue dissection and blood sample weights are common to control and experimental periods and will, therefore, cancel out in the comparison (Tenstad et al. 1994a). Moreover, the Ap method shares the virtue of the Hanssen ferrocyanide technique (Hanssen, 1963), in that the kidney is left untouched until the experiment is finished. One drawback of the Ap method is the brevity of the clearance periods, which in the present protocols means that measurement of the effect of AngII and losartan was started as early as 2 min after establishing a continuous i.v. or i.a. infusion, the ‘weighted mean clearance’ (Treeck & Aukland, 1997) being obtained 3 min thereafter. Comparison with more long-term studies must therefore be made with caution.
An unexpected finding in the present study was a 7 % increase in GFR in a vehicle control series (Fig. 3). We suspected that it might have been caused by excessive saline replacement of the many blood samples. Haematocrit remained unchanged, however, so we have not been able to confirm that explanation. Also, the IC/OC experimental to control ratio remained unchanged (Fig. 5).
For a tentative analysis of the vascular responses accounting for the GFR changes we will rely on the many experiments showing that exogenous AngII constricts both pre- and postglomerular vessels, while autoregulation results from alterations in preglomerular resistance (Navar et al. 1996). Moreover, AngII-induced reduction of glomerular capillary pressure and reduction of GFR may be reinforced by reduction of the glomerular ultrafiltration coefficient, Kf. In the following we will include that effect in ‘preglomerular constriction’. Also, reduction of RBF will tend to reduce GFR through a rise in glomerular capillary colloid osmotic pressure. A postglomerular constriction will contribute towards reducing RBF, but will also tend to increase glomerular capillary pressure and GFR. We will also assume that all vasoconstrictor responses to AngII are counteracted by the AT1 blocker losartan.
Intravenous and left renal arterial infusion of AngII caused similar reductions in RBF (22 and 16 %, respectively) and a slight increase in GFR, similar to that seen in the vehicle series. The effect of a rise in PA during intravenous infusion was clearly neutralized by preglomerular autoregulatory vasoconstriction. While the overall pattern suggests a combined pre- and postglomerular constriction, the increase in the IC/OC GFR ratio (Fig. 5) indicates a relative increase of postglomerular resistance in deep versus superficial nephrons. However, the same pattern might be caused by a more pronounced attenuation of preglomerular constriction in IC, induced by a secondary release of prostaglandins, kinins or NO (Navar & Rosivall, 1984; Göransson & Sjöquist, 1985; Parekh et al. 1993; Navar et al. 1996; Clayton et al. 1998). To clarify a possible role for NO we compared the response to reduction of AngII tone by losartan, with and without pretreatment with l-NAME.
Losartan infusion in salt-replete rats caused a marked reduction in PA and renal vascular resistance. GFR fell slightly in all zones, somewhat more in IC than in OC (not significant) in spite of increased RBF, probably reflecting the removal of a predominant efferent, but weak AngII tone. Losartan caused a much greater reduction in PA and renal resistance in salt-depleted rats. While RBF increased by 45 %, total GFR remained unchanged, presumably reflecting a mainly postglomerular dilatation significantly more pronounced in inner than in outer cortex (Fig. 4).
The effect of losartan was radically different in salt-replete rats premedicated with l-NAME to reduce NO tone. l-NAME per se caused a marked systemic and renal vasoconstriction and reduction in RBF. Total GFR was apparently maintained at a normal level (no measurement before l-NAME), presumably reflecting opposing effects of increased PA and a predominant afferent vasoconstriction. Subsequent infusion of losartan did not abolish the systemic vasoconstriction due to the dilatory effect of NO, but increased RBF by 23 % and GFR by 5 %, suggesting abolition of an inhibitory effect of NO on renal AngII constrictor tone, possibly through a direct inhibition of renin formation (Sigmon et al. 1992). The result was a predominant reduction of an elevated preglomerular vasoconstriction, most pronounced in the inner cortex. This interpretation agrees well with many previous observations showing that the main renovascular effect of NO is to impose a constraint on an afferent arteriolar AngII tone (Ohishi et al. 1992; Sigmon et al. 1992; Ito et al. 1993; Juncos et al. 1996; Qiu & Baylis, 1999), and to enhance the tubuloglomerular feedback response (Wilcox et al. 1992; Thorup & Persson, 1996).
The main new information provided by the present study is the finding that angiotensin infusion favours glomerular filtration in deep versus superficial nephrons, presumably reflecting a higher AngII sensitivity in deep postglomerular vessels. Moreover, the opposite pattern obtained by losartan infusion strengthens this interpretation and also indicates that anaesthetized rats have a greater postglomerular AngII tone in deep than in superficial nephrons. Since arterial pressure changes were involved in most experimental groups one might suspect that altered deep-superficial GFR relationship might result from different degrees of autoregulation in deep and superficial layers. Several observations contradict that explanation. Firstly, intra-arterial infusion of AngII, with no change in PA, caused changes in IC/OC ratios in the infused, but not in the contralateral kidney. Secondly, previous studies with the aprotinin method have shown similar autoregulation of GFR in deep and superficial cortex in Wistar Kyoto rats (Wang et al. 1995).
Most of the previous studies relevant for comparison with the present findings date back to the 1970s, when many groups used the Hanssen ferrocyanide technique to study the effect of varying salt intake on single nephron filtration rate. As summarized by Lameire et al. (1977), acute or chronic salt loads, expected to reduce renin and AngII formation, caused no ‘redistribution’ in five of 11 studies. However, in agreement with the present results, the remaining six studies showed a relative increase in deep nephron GFR. Considering that the distribution in each animal was obtained by one unrepeatable measurement of tubular ferrocyanide content in five to ten tubules from each of three cortical layers, it is indeed amazing that so many studies could reveal significant differences in GFR distribution. Presumably the salt loads in these studies had reduced the AngII tone to a much lower level than that prevailing in our rats on ‘normal’ salt intake.
No change in zonal GFR distribution during i.v. AngII infusion was observed by a ‘modified Hanssen technique’ based on a 10 s local cortical uptake of i.v. infused 51Cr-EDTA, corrected for intrarenal plasma and interstitial tracer content (Göransson & Sjöquist, 1984; Sjöquist & Göransson, 1985). However, the scatter in the IC/OC ratios indicates that the small ‘redistribution’ observed here (Fig. 3) might not be detectable by their technique, which permitted only one measurement in each kidney. However, in a later study they found that angiotensin converting enzyme inhibition (CEI) increased GFR in deep, but not in superficial glomeruli (Göransson & Sjöquist, 1985), and also increased free flow pressure in the loops of Henle but not in superficial proximal tubules (Göransson et al. 1986). That is opposite to the relative fall in inner cortical filtration rate induced by losartan in the present study, possibly due to increased kinin formation induced by inhibition of converting enzyme (Nobes et al. 1991; Rudenstam et al. 2000) and not by losartan.
Also in apparent disagreement with the present results, Denton et al. (1992, 2000) found by measuring arteriolar diameters in vascular casts from rabbit kidneys that AngII caused a greater increase in resistance per unit length in efferent than in afferent arterioles, the difference being greater in outer than in inner cortex. It should be noted, though, that the descending vasa recta in the outer medulla might add considerably to efferent arteriolar resistance (Pallone, 1994), probably assisted by contraction of pericytes (Pallone & Silldorff, 2001).
As discussed previously (Treeck & Aukland, 1997) the IC zone probably contains all juxtamedullary nephrons with a smaller contribution of the cortical type. Still, comparison of IC-GFR to medullary blood flow is problematic, especially comparison to papillary flow, which obviously is derived from a small fraction of juxtamedullary glomeruli (Lerman et al. 1995) Also, contradictory reports on medullary flow responses to AngII may reflect methodological problems as well as species and gender differences (Parekh et al. 1993; Bergström et al. 1998) It may be noted, however, that the altered GFR distribution observed with AngII and losartan involved changes not only in the IC/OC ratio but also in the MC/OC ratio (Fig. 5), strongly suggesting that the different responses cannot be explained by resistance changes in the juxtamedullary nephrons alone.
In summary, the losartan blocking suggested a higher postglomerular AngII tone in inner than in outer cortex, especially in salt-depleted animals. AngII infusions also indicated a higher sensitivity in deep layers. The physiological role of the relatively small changes in GFR distribution is probably modest. However, the better maintained GFR in inner cortex during salt depletion might sustain or even increase salt delivery to the loops of Henle. Together with a stimulation of tubular salt resorption and a reduction in medullary blood flow, this might improve the concentrating mechanism and thereby contribute to the general task of the renin-angiotensin-aldosterone system, i.e. to protect extracellular fluid volume.
Acknowledgments
This work was economically supported by the Norwegian Research Council and by Nasjonalforeningen, The Norwegian Council on Cardiovascular Disease. Losartan was kindly provided by Dr R. D. Smith of Merck & Co, Inc.
REFERENCES
- Aiken JW, Vane JR. Intrarenal prostaglandin release attenuates the renal vasoconstrictor activity of angiotensin. Journal of Pharmacology and Experimental Therapeutics. 1973;184:678–687. [PubMed] [Google Scholar]
- Alberola AM, Salazar FJ, Nakamura T, Granger JP. Interaction between angiotensin II and nitric oxide in control of renal hemodynamics in conscious dogs. American Journal of Physiology. 1994;267:R1472–1478. doi: 10.1152/ajpregu.1994.267.6.R1472. [DOI] [PubMed] [Google Scholar]
- Aukland K. Renal blood flow. In: Thurau K, editor. International Review of Physiology, Kidney and Urinary Tract Physiology II. Vol. 11. Baltimore: University Park Press; 1976. pp. 23–79. [PubMed] [Google Scholar]
- Aukland K, Heyeraas Tønder K, Næbess G. Capillary pressure in deep and superficial glomeruli of the rat kidney. Acta Physiologica Scandinavica. 1977;101:418–427. doi: 10.1111/j.1748-1716.1977.tb06025.x. [DOI] [PubMed] [Google Scholar]
- Barandoust A, Aukland K. Uptake of aprotinin in the proximal tubule of the rat kidney. Acta Physiologica Scandinavica. 1996;157:58a. [Google Scholar]
- Baylis C, Brenner BM. Modulation by prostaglandin synthesis inhibitors of the action of exogenous angiotensin II on glomerular ultrafiltration in the rat. Circulation Research. 1978;43:889–898. doi: 10.1161/01.res.43.6.889. [DOI] [PubMed] [Google Scholar]
- Bergström G, Göthberg G, Karlström G, Rudenstam J. Renal medullary blood flow and renal medullary antihypertensive mechanisms. Clinical and Experimental Hypertension. 1998;20:1–26. doi: 10.3109/10641969809053203. [DOI] [PubMed] [Google Scholar]
- Clayton JS, Clark KL, Johns EJ, Drew GM. Effects of prostaglandins and nitric oxide on the renal effects of angiotensin II in the anaesthetized rat. British Journal of Pharmacology. 1998;124:1467–1474. doi: 10.1038/sj.bjp.0702003. [DOI] [PMC free article] [PubMed] [Google Scholar]
- Denton KM, Anderson WP, Sinniah R. Effects of angiotensin II on regional afferent and efferent arteriole dimensions and the glomerular pole. American Journal of Physiology - Regulatory, Integrative and Comparative Physiology. 2000;279:R629–638. doi: 10.1152/ajpregu.2000.279.2.R629. [DOI] [PubMed] [Google Scholar]
- Denton KM, Fennessy PA, Alcorn D, Anderson WP. Morphometric analysis of the actions of angiotensin II on renal arterioles and glomeruli. American Journal of Physiology. 1992;262:F367–372. doi: 10.1152/ajprenal.1992.262.3.F367. [DOI] [PubMed] [Google Scholar]
- Evans RG, Madden AC, Denton KM. Diversity of responses of renal cortical and medullary blood flow to vasoconstrictors in conscious rabbits. Acta Physiologica Scandinavica. 2000;169:297–308. doi: 10.1046/j.1365-201x.2000.00741.x. [DOI] [PubMed] [Google Scholar]
- Göransson A, Sjöquist M. The effect of pressor doses of Angiotensin II on autoregulation and intrarenal distribution of glomerular filtration rate in the rat. Acta Physiologica Scandinavica. 1984;122:615–620. doi: 10.1111/j.1748-1716.1984.tb07551.x. [DOI] [PubMed] [Google Scholar]
- Göransson A, Sjöquist M. The effect of a converting enzyme inhibitor on autoregulation and intrarenal distribution of glomerular filtration in the rat. Acta Physiologica Scandinavica. 1985;124:515–523. doi: 10.1111/j.1748-1716.1985.tb00043.x. [DOI] [PubMed] [Google Scholar]
- Göransson A, Sjöquist M, Ulfendahl HR. Superficial and juxtamedullary nephron function during converting enzyme inhibition. American Journal of Physiology. 1986;251:F25–33. doi: 10.1152/ajprenal.1986.251.1.F25. [DOI] [PubMed] [Google Scholar]
- Hanssen OE. Method for comparison of glomerular filtration in individual rat nephrons. Proceedings of the 2nd International Congress of Nephrology, Prague (1963) 1963:527–529. Excerpta Medica International Congress. Series no. 78. [Google Scholar]
- Heyeraas KJ, Aukland K. Interlobular arterial resistance: Influence of renal arterial pressure and angiotensin II. Kidney International. 1987;31:1291–1298. doi: 10.1038/ki.1987.142. [DOI] [PubMed] [Google Scholar]
- Hura C, Stein JH. Renal blood flow. In: Windhager EE, editor. Handbook of Physiology, section 8, Renal Physiology. I. New York: American Physiological Society, Oxford University Press; 1992. pp. 1129–1184. [Google Scholar]
- Ito S, Arima S, Ren YL, Juncos LA, Carretero OA. Endothelium-derived relaxing factor/nitric oxide modulates angiotensin II action in the isolated microperfused rabbit afferent but not efferent arteriole. Journal of Clinical Investigation. 1993;91:2012–2019. doi: 10.1172/JCI116423. [DOI] [PMC free article] [PubMed] [Google Scholar]
- Iversen BM, Amann K, Kvam FI, Wang X, Ofstad J. Increased glomerular capillary pressure and size mediate glomerulosclerosis in SHR juxtamedullary cortex. American Journal of Physiology. 1998;274:F365–373. doi: 10.1152/ajprenal.1998.274.2.F365. [DOI] [PubMed] [Google Scholar]
- Juncos LA, Ren Y, Arima S, Garvin J, Carretero OA, Ito S. Angiotensin II action in isolated microperfused rabbit afferent arterioles is modulated by flow. Kidney International. 1996;49:374–381. doi: 10.1038/ki.1996.55. [DOI] [PubMed] [Google Scholar]
- Kriz W, Schnermann J, Koepsell H. The position of short and long loops of Henle in the rat kidney. Zeitschrift für Anatomische Entwicklungsgeschichte. 1972;138:301–319. doi: 10.1007/BF00520710. [DOI] [PubMed] [Google Scholar]
- Lameire NH, Lifschitz MD, Stein JH. Heterogeneity of nephron function. Annual Review of Physiology. 1977;39:159–184. doi: 10.1146/annurev.ph.39.030177.001111. [DOI] [PubMed] [Google Scholar]
- Lerman LO, Bentley MD, Fiksen-Olsen MJ, Strick DM, Ritman EL, Romero JC. Pressure dependency of canine intrarenal blood flow within the range of autoregulation. American Journal of Physiology. 1995;268:F404–409. doi: 10.1152/ajprenal.1995.268.3.F404. [DOI] [PubMed] [Google Scholar]
- Mattson DL, Roman RJ. Role of kinins and angiotensin II in the renal hemodynamic response to captopril. American Journal of Physiology. 1991;260:F670–679. doi: 10.1152/ajprenal.1991.260.5.F670. [DOI] [PubMed] [Google Scholar]
- Navar LG, Inscho EW, Majid SA, Imig JD, Harrison-Bernard LM, Mitchell KD. Paracrine regulation of the renal microcirculation. Physiological Reviews. 1996;76:425–536. doi: 10.1152/physrev.1996.76.2.425. [DOI] [PubMed] [Google Scholar]
- Navar LG, Rosivall L. Contribution of the renin-angiotensin system to the control of intrarenal hemodynamics. Kidney International. 1984;25:857–868. doi: 10.1038/ki.1984.102. [DOI] [PubMed] [Google Scholar]
- Nobes MS, Harris PJ, Yamada H, Mendelsohn FAO. Effects of angiotensin on renal cortical and papillary blood flows measured by laser-Doppler flowmetry. American Journal of Physiology. 1991;261:F998–1006. doi: 10.1152/ajprenal.1991.261.6.F998. [DOI] [PubMed] [Google Scholar]
- Ohishi K, Carmines PK, Inscho EW, Navar LG. EDRF-angiotensin II interactions in rat juxtamedullary afferent and efferent arterioles. American Journal of Physiology. 1992;263:F900–906. doi: 10.1152/ajprenal.1992.263.5.F900. [DOI] [PubMed] [Google Scholar]
- Pallone TL. Vasoconstriction of outer medullary vasa recta by angiotensin II is modulated by prostaglandin E2. American Journal of Physiology. 1994;266:F850–857. doi: 10.1152/ajprenal.1994.266.6.F850. [DOI] [PubMed] [Google Scholar]
- Pallone TL, Robertson CR, Jamison RL. Renal medullary microcirculation. Physiological Reviews. 1990;70:885–920. doi: 10.1152/physrev.1990.70.3.885. [DOI] [PubMed] [Google Scholar]
- Pallone TL, Silldorff EP. Pericyte regulation of renal medullary blood flow. Experimental Nephrology. 2001;9:165–170. doi: 10.1159/000052608. [DOI] [PubMed] [Google Scholar]
- Parekh N, Zou A-P, Jüngling I, Endlich K, Sadowski J, Steinhausen M. Sex differences in control of renal outer medullary circulation in rats: role of prostaglandins. American Journal of Physiology. 1993;264:F629–636. doi: 10.1152/ajprenal.1993.264.4.F629. [DOI] [PubMed] [Google Scholar]
- Qiu C, Baylis C. Endothelin and angiotensin mediate most glomerular responses to nitric oxide inhibition. Kidney International. 1999;55:2390–2396. doi: 10.1046/j.1523-1755.1999.00466.x. [DOI] [PMC free article] [PubMed] [Google Scholar]
- Rudenstam J, Creutz J, Göthberg G, Karlstrom G, Bergstrom G. Regional renal haemodynamics of angiotensin II infusion under prostaglandin, kinin or converting enzyme inhibition in the Wistar rat. Blood Pressure. 2000;9:169–175. doi: 10.1080/080370500453528. [DOI] [PubMed] [Google Scholar]
- Sigmon DH, Carretero OA, Beierwaltes WH. Angiotensin dependence of endothelium-mediated renal hemodynamics. Hypertension. 1992;20:643–650. doi: 10.1161/01.hyp.20.5.643. [DOI] [PubMed] [Google Scholar]
- Sjöquist M, Göransson A. Time-dependent heterogeneity of filtration rate in the autoregulating rat kidney. Acta Physiologica Scandinavica. 1985;123:151–158. doi: 10.1111/j.1748-1716.1985.tb07572.x. [DOI] [PubMed] [Google Scholar]
- Tenstad O, Williamson HE, Aukland K. Repeatable measurement of local and zonal GFR in the rat kidney with aprotinin. Acta Physiologica Scandinavica. 1994a;152:21–31. doi: 10.1111/j.1748-1716.1994.tb09781.x. [DOI] [PubMed] [Google Scholar]
- Tenstad O, Williamson HE, Clausen G, Øien AH, Aukland K. Glomerular filtration and tubular absorption of the basic polypeptide aprotinin. Acta Physiologica Scandinavica. 1994b;152:33–50. doi: 10.1111/j.1748-1716.1994.tb09782.x. [DOI] [PubMed] [Google Scholar]
- Thorup C, Persson AEG. Macula densa derived nitric oxide in regulation of glomerular capillary pressure. Kidney International. 1996;49:430–436. doi: 10.1038/ki.1996.62. [DOI] [PubMed] [Google Scholar]
- Treeck B, Aukland K. Effect of l-NAME on glomerular filtration rate in deep and superficial layers of rat kidneys. American Journal of Physiology. 1997;272:F312–318. doi: 10.1152/ajprenal.1997.272.3.F312. [DOI] [PubMed] [Google Scholar]
- Trueta J, Barclay AE, Daniel PM, Franklin KJ, Prichard MML. In: Studies of the Renal Circulation. Thomas CC, editor. Oxford: Blackwell Scientific Publications; 1947. pp. 1–187. [Google Scholar]
- Wang X, Aukland K, Ofstad J, Iversen BM. Autoregulation of zonal glomerular filtration rate and renal blood flow in spontaneously hypertensive rats. American Journal of Physiology. 1995;269:F515–521. doi: 10.1152/ajprenal.1995.269.4.F515. [DOI] [PubMed] [Google Scholar]
- Wilcox CS, Welch WJ, Murad F, Gross SS, Taylor G, Levi R, Schmidt HHHW. Nitric oxide synthase in macula densa regulates glomerular capillary pressure. Proceedings of National Academy of Sciences of the USA. 1992;89:11993–11997. doi: 10.1073/pnas.89.24.11993. [DOI] [PMC free article] [PubMed] [Google Scholar]