

Abstract
A model was set up to study water transport in membrane proteins expressed in Xenopus oocytes. The model was tested experimentally using human and rabbit Na+-glucose cotransporters (SGLT1), and was used to explain controversies regarding unstirred layer effects. Cotransport of Na+, sugar and water was monitored by two-electrode voltage clamp and online measurements of oocyte volume. The specific resistance of the oocyte cytoplasm was found by means of microelectrodes to be 263 ± 91 Ω cm (s.d., n = 52), or 2.5 times that of Kulori medium, in agreement with reported values of intracellular ion concentrations and diffusion constants. Osmotically induced volume and resistance changes were compatible with a model of the oocyte in which 37 ± 17 % (s.d., n = 66) of the intracellular volume acts as a free solution while the remainder is inert, being occupied by organelles, etc. The model explains the results of several types of experiments: rapid changes in rates of water cotransport induced by changes in clamp voltage followed by osmotic equilibration in sugar-free conditions; volume changes induced by Na+ transport via the ionophore gramicidin; and uphill water transport. Ethanol (0.5 %) induced a marked swelling of the oocytes of about 16 pl s−1. If the specific inhibitor of SGLT1 phlorizin is added from stock solutions in ethanol, the effect of ethanol obfuscates the effects of the inhibitor. We conclude that the transport parameters derived for water cotransport by the SGLT1 can be attributed to the protein residing in the plasma membrane with no significant influences from unstirred layer effects.
It has been suggested that cotransporters of the symport type act as molecular water pumps: they have the ability to couple water transport to substrate transport in a fixed stoichiometric ratio by a mechanism inside the protein. The concept was first demonstrated for the electroneutral K+-Cl− and H+-lactate cotransporters (Zeuthen, 1991, 1994; Zeuthen et al. 1996). The suggestion that the Na+-coupled cotransporters also cotransport water (Zeuthen, 1994, 1995) has subsequently been confirmed and found to apply to a variety of transporters, in particular, the Na+-glucose transporter, SGLT1 (Loo et al. 1996; Zeuthen et al. 1997; Meinild et al. 1998a, 2000; MacAulay et al. 2001; Zeuthen et al. 2001). We have found that for every two Na+ ions and one sugar molecule, human SGLT1 (hSGLT1) expressed in Xenopus oocytes cotransports about 210 water molecules and rabbit SGLT1 (rSGLT1) cotransports up to 400 water molecules. In addition, the Na+-coupled cotransporters function as low capacity water channels (Fig. 1A). For recent reviews, see Zeuthen & MacAulay (2001a, b).
Figure 1. Model of cotransport and of the oocyte.
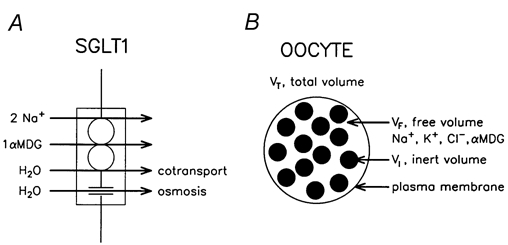
A, model of H2O transport in the SGLT1. H2O is cotransported with the other substrates, Na+ and αMDG, in a fixed ratio given by the protein, of 210 for the human clone, and about 390 for the rabbit clone. The SGLT1 also has a passive water permeability through which H2O can pass by osmosis. B, the cytoplasm of the oocyte (VT) is assumed to consist of two fractions. In one fraction (VF) Na+, K+, Cl−, sugar (αMDG) and H2O are free to move and to communicate with the outer solution via transport processes in the plasma membrane. The relevant intracellular concentrations change uniformly during experiments; there are no unstirred layers. The remainder of the cytoplasm (organelles, etc.) of volume VI (i.e. VT -VF), is inert in that it does not participate directly in the transport processes in the membrane. However, its constituents take up space and present obstacles to the movements of the smaller molecules and ions in the free fraction.
The concept of water cotransport has recently been questioned (Duquette et al. 2001; Lapointe et al. 2001, 2002). For the human SGLT1 expressed in Xenopus oocytes it was suggested that the water transport associated with the transport of Na+ and sugar arose as a result of unstirred layers. This idea implies that, during transport, Na+ and sugar concentrations increase on the inside of the membrane and that these local changes in osmolarity drive water transport by osmosis. To obtain sufficiently large unstirred layers the authors had to assume that diffusion of ions and sugar in the cytoplasm was much slower than in free solution.
The purposes of the present paper were to: (i) set up a realistic model for the study of water transport through membrane proteins expressed in Xenopus oocytes: (ii) test the model in experiments using human and rabbit SGLT1; and (iii) use the model to explain the controversies between our data and those of Duquette et al. (2001) and Lapointe et al. (2001). Specifically, we show that the Xenopus oocyte resembles a number of other animal cell types (i.e. nerve, muscle and red blood cells) with respect to intracellular mobility (see e.g. Hodgkin & Keynes, 1953; Katz, 1966; Hoffman, 1986). Diffusion of ions, sugar and water in the cytoplasm is only reduced by a factor of about two compared to the external solution. As in other cells, the cytoplasm of the oocyte can be considered to consist of two fractions (Fig. 1B). In one-third of the intracellular volume, ions, sugar and water behave as in free solution. The remainder is occupied by, for example, organelles and large molecules, which do not participate directly in the transport mechanisms studied, but constitute a steric hindrance to the movements of the relevant ions and molecules. A simple model based on these features, assuming no significant unstirred layer effects, closely predicts most experiments performed so far by us and by Duquette et al. (2001) and Lapointe et al. (2001, 2002) on the SGLT1, provided that the SGLT1 is considered to act as a molecular water pump.
The few areas where our experimental results deviate from those of Duquette et al. (2001) and Lapointe et al. (2001, 2002) will be dealt with separately. These differences concern the specific effects of ethanol, which was used by Duquette et al. (2001) as a carrier for the inhibitor phlorizin, and the precise values of the sugar-activated clamp currents.
METHODS
Methods were similar to those described previously (Zeuthen et al. 1997, 2001; Meinild et al. 1998a). Human SGLT1 (hSGLT1), rabbit SGLT1 (r SGLT1; Hediger et al. 1987), or human aquaporin (AQP1) (Meinild et al. 1998b) were expressed in Xenopus laevis oocytes and incubated in Kulori medium containing (mm): NaCl 90, KCl 1, CaCl2 1, MgCl2 1, Hepes 5; 182 mosmol and pH 7.4, at 19 °C for 3-7 days before experiments. All Xenopus oocyte collection procedures conformed with Danish Animal Ethics Regulations. Oocytes were collected under anaesthesia (2 g l−1 tricaine (3-aminobenzoic acid ethyl ester) Sigma Chemical Co. product code A 5040). An ovarian lobe was removed from the abdominal cavity through a small (1 cm) incision. The anaesthetized frogs were finally killed by decapitation.
The experimental chamber was perfused with control solution which was Kulori medium, 50Na+-medium (containing (mm): NaCl 50, mannitol 100, KCl 2, CaCl2 1, MgCl2 1, Hepes 10; 213 mosmol and pH 7.4), or 90Na+-medium (containing (mm): NaCl 90, mannitol 20, KCl 2, CaCl2 1, MgCl2 1, Hepes 10; 213 mosmol and pH 7.4). Isotonic sugar solutions were obtained by replacing mannitol by methyl-α-d-glucopyranoside (αMDG, Sigma Chemical Co. product code. M 9376), a non-metabolized sugar. The inhibitor phlorizin was added either directly to the test solutions, or from a concentrated stock solution in ethanol (20 mmol l−1). Hyposmotic test solutions were produced by removal of mannitol, and hyperosmotic test solutions by additions of mannitol or urea. When the effects of Na+ fluxes per se were tested, gramicidin (150-300 nmol l−1, Sigma Chemical Co. product code G 5002), a pore-former, was added to both bathing and test solutions (Meinild et al. 1998a; Zeuthen et al. 2001).
The water permeability, Lp, is given per true membrane surface area. This is about nine times the apparent area due to membrane foldings (Zampighi et al. 1995). Lp is given in units of cm s−1. To convert to units of cm s−1 (osmol l−1)−1 this should be multiplied by the partial molal volume of water (Vw), which is 18 × 10−3 l mol−1. The coupling ratio of the SGLT1 is defined as the number of water molecules cotransported per turnover of the protein, in which two Na+ molecules and one glucose molecule are translocated. Accordingly, the coupling ratio equals 2 F JH2O (Vw Is)−1, where JH2O is the cotransported water flux, Is the sugar-induced current, and F is Faraday's constant.
In order to measure the specific electrical resistance of the oocyte cytoplasm, hyperpolarizing current pulses of between 20 and 300 nA were injected via the tip of a centrally placed microelectrode. The evoked potentials were recorded at the tips of two other intracellular microelectrodes, one near the point of current injection (V1), the other placed within 100 μm of the oocyte plasma membrane (V2) (Fig. 2). The latter electrode records the voltage drop across the plasma membrane. Two large extracellular Ag-AgCl electrodes served as current and voltage reference. The voltage between the two potential sensing electrodes (V1 – V2 = Vc) is a measure of the intracellular specific resistance (Ri). Calibrations were done: in 100 mmol l−1 NaCl which has a specific resistance (Re) of 94 Ω cm (Robinson & Stokes, 1970); in Kulori medium with an Re of 105 ± 2 Ω cm (4); in Kulori medium diluted three times, with Re taken as 315 Ω cm; or in 50Na+-medium with an Re of 179 ± 5Ω cm (3).
Figure 2. Measurement of intracellular specific resistance Ri.
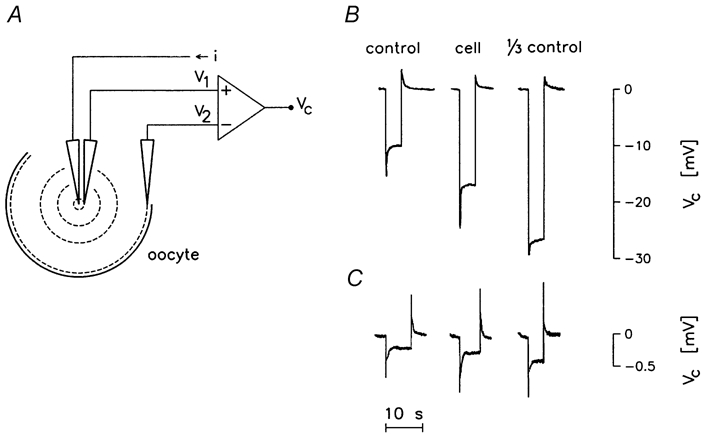
A, current pulses, i, were applied via an intracellular microelectrode. The resulting potential drop in the cytoplasm was recorded by two other microelectrodes, one placed near the point of current injection (recording V1), the other within 100 μm from the plasma membrane (recording V2). B and C, the potential drop (V1 – V2 = Vc) obtained in the cell is compared to the one obtained in the external bathing solution (i.e. Kulori medium), and in external solution diluted by a factor of 3. In B the current-injecting electrode and the electrode recording V1 were combined in a double-barrelled electrode; the current strength was -20 nA, ΔV1 was about -24 mV and ΔV2 about -6 mV (not shown) resulting in a ΔVc of -18 mV. In C the V1 recording electrode was positioned 125 μm away from the central current-injecting electrode; the current strength was -300 nA. In these experiments the current pulse was terminated manually in order to reduce the possibility of heating the current-injecting microelectrode (see Methods).
Two electrode configurations were employed. In one, the current injection electrode and the potential sensing (V1) were combined in a double-barrelled electrode. This was pulled from thick septum theta glass tubing (TST150-6; World Precision Instruments, FL, USA). In order to mimic the intracellular solution, and to minimize ion fluxes in and out of the electrode, the two barrels were filled with 80 mmol l−1 KCl, but electrodes containing 40 mmol l−1 or 1 mol l−1 KCl were also tested. Experiments with ion-selective electrodes show that the choice of filling solution does not affect the ion activities around the tips of such microelectrodes (Zeuthen, 1982). The barrels had resistances of about 100 MΩ when filled with 80 mmol l−1 KCl and measured in Kulori medium; the common resistance to ground was about 700 kΩ. The total tip diameter is of the order of 0.1 μm, yet the effective separation of the two orifices will be larger due to the protrusion of the thick septum. Current pulses were typically -20 nA, lasting for 5 s and applied every 10 s. This gave a V1 of about -25 mV, V2 of about -5 mV, and Vc of about -20 mV. In the second electrode configuration, the tip of the electrode sensing V1 was separated by 40 to 125 μm from the tip of the current injecting electrode. The geometry was fixed by gluing two microelectrodes together under microscopic observation prior to the experiment. Each microelectrode was made from theta glass, with only one of the barrels employed. The barrel of the current injecting electrode was filled with 1 mol l−1 KCl and the barrel of the V1 sensing electrode with 80 mmol l−1 KCl. Current pulses were typically -200 nA, which resulted in a value for Vc of about -0.5 to -1 mV. Due to the small signal-to-noise ratio, pulse lengths of up to 10 s were employed. However after reading Vc, each pulse could be terminated manually in order to reduce the possibility of heating the current barrel, which might lead to bubble formation. The electrode sensing V2 was in all cases a 1 MΩ-electrode filled with 1 mol l−1 KCl, similar to those applied in the two-electrode voltage clamp.
Model predictions (eqn (A1) and (A2) in Appendix) were done by numerical integration in C++ language using time-steps of 0.1 s.
Experiments were performed at room temperature (20-25 °C). All numbers are given as means ± s.e.m. unless otherwise stated; (single numbers in parentheses represent the number of oocytes tested). Comparisons were done with Student's paired t test. P ≤ 0.05 was taken as the criterion for no statistical difference.
RESULTS
We have shown firstly that the cytoplasm of the oocyte has a relatively low electrical specific resistance indicative of high ionic mobilities, and that the passive water permeability of the plasma membrane can be described by one Lp value. This forms the basis of the simple model of the oocyte presented in Fig. 1B and Appendix. Secondly we have tested whether this model can predict the results of a number of key experiments involving the SGLT1. Thirdly some experimental discrepancies between our results and those of Duquette et al. (2001) and Zeuthen et al. (2001) have been investigated.
Specific electrical resistance of the cytoplasm, Ri
When current pulses are injected from the tip of an intracellular microelectrode, the magnitudes of the potential gradients evoked in the cytoplasm will be a measure of Ri: the higher the mobility of the conducting ions, the smaller the gradients and Ri. Potential differences were recorded between the tips of two other intracellular microelectrodes, one near the point of current injection (V1) and the other placed within 100 μm of the oocyte plasma membrane (V2), see Fig. 2 and Methods. For each oocyte, Ri was recorded in triplicate. The following various conditions were tested:
Current was injected by one barrel of a double-barrelled microelectrode while V1 was recorded by the other barrel. The two barrels were filled with 80 mmol l−1 KCl and the tip was placed near the centre of the oocyte to an accuracy of 100 μm (Fig. 2B). Both native and rSGLT1-expressing oocytes were tested; Ri was 305 ± 32 Ω cm (13) with oocytes in Kulori medium. Using other concentrations of KCl in the double-barrelled electrodes did not affect Ri. This was tested in four native oocytes. When the two barrels were filled with 40 mmol l−1, 80 mmol l−1 or 1 mol l−1 KCl, Ri was 198 ± 18, 205 ± 15 and 228 ± 35 Ω cm, respectively (4 in each case).
If the V1-sensing electrode was separated by 40 to 125 μm from the current-injecting electrode, Ri was 263 ± 42 Ω cm (8) with Kulori as the external medium (Fig. 2C). With this electrode arrangement, any effects on Ri from leakage of ions from the current-injecting electrode can be disregarded. Due to the lower sensitivity inherent in this electrode set-up, current pulses of up to -300 nA were employed. The membrane potential was not affected by the additional intracellular microelectrode.
As in the first condition above, but the tip of the current-injection and V1-sensing electrode was placed within 100 μm of the plasma membrane; Ri was 336 ± 42 Ω cm (12) with Kulori as the external medium. This may be a slight overestimate, since the presence of the plasma membrane will increase the measured resistance for geometrical reasons. However, the correction is small as estimated from the small asymmetry of DC potentials that can be obtained inside oocytes (Baumgartner et al. 1999). Furthermore, the induced potential decreases with distance (r) away from the current-injecting tip. Consequently, Ri will largely be determined by the cytoplasm in a 10 μm zone around the current-injecting tip. We have not included these measurements in the pooled average.
rSGLT1-expressing oocytes were compared to native oocytes from the same batch, in external Kulori medium. The expression level was given by sugar-induced currents of 900 to 1100 nA at clamp potentials of -50 mV and sugar (αMDG) concentrations of 5 mmol l−1 in 50Na+-medium. For the rSGLT1-expressing oocytes, Ri was 284 ± 28 Ω cm (8) and for the native oocytes Ri was 284 ± 36 Ω cm (7) (measurements were made as in the first condition, above.
There was no significant difference between the Ri of rSGLT1-expressing oocytes adapted to 50Na+-medium and that of similar oocytes adapted to Kulori medium. Four oocytes were adapted overnight to 50Na+-medium and compared to four oocytes from the same batch, but which had been kept in Kulori medium. In the oocytes adapted to 50Na+-medium, Ri was 231 ± 10 Ω cm (4) and in the Kulori medium-adapted oocytes 209 ± 19 Ω cm (4), (measurements were made as in the first condition, above). Neither were there any differences in membrane potentials, which were -33 ± 2 mV and -31 ± 3 mV, respectively, nor in oocyte volumes, see below.
In addition, we did not notice any changes in Ri during the week following the preparation of the oocytes. Ri did not depend on the length of the current pulses used for evoking the potentials; pulses as long as 1 min were tested. In summary, oocytes had an average Ri of 263 ± 91 Ω cm (s.d., n = 52), equal to 2.5 times that of the Kulori medium (Re, 105 Ω cm).
R i during oocyte swelling
Four rSGLT1-expressing oocytes were adapted to 50Na+-medium for at least 5 h. The oocytes were from the same batch and had similar expression levels given by saturating sugar-induced currents of 630-800 nA. The steady state Ri was 219 ± 8 Ω cm (4) measured as in the first condition above. The steady state volume was 1.10 ± 0.04 μl (4), which was not significantly different from the volume of four oocytes from the same batch kept in Kulori medium (1.16 ± 0.01 μl (4)). Lp was 4.0 ± 0.1 × 10⁻⁴ cm s−1 (4). In order to be able to test faster rates of swelling, where putative unstirred layer effects would be greater, five AQP1-expressing oocytes were adapted to 50Na+-medium. The steady state Ri was 210 ± 5 Ω cm (5) and the steady state volume was 1.15 ± 0.04 μl (5). The Lp was 4.0 ± 0.6 × 10⁻³ cm s−1 (5), which is ten times that of the rSGLT1-expressing oocytes. All measurements of Ri were taken near the centre of the oocytes.
Oocyte swelling was induced by removing mannitol from the bathing solution and recovery was obtained by returning the mannitol, as described in Fig. 3. The change in Ri was measured by current pulses lasting 3 s applied every 5.5 s The rSGLT1-expressing oocytes were exposed to gradients of -100 mosmol l−1 for 5 min, while the AQP1-expressing oocytes were exposed to gradients of -50 mosmol l−1 for 2 min (Fig. 3). For each oocyte the corresponding volume changes were recorded in a subsequent experiment. For the oocytes expressing rSGLT1, the change in Ri was delayed by 22.5 ± 3.0 s relative to the onset of the external osmolarity change, and the recovery was delayed by 17.5 ± 6.5 s relative to the return of the control solution. For the oocytes expressing AQP1, the delays were 19.3 ± 3.0 s and 20.0 ± 4.1 s, respectively. For the rSGLT1-expressing oocytes, the volume rose by 5.8 ± 0.3 % (4) and Ri by 19.0 ± 0.4 % (4) in the 5 min period. For the AQP1-expressing oocytes the volume rose by 4.7 ± 0.3 % (5) and Ri by 18.1 ± 2.0 % (5) in the 2 min period. Therefore, for both types of oocytes, the increase in Ri was about 3 times larger than the increase in total oocyte volume (VT). These values are in good agreement with the model proposed in Fig. 1B, in which only 30-40 % of the oocyte volume (VF) acts as a free ionic solution while the remainder is inert and non-conducting. On this model the relative increases in VF, and therefore also in Ri, will be about three times higher than that of VT.
Figure 3. Correlation between the specific resistance of the oocyte cytoplasm (Ri) and oocyte volume (VT) during osmotic swelling.
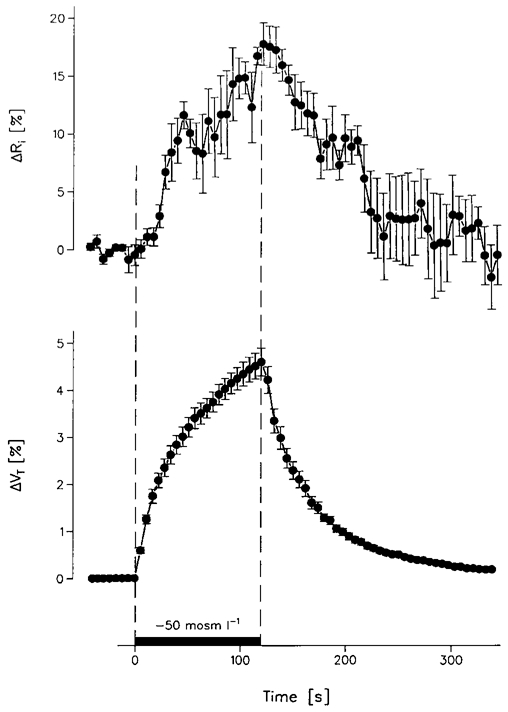
Five AQP1-expressing oocytes were exposed to a hyposmotic challenge of -50 mosmol l−1 for 120 s, by removal of mannitol from the bathing solution (50Na+-medium). After a delay of about 20 s this caused a gradual increase in Ri of about 18 % and an increase in VT of about 5 %. When mannitol was returned to the bathing solution, there was a delay of 20 s before Ri gradually returned to control values. Ri was measured every 5.5 s by 3 s duration current pulses (•, ± s.e.m.).
Definition of the passive water permeability (Lp) of the plasma membrane
In order to test whether the plasma membrane could be described by one value of Lp, oocytes were exposed to osmotic gradients (Δπ) of -100, -50, +25, +50, +100, +200, +300 using mannitol for periods of 90 s; the control bathing solution was 50Na+-medium. The results from a group of rSGLT1-expressing oocytes are compiled in Fig. 4. The oocytes were from the same batch characterized by saturating sugar-induced currents of between 400 and 1300 nA at a clamp voltage of -50 mV. Initially, the changes in the oocyte volume (ΔVT) were nearly linear with time (Fig. 4A). The time elapsed before the rate of change of oocyte volume (ΔVT/Δt) had decreased by 10 % relative to the initial value (t10) was about 40 s (Fig. 4B). The passive water permeability Lp was derived from the initial changes in volume as follows: ΔVT/Δt = A Lp Δπ, where A is the surface area of the oocyte. Lp was 4.4 ± 0.1 × 10⁻⁴ cm s−1, and was independent of the magnitude of the osmotic gradient (Fig. 4C). For positive osmotic gradients, urea was also tested as the osmolyte. It gave the same Lp as mannitol, but produced much smaller optical artefacts (Zeuthen et al. 2001; and see Fig. 4A). The data can be interpreted by the simple model (Fig. 1B) as outlined below.
Figure 4. Effects of osmotic challenges on oocyte volume.
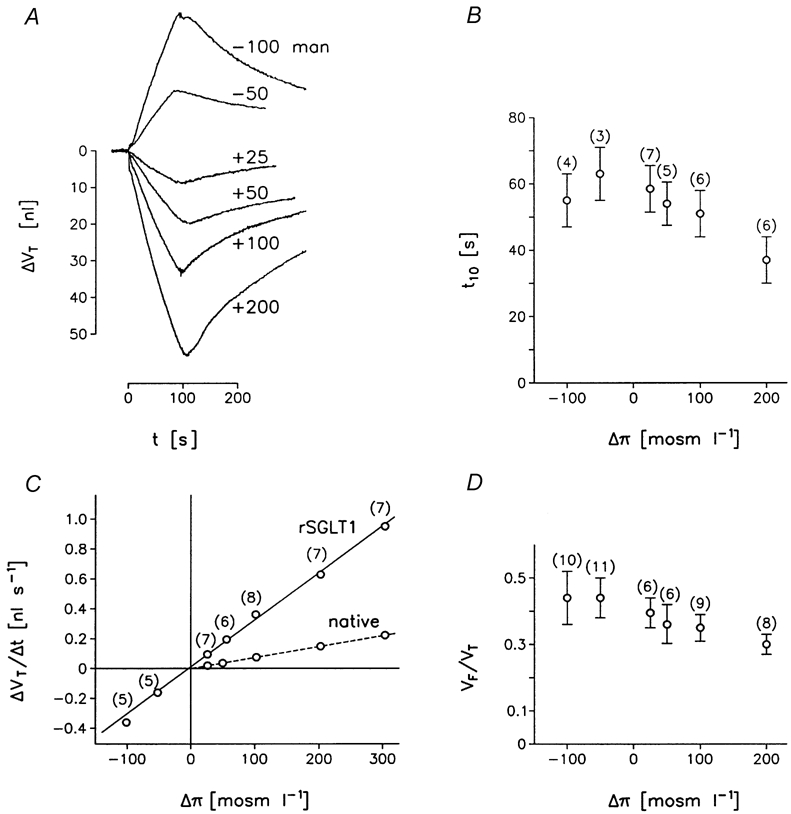
A, an rSGLT1-expressing oocyte was exposed to hyposmotic challenges of -50 and -100 mosmol l−1, by removal of mannitol from the control bathing solution (50Na+-medium). Hyperosmotic challenges of +25, +50, +100, and +200 mosmol l−1 were performed by adding mannitol. The challenges were maintained for about 90 s. The oocyte was characterised by a sugar-induced clamp current of 1300 nA at a clamp potential of -50 mV, and 5 mmol l−1 αMDG. Optical artefacts are noticeable as downward deflections at the time of addition of 200 mosmol l−1 mannitol and at the beginning of the recovery from the hyposmotic challenge of -100 mosmol l−1. B, the initial volume changes were linear; t10 (s) defines the time at which ΔVT/Δt has decreased by 10 % relative to its initial value. C, the initial rate of volume change, ΔVT/Δt as a function of the osmotic challenge. The slope of the regression line (r = 0, 99) gives the Lp of this group of oocytes (4.4 ± 0.1 × 10⁻⁴ cm s−1). The results from one native oocyte are included for comparison. D, the intracellular free volume (VF) relative to the total oocyte volume (VT) was determined from t10 in B (see text). Data in B, C and D are from a group of oocytes similar to that in A; (number of oocytes) s.e.m. is shown if larger than symbols.
Simulation of volume changes induced by changes in external osmolarity
The curvature of the ΔVT versus time curves (Fig. 4A) can be used to estimate the fraction of the total intracellular volume (VT) of the oocyte that is free to interact osmotically with the external solution. In the simple model, shown in Fig. 1B, this free volume (VF) has an osmolarity that in the steady state is equal to the external volume of 213 mosm l−1. In the osmotic experiments, it is VF that is responsible for the volume changes while the remaining volume (VT – VF) remains constant. If, for example, the oocyte is challenged by a hyposmotic Δπ of -50 mosmol l−1, the rate of volume change will have decreased by 10 % when the osmolarity (Osm) of VF has decreased by 5 mosmol l−1, from 213 to 208 mosmol l−1. Now for small changes, ΔVF/VF can be approximated by the expression -ΔOsm/Osm. Since ΔVF = ΔVT, VF equals 213 mosmol l−1/5 mosmol l−1 multiplied by the value of ΔVT obtained when the rate of shrinkage has decreased by 10 %. VF/VT as a function of the osmotic challenge Δπ is given in Fig. 4D. It can be seen that the free fraction of the oocyte volume (VF) constitutes on average about 40 % of the total volume (VT) of the oocyte.
In order to test whether the model also applied to long-term volume changes, a group of rSGLT1-expressing oocytes was exposed to osmotic gradients of -50 mosmol l−1 for about 5 min after which it was returned to control solutions; oocytes and conditions were otherwise as above. An example is shown in Fig. 5. It can be seen that both the swelling and the subsequent shrinkage can be simulated closely throughout the experiment. On average the VF was 44 ± 6 % (6) of VT.
Figure 5. Simulation of osmotic swelling.
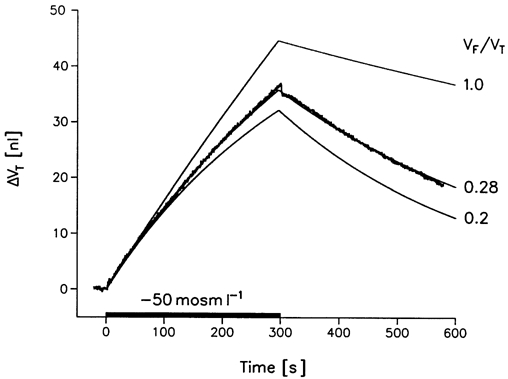
Swelling was induced in an rSGLT1-expressing oocyte by a hyposmotic challenge of -50 mosmol l−1 for 300 s. The measured curve (jagged line) is compared to the predictions of the model (Fig. 1B) in which only a fraction of the volume (VF) of the intracellular compartment (VT) is free to exchange water osmotically with the extracellular compartment. The Lp value of the membrane was 8.2 × 10⁻⁶ cm s−1 (osmol l−1)−1 or 4.5 × 10⁻⁴ cm s−1. The level of expression was given by a sugar-induced clamp current Is of 480 nA at a clamp potential of -50 mV and 5 mmol l−1 αMDG in 50Na+-medium. Model predictions with VF/VT values of 1.0, 0.28 and 0.2 are shown.
Simulation of water cotransport experiments
Key results to support the water cotransport hypothesis have been the demonstration that: (i) abrupt changes in the sugar-activated clamp current (Is) induce rapid changes in water transport rates (JH2O) (Loo et al. 1996; Zeuthen et al. 2001); (ii) isotonic addition of sugar to the external solution induces a rapid and correlated onset of JH2O and Is (Zeuthen et al. 1997, 2001; Meinild et al. 1998a), (iii) water transport by the SGLT1 can proceed uphill, against the water chemical potential difference (Zeuthen et al. 1997; Meinild et al. 1998a); and (iv) Na+ fluxes per se do not induce any initial influx of water (Zeuthen et al. 1997, 2001; Meinild et al. 1998a; MacAulay et al. 2001). These experiments are analysed below, and compared to the simple model (Fig. 1B, and Appendix) in order to determine the free volume fraction VF/VT of the cytoplasm.
Volume changes during rapid changes in Is
We have previously shown for rSGLT1 that JH2O changes rapidly when the Is is changed by stepping the clamp voltage to a new value (Zeuthen et al. 2001); here we wanted to ascertain that the same applied to hSGLT1. The solution transported by the SGLT1 is hypertonic and continued transport will result in a gradual increase in intracellular osmolarity. In order to obtain a well-defined experimental situation we tested the link between Is and JH2O within the first 60-90 s of cotransport. By making the test period as short as possible, changes in intracellular concentrations were minimized. Accordingly, each oocyte was only used for one test.
The sugar-activated current, Is, was changed abruptly (within 10 ms) by changing the clamp voltage, typically from -100 to 0 mV. Water transport by the hSGLT1 was a direct function of Is (Fig. 6A). The time of change in JH2O was not delayed significantly from the time of change in clamp current (hSGLT1: Δt, 0.9 ± 1.4 (11); rSGLT1 in similar experiments: Δt, -0.1 ± 2.2 s (6), data not shown). For a given oocyte, the decrease in JH2O relative to the decrease in Is is a direct measure of the coupling ratio and is independent of any parallel osmotic swelling. On average JH2O/Is was 1.95 ± 1.8 pl s−1 nA−1 (11), equivalent to a coupling ratio of 214 water molecules per turnover of the hSGLT1 (Fig. 6B). This is close to our original estimate of 210 (Meinild et al. 1998a). The relationships between Is and clamp voltage for oocytes bathed in 50Na+-medium are shown in Fig. 6C and D. The difference between Is obtained at clamp voltages of -100 and 0 mV was larger for hSGLT1 than for rSGLT1. With regard to hSGLT1, it is important to note that Is obtained at 0 mV is significant, representing about 30 % of the Is obtained at -100 mV; Duquette et al. (2001) observed an Is of only 6 % at 0 mV under apparently identical conditions.
Figure 6. Changes in JH2O induced by changes in clamp voltage.
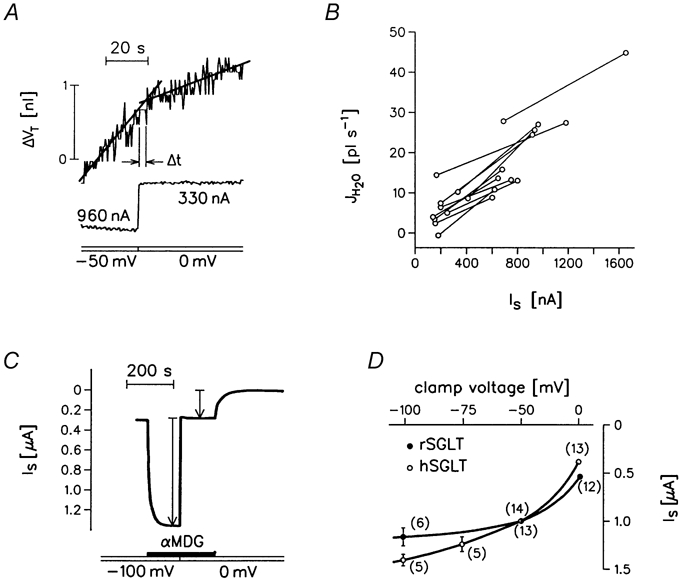
A, temporal relation between JH2O (i.e. ΔVT/Δt) and the sugar-activated clamp current Is. An oocyte expressing hSGLT1 was bathed in 50Na+-medium with 5 mmol l−1 αMDG. Initially the clamp potential was held at a high negative value (-50 mV), Is was 960 nA, and JH2O was 35 pl s−1. When the clamp voltage was stepped to 0 mV, Is was reduced abruptly to 330 nA and JH2O to 9 pl s−1. The change in JH2O was delayed (Δt = 3.4 s) relative to the time of change in Is as estimated from the intersection of the regression lines. The experiment was performed within the first 90 s of sugar application in order to minimize changes in intracellular osmolarity and sugar concentrations. B, the relation between JH2O and Is for hSGLT1-expressing oocytes. Experiments were similar to that in A; most of the high negative clamps were at -100 mV. The two sets of values obtained from the same oocyte were connected by a line. The average slope was 19.5 ± 1.8 × 10⁻³ pl s−1 nA−1 (11), equivalent to a coupling ratio of 214 water molecules per turnover of the hSGLT1. C, a recording of Is at two different clamp potentials for an hSGLT1-expressing oocyte bathed in 50Na+-medium to which 5 mmol l−1 αMDG was added. The vertical arrows give Is at -100 mV and at 0 mV. D, Is versus clamp voltage for hSGLT1- and rSGLT1-expressing oocytes; experiments as in C. (Number of oocytes), s.e.m. shown if larger than points. Lines are empirical.
Experiments combining cotransport and osmosis
The simple model (Fig. 1B) can be used to simulate the changes in oocyte volume, VT (ΔVT/Δt = JH2O) under long-term experiments combining rapid shifts in rates of SGLT1 transport and the gradual build-up of intracellular osmolarity. To begin the experiments, the SGLT1 was activated by the isosmotic addition of sugar under conditions of a high negative value of the clamp potential, resulting in high transport rates of Na+ and sugar. Then the influx of osmolytes was reduced by shifting the clamp voltage to a low value. Finally, the cotransporter was inactivated by removal of the sugar, and the oocyte were allowed to swell osmotically under the gradient that had been build up.
In Fig. 7 the experimental results for an rSGLT1-expressing oocyte are compared with the behaviour of the model, given the same values of Lp, Is and coupling ratio. The best fit was obtained for a value of the free volume ratio (VF/VT) of 0.3. From tests in five oocytes, VF/VT was determined to be 0.28 ± 0.02, saturating values of Is were between 700 and 1300 nA, Lp was 6.5 ± 1.1 × 10⁻⁴ cm s−1, with coupling ratios of 310 ± 3 water molecules per two Na+ and one sugar molecule; (data from three oocytes in 90Na+-medium and 2 mmol l−1 αMDG and two oocytes in 50Na+-medium and 5 mmol l−1 αMDG). It should be noted that the swelling during the final phase with no sugar present is entirely osmotic and critically dependent on the value of VF/VT and the hyperosmolarity of the solution transported by the cotransporter. From tests in four hSGLT1-expressing oocytes, VF/VT was determined to be 0.30 ± 0.06; saturating values of Is were between 700 and 1150 nA, Lp was 2.9 ± 0.4 × 10⁻⁴ cm s−1, with coupling ratios of 188 ± 13 water molecules per two Na+ and one sugar molecule in 50Na+-medium, 5 mmol l−1 αMDG.
Figure 7. Simulation of JH2O during changes in clamp voltage in SGLT1-expressing oocytes.
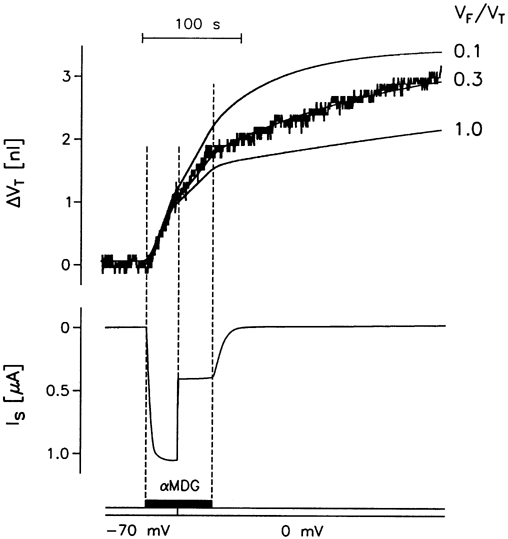
An rSGLT1-expressing oocyte was exposed to isotonic addition of 2 mmol l−1 αMDG at a clamp voltage of -70 mV. Within about 10 s this resulted in a clamp current Is of 1140 nA. After 30 s the clamp was shifted to 0 mV and Is fell to 450 nA. After 65 s the sugar was removed. The Is trace gives the sugar-activated component of the current corrected for sugar-independent leakage current. The corresponding change in oocyte volume ΔVT is given in the upper, jagged, trace and compared with the prediction of the simple model (Fig. 1B) shown as the smooth curves. The best fit was obtained with a free volume fraction VF/VT of 0.3. The Lp was 9.4 × 10⁻⁴ cm s−1 or 1.7 × 10⁻⁵ cm s−1 (osmol l−1)−1 and the coupling ratio was 315 water molecules per two Na+ and one sugar molecule.
Uphill water transport
The capacity for uphill transport by the SGLT1 can be tested by exposing the oocyte to a hyperosmolar solution and at the same time activating the cotransport by sugar under clamped conditions. This has been investigated for rSGLT1 (Zeuthen et al. 1997) and hSGLT1 (Meinild et al. 1998a). The general finding was that it took osmotic gradients of 10-20 mosmol l−1 to generate an osmotic efflux of water that matched the cotransported influx of water. The experiments performed on hSGLT1 by Meinild et al. (1998a, Fig. 2) are simulated in Fig. 8, and the best fit was obtained for VF/VT equal to 0.3.
Figure 8. Simulation of uphill water transport.
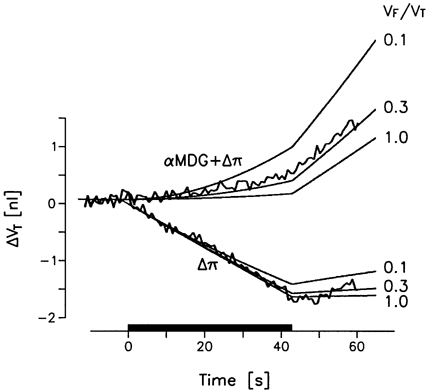
Upper curves, under voltage clamp conditions an hSGLT1-expressing oocyte was exposed simultaneously to 10 mmol l−1 sugar (αMDG) and an extracellular hyperosmolarity (Δπ) of 10 mosmol l−1. Uphill water transport is demonstrated by the swelling of the oocyte (ΔVT, jagged curve). The challenge was kept up for 42 s (filled horizontal bar). Lower curves, the same oocyte was exposed to extracellular hyperosmolarity (Δπ) of 10 mosmol l−1 alone (no sugar) and shrank as shown by the jagged curve. Both experiments could be simulated by the simple model in Fig. 1B (smooth curves) with a free volume fraction VF/VT of about 0.3. Experimental data for an hSGLT1-expressing oocyte with a saturating Is of 2.0 μA and an Lp of 9.4 × 10⁻⁶ cm s−1 (osmol l−1)−1 (data from Meinild et al. 1998a).
Volume changes induced by Na+ fluxes through gramicidin
In order to test the ability of Na+ fluxes per se to generate an influx of water, gramicidin was inserted into hSGLT1-expressing oocytes. By clamping the oocytes to a potential between -90 and -150 mV, inward currents of 600 to 1500 nA carried by Na+ ions were generated for periods of up to 600 s (data from 5 oocytes in 50Na+-medium). An example is shown in Fig. 9. The oocytes were characterized by sugar-activated currents of 500-950 nA when exposed to 5 mmol l−1 αMDG at clamp potentials of -50 mV and bathed in 50Na+-medium. However in the present experiments, the cotransporter was kept inactivated by the absence of sugar. The Lp of the SGLT1-expressing oocytes was 3.4 ± 0.3 × 10⁻⁴ cm s−1(5), and gramicidin did not affect the Lp (Zeuthen et al. 1997).
Figure 9. Simulation of swelling of oocytes treated with gramicidin.
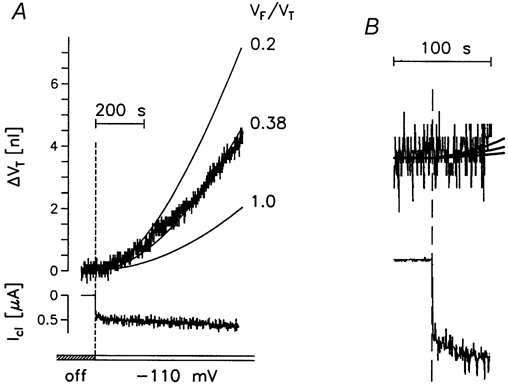
A, the oocyte expressed hSGLT1, but the transporter was kept inactivated by the absence of sugar. An inward current Icl, carried by Na+ ions, was initiated by clamping the oocyte to -110 mV in 50Na+-medium. The small increase in ICl in the subsequent test period was caused by continued insertion of gramicidin. The swelling of the oocyte (ΔVT) is predicted by the simple model (Fig. 1B), if it is assumed that the free fraction of the cytoplasm (VF/VT) is 0.38. B, expanded version of the initial 60 s of the volume change and clamp current.
The experiments could be fitted to the model of Fig. 1B, with a free volume fraction (VF/VT) of 0.33 ± 0.04 (5). The simulation supports the finding that the initial volume changes are small and only become significant after about 30 s. After prolonged current flow, the rate of volume increase will achieve a steady state (Zeuthen et al. 2001). Extrapolation using the model shows that for the present group of oocytes this would be achieved after 2500-3000 s with a rate of 56.6 ± 8.7 pl s−1(5). The rate obtained after 600 s (the duration of the present experiments) is approximately half this value. These data support previous findings in rSGLT1 (Zeuthen et al. 1997, 2001) and hSGLT1 (Meinild et al. 1998a) bathed in 90Na+-medium.
Effects of ethanol and phlorizin
Continued application of sugar under voltage-clamp conditions leads to a steady state rate of oocyte swelling in SGLT1-expressing oocytes (Duquette et al. 2001; Zeuthen et al. 2001). Phlorizin inhibits the current and, in our experiments, caused a simultaneous abrupt decrease in the rate of swelling (Zeuthen et al. 2001). However, Duquette et al. (2001) observed a slow and gradual change in the rate of swelling and took this as evidence for the presence of unstirred layers. They added phlorizin to the test solutions from a concentrated stock solution in ethanol (20 mmol l−1). To achieve phlorizin concentrations of 100 μmol l−1, the final concentration of ethanol in the solutions became 0.5 %. In the experiments of Zeuthen et al. (2001), phlorizin was dissolved directly in the test solutions without using ethanol. We therefore investigated whether the presence of ethanol in the test solutions used by Duquette et al. (2001) could explain the difference between our results.
The specific effects of 0.5 % ethanol were first tested in native oocytes. Ethanol induced an initial rate of swelling of 16 ± 2 pl s−1 (double determinations in three oocytes). Over a period of 2 min, the rate of swelling gradually decreased, resulting in a final volume increase of about 1 nl. The effects of ethanol were reversible (Fig. 10A).
Figure 10. Effects of ethanol on oocyte volume.
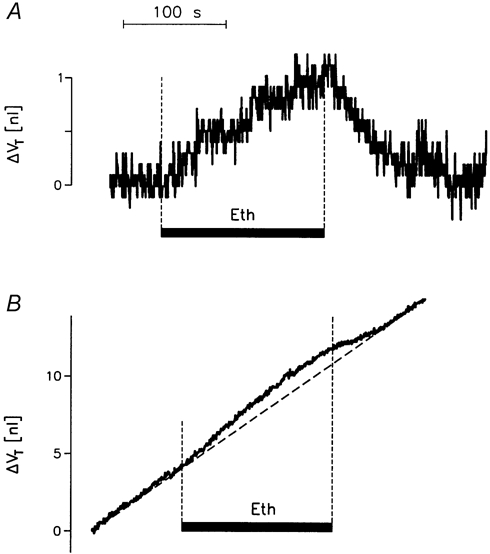
A, a native oocyte was bathed in control solution (50Na+-medium). Ethanol (0.5 %) was added to the bathing solution during the period marked by the filled horizontal bar (Eth). B, an hSGLT1-expressing oocyte was exposed to 5 mmol l−1 αMDG under voltage-clamp conditions (-50 mV in 50Na+-medium). This gave a clamp current of 820 nA (not shown) and, after about 10 min, a constant rate of volume increase of 34 pl s−1 as indicated by the dashed line. Ethanol (0.5 %) was added to the bathing solution during the period marked by the filled horizontal bar (Eth). This resulted in an additional volume increase. After the removal of ethanol, the rate of volume change returned to the pre-ethanol value.
The effects of ethanol and phlorizin were tested in five oocytes expressing hSGLT1. When exposed to 5 mmol l−1 αMDG at a clamp potential of -50 mV in 50Na+-medium, the oocytes had clamp currents (Is) in the range 650-1100 nA. After 5-10 min of sugar transport, when the oocytes had achieved a constant rate of swelling (range 25-60 pl s−1), we tested the effects of (i) 0.5 % ethanol, (ii) 100 μmol l−1 phlorizin, and (iii) 0.5 % ethanol plus 100 μmol l−1 phlorizin. The data showed that (i) ethanol induced an extra volume increase similar to that observed in the native oocytes, Fig. 10B. In the 1st min, ethanol increased the swelling rate by 35 ± 5 % (5) after which the rate stabilized at the pre-ethanol level. In addition, ethanol affected the SGLT1 by reducing Is by 5.5 ± 1.0 % (5). (ii) Phlorizin alone caused an abrupt decrease of 64 ± 3 % in the rate of swelling; the change was apparent within 5 s, at which time the current had been abolished by about 75 % (Fig. 11A). (iii) The combined application of ethanol and phlorizin abolished the clamp current with a time course similar to that in the presence of phlorizin alone, but had no initial effects on the rate of swelling (Fig. 11B). Only after about 32.5 ± 6.0 s did the rate begin to decrease significantly. The average decrease in oocyte volume observed for the first 60 s after the addition of phlorizin plus ethanol was 20 ± 6 %. This slow response is close to that expected from the sum of the individual effects of ethanol and phlorizin.
Figure 11. Effects of phlorizin, and of phlorizin plus ethanol, on SGLT1-induced oocyte swelling.
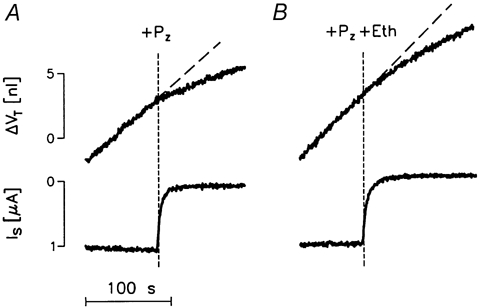
An hSGLT1-expressing oocyte was exposed to 5 mmol l−1 αMDG under voltage-clamp conditions (-50 mV in 50Na+-medium). This gave a clamp current of 1100 nA (not shown) and, after about 10 min, a constant rate of volume increase of 55 pl s−1 as indicated by the dashed line. A, at the vertical line (+Pz), 100 μmol l−1 of phlorizin was added. This resulted in an immediate decrease in the rate of swelling, simultaneous with the elimination of the sugar-induced current Is. B, the combined effects of 100 μmol l−1 phlorizin and 0.5 % of ethanol were tested on the same oocyte (+Pz+Eth). This abolished Is but had no immediate effect on the rate of volume change. Only after 30 s did the volume change begin to gradually decrease.
DISCUSSION
The interpretation of experiments on transport proteins expressed in Xenopus oocytes has recently become the focus of intense debate. Duquette et al. (2001) and Lapointe et al. (2001, 2002) have suggested that if the diffusion of the transported substrates is sufficiently impeded inside the cells, the derived transport parameters cannot be attributed entirely to the membrane protein, and that changes in concentration just inside the membrane must be taken into account. The question is of general relevance for all membrane transporters (i.e. aquaporins). The following discussion will be centred upon the Na+-glucose transporter SGLT1.
Models with unstirred layers
According to the hypothesis of Duquette et al. (2001), SGLT1-mediated water flow across oocyte membranes is entirely explained by unstirred layer effects. Na+ and sugar are accumulated just inside the membrane during transport and pull water across by osmosis. Accordingly, there would be no need for cotransport of water by the SGLT1 (for references see Introduction).
In order to test their hypothesis, Duquette et al. (2001) have set up a model that consists of a plasma membrane and a homogeneous cytoplasm. Water transport across the membrane is governed by osmosis, while water, ions and smaller molecules move in the cytoplasm by diffusion. In order to achieve sufficiently large unstirred layers, the authors had to assume very low values for the intracellular diffusion constant (D), that is, between 0.12 × 10⁻⁵ and 0.04 × 10⁻⁵ cm2 s−1. This is 10 to 37 times lower than D for Na+ in free solution and 5 to 15 times lower than D for sugar (αMDG) in free solution. As discussed in detail below, such low values for D are unlikely. First, they conflict with data from Xenopus oocyte cytoplasm where D for Na+ and for αMDG are measured or estimated to be large, about two thirds of the free solution values. Second, they conflict with the data on the intracellular specific resistance (Fig. 2 and Fig. 3). Finally, they conflict with generally accepted models of the intracellular compartment (Keynes & Hodgkin, 1953; Katz, 1966; Hoffman, 1986).
There are two additional assumptions in the model used by Duquette et al. (2001) and Lapointe et al. (2001, 2002). First, the oocyte was found by drying to consist of 85 % H2O and it was assumed that all this water served as a compartment for the incoming Na+, sugar and H2O. This is unrealistic, as some of the water removed by drying the oocyte must originate from inside organelles. The assumption leads to an underestimation of the osmotic effects of cotransport. If Na+ and sugar are assumed to enter the larger volume, the final osmolarity will be underestimated. Second, it was assumed that the clamp-current electrode gave rise to a net influx of ions concomitant with the SGLT1-generated flux. As a result, the number of osmolytes that enter the oocyte per sugar molecule (nαMDG) would be larger than the three transported by the SGLT1 itself (two Na+ and one αMDG). Duquette et al. (2001) and Lapointe et al. (2001) assume nαMDG to have a value between 4 and 5. This, in turn, would increase the putative osmotic effects by a factor of up to 1.7. However, as discussed in conjunction with Table 2, the data of Duquette et al. (2001) and those of Zeuthen et al. (2001) both show that nαMDG for hSGLT1 is close to 3, implying no significant electrode artefacts.
Table 2.
Determination of influx of osmolytes from the clamp electrode (Jelec)
| JSGLTa(10−12 mol s−1) | JSGLT + JELECb(10−12 mol s−1) | ||
|---|---|---|---|
| hSGLT1 | 7.8 ± 2.5 (5) | 9.0 ± 1.4 (5) | Zeuthen et al. (2001) |
| hSGLT1 | 12.0 | 10.2 | Duquette et al. (2001) |
| Gramicidin | 11.8 ± 1.6 (5) | 12.5 ± 2.0 (5) | Present data |
JSGLT is determined from the average clamp current times Faraday's constant (F, 105 Q mol−1). In the case of the hSGLT1, this is multiplied by 1.5, given the stoichiometry of the hSGLT1 of 1.5 osmolytes transported per unit charge.
JSGLT + JELEC is the product of the steady state swelling and the intracellular osmolarity. Given an oocyte surface area of 0.4 cm2, the steady state influx of water obtained by Duquette et al. (2001) was 48 pl s−1. During this swelling the intracellular osmolarity could be estimated as 213 mosmol l−1 (197 mosmol l−1+ 16 mosmol l−1). The 197 mosmol l−1 is the osmolarity of the external solution and the 16 mosmol l−1 is the gradient required to drive the entire water flux by osmosis, given their Lp value of 3.8 ± 10−4 cm s−1. Accordingly, JSGLT + JELEC is 10.2 ± 10−12 mol s−1 (i.e. 48 pls−1± 0.213 osmol l−1). A similar calculation was performed using the data of Zeuthen et al. (2001).
Finally, the unstirred layer model has not explained several key experimental findings, for example: (i) the abrupt onset of water transport induced by isosmotic application of sugar (Fig. 1 of Meinild et al. 1998a); (ii) the rapid shifts in JH2O observed when the clamp potential is changed abruptly (Figs 6A, 7 and 8; Fig. 4 in Zeuthen et al. 2001; Fig. 3 in Duquette et al. 2001; Fig. 1 in Lapointe et al. 2002); and (iii) the lack of initial volume changes in the case of channel-mediated transport (Fig. 5; Fig. 4 in Duquette et al. 2001).
Mobility of ions and organic molecules in the cytoplasm
The ion activities in the cytoplasm of Xenopus oocytes obtained with ion selective microelectrodes or from equilibrium potentials are (mmol l−1): 6-22.5 for Na+, 93-150 for K+, and 33-65 for Cl− (Kusano et al. 1982; Lotan et al. 1982; Barish, 1983; Dascal et al. 1984; for review see Dascal, 1987). These values represent chemically unbound ions, free to diffuse or to migrate in an electrical field. The similarity between the estimates from the two methods indicates that the ions are in the same free conditions in the cytoplasm as at the immediate inside of the plasma membrane.
The average ionic activities derived from the above studies are 122 mmol l−1 for K+, 49 mmol l−1 for Cl−, and 14 mmol l−1 for Na+. Given the equivalent conductivities for the individual ion species (Robinson & Stokes, 1970) a specific resistance of 86 Ω cm would be predicted, which is slightly lower than that of the external Kulori medium (105 Ω cm). However, the measured specific resistance of the cytoplasm (Ri), was 3 times higher at 263 Ω cm (Fig. 2 and Table 1). In this, the resistive properties of the Xenopus cytoplasm resembles that of a variety of animal cells, including eggs, nerve, muscle, erythrocytes and tumour cells, from mammals, amphibians, squid and crustaceans (Cole, 1928b; Hodgkin & Keynes, 1953; Katz, 1966; Hoffman, 1986; and references in Table 1). The general conclusion has been that the increase in intracellular resistivity is due to larger proteins, non-solvent particles and organelles that do not contribute to current flow but rather present obstacles to it (Appendix). In the Xenopus oocyte the densely packed melanin and cholesterol (yolk) granules are particularly dominant (Terasaki et al. 2001). The nucleus may not present an electrical obstacle; nuclei have ion activities similar to the free fraction of the cytoplasm and nuclear envelopes have low electrical resistances (Palmer & Civan, 1977). In addition, 90 % of the nuclear water in Xenopus oocytes exists as free mobile water (Päuser et al. 1995; Sehy et al. 2001). It is interesting that Ri of oocytes bathed in 50Na+-medium was similar to Ri of oocytes bathed in Kulori medium. Apparently, the requirement for osmotic equilibrium across the plasma membrane leads, under these conditions, to an ionic strength that is larger inside than outside.
Table 1.
Specific resistances (R) and diffusion constants (D) in cytoplasm (i) and external solutions (e)
| Ri(Ω cm) | Re(Ω cm) | Ri/Re | DNa+,i(cm2 s−1) | DNa+,e(cm2 s−1) | |
|---|---|---|---|---|---|
| Xenopus oocyte | 263 | 105a | 2.5a | 0.8 × 10⁻⁵b | 1.2 × 10⁻⁵c, d |
| Frog muscle | 200e | 87e | 2.3e | 0.6 × 10⁻⁵c | 1.2 × 10⁻⁵c, d |
| Mammalian erythrocyte | 140f | 70f | 2.0f | ||
| 170–230g | 70g, h | 2.4–3.3g | |||
| Ehrlich ascites tumour cells | 76h | 70h | 1.1h |
Present study (external solution, Kulori medium).
fdetermined at frequencies of 2 to 3 kHz. h and gdetermined at 30 to 250 MHz (microwaves). The other estimates are performed at DC (0 Hz).
An alternative interpretation of the resistance data would be to assume a low D for ions in a large free volume. However, this would require that the diffusion process be impeded by significant binding of the ions to fixed structures in the cytoplasm (Ling, 1984). This mechanism has relevance for Ca2+ but not for Na+, K+ or Cl− (Allbritton et al. 1992).
Our estimate of the reduced intracellular mobility is in close agreement with direct measurements of the diffusion constant (D) in Xenopus oocyte cytoplasm (Allbritton et al. 1992). Measured values of D were: for Na+, 0.79 × 10⁻⁵ cm2 s−1; for inositol 1,4,5-trisphosphate (InsP3, of molecular weight (MW) 420), 0.28 × 10⁻⁵ cm2 s−1; and for immunoglobulin G, 0.027 × 10⁻⁵ cm2 s−1. These values are between two-thirds and one-half the free solution values, where D for Na+ is 1.2 × 10⁻⁵ cm2 s−1 (Kusmerick & Podolsky 1969). Similar values apply for muscle fibres where D for K+, Na+, SO42-, sorbitol (MW 182), sucrose (MW 342) and ATP3- were all half the extracellular values (see Longsworth, 1953; Kushmerick & Podolsky, 1969; Table 1). The fact that the diffusivities of the principal ions are reduced by the same amount as the non-electrolytes supports the notion that the transport properties of the ions are not affected by specific chemical interactions. The ions have the same diffusion path as the non-electrolytes and the retardation in both cases is due to physical obstacles rather than specific chemical reactions. These considerations are corroborated by the fact that macromolecules are separated by about 30 Å (3 nm) by hydration forces originating from surface layers of water and that this water is available to smaller molecules (Leikin et al. 1993). Accordingly, studies with fluorescent probes show that molecules of a radius less than 15 Å move in cytoplasm almost as in free solution (Fushimi & Verkman, 1991), while molecules with radii larger than 30 Å have diffusion constants about 30 % of that in free solutions (Luby-Phelps et al. 1987, 1993).
The diffusion coefficient of the sugar αMDG (MW 194), employed in the present study, can be estimated to be 0.36 × 10⁻⁵ cm2 s−1, using interpolation of the values above and the fact that D is inversely proportional to (MW)1/3. This diffusion coefficient is two-thirds of the free solution value (Longthsworth, 1953) and is in close agreement with the values obtained for the similarly sized sugar sorbitol (0.65 × 10⁻⁵ cm2 s−1) and for the disaccharide sucrose (0.45 × 10⁻⁵ cm2 s−1) in muscle (Kushmerick & Podolsky, 1969). This confirms our previous estimate that the mobility of αMDG in the oocyte is close to that of Na+ ions (Zeuthen et al. 2001). It also justifies our previous choice of parameters for the analysis of unstirred layer effects (Loo et al. 1996).
The analysis above is supported by NMR studies of the distribution and mobility of water in the cytoplasm of Xenopus oocytes. Between 45 and 75 % of the water was free mobile water with a value of D that varied between 27 and 41 % of the free solution value. In the nucleus, most of the water was free and the value of D was 82 % of the free solution value (Päuser et al. 1995; Sehy et al. 2001).
Our estimate for the ratio of intracellular to extracellular resistance is slightly lower than the estimate of five obtained by Baumgartner et al. (1999). These authors employed frequency analysis of the impedance of a suspension of oocytes (range 100 Hz-2 MHz), and the cytoplasmic conductance was derived indirectly from fitting the data to a theoretical expression derived by Maxwell (1881) and Cole (1928a). The method relies on a number of simplifying assumptions, one of which was not fulfilled in the study of Baumgartner et al. (1999). The theoretical expression applies only to dilute cell suspensions in which the deformations of the applied field caused by one cell does not affect the neighbour. In the frequency range employed, the method may not apply to a high-density suspension of conducting cells. This may be why Baumgartner et al. (1999) obtained a volume fraction of their oocytes of 0.79, which is higher than the maximal value of 0.74 for identical spheres. The estimate by Baumgartner et al. (1999) is probably too high because measurements on packed erythrocytes led to values of Ri up to four times too high (Cole, 1942). It should be noted that the equation presented by Baumgartner et al. (1999, eqn (36)) is in error. It stems from previous data (Cole, 1928a) but, as written, confuses conductances and resistances.
In conclusion, the cytoplasm of the Xenopus oocyte was similar to that of other animal cells in respect of the mobility of ions and smaller organic molecules. The assumption of atypically low diffusion constants (Duquette et al. 2001; Lapointe et al. 2001, 2002) is contradicted by the available evidence and the present data.
No significant unstirred layers effects in the cytoplasm
There are several lines of evidence to suggest that there are no significant unstirred layer effects in the oocyte. (i) JH2O changed abruptly with changes in clamp potential (Fig. 6A and Fig. 7, and Zeuthen et al. 2001). (ii) Ion fluxes generated by ionophores gave rise to no initial water fluxes (Fig. 9; and Zeuthen et al. 1997; Meinild et al. 1998a; MacAulay et al. 2001; Zeuthen et al. 2001). (iii) Phlorizin produced abrupt changes in the rate of sugar-induced oocyte swelling in SGLT1-expressing oocytes (Fig. 11; and Zeuthen et al. 2001). (iv) The change in Ri taken near the centre of the oocyte followed the increase in volume with a delay of about 20 s (Fig. 3). In model calculations, assuming intracellular diffusion constants as low as 0.04 × 10⁻⁵ cm2 s−1, delays of more than 300 s were predicted (Fig. 2 of Lapointe et al. 2001). Since D and time t only appear in the solution to the diffusion equation as the product Dt (Crank, 1970), a delay of only 20 s suggests that the real D is more than 15 times higher than 0.04 × 10⁻⁵ cm2 s−1, (i.e. larger than 0.6 × 10⁻⁵ cm2 s−1), in agreement with the values discussed above (Table 1).
These experiments can be analysed theoretically. The specific case of a spherical cell with a constant influx at the membrane has been analysed by (Crank (1970, Fig. 6.6). Assume a sugar-induced clamp current of 1000 μA. This is equivalent to an influx of 15 nmol s−1 considering that one sugar molecule is transported per two Na+ ions. With a diffusion constant of 0.5 × 10⁻⁵ cm2 s−1, a VF/VT of 0.3, and an oocyte diameter of 0.13 cm giving an effective surface area of 0.053 cm2, the excess osmolarity at the inside of the membrane is calculated to increase to 0.9 mosmol l−1 after 8.5 s and to about 2.2 mosmol l−1 after 42 s For both the hSGLT1 and the rSGLT1 it would require the build up of about 6 mosmol l−1 in order to explain the JH2O by osmosis (Table 1 of Zeuthen et al. 2001). Accordingly, the theoretical treatment predicts that a significant unstirred layer gradient can accumulate within the 1st min. However after about 40 s, the gradient only represents one-third of that required to explain the initial value of JH2O. If the concomitant influx of water is taken into account the calculated values would be smaller.
A simple model of the oocyte
The data from the resistance measurements (Fig. 3 and Appendix), the osmotic experiments (Fig. 4 and Fig. 5) the cotransport experiments (Figs 6-8), and the gramicidin experiments (Fig. 9) were all consistent with the simple model of the oocyte outlined in Fig. 1B and Appendix. In this model, the oocyte volume has two fractions. In the free fraction (VF), smaller ions and molecules behave as in free solution and interact directly with the external solution via the plasma membrane. The relevant concentrations remain uniform throughout VF during experiments. VF constitutes on average 37 ± 17 % (s.d., n = 66) of the total oocyte volume VT. The inert fraction of volume (VI = VT – VF) consists of organelles and larger molecules. With regard to organelle volumes, the melanin and yolk granules form by far the largest fraction, that is about 50 % in cross-section (Terasaki et al. 2001). These granules are tightly packed with melanin or cholesterol and it is a fair assumption that their volume remains constant during transport experiments focused on the plasma membrane.
The model explains several specific experimental observations for both the osmotic and the cotransport experiments. In the osmotic experiments (Fig. 4 and Fig. 5) we used rabbit SGLT1 and obtained very close fits for values of VF/VT of around 0.4. Data obtained with hSGLT1 (Fig. 2 of Lapointe et al. 2001), could also be fitted closely using a value of VF/VT of 0.4. In the cotransport experiments, the SGLT1 was activated by the isotonic addition of sugar to the external solution under voltage-clamp conditions. On our model, this leads to an immediate influx of water by cotransport (i.e. coupled to the influx of Na+ and sugar by a mechanism within the protein). Since the cotransported solution is hypertonic, an osmotic gradient will build up gradually, leading to a parallel osmotic flux that will continue after external sugar has been removed. For rSGLT1 and hSGLT1 a close fit between experiment and model was obtained for values of VF/VT of around 0.3. Similar experiments using hSGLT1 (Fig. 3 of Duquette et al. 2001) could be fitted by a value of VF/VT of 0.4. The model also simulates uphill water transport given VF/VT of around 0.3 (see Fig. 8).
It is an underlying assumption in the model that the net flux into the oocyte is given by the membrane transport, and that any net flux of osmolytes from the intracellular microelectrodes, in particular the clamp-current electrode, is small. This is supported by two findings. (i) Volume changes in the oocytes, whether induced by osmosis, where there are no currents (Fig. 4 and Fig. 5), or by experiments involving clamp currents (Figs 7-9), were all described by VF/VT ratios of 0.3-0.4. This implies that currents do not affect the intracellular osmolarity significantly. (ii) The flux of osmolytes from the intracellular microelectrode can be estimated from the steady state swellings induced by prolonged applications of clamp currents (Duquette et al. 2001; Zeuthen et al. 2001; and see Table 2). The total number of osmolytes entering the oocyte is the sum of the flux through the SGLT1 (JSGLT) and the flux through the clamp electrode (JELEC). In steady state experiments the sum (JSGLT + JELEC) is given by the rate of swelling, while JSGLT alone is given by the clamp current. JELEC is obtained as the difference between the two estimates. From the data on hSGLT1 of Duquette et al. (2001, Fig. 2) it can be calculated that the flux of osmolytes into the oocyte is predominantly determined by the cotransporter; there is an efflux via the electrodes of about 15 % of flux carried by the hSGLT1. A similar calculation using the hSGLT1 data (Table 1) from Zeuthen et al. (2001) showed no significant flux component through the electrode. Both sets of data clearly suggest that electrode artefacts are small. There was also no evidence of electrode artefacts in experiments using ionophores. The steady state swellings estimated from the gramicidin experiments (Fig. 9) were close to those estimated from the clamp current (Table 2).
These observations are explained, at least in part, by the properties of microelectrodes filled by high concentrations of KCl. Two facts must be considered: (i) in a given cross-section of the clamp-current microelectrode the concentrations of K+ and Cl− are the same; this applies to most of the electrode. At the onset of the clamp both K+ and Cl− will experience the same electrical potential gradient and the ions will migrate in the electrical field at the same rate but in opposite directions, each contributing half the current. (ii) At the internal Ag-AgCl electrode the total current will be made up from Cl− ions entering into the microelectrode solution (positive current into the electrode). It follows that the concentration of KCl inside the microelectrode will begin to increase when the clamp current is switched on. However, it is important to note that the rate of increase is very slow indeed. With an inward clamp current of 1000 nA applied for 10 min and an electrode volume of 20 μl the average concentration would increase by 0.3 mmol l−1. Considering that the electrode is filled initially by 1 mol l−1 KCl it would take a long time before any concentration gradient of KCl inside the current injecting microelectrode is increased enough to increase the diffusive efflux from the electrode significantly. Accordingly, the inward clamp current is maintained by equal and opposite fluxes of K+ and Cl− and practically no net osmotic flow from the current injecting microelectrode is induced by the clamp current.
Experimental discrepancies
Some of the experimental data reported by Duquette et al. (2001) and Lapointe et al. (2001, 2002) are in agreement with those of Meinild et al. (1998a) and Zeuthen et al. (2001). This applies in particular to those defining the role of the SGLT1 as a passive water channel and to the delayed volume changes induced by ion fluxes. The time required for solution changes in the studies of Duquette et al. (2001) is stated to be 15-20 s for an 80 % change. This is slower than that employed by Zeuthen et al. (1997), where changes were 90 % complete in 5-7 s or 80 % in 3-5 s Furthermore, we correlated the changes in volume to the integrated current (Meinild et al. 1998a; Zeuthen et al. 2001). The differences in approach complicate a comparison between the experiments of the two laboratories, in particular those associated with shifts between isotonic bathing solutions. Two other points of discrepancy will be discussed below: (i) the use of ethanol in connection with the application of phlorizin, and (ii) the value of the clamp current obtained at low clamp voltages.
Effects of phlorizin and ethanol
In SGLT1-expressing oocytes, continued application of sugar under voltage-clamp conditions leads to a steady state swelling (Duquette et al. 2001; Zeuthen et al. 2001). Phlorizin reduces the rate of swelling, and a precise measurement of the time course of the reduction, combined with measurements of Lp values before and after phlorizin inhibition, has been used to diagnose the underlying mechanisms of water transport (Duquette et al. 2001; Zeuthen et al. 2001). Roughly speaking, the larger the change in the rate of swelling induced by phlorizin, the larger the cotransport component of water transport. In our hands, phlorizin induces an abrupt change in swelling, closely associated with the elimination of the clamp current (see Fig. 11A; and Zeuthen et al. 2001). This suggests a significant component of water cotransport as discussed quantitatively in the paper by Zeuthen et al. (2001). In contrast to this, Duquette et al. (2001) report a curvilinear change in volume following inhibition by phlorizin. Furthermore, inspection of their Fig. 2 indicates that the decrease in rate of volume change commences about 20 s after the application of phlorizin.
The difference arises from the fact that Duquette et al. (2001) added phlorizin from a stock solution in ethanol, while we added phlorizin directly. Accordingly, the oocytes employed by Duquette et al. (2001) were exposed to 0.5 % ethanol at the same time as phlorizin. We have shown in the present study that 0.5 % ethanol itself induces an initial increase in oocyte volume that is numerically similar to the decrease induced by phlorizin. Duquette et al. (2001) interpreted the combined effects of phlorizin and ethanol as arising from phlorizin alone. This error will result in a serious underestimate of the immediate effects of phlorizin on water transport, which may even appear to be absent (see Fig. 11B). As a result, Duquette et al. (2001) erroneously estimated the cotransport component of water transport to be negligible, and therefore seriously overestimated the osmotic mode of water transport.
Clamp voltages and sugar-activated currents (Is) in hSGLT1
The data in the present paper conflict with those of Duquette et al. (2001) and Lapointe et al. (2001, 2002) in respect to the value of Is as a function of clamp voltage. At clamp voltages of 0 mV we observed relatively large values for Is, equivalent to about 30 % of the Is obtained at -100 mV (Fig. 6C), while Lapointe and coworkers, under identical external conditions, observed an Is of only 6 %. Under slightly different conditions, Quick et al. (2001) recorded values of Is at 0 mV of 30 % those recorded at -100 mV, while Chen et al. (1995) obtained values of 10-15 %. A small value of Is at a clamp potential of 0 mV means that the hSGLT1 is close to its reversal potential at this voltage. One possibility is that Duquette et al. (2001) and Lapointe et al. (2001, 2002) employed oocytes with relatively high intracellular concentrations of sugar and Na+.
Conclusions
By analogy to the cytoplasm of other cell types, the mobility in Xenopus oocyte of Na+ and smaller organic molecules is reduced by a factor of about two relative to the outside solution. The reduction stems from steric hindrance due to organelles etc. which fill up about two-thirds of the volume. In regard to experiments on SGLT1 expressed in the plasma membrane, this cytoplasm cannot support significant unstirred layers. A model based on these features predicts most experiments performed so far by us and by Duquette et al. (2001) and Lapointe et al. (2001, 2002) on the SGLT1, provided that the SGLT1 is considered to act as a molecular water pump.
Acknowledgments
We thank the Danish Research Council and the Novo-Nordisk Foundation for financial support. The technical assistance of Tove Soland, Birthe Lynderup and Svend Christoffersen is gratefully acknowledged. Drs Nanna MacAulay and Steffen Hamann, and Professor Ernest M. Wright are thanked for valuable scientific discussions. Professor E. M. Wright (University of California, Los Angeles, CA, USA) kindly provided the clones for the SGLT1.
APPENDIX
1. A simple model of the oocyte
The cytoplasm, of total volume VT, consists of two fractions. In the free fraction VF, the ions and molecules are free to move and the osmolarity equals that of the external control solution, which is typically 213 mosmol l−1. VF interacts with the extracellular solution via the plasma membrane. The remainder of the oocyte, of volume VI (i.e. VT – VF) is inactive and just takes up space (Fig. 1B). In osmotic experiments where the external osmolarity (Osme) was changed abruptly by between -100 and + 300 mosmol l−1 (Fig. 4 and Fig. 5), volume changes are described by:
| (A1) |
where VT(t) is the total volume and VF(t) is the free volume, both as a function of time t, the number of osmotically active particles in the free volume (MF), equals the product of the osmolarity of the external solution (Osme) and the free volume (MF = OsmeVF(t = 0)), Lp is the passive water permeability and A the surface area of the oocyte. In ion flux and cotransport experiments (Figs 6-9) the volume changes are given by:
| (A2) |
where Js is the influx of osmolytes and JH2O, CO is the cotransport of H2O maintained by the SGLT1.
2. Heterogeneous volume fractions and overall resistance
There is a close relationship between the free volume fraction of the oocyte cytoplasm VF/VT and the specific resistance Ri of the cytoplasm. The specific resistance in the free volume fraction (Rf) is assumed to equal that given by the activities of the electrochemically free ions (86 Ω cm). Ri will be increased relative to Rf due to the presence of the non-conducting volume fraction (Fig. 1B). The increase depends on two factors; the free volume fraction and a tortuousity factor (τ) which describes the pathway of the current. Accordingly, Ri/Rf = VT/VFτ. A quantitative estimate is obtained from Maxwell's treatment of a suspension of homogeneous spheres (Maxwell, 1881), which for insulating spheres takes the form:
| (A3) |
With an Rf value of 86 Ω cm and VF/VT of 0.4, Ri is predicted to be 279 Ω cm, which is in good agreement with the measured average of 263 Ω cm.
REFERENCES
- Allbritton NL, Meyer T, Stryer L. Range of messenger action of calcium ion and inositol 1, 4, 5-triphosphate. Science. 1992;258:1812–1815. doi: 10.1126/science.1465619. [DOI] [PubMed] [Google Scholar]
- Barish ME. A transient calcium-dependent chloride current in the immature Xenopus oocyte. Journal of Physiology. 1983;342:309–325. doi: 10.1113/jphysiol.1983.sp014852. [DOI] [PMC free article] [PubMed] [Google Scholar]
- Baumgartner W, Islas L, Sigworth FJ. Two-microelectrode voltage clamp of Xenopus oocytes: voltage errors and compensation for local current flow. Biophysical Journal. 1999;77:1980–1991. doi: 10.1016/S0006-3495(99)77039-6. [DOI] [PMC free article] [PubMed] [Google Scholar]
- Chen X-Z, Coady MJ, Jackson F, Berteloot A, Lapointe J-Y. Thermodynamic determination of the Na+: glucose coupling ratio for the human SGLT1 cotransporter. Biophysical Journal. 1995;69:2405–2414. doi: 10.1016/S0006-3495(95)80110-4. [DOI] [PMC free article] [PubMed] [Google Scholar]
- Cole KS. Electrical impedance of suspensions of spheres. Journal of General Physiology. 1928a;12:29–36. doi: 10.1085/jgp.12.1.29. [DOI] [PMC free article] [PubMed] [Google Scholar]
- Cole KS. Electrical impedance of suspensions of arbacia eggs. Journal of General Physiology. 1928b;12:37–54. doi: 10.1085/jgp.12.1.37. [DOI] [PMC free article] [PubMed] [Google Scholar]
- Cole KS. Impedance of single cells. Tabulae Biological. 1942;19:24–27. [Google Scholar]
- Crank J. The Mathematics of Diffusion. London: Oxford University Press; 1970. [Google Scholar]
- Dascal N. The use of Xenopus oocytes for the study of ion channels. CRC Critical Reviews in Biochemistry. 1987;22:317–387. doi: 10.3109/10409238709086960. [DOI] [PubMed] [Google Scholar]
- Dascal N, Landau EM, Lass Y. Xenopus oocyte resting potential, muscarinic responses and the role of calcium and guanosine 3′, 5′-cyclic monophosphate. Journal of Physiology. 1984;352:551–574. doi: 10.1113/jphysiol.1984.sp015310. [DOI] [PMC free article] [PubMed] [Google Scholar]
- Duquette P-P, Bisonnette P, Lapointe J-Y. Local osmotic gradients drive the water flux associated with Na+/glucose cotransport. Proceedings of the National Academy of Sciences of the USA. 2001;98:3796–3801. doi: 10.1073/pnas.071245198. [DOI] [PMC free article] [PubMed] [Google Scholar]
- Fushimi K, Verkman AS. Low viscosity in the aqueous domain of cell cytoplasm measured by picosecond polarization microfluorimetry. Journal of Cell Biology. 1991;112:719–725. doi: 10.1083/jcb.112.4.719. [DOI] [PMC free article] [PubMed] [Google Scholar]
- Hediger MA, Coady MJ, Ikeda TS, Wright EM. Expression cloning and cDNA sequencing of the Na+/glucose co-transporter. Nature. 1987;330:379–381. doi: 10.1038/330379a0. [DOI] [PubMed] [Google Scholar]
- Hodgkin AL, Keynes RD. The mobility and diffusion coefficient of potassium in giant axons from sepia. Journal of Physiology. 1953;119:513–528. doi: 10.1113/jphysiol.1953.sp004863. [DOI] [PMC free article] [PubMed] [Google Scholar]
- Hoffman JF. Active transport of Na+ and K+ by red blood cell. In: Andreoli TE, Fanestill DD, Hoffman JF, Schultz SG, editors. Physiology of Membrane Disorders. New York: Plenum Publishing; 1986. pp. 221–234. [Google Scholar]
- Katz B. The electrical properties of the muscle fibre membrane. Proceedings of the Royal Society. 1948;135:506–533. [Google Scholar]
- Katz B. Nerve, Muscle and Synapse. New York: Mcgraw-Hill Book Company; 1966. [Google Scholar]
- Kusano K, Miledi R, Stinnakre J. Cholinergic and catecholaminergic receptors in the Xenopus oocyte membrane. Journal of Physiology. 1982;328:143–170. doi: 10.1113/jphysiol.1982.sp014257. [DOI] [PMC free article] [PubMed] [Google Scholar]
- Kushmerick MJ, Podolsky RJ. Ionic mobility in muscle cells. Science. 1969;166:1297–1298. doi: 10.1126/science.166.3910.1297. [DOI] [PubMed] [Google Scholar]
- Lapointe JY, Gagnon M, Porier S, Bissonette P. The presence of local osmotic gradients accounts for the water flux driven by the Na+/glucose cotransporter. XXXIV Congress of the International Union of Physiological Sciences (Water Transport Controversies Synthesium) 2001 Abstract number 2532 (online only) [Google Scholar]
- Lapointe JY, Gagnon M, Porier S, Bissonette P. The presence of local osmotic gradients accounts for the water flux driven by the Na+/glucose cotransporter. Journal of Physiology. 2002;542:61–62. doi: 10.1113/jphysiol.2002.013328. [DOI] [PMC free article] [PubMed] [Google Scholar]
- Leikin S, Parsegian VA, Rau DC. Hydration forces. Annual Review of Physical Chemistry. 1993;44:369–395. doi: 10.1146/annurev.pc.44.100193.002101. [DOI] [PubMed] [Google Scholar]
- Ling GN. Search of the Physical Basis of Life. New York: Plenum Press; 1984. [Google Scholar]
- Longsworth LG. Diffusion measurements, at 25 C, of aqueous solutions of amino acids, peptides and sugars. Journal of the American Chemical Society. 1953;75:5705–5709. [Google Scholar]
- Loo DDF, Zeuthen T, Chandy G, Wright EM. Cotransport of water by the Na+/glucose cotransporter. Proceedings of the National Academy of Sciences of the USA. 1996;93:13367–13370. doi: 10.1073/pnas.93.23.13367. [DOI] [PMC free article] [PubMed] [Google Scholar]
- Lotan I, Dascal N, Cohen S, Lass Y. Adenosine-induced slow ionic currents in the Xenopus oocyte. Nature. 1982;298:572–574. doi: 10.1038/298572a0. [DOI] [PubMed] [Google Scholar]
- Luby-Phelps K, Castle PE, Taylor DL, Lanni F. Hindered diffusion of inert tracer particles in the cytoplasm of mouse 3T3 cells. Proceedings of the National Academy of Sciences of the USA. 1987;84:4910–4913. doi: 10.1073/pnas.84.14.4910. [DOI] [PMC free article] [PubMed] [Google Scholar]
- Luby-Phelps K, Mujumdar S, Mujumdar RB, Ernst LA, Galbraith W, Waggoner AS. A novel fluorescence ratiometric method confirms the low solvent viscosity of the cytoplasm. Biophysical Journal. 1993;65:236–242. doi: 10.1016/S0006-3495(93)81075-0. [DOI] [PMC free article] [PubMed] [Google Scholar]
- MacAulay N, Gether U, Klaerke DA, Zeuthen T. Water transport by the Na+-coupled glutamate cotransporter. Journal of Physiology. 2001;530:367–378. doi: 10.1111/j.1469-7793.2001.0367k.x. [DOI] [PMC free article] [PubMed] [Google Scholar]
- Maxwell JC. A Treatise on Electricity and Magnetism. London: Oxford At The Clarendon Press; 1881. [Google Scholar]
- Meinild A-K, Klaerke DA, Loo DDF, Wright EM, Zeuthen T. The human Na+/glucose cotransporter is a molecular water pump. Journal of Physiology. 1998a;508:15–21. doi: 10.1111/j.1469-7793.1998.015br.x. [DOI] [PMC free article] [PubMed] [Google Scholar]
- Meinild A-K, Klaerke DA, Zeuthen T. Bidirectional water fluxes and specificity for small hydrophilic molecules in aquaporins 0 to 5. The Journal of Biological Chemistry. 1998b;273:32446–32451. doi: 10.1074/jbc.273.49.32446. [DOI] [PubMed] [Google Scholar]
- Meinild A-K, Loo DFF, Pajor A, Zeuthen T, Wright EM. Water transport by the renal Na+/dicarboxylate cotransporter. American Journal of Physiology. 2000;278:F777–783. doi: 10.1152/ajprenal.2000.278.5.F777. [DOI] [PubMed] [Google Scholar]
- Palmer LG, Civan M. Distribution of Na+, K+ And Cl− between nucleus and cytoplasm in chironimus salivary gland cells. Journal of Membrane Biology. 1977;33:41–61. doi: 10.1007/BF01869511. [DOI] [PubMed] [Google Scholar]
- Pauly H. U¨ber die elektrische kapazität der zellmembran und die leitfähigkeit des zytoplasmas von ehrlich-aszitestumorzellen. Biofysik. 1963;1:143–153. [Google Scholar]
- Pauly H, Schwan HP. Dielectric properties and ion mobolity in erythrocytes. Biophysical Journal. 1966;6:621–639. doi: 10.1016/S0006-3495(66)86682-1. [DOI] [PMC free article] [PubMed] [Google Scholar]
- Päuser S, Zschunke A, Khuen A, Keller K. Estimation of water content and water mobility in the nucleus and cytoplasm of Xenopus laevis oocytes by NMR microscopy. Magnetic Resonance Imaging. 1995;13:269–276. doi: 10.1016/0730-725x(94)00109-g. [DOI] [PubMed] [Google Scholar]
- Quick M, Loo DDF, Wright EM. Neutralization of a conserved amino acid residue in the human Na+/glucose transporter (HSGLT1) generates a glucose-gated H+ channel. Journal of Biological Chemistry. 2001;276:1728–1734. doi: 10.1074/jbc.M005521200. [DOI] [PubMed] [Google Scholar]
- Robinson RA, Stokes RH. Electrolyte Solutions. London: Butterworths; 1970. [Google Scholar]
- Sehy JV, Ackerman JJH, Neil JJ. Water and lipid MRI of the Xenopus oocyte. Magnetic Resonance in Medicine. 2001;46:900–906. doi: 10.1002/mrm.1275. [DOI] [PubMed] [Google Scholar]
- Terasaki M, Runft LL, Hand AR. Changes in organization of the endoplasmatic reticulum during Xenopus oocyte maturation and activation. Molecular Biology of the Cell. 2001;12:1103–1116. doi: 10.1091/mbc.12.4.1103. [DOI] [PMC free article] [PubMed] [Google Scholar]
- Zampighi GA, Kreman M, Boorer KJ, Loo DDF, Benzanilla F, Chandy G, Hall JE, Wright EM. A method for determining the unitary functional capacity of cloned channels and transporters expressed in Xenopus laevis oocytes. Journal of Membrane Biology. 1995;148:65–78. doi: 10.1007/BF00234157. [DOI] [PubMed] [Google Scholar]
- Zeuthen T. Relations between intracellular ion activities and extracellular osmolarity in Necturus gallbladder epithelium. Journal of Membrane Biology. 1982;66:109–121. doi: 10.1007/BF01868487. [DOI] [PubMed] [Google Scholar]
- Zeuthen T. Water permeability of ventricular cell membrane in choroid plexus epithelium from Necturus maculosus. Journal of Physiology. 1991;444:133–151. doi: 10.1113/jphysiol.1991.sp018870. [DOI] [PMC free article] [PubMed] [Google Scholar]
- Zeuthen T. Cotransport of K+, Cl− And H20 by membrane proteins from choroid plexus epithelium of Necturus maculosus. Journal of Physiology. 1994;478:203–219. doi: 10.1113/jphysiol.1994.sp020243. [DOI] [PMC free article] [PubMed] [Google Scholar]
- Zeuthen T. Molecular mechanisms for passive and active transport of water. International Review of Cytology. 1995;160:99–161. doi: 10.1016/s0074-7696(08)61554-5. [DOI] [PubMed] [Google Scholar]
- Zeuthen T, Hamann S, La Cour M. Cotransport of H+, lactate and H2O by membrane proteins in retinal pigment epithelium of bullfrog. Journal of Physiology. 1996;497:3–17. doi: 10.1113/jphysiol.1996.sp021745. [DOI] [PMC free article] [PubMed] [Google Scholar]
- Zeuthen T, MacAulay N. Cotransporters as molecular water pumps. International Review of Cytology. 2001a;215:259–284. doi: 10.1016/s0074-7696(02)15012-1. [DOI] [PubMed] [Google Scholar]
- Zeuthen T, MacAulay N. Passive water transport in biological pores. International Review of Cytology. 2001b;215:203–230. doi: 10.1016/s0074-7696(02)15010-8. [DOI] [PubMed] [Google Scholar]
- Zeuthen T, Meinild A-K, Klaerke DA, Loo DDF, Wright EM, Belhage B, Litman T. Water transport by the Na+/glucose cotransporter under isotonic conditions. Biology of the Cell. 1997;89:307–312. doi: 10.1016/s0248-4900(97)83383-7. [DOI] [PubMed] [Google Scholar]
- Zeuthen T, Meinild A-K, Loo DDF, Wright EM, Klaerke DA. Isotonic transport by the Na+-glucose cotransporter SGLT1. Journal of Physiology. 2001;531:631–644. doi: 10.1111/j.1469-7793.2001.0631h.x. [DOI] [PMC free article] [PubMed] [Google Scholar]