

Abstract
The high sensitivity of the vertebrate visual system results from amplification inherent in phototransduction in rods and from the amplification of rod signals on their synaptic transfer at the first synapse with ‘on’ bipolar cells. These cells possess a metabotropic glutamate receptor linked via a cGMP cascade to the control of cGMP-activated channels. In the study presented here, we show that very dim background light, isomerising only one rhodopsin in 1 out of 10 rods per second, potentiates ‘on’ bipolar cell responses to superimposed flashes. Responses to dim flashes, which were undetectable above the noise in the dark, were boosted above the increased noise level induced by the background. This potentiation could be reproduced by elevating cGMP, which increases with light, or by dialysing the cells with a non-hydrolysable cGMP analogue. Inhibition of tyrosine kinase activity also reproduced the effect and induced a speeding up of the rising phase of the flash response, similar to the action of dim background light. Conversely, inhibition of tyrosine phosphatase activity blocked the potentiation. These results suggest that cGMP promotes tyrosine-site dephosphorylation of ‘on’ bipolar cell cGMP-activated channels, resulting in a rise in the sensitivity to cGMP, as has recently been demonstrated for rod cGMP-activated channels. This constitutes a positive feedback mechanism such that as cGMP increases with light, the sensitivity of the channels to cGMP increases and boosts the signal above background noise. This mechanism would allow stochastic resonance to occur, facilitating single-photon detection when dark-adapted, and may therefore lead to improved discrimination.
Cyclic-nucleotide-gated channels are not only crucial for sensory transduction in rod and cone photoreceptors, and in olfactory receptors, they are also essential components of the ‘on’ bipolar cell transduction cascade. ‘On’ bipolar cell cGMP-activated channels have yet to be cloned and sequenced, and single-channel recordings have yet to be obtained. Their physiological properties have been deduced from the analysis of whole-cell patch-clamp recordings (Shiells & Falk, 1992a). ‘On’ bipolar cell synaptic input from photoreceptors is mediated by a metabotropic glutamate receptor, mGluR6 (Nakajima et al. 1993). Early electrophysiological studies were consistent with receptor activation by glutamate released from rods in the dark being transduced via a G-protein, recently identified as Go (Dhingra et al. 2000), activating phosphodiesterase (PDE) and thus resulting in a low intracellular cGMP level in darkness (Nawy & Jahr, 1990; Shiells & Falk, 1990; De La Villa et al. 1995). Consequently, cGMP-activated non-selective cation channels have a low open probability in the dark, resulting in a relatively hyperpolarised state. Light hyperpolarises rod photoreceptors, reducing the synaptic release of glutamate, so ‘on’ bipolar cells depolarise due to an increase in cGMP-activated conductance. More recently, however, this cGMP cascade hypothesis has been challenged by evidence favouring a direct gating of the channels by Go, rather than there being any involvement of PDE in modulating cGMP levels in light and darkness (Nawy, 1999). In the study presented here, we demonstrate that dim background light and moderate elevation of cGMP have equivalent effects on the ‘on’ bipolar cell flash responses, consistent with the cGMP cascade model.
Recent work on rod cGMP-activated channels has shown that their sensitivity to cGMP is reduced by phosphorylation on both serine/threonine (Ser/Thr) and tyrosine (Tyr) residues (Gordon et al. 1992; Molokanova et al. 1999). We have recently shown that the sensitivity of ‘on’ bipolar cells is reduced by a direct action of the Ser/Thr kinase, Ca2+/calmodulin kinase II (CaMKII), on the cGMP-activated channels (Shiells & Falk, 2000, 2001). It has been proposed that Tyr-site dephosphorylation, which is promoted by cGMP in rod channels, constitutes a positive-feedback mechanism, operating at the level of the channels (Molokanova et al. 1999). Tyrosine phosphatase has recently been found associated with rod bipolar cell dendrites, suggesting a possible role in signal transduction (Rickman et al. 2000). We now show that rod bipolar cell flash sensitivity is increased by dim background light, elevation of cGMP, or by tyrosine kinase inhibition. We propose that positive feedback by tyrosine kinase/ phosphatase regulation of ‘on’ bipolar cell cGMP-activated channels enables stochastic resonance (Benzi et al. 1981; Gammaitoni et al. 1998) to occur in the visual system, accounting for improved detection with dim backgrounds and single-photon sensitivity (Hecht et al. 1942; Barlow et al. 1970; Ashmore & Falk, 1982).
METHODS
Patch-clamp recording from retinal slices
Whole-cell voltage-clamp recordings were obtained from bipolar cells on, or just below, the surface of dark-adapted retinal slices prepared from the retina of the dogfish, Scyliorhinus canicula (Shiells & Falk, 1990). Dogfish were dark-adapted overnight and were killed humanely by stunning, decapitating and then pithing. Retinal slices were continuously superfused with oxygenated Ringer solution at 15-20 °C, and were viewed with the aid of infrared illumination. The Ringer solution contained (mm): NaCl 260, KCl 3, CaCl2 4, NaHCO3 20, MgSO4 0.5, urea 350, d-glucose 10, Hepes 5 buffered to pH 7.7 when bubbled with 95 % O2-5 % CO2. Patch pipettes were coated with a heated mixture of parafilm, mineral oil and wax to improve gigaseal formation, and when filled had resistances of 2-3 MΩ. The patch-pipette solutions contained (mm): CsCl 260, TEA 20, MgSO4 5, CaCl2 0.026, Hepes 10, urea 350 buffered to pH 7.3, to which was added 1 mm ATP and 1 mm GTP just before the experiment. The Ca2+ chelator N,N,N‘,N‘-tetrakis(2-pyridyl-methyl)ethylenediamine (TPEN) was added to the patch-pipette solutions at a concentration of 5 mm for buffering free Ca2+ concentrations to 1 μM. The dissociation constant of TPEN is 39 μM, and is thus well suited for buffering Ca2+ increases above this level. A computer program (MaxChelator) was used to calculate the amount of CaCl2 to add to yield free Ca2+ concentrations. Buffering intracellular Ca2+ to 1 μM prevented the desensitisation induced by background light, which initiates Ca2+ entry via the cGMP-activated channels, raising the Ca2+ concentration in the dendrites to the order of 50 μM. This activates CaMKII, which phosphorylates the channels, resulting in desensitisation (Shiells & Falk, 2000, 2001). These results suggest that the dark level of Ca2+ in ‘on’ bipolar cell dendrites is of the order of 1 μM, so in the present study Ca2+ was buffered to this level in the patch-pipette solutions. In control recordings lasting over 30 min, there was no change in ‘on’ bipolar cell flash sensitivity using this patch-pipette solution. For weak Ca2+ buffering, BAPTA, nearly saturated at 1 μM free Ca2+, was used. All chemicals were obtained from Sigma unless indicated otherwise. Tyrphostin A48 (IC50 = 0.125 μM; Calbiochem), cGMP, 8-(4-chlorophenylthio)-cGMP (8-cpt-cGMP), orthovanadate or RK682 (IC50 = 54 μM) (Calbiochem) were added to the patch-pipette solutions. Following gigaseal formation and subsequent rupture of the membrane patch to establish the whole-cell mode, the dark membrane potential was measured in current-clamp mode. Cells were then voltage clamped to their dark potentials (which was corrected for the tip potential) and responses to light were obtained before there was any change in the intracellular medium, as well as after full equilibration with the patch-pipette solutions, usually 5-10 min after establishing the whole-cell configuration. Input conductances were measured by applying 1-5 mV voltage command pulses (275 ms) during the recordings and data were rejected if there were any large variations in series resistance (usually 5-10 MΩ).
Light stimulation
The light absorbed by the rods (rhodopsin molecules isomerised per rod, Rh**) was estimated from previous ‘on’ bipolar cell measurements in the eyecup (Ashmore & Falk, 1980), because of self-screening by the rods and the variable thickness of the slices (150-250 μm). Half-maximal ‘on’ bipolar cell flash responses were taken to correspond to 1 Rh**, the half-saturation intensity of the voltage response and the b-wave in superfused eyecup measurements (Shiells & Falk, 1999b). Brief flashes (0.2 ms) were applied using a green light-emitting diode (LED; peak emission wavelength 530 nm) that was mounted below the preparation. The light was calibrated with a photodiode to increase by factors of 2 over a range of 10 light intensities. For step illumination, another green LED was mounted above the preparation. Flash intensity- current response (I-R) relationships were determined in darkness and against dim backgrounds just after establishing the whole-cell configuration and at intervals up to and on full equilibration with the patch-pipette solutions. Flash sensitivities (pA Rh**−1) were calculated from the current responses to 0.5 Rh** flashes. Mean values and s.e.m. are cited.
RESULTS
Figure 1A shows a whole-cell voltage-clamp recording from an ‘on’ bipolar cell in a dark-adapted dogfish retinal slice, just after establishing the whole-cell configuration of patch-clamp recording. Two dim (0.5 Rh**) test flashes, each isomerising only one rhodopsin molecule in one out of two rods, elicited inward current responses. The flash intensity was then reduced to 0.0625 Rh**, which was too dim to elicit a response above the background dark noise, which originates primarily from spontaneous thermal rhodopsin isomerisations in rods (Ashmore & Falk, 1977; Baylor et al. 1980). The flash intensity was raised sequentially by factors of two, to characterise the cell's full light response range, from 0.0625 to 16 Rh**. The flash responses showed a supralinear increase in amplitude with light intensity, more than doubling in amplitude on raising the intensity by factors of two. Figure 1B shows the potentiating effect of dim (0.1 Rh** s−1) background light. On switching on the background, there was a small, inward shift in current accompanied by an increase in noise, principally due to an increase in rhodopsin isomerisations induced by the background light (photon noise) (Ashmore & Falk, 1980). When the series of flashes was superimposed on the background, responses to the dimmest flashes, too weak to give a clear response in the dark, were dramatically potentiated, standing clearly above the noise. On switching off the background light, flash responses returned to the same amplitude as in the dark.
Figure 1. Dim background light increases ‘on’ bipolar cell flash sensitivity.
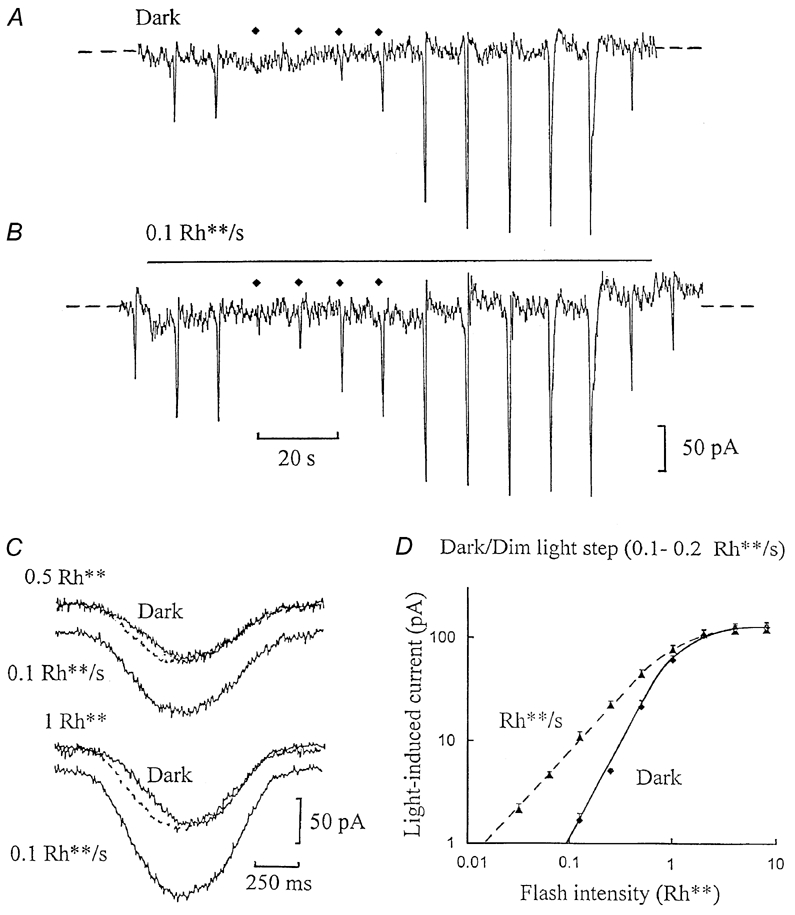
A, whole-cell voltage-clamp recording from an ‘on’ bipolar cell in a dogfish retinal slice in the dark. The cell was clamped to its dark potential of -36 mV; the zero-current level is indicated by the dashed lines, the recording beginning just after establishing the whole-cell configuration. Two inward current flash responses were elicited by 0.5 Rh** test flashes, and then the flash intensity was reduced to 0.0625 rhodopsin molecules isomerised per rod (Rh**), which was too dim to elicit a response. The flash intensity was then raised sequentially by factors of 2, applied at 10 s intervals (the timing of the dim flashes, up to 0.5 Rh**, is indicated by the diamonds above the traces), up to 16 Rh**, which elicited a saturating flash response. B is a continuation(without break) of trace A. A dim background light step isomerising 0.1 Rh** s−1 was applied, of duration indicated by the bar above the trace. The same series of flashes, as in trace A, was then superimposed on the dim background. C, change in the time course induced by the same background, from another ‘on’ bipolar whole-cell recording. Responses to dim (0.5 Rh**) and half-saturating (1 Rh**) flashes are shown, recorded in the dark and with 0.1 Rh** s−1 background light. The responses are displaced from zero current in the dark by the sustained inward current induced by the background, in each case synchronised to the timing of the flash at the beginning of the records. Responses potentiated by the background were scaled down in amplitude to match the responses in the dark, and were superimposed (stippled traces). D, the flash intensity-current response (I-R) relationships derived from 10 ‘on’ bipolar cell recordings in the dark (♦, continuous curve), just after establishing the whole-cell configuration, and against dim backgrounds (0.1-0.2 Rh** s−1; ▴, dashed curve), shown on logarithmic axes. Current responses to flashes were measured in the dark from the dark current level to the peak of the flash responses, whilst those with background light were measured from the steady inward current level induced by the background (mean shift, -12 ± 2 pA). The slope of the curve in the dark was 1.8, which reduced to 1.2 with background light. Positive standard error bars are shown about the mean values.
Dim background light also induced a change in flash response time course. Figure 1C shows the time course of ‘on’ bipolar cell flash responses to dim (0.5 Rh**) and half-maximal (1 Rh**) flashes in the dark and against 0.1 Rh** s−1 backgrounds. The flash responses in the dark showed a linear or ramp-like initial phase of inward current, whilst with background light the initial phase was accelerated and initial and decay phases became more symmetrical. Scaling the potentiated responses (stippled traces) to the same peak amplitude as the responses in the dark revealed a speeding up of the initial phase of the response and a shorter delay with the background, whilst the decay phase superimposed.
Figure 1D shows the average flash I-R relationship plotted on logarithmic axes derived from 10 ‘on’ bipolar cells, recorded in the dark and with dim background light. The relationship in the dark showed a clear supralinear dependence on light intensity, rising as a power function close to 2 (1.8, derived from the slope of the logarithmic plot). In the presence of 0.1-0.2 Rh** s−1 backgrounds there was a marked increase in flash sensitivity, but a decrease in slope approaching linearity (1.2). The flash sensitivity in the dark, determined from the responses to 0.5 Rh** flashes, doubled from 43 ± 7 to 89 ± 14 pA Rh**−1 (n = 10) with dim background light (the relative improvement in sensitivity was even greater with dimmer test flashes).
Light or moderate elevations in intracellular cGMP, or analogues thereof, induced the same effects in ‘on’ bipolar cells (Fig. 2). They increased the amplitude of flash responses and increased input conductance due to the opening of cGMP-activated channels (Shiells & Falk, 1992a,b). The inclusion of 20 μM cGMP in the patch-pipette solution (Fig. 2A) markedly increased the noise level in the dark, but the responses to dim flashes were enhanced to a more marked degree. This concentration of cGMP was used because previous work suggests that 20 μM is less than half-saturating (Shiells & Falk, 1990, 1992b, 1994). The non-hydrolysable cGMP analogue 8-cpt-cGMP likewise increased noise and signal, such that responses to very dim flashes, which in the control failed to elicit a detectable response, resulted in responses that clearly stood out above the noise (Fig. 2B). At a concentration of 20 μM, cGMP, or its analogue, increased flash sensitivity in the dark from 52 ± 9 to 100 ± 11 pA Rh**−1 (n = 5). Dim background light, which potentiated dim flash responses in the controls, resulted in little further improvement when superimposed in the presence of 20 μM cGMP or its analogue. Furthermore, both background light and cGMP linearised the responses to dim flashes (Fig. 1D and Fig. 2C). The same concentration of cGMP or its analogue induced inward shifts in the dark current of -13 ± 4 pA (n = 5), similar to the mean inward current displacements observed under control conditions as a result of 0.1-0.2 Rh** s−1 background light (-12 ± 2 pA; n = 10). This equivalent effect of background light or elevation of cGMP is consistent with previous evidence that light initiates a rise in cGMP via inhibition of PDE activity (Shiells & Falk, 1990, 1992a, 1994; Nawy & Jahr, 1990; De La Villa et al. 1995).
Figure 2. cGMP or its non-hydrolysable analogue, 8-(4-chlorophenylthio)-cGMP (8-cpt-cGMP), reproduces the effect of dim background light.
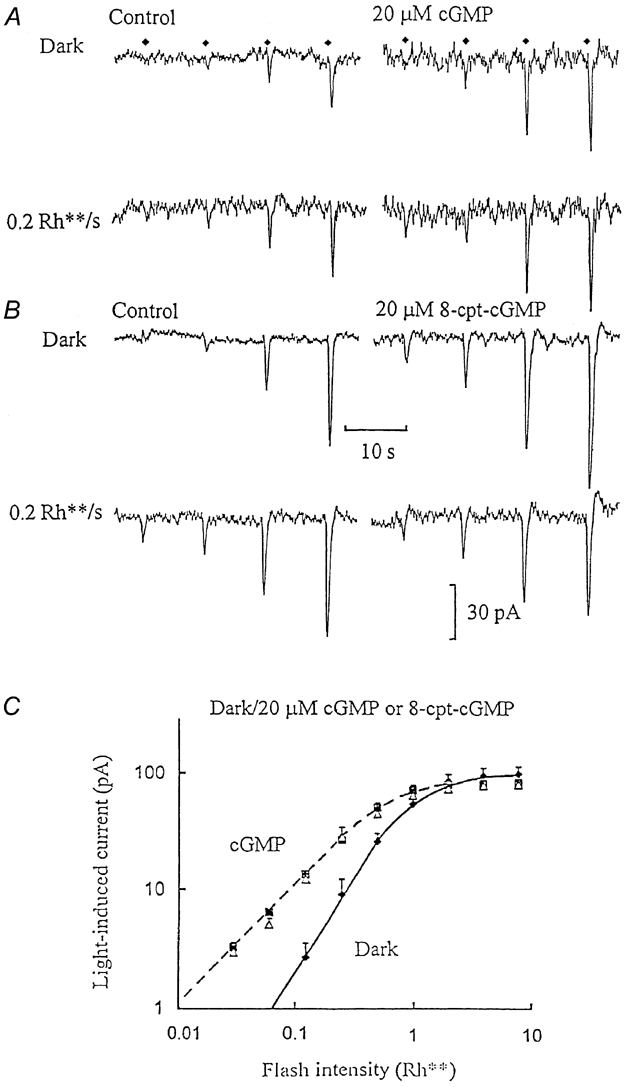
A, ‘on’ bipolar whole-cell voltage-clamp recording obtained just after establishing the whole-cell configuration (Control) and on equilibration with 20 μM cGMP added to the patch-pipette solution. Only the responses to the lower range of flash intensities are shown (up to 0.5 Rh**, flash timing indicated by the diamonds) in the dark (upper traces) and with dim (0.2 Rh** s−1) backgrounds (lower traces). B, similar recording with 20 μM 8-cpt-cGMP included in the patch-pipette solution, before and after equilibration, in the dark and against 0.2 Rh** s−1 backgrounds. C, the average I-R relationships derived from two ‘on’ bipolar cell recordings with 20 μM cGMP and three recordings with 20 μM 8-cpt-cGMP. Flash responses measured in the dark control were obtained just after establishing the whole-cell configuration (♦, continuous curve), on equilibration with cGMP or 8-cpt-cGMP in the dark (▪, dashed curve) and on equilibration against 0.1-0.2 Rh** s−1 backgrounds (▵). The slope of the dark control curve was 1.8, which decreased to 1.1 with the cyclic nucleotides in the dark or with background light.
Rod cGMP-activated channels have been shown to increase their sensitivity to cGMP on dephosphorylation of specific Tyr and Ser/Thr residues (Gordon et al. 1992; Molokanova et al. 1999). To test for tyrosine kinase regulation of ‘on’ bipolar cell cGMP-activated channels, recordings were obtained with the selective epidermal growth factor-linked tyrosine kinase inhibitor, tyrphostin A48 (10 μM, Gazit et al. 1989), added to the patch-pipette solutions. Figure 3A shows ‘on’ bipolar cell dim flash responses in the dark and against dim backgrounds before and after tyrosine kinase inhibition. In the dark control, the dimmest flashes elicited no detectable response above the background dark noise. The noise level increased with dim background light, but now the responses to the dimmest flashes were boosted above the increased noise level. Promoting dephosphorylation by tyrosine kinase inhibition potentiated the flash responses in a similar manner to light and cGMP, with the dimmest flash responses being just detectable against an elevated dark noise level. Furthermore, 10 μM tyrphostin induced mean inward shifts in the dark current of -17 ± 5 pA (n = 3), similar to the displacements in current due to cGMP, its analogue, or dim background light.
Figure 3. Inhibition of tyrosine kinase activity reproduces the effect of background light or cGMP.
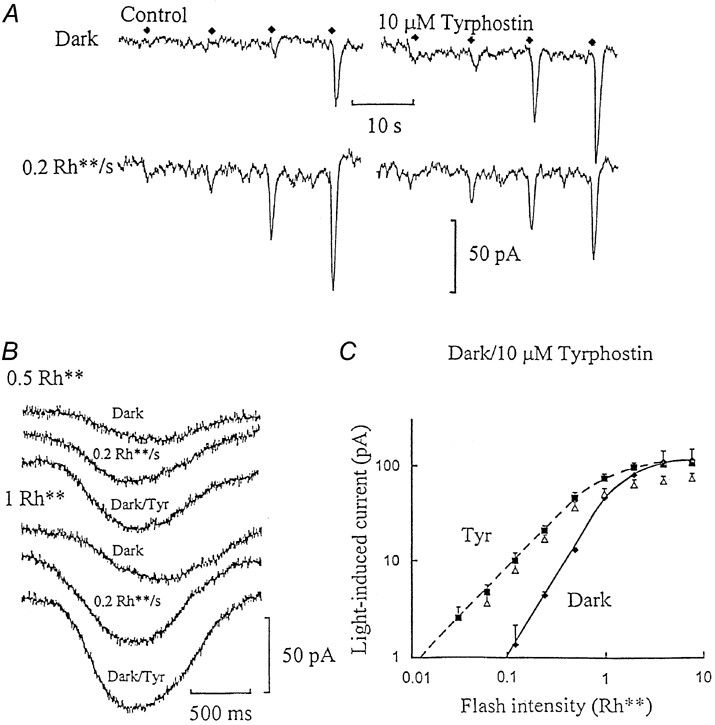
A, ‘on’ bipolar whole-cell voltage-clamp recording obtained just after establishing the whole-cell configuration (Control) and on equilibration with 10 μM tyrphostin A48 added to the patch-pipette solution. Only the responses to the lower range of flash intensities are shown (up to 0.5 Rh**, flash timing indicated by the diamonds) in the dark (upper traces) and with dim (0.2 Rh** s−1) backgrounds (lower traces). B, changes in the time course induced by the same background, and with tyrphostin (Tyr) in the dark, from the same ‘on’ bipolar whole-cell recording shown in A. Responses to dim (0.5 Rh**) and half-saturating (1 Rh**) flashes are shown, recorded in the dark, with 0.2 Rh** s−1 backgrounds, and on equilibration with tyrphostin in the dark (dark/Tyr). The responses are displaced from each other to aid waveform comparison, in each case synchronised to the timing of the flash at the beginning of the records. This recording was obtained at 15 °C to slow down the flash response kinetics. C, the I-R relationships derived from three ‘on’ bipolar cell recordings with 10 μM tyrphostin. Flash responses measured in the dark control were obtained just after establishing the whole-cell configuration (♦, continuous curve), on equilibration with tyrphostin in the dark (▪, dashed curve) and on equilibration against 0.2 Rh** s−1 backgrounds (▵). The slope of the dark control curve was 1.8, which decreased to 1.2 with tyrphostin in the dark or with background light.
Figure 3B shows changes in flash response time course from the dark control, with background light, and with tyrphostin in the dark (dark/Tyr). Flash responses to dim and half-maximal flashes are shown on expanded time scales without amplitude scaling. There is a longer delay before the responses rise above the noise in the dark control, which becomes shorter with background light and on inhibition of tyrosine kinase activity. The responses have a ramp-like rising phase in the dark control, but speed up with background light and tyrphostin. Figure 3C shows average I-R relationships from ‘on’ bipolar cells in the dark control, obtained just after establishing the whole-cell configuration, and on equilibration with tyrphostin in the dark and with dim backgrounds. Inhibition of tyrosine kinase resulted in the same increase in flash sensitivity and decrease in slope as with background light or cGMP, with no further potentiation of flash responses by background light on equilibration with tyrphostin. Tyrphostin increased flash sensitivity from 26 ± 2 to 101 ± 6 pA Rh**−1 (n = 3).
Figure 4A and B shows the converse effect of promoting protein tyrosine phosphorylation by obtaining ‘on’ bipolar cell recordings with inhibitors of tyrosine phosphatase added to the patch-pipette solutions. Responses to the same series of flashes are shown in the dark and against 0.2 Rh** s−1 backgrounds on equilibration with 200 μM orthovanadate (Molokanova et al. 2000) or 100 μM of the more selective tyrosine phosphatase inhibitor, RK682 (Hamaguchi et al. 1995). Potentiation of flash responses by background light was abolished on equilibration with either of these tyrosine phosphatase inhibitors, dim backgrounds slightly reducing the superimposed flash responses in each case. Figure 4C and D shows average I-R relationships derived from these data. The inhibitors induced no significant change in the slope of the curves, but reduced the maximum flash responses by ≤ 50 %. Background light no longer potentiated the flash responses on inhibition of tyrosine phosphatase, which would have shown up as a shift in the curves to lower light intensities, consistent with the potentiation being dependent upon dephosphorylation occurring with the rises in cGMP induced by background light.
Figure 4. Inhibition of tyrosine phosphatase activity blocks potentiation by dim background light.

Whole-cell voltage clamp recordings from ‘on’ bipolar cells in dogfish retinal slices, on equilibration with 200 μM orthovanadate (A) or 100 μM RK682 (B). The cells were clamped to their dark potentials of -40 and -35 mV, respectively; the zero-current level is indicated by the dashed lines. The I-R relationship for each cell was measured in the dark and against dim backgrounds by raising the flash intensity sequentially by factors of 2, at 10 s intervals, which elicited ramps of flash responses saturating at 8 Rh**. The dimmest test flash timing (0.0625-0.5 Rh**) is marked by the diamonds above the trace. C and D show the I-R relationships derived from three ‘on’ bipolar cell recordings with 200 μM orthovanadate (OV) and three ‘on’ bipolar cell recordings with 100 μM RK682. Flash responses measured in the dark were obtained just after establishing the whole-cell configuration (♦, continuous curve), on equilibration with OV or RK682 in the dark (▪, dashed curve) and on equilibration against 0.2 Rh** s−1 backgrounds (▵). The slopes of the dark control curves were 1.8, and showed no significant change with OV, RK682 or background light on equilibration with these tyrosine phosphatase inhibitors.
The question arose as to whether potentiation of flash responses by backgrounds could be observed with weak Ca2+ buffering. This would activate the CaMKII pathway, which acts to desensitise ‘on’ bipolar cells if the rise in Ca2+, entering via the cGMP-activated channels during the light step, is sufficiently high (Shiells & Falk, 2000, 2001). To test for this, whole-cell recordings were obtained from ‘on’ bipolar cells with the Ca2+ buffer TPEN replaced by 5 mm BAPTA which, having a dissociation constant of 110 nm, would be almost completely saturated in the presence of 1 μM free Ca2+ and would be incapable of buffering rises of the order of 50 μM. Figure 5 shows a whole-cell recording from an ‘on’ bipolar cell using this internal solution. With the dim 0.1 Rh** s−1 background, potentiation of the dim flash responses could be observed, but was not as pronounced as that observed with TPEN in other cells. With BAPTA and 1 μM free Ca2+, flash sensitivity increased from 44 ± 4 pA Rh**−1 in the dark to 64 ± 3 pA Rh**−1 (n = 3) with dim backgrounds. Clearly, any activation of CaMKII would tend to counter the potentiation induced by the tyrosine kinase/phosphatase pathway with dim background light. In the presence of CaMKII peptide inhibitors and 50 μM Ca2+, dim background light resulted in the prominent potentiation of flash responses (Fig. 5, Shiells & Falk, 2000) excluding any role of calcium-dependent phosphatases (e.g. calcineurin) in generating the potentiation. The endogenous buffering of the cell may normally be sufficient to prevent significant rises in Ca2+ with dim backgrounds, thus allowing potentiation to occur over a narrow, low range of background light intensities.
Figure 5. Potentiation of flash responses by dim background light occurs with weak Ca2+ buffering.
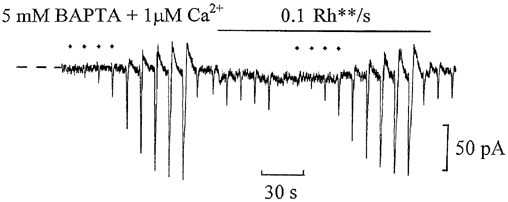
Whole-cell voltage clamp recording from an ‘on’ bipolar cell equilibrated with a patch-pipette solution containing 1 μM free Ca2+ buffered with 5 mm BAPTA instead of N,N,N‘,N‘-tetrakis(2-pyridyl-methyl)ethylenediamine (TPEN). The flash intensity ranged from 0.0625 to 16 Rh**, with the dimmest range (0.0625-0.5 Rh**) marked by the diamonds above the trace. The zero-current level is marked by the dashed lines at the beginning of the record, and the cell was clamped to its dark potential of -43 mV.
DISCUSSION
The results presented herein would be consistent with the sensitivity of the ‘on’ bipolar cell cGMP-activated channel, in common with its photoreceptor counterpart (Molokanova et al. 2000), being regulated by tyrosine kinase/phosphatase activity. This interpretation of the present results must, however, await confirmation by direct study of ‘on’ bipolar cell cGMP-activated channels. It has been shown that the phosphorylation state of rod cGMP-activated channels is regulated by tyrosine kinase and phosphatase, with cGMP acting to promote dephosphorylation by inhibiting kinase activity or increasing phosphatase activity (Molokanova et al. 1999, 2000). The consequence of dephosphorylation is a rise in sensitivity of the channels to cGMP, so any increase in cGMP would increase sensitivity to itself, thus generating positive feedback. The block of potentiation of ‘on’ bipolar cell flash responses by dim backgrounds on inhibition of tyrosine phosphatase suggests that phosphatase activity is an absolute requirement for potentiation to occur. This would tend to exclude other possible mechanisms, for example, high cooperativity in the binding of cGMP to the channels, in generating both steep I-R relationships in the dark and the potentiation by dim backgrounds. We cannot exclude effects on elements further up the cGMP cascade, on receptor-G-protein coupling or on PDE activity. However, if the potentiation was due to an increase in the overall gain of the cascade by tyrosine dephosphorylation of these elements, then blocking kinase activity with tyrphostin would be expected to amplify the effect of glutamate released from the rods in darkness to increase PDE activity, resulting in a decrease in basal cGMP levels and thus outward displacement of the dark current. That tyrphostin induced inward shifts in dark current and potentiation of dim flash responses with no reduction in peak flash responses is consistent with a rise in channel sensitivity to the same basal level of cGMP. The very high ‘on’ bipolar cell flash sensitivities and linear I-R relationships measured with intracellular recording from unperfused dogfish eyecup (Ashmore & Falk, 1980) may have been due to the accumulation of factors such as nitric oxide, which is known to raise cGMP levels, and thus sensitise the system (Shiells & Falk, 1992b).
Recordings from intact rods and isolated patches of rod outer segment membrane have also shown that Tyr-site dephosphorylation is promoted by exposure to insulin-like growth factor, resulting in both an increased channel sensitivity to cGMP and an increase in rod flash response kinetics (Savchenko et al. 2001). The speeding up of the rising phase of ‘on’ bipolar cell flash responses by either raising cGMP with background light or by inhibition of tyrosine kinase further suggests a similar regulation of ‘on’ bipolar cell cGMP-activated channels. The effectiveness of tyrphostin A48 suggests the involvement of an epidermal growth-factor-linked tyrosine kinase in regulating channel sensitivity to cGMP in ‘on’ bipolar cells. The increased rate of rise of ‘on’ bipolar cell flash responses when potentiated suggests that the same mechanism underlies the improved time resolution, which occurs on transmission of rod signals to ‘on’ bipolar cells. The ‘on’ bipolar cell flash response contains higher frequency components than the rod response (Ashmore & Falk, 1982), and this improved time resolution is reflected in the higher flicker fusion frequency of the b-wave of the human electroretinogram (ERG; Maffei & Poppele, 1968), which arises from ‘on’ bipolar cell activity, than for the a-wave, which arises mainly from rod activity (Shiells & Falk, 1999b). The psychophysical flicker response parallels that of the b-wave.
Psychophysical studies on the human visual detection threshold provide evidence for supralinearity (detection rising as power function of two in some individuals) with light intensity (Nachmias & Kocher, 1970). Furthermore, in some human observers, dim backgrounds sensitise the visual system, so that the threshold dips below that for the dark-adapted state (Baumgardt & Smith, 1965; Nachmias & Sansbury, 1974). In other sensory systems, for example hearing, an appropriate level of background noise lowers the detection threshold (Zeng et al. 2000). In supralinear systems, the improvement of detection by noise is often ascribed to stochastic resonance. A stochastic system may exhibit resonance, as manifested by a peak in its power spectrum, if there is some cooperative effect on the system by a suitable noise source (Benzi et al. 1981; Gammaitoni et al. 1998). The power spectrum of voltage fluctuations in ‘on’ bipolar cells both in the dark and in the presence of dim backgrounds has a resonant peak at about 5 Hz, the magnitude of which rises with light intensity (Ashmore & Falk, 1982). This peak could not be accounted for by the electrical properties of the ‘on’ bipolar cell membrane, but seemed to be involved in the mechanism underlying the synaptic transfer of rod signals to ‘on’ bipolar cells. That there was still a resonant peak (but a diminished one) in the power spectrum in the dark raises the intriguing possibility that the dark noise itself, due to spontaneous thermal rhodopsin isomerisations, would contribute to improved detection. Positive feedback generated by cGMP-dependent dephosphorylation of the channels could be the underlying mechanism allowing this stochastic system to exhibit resonance. With brighter (0.5-1 Rh** s−1) background light, there is negative feedback mediated by Ca2+ entry and activation of the Ser/Thr kinase, CaMKII, which desensitises ‘on’ bipolar cells by an action on the channels (Shiells & Falk, 1999a, 2000, 2001).
A threshold detection mechanism has been proposed, arising at the ‘on’ bipolar cell level (Van Rossum & Smith, 1999). Intracellular voltage recordings (Ashmore & Falk, 1980, 1982) and whole-cell recordings (Shiells & Falk, 1990, 1992a, 1994) from the dark-adapted rod retina of the dogfish, however, give no indication of the existence of a thresholding mechanism. It seems that thresholding begins at the amacrine and ganglion cell level, with the generation of action potentials. ‘On’ ganglion cells of the cat have a dark rate of firing, which corresponds to the rate of thermal isomerisation of rhodopsin in rods within their receptive fields, and single photons generate an increase in action potential frequency (Barlow et al. 1970). It is now clear that signal and noise are not independent variables and it seems likely that spontaneous thermal isomerisations in rods could provide the appropriate background noise required to enable stochastic resonance, and thus single photon detection by the visual system.
The results presented here, showing that both light and cGMP have equivalent effects, provides strong evidence for the view that light induces a rise in cGMP via a G-protein linked to a PDE in ‘on’ bipolar cells (Nawy & Jahr, 1990; Shiells & Falk, 1990, 1994, 1995; De La Villa et al. 1995). The alternative model (Nawy, 1999), proposing instead a direct action of the α subunit of the G-protein Go to control the cGMP-activated channels, implying no change in cGMP levels in light and darkness, seems unlikely. Regulation of cGMP channel sensitivity by tyrosine kinase/phosphatase may account for the increases in glutamate responses of salamander ‘on’ bipolar cells when dialysed with cGMP or its non-hydrolysable analogues (Nawy, 1999). Dephosphorylation of the cGMP-activated channels by the increase in intracellular cGMP would simply increase their sensitivity to endogenous changes in cGMP induced by PDE activation by glutamate. Thus, the vertebrate visual system has evolved the cGMP cascade linked to glutamate receptors in ‘on’ bipolar cells, which generates large amplification of rod signals, and by virtue of the action of the end product, cGMP, on the cGMP-activated channels, improves temporal resolution and detection against dim backgrounds.
Acknowledgments
We would like to thank the Wellcome Trust for financial support.
REFERENCES
- Ashmore JF, Falk G. Dark noise in retinal bipolar cells and stability of rhodopsin in rods. Nature. 1977;270:69–71. doi: 10.1038/270069a0. [DOI] [PubMed] [Google Scholar]
- Ashmore JF, Falk G. Responses of rod bipolar cells in the dark-adapted retina of the dogfish, Scyliorhinus canicula. Journal of Physiology. 1980;300:115–150. doi: 10.1113/jphysiol.1980.sp013155. [DOI] [PMC free article] [PubMed] [Google Scholar]
- Ashmore JF, Falk G. An analysis of voltage noise in rod bipolar cells of the dogfish retina. Journal of Physiology. 1982;332:273–297. doi: 10.1113/jphysiol.1982.sp014413. [DOI] [PMC free article] [PubMed] [Google Scholar]
- Barlow HB, Levick WR, Yoon M. Responses to single quanta of light in retinal ganglion cells of the cat. Vision Research Supplement. 1970;3:87–102. doi: 10.1016/0042-6989(71)90033-2. [DOI] [PubMed] [Google Scholar]
- Baumgardt E, Smith SW. Facilitation effect of background light on target detection; a test of theories of absolute threshold. Vision Research. 1965;5:299–312. doi: 10.1016/0042-6989(65)90006-4. [DOI] [PubMed] [Google Scholar]
- Baylor DA, Matthews G, Yau K-W. Two components of electrical dark noise in toad retinal rod outer segments. Journal of Physiology. 1980;309:591–621. doi: 10.1113/jphysiol.1980.sp013529. [DOI] [PMC free article] [PubMed] [Google Scholar]
- Benzi R, Sutera A, Vulpiani A. The mechanism of stochastic resonance. Journal of Physics A. 1981;14:L453–457. [Google Scholar]
- De La Villa P, Kurahashi T, Kaneko A. l-Glutamate-induced responses and cGMP-activated channels in three subtypes of retinal bipolar cells dissociated from the cat. Journal of Neuroscience. 1995;15:3571–3582. doi: 10.1523/JNEUROSCI.15-05-03571.1995. [DOI] [PMC free article] [PubMed] [Google Scholar]
- Dhingra A, Lyubarsky A, Jiang M, Pugh EN, Jr, Birnbaumer L, Sterling P, Vardi N. The light response of on bipolar neurons requires Gαo. Journal of Neuroscience. 2000;20:9053–9058. doi: 10.1523/JNEUROSCI.20-24-09053.2000. [DOI] [PMC free article] [PubMed] [Google Scholar]
- Gammaitoni P, Hanggi P, Jung P, Marchesoni F. Stochastic resonance. Reviews of Modern Physics. 1998;70:223–287. [Google Scholar]
- Gazit A, Yaish P, Gilon C, Levitzki A. Tyrphostins 1: synthesis and biological activity of protein tyrosine kinase inhibitors. Journal of Medicinal Chemistry. 1989;32:2344–2352. doi: 10.1021/jm00130a020. [DOI] [PubMed] [Google Scholar]
- Gordon SE, Brautigan DL, Zimmerman AL. Protein phosphatases modulate the apparent agonist affinity of the light-regulated ion channel in retinal rods. Neuron. 1992;9:739–748. doi: 10.1016/0896-6273(92)90036-d. [DOI] [PubMed] [Google Scholar]
- Hamaguchi T, Sudo T, Osada H. RK-682, a potent inhibitor of tyrosine phosphatase, arrested the mammalian cell cycle progression at G1 phase. FEBS Letters. 1995;372:54–58. doi: 10.1016/0014-5793(95)00953-7. [DOI] [PubMed] [Google Scholar]
- Hecht S, Shlaer S, Pirenne M. Energy, quanta, and vision. Journal of General Physiology. 1942;25:819–840. doi: 10.1085/jgp.25.6.819. [DOI] [PMC free article] [PubMed] [Google Scholar]
- Maffei L, Poppele RE. Transient and steady-state electroretinal responses. Vision Research. 1968;8:229–246. doi: 10.1016/0042-6989(68)90011-4. [DOI] [PubMed] [Google Scholar]
- Molokanova E, Maddox F, Luetje CW, Kramer RH. Activity-dependent modulation of rod photoreceptor cyclic nucleotide-gated channels mediated by phosphorylation of a specific tyrosine residue. Journal of Neuroscience. 1999;19:4786–4795. doi: 10.1523/JNEUROSCI.19-12-04786.1999. [DOI] [PMC free article] [PubMed] [Google Scholar]
- Molokanova E, Savchenko A, Kramer RH. Interactions of cyclic nucleotide-gated channel subunits and protein tyrosine kinase probed with genistein. Journal of General Physiology. 2000;115:685–696. doi: 10.1085/jgp.115.6.685. [DOI] [PMC free article] [PubMed] [Google Scholar]
- Nachmias J, Kocher EC. Visual detection and discrimination of luminance increments. Journal of the Optical Society of America. 1970;60:382–389. doi: 10.1364/josa.60.000382. [DOI] [PubMed] [Google Scholar]
- Nachmias J, Sansbury RV. Grating contrast: discrimination may be better than detection. Vision Research. 1974;14:1039–1042. doi: 10.1016/0042-6989(74)90175-8. [DOI] [PubMed] [Google Scholar]
- Nakajima Y, Iwakabe H, Akazawa C, Nawa H, Shigemoto R, Mizuno N, Nakanishi S. Molecular characterization of a novel retinal metabotropic glutamate receptor mGluR6 with a high agonist selectivity for l-2-amino-4-phosphonobutyrate. Journal of Biological Chemistry. 1993;268:11868–11873. [PubMed] [Google Scholar]
- Nawy S. The metabotropic receptor mGluR6 may signal through Go, but not phosphodiesterase, in retinal bipolar cells. Journal of Neuroscience. 1999;19:2938–2944. doi: 10.1523/JNEUROSCI.19-08-02938.1999. [DOI] [PMC free article] [PubMed] [Google Scholar]
- Nawy S, Jahr CE. Suppression by glutamate of cGMP-activated conductance in retinal bipolar cells. Nature. 1990;346:269–271. doi: 10.1038/346269a0. [DOI] [PubMed] [Google Scholar]
- Rickman DW, Yarovinsky TO, Trasarti L, Bowes Rickman C. Rod bipolar cells of the mammalian retina express the protein tyrosine phosphatase, PRL-1. Investigative Ophthalmology and Visual Science. 2000;41:S878. [Google Scholar]
- Savchenko A, Kraft TW, Molokanova E, Kramer RH. Growth factors regulate phototransduction in retinal rods by modulating cyclic nucleotide-gated channels through dephosphorylation of a specific tyrosine residue. Proceedings of the National Academy of Sciences of the USA. 2001;98:5880–5885. doi: 10.1073/pnas.101524998. [DOI] [PMC free article] [PubMed] [Google Scholar]
- Shiells RA, Falk G. Glutamate receptors of rod bipolar cells are linked to a cyclic GMP cascade via a G-protein. Proceedings of the Royal Society B. 1990;242:91–94. doi: 10.1098/rspb.1990.0109. [DOI] [PubMed] [Google Scholar]
- Shiells RA, Falk G. Properties of the cGMP-activated channel of retinal on-bipolar cells. Proceedings of the Royal Society B. 1992a;247:21–25. doi: 10.1098/rspb.1992.0004. [DOI] [PubMed] [Google Scholar]
- Shiells RA, Falk G. Retinal on-bipolar cells contain a nitric oxide-sensitive guanylate cyclase. NeuroReport. 1992b;3:845–848. doi: 10.1097/00001756-199210000-00006. [DOI] [PubMed] [Google Scholar]
- Shiells RA, Falk G. Responses of rod bipolar cells isolated from dogfish retinal slices to concentration-jumps of glutamate. Visual Neuroscience. 1994;11:1175–1183. doi: 10.1017/s0952523800006970. [DOI] [PubMed] [Google Scholar]
- Shiells RA, Falk G. Signal transduction in retinal bipolar cells. Progress in Retinal and Eye Research. 1995;14:223–247. [Google Scholar]
- Shiells RA, Falk G. A rise in intracellular Ca2+ underlies light adaptation in dogfish retinal ‘on’ bipolar cells. Journal of Physiology. 1999a;514:343–350. doi: 10.1111/j.1469-7793.1999.343ae.x. [DOI] [PMC free article] [PubMed] [Google Scholar]
- Shiells RA, Falk G. Contribution of rod, on-bipolar, and horizontal cell light responses to the ERG of dogfish retina. Visual Neuroscience. 1999b;16:503–511. doi: 10.1017/s0952523899163119. [DOI] [PubMed] [Google Scholar]
- Shiells RA, Falk G. Activation of Ca2+-calmodulin kinase II induces desensitization by background light in dogfish retinal ‘on’ bipolar cells. Journal of Physiology. 2000;528:327–338. doi: 10.1111/j.1469-7793.2000.00327.x. [DOI] [PMC free article] [PubMed] [Google Scholar]
- Shiells RA, Falk G. Rectification of cGMP-activated channels induced by phosphorylation in dogfish retinal ‘on’ bipolar cells. Journal of Physiology. 2001;535:697–702. doi: 10.1111/j.1469-7793.2001.00697.x. [DOI] [PMC free article] [PubMed] [Google Scholar]
- Van-Rossum MC, Smith RG. Noise removal at the rod synapse of mammalian retina. Visual Neuroscience. 1999;15:809–821. doi: 10.1017/s0952523898155037. [DOI] [PubMed] [Google Scholar]
- Zeng F-G, Fu Q-J, Morse R. Human hearing enhanced by noise. Brain Research. 2000;869:251–255. doi: 10.1016/s0006-8993(00)02475-6. [DOI] [PubMed] [Google Scholar]