

Abstract
The properties of non-NMDA glutamate receptor channels in AII amacrine cells were studied by patch-clamp recording from rat retinal slices. Application of AMPA or kainate to intact cells evoked currents with no apparent desensitization (EC50 of 118 μM for AMPA and 169 μM for kainate). Application of AMPA to patches evoked desensitizing responses with an EC50 of 217 and 88 μM for the peak and steady-state responses, respectively. Kainate-evoked responses of patches displayed no desensitization (EC50 = 162 μM). Cyclothiazide strongly potentiated AMPA-evoked responses and the AMPA-receptor antagonist GYKI 53655 inhibited both AMPA- and kainate-evoked responses (IC50 = 0.5–1.7 μM). Pre-equilibration with GYKI 53655 completely blocked the response to kainate and pretreatment with concanavalin A did not unmask a response mediated by kainate receptors. AMPA- and kainate-evoked currents reversed close to 0 mV. AMPA-evoked peak and steady-state response components in patches displayed linear and outwardly rectifying I–V relations with an RI (ratio of the slope conductances at +40 mV and -60 mV) of 0.96 ± 0.11 and 5.6 ± 1.3, respectively. AMPA-evoked currents displayed a voltage-dependent relaxation after steps to positive or negative membrane potentials, indicating that the outward rectification of the steady-state response is caused by a voltage-dependent kinetic parameter of channel gating. Under bi-ionic conditions ([Ca2+]out = 30 mm, [Cs+]in = 171 mm), the reversal potentials of AMPA- and kainate-evoked currents indicated channels with significant Ca2+ permeability (PCa/PCs = 1.9–2.1). Stationary noise analysis indicated that kainate activated channels with an apparent chord conductance of ∼9 pS. Non-stationary noise analysis indicated that AMPA and glutamate activated channels with apparent chord conductances of ∼9, ∼15, ∼23 and ∼38 pS. Discrete single-channel gating corresponding to chord conductances of ∼23 pS could be directly observed in some responses. Thus, our results indicate expression of high-affinity, voltage-sensitive AMPA receptors with significant Ca2+ permeability and relatively large single-channel chord conductances in AII amacrine cells.
In the retina, amacrine cells collectively constitute a heterogeneous group of local-circuit inhibitory interneurones. In the rod pathway of the mammalian retina, AII amacrine cells receive synaptic input from rod bipolar cells at the arboreal dendrites in the proximal part of the inner plexiform layer (Kolb & Famiglietti, 1974). Additionally, OFF-cone bipolar cells synapse onto the lobular appendages of AII amacrine cells in the distal part of the inner plexiform layer (Strettoi et al. 1992). Both rod bipolar cells and OFF-cone bipolar cells are thought to be glutamatergic (review by Massey & Maguire, 1995).
From previous physiological studies, it is known that AII amacrine cells express functional ionotropic glutamate receptors of both the non-NMDA and the NMDA type (Boos et al. 1993; Hartveit & Veruki, 1997). Non-NMDA receptors can be classified as either high-affinity AMPA/ low-affinity kainate receptors (henceforth termed AMPA receptors) or low-affinity AMPA/high-affinity kainate receptors (henceforth termed kainate receptors). The AMPA receptors are composed of one or more types of a series of receptor subunits termed GluR-A to -D (alternatively GluR1 to -4). Kainate receptors are composed of one or more of a series of subunits termed GluR5-7 and KA1-2, respectively. The exact subunit composition of a glutamate receptor determines important functional characteristics such as single-channel conductance, Ca2+ permeability, current-voltage rectification and kinetics (for review see Dingledine et al. 1999).
The characterization of non-NMDA glutamate receptors in specific cell types will be helpful to the understanding of glutamatergic synaptic transmission to these cells. In this study we have investigated the functional properties of non-NMDA-type glutamate receptor channels of AII amacrine cells with a combination of electrophysiological, pharmacological and biophysical methods. The experiments were performed by voltage-clamp recording from AII amacrine cells in an in vitro slice preparation from the rat retina, both in the whole-cell and outside-out configuration of the patch-clamp technique. AII amacrine cells express AMPA-type receptors, with no evidence for high-affinity kainate receptors. The AMPA receptors display relatively high permeability to Ca2+ ions. Stationary and non-stationary noise analysis suggests apparent elementary channel conductances of ∼9, ∼15, ∼23 and ∼38 pS. Directly resolvable single-channel openings verify single-channel conductances at 23 pS.
METHODS
General aspects of the methods have previously been described in detail (Hartveit, 1996). Albino rats (4-6 weeks postnatal) were deeply anaesthetized with halothane in oxygen and killed by cervical dislocation (procedure approved under the surveillance of the Norwegian Animal Research Authority). Retinal slices were visualized with a × 40 water immersion objective and infrared differential interference contrast (IR-DIC) videomicroscopy (Axioskop2 FS; Zeiss, Germany).
When filled with intracellular solution, patch pipettes typically had resistances of 5-6 MΩ for recordings in the whole-cell configuration and 8-9 MΩ for recordings from nucleated outside-out patches. For patch recordings, most pipettes were coated with dental wax and fire-polished. In order to establish nucleated patch recordings, the pipette was slowly withdrawn after establishing the whole-cell configuration, while continuous light suction was applied to the inside of the pipette. In a few cases, conventional outside-out patches gave adequate responses and the results have been included with those from nucleated patches.
Solutions and drug application
The standard extracellular perfusing solution was bubbled with 95 % O2-5 % CO2 and had the following composition (mm): 125 NaCl, 25 NaHCO3, 2.5 KCl, 2.5 CaCl2, 1 MgCl2, 10 glucose, pH 7.4 (23-25 °C). In whole-cell recordings of agonist-evoked responses, the extracellular solution contained 3 mm CoCl2 instead of 2.5 mm CaCl2 in order to block indirect, synaptically mediated responses. In experiments where the lectin concanavalin A (ConA) was applied in order to block desensitization of putative high-affinity kainate receptors, glucose in the extracellular solution (10 mm) was replaced with 5 mm sodium pyruvate (to prevent binding of ConA to glucose; Goldstein et al. 1965). In most experiments the pipettes were filled with an internal solution containing (mm): 125 CsOH, 125 gluconic acid, 15 tetraethylammonium chloride (TEA), 5 N-[2-hydroxyethyl]piperazine-N‘-[2-ethanesulphonic acid] (Hepes), 1 CaCl2, 1 MgCl2, 4 NaCl, 5 ethylene glycol-O,O‘-bis-(2-aminoethyl)-N,N,N‘,N‘-tetraacetic acid (EGTA), 4 disodium adenosine 5′-triphosphate (Na2ATP). Lucifer Yellow was added at a concentration of 1 mg ml−1 and pH was adjusted to 7.3 with CsOH. Spermine (Research Biochemicals International, Natick, MA, USA) was added at a concentration of 25 or 100 μM. In experiments for measuring Ca2+ permeability, the internal solution contained (mm): 150 CsCl, 5 Hepes, 2 MgATP and 10 EGTA. The pH was adjusted to 7.3 with CsOH, increasing the total Cs+ concentration to 171 mm. The holding potential was corrected for liquid junction potentials on-line (calculated with JPCalcW; Axon Instruments, Union City, CA, USA).
Drugs were either added directly to the extracellular solution used to perfuse the slices or applied by pressure (1-1.5 bar) from a seven-barrelled pipette complex. The speed of solution change was measured as the change in liquid junction current of an open-tip patch pipette upon a change from our standard extracellular solution to the same solution diluted to 10 % with distilled water. The concentrations of the drugs were as follows (supplier in parentheses; Tocris Cookson, Bristol, UK, unless otherwise noted): 0.05-100 μM 1-(4-aminophenyl)-3-methylcarbamyl-4-methyl-7,8-methylenedioxy-3,4-dihydro-5H-2,3-benzodiazepine (GYKI 53655; Eli Lilly, Indianapolis, IN, USA), 0.5-1600 μM AMPA, 30 μM 3-((RS)-2-carboxypiperazin-4-yl)-propyl-1-phosphonic acid (CPP), 50 μM concanavalin A (Sigma, St Louis, MO, USA), 25 μM 6-cyano-7-nitroquinoxaline-2,3-dione (CNQX), 100 μM cyclothiazide (Eli Lilly), 1000 μM glutamate, 6.25-1600 μM kainate (Sigma), 0.3 μM tetrodotoxin. Drugs applied from pipettes were dissolved in Hepes-buffered external solution containing (mm): 145 NaCl, 2.5 KCl, 2.5 CaCl2 or 3 CoCl2, 1 MgCl2, 5 hemiNa-Hepes, 10 glucose, pH adjusted to 7.4 with HCl.
In experiments for measuring Ca2+ permeability of channels in nucleated patches, agonist was applied from a theta-tube application pipette (tip diameter ∼300 μm). The patches were positioned near the interface between control solution and agonist-containing solution continuously flowing out of each barrel. Agonist was applied to the patch by moving the position of the pipette and the solution interface. Agonists were dissolved in 30/0 mm Ca2+ extracellular solution containing (mm): 30/0 CaCl2, 100/145 N-methyl-d-glucamine (NMDG), 10 Hepes and 25 glucose (pH adjusted to 7.4 with HCl).
Data acquisition
Voltage-clamp recordings were made with an EPC9 amplifier controlled by Pulse software (HEKA Elektronik, Lambrecht, Germany). The sampling interval was varied between 10 μs and 1 ms. Before sampling, the signal was low-pass filtered (analog 3- and 4-pole Bessel filters in series) with a corner frequency (-3 dB) at 1/3-1/5 of the inverse of the sampling interval. For stationary noise analysis (see below), the corner frequency was set to 0.4 or 0.5 of the inverse of the sampling interval and the filter characteristics were changed to Butterworth instead of Bessel. The software also estimated, and in a few whole-cell recordings compensated (up to 50 %), the series resistance. For noise analysis of current responses in nucleated patches (see below), only recordings with series resistance <50 MΩ were analysed in order to minimize distortion of the results by low-pass RC filtering from the combination of series resistance and membrane capacitance.
General data analysis
Analysis was performed with the following computer programs: PulseFit (HEKA Elektronik), PulseTools (HEKA Elektronik), Igor Pro (WaveMetrics, Lake Oswego, OR, USA), AxoGraph (Axon Instruments) and TAC (Bruxton Corp., Seattle, WA, USA). AxoGraph was also used for stochastic simulations of ion channel responses.
The amplitude of drug-evoked current responses was calculated as the peak or mean current between vertical cursors positioned on the current traces. For each cell or patch, the response at each concentration was typically calculated from three or more repetitions. Concentration-response data were normalized to the response at a fixed agonist concentration and fitted with Hill-type equations of the following form:
| (1) |
where I is the current at a given concentration of agonist ([A]), Imax is the maximum current, EC50 is the agonist concentration giving rise to half-maximal current and nH is the Hill coefficient. For experiments with the receptor antagonist GYKI 53655, the agonist-evoked response at each concentration of antagonist was normalized to the response in the absence of antagonist or, alternatively, to the response in the presence of a very low concentration of antagonist. Data points were plotted as agonist-evoked response vs. antagonist concentration. Concentration- inhibition curves were estimated by fitting with an equivalent equation yielding values for IC50 (antagonist concentration giving rise to half-maximal inhibition) and nH.
Data points of I-V relationships were fitted by fourth- to seventh-order polynomial functions. Reversal potentials (Erev) were calculated by interpolation. In order to estimate ion channel rectification, the first derivatives of the polynomial functions obtained by curve fitting of I-V relationships were used to generate slope conductance (Gslope) vs. voltage relationships.
Relaxation currents after voltage steps were fitted with a monoexponential function, I(t) = Aexp(-t/τ) + Iss, where I(t) is the current as a function of time, τ is the time constant, Iss is the steady-state current amplitude and the current at time zero is equal to the sum of A and Iss.
Data are presented as means ± s.e.m. (n = number of cells) and percentages are presented as percentage of control. Statistical analyses were performed using Student's two-tailed t tests with a level of significance of P < 0.05 (unpaired, unless otherwise stated). For illustration purposes, most raw data records were low-pass filtered (digital Gaussian filter, -3 dB at 250-1500 Hz). Unless otherwise noted, the current traces shown in the figures represent individual traces.
Determination of Ca2+ permeability
In order to determine the relative Ca2+ permeability, bi-ionic conditions were established by recording with an internal solution containing Cs+ (171 mm) as the only permeant cation and an extracellular solution containing Ca2+ (30 mm) as the only permeant cation (see above). Monovalent cations (Na+ and K+) were substituted with NMDG+ because AMPA receptors are not measurably permeable to this cation (Iino et al. 1990; Jonas & Sakmann, 1992). Erev was determined from currents evoked by application of AMPA or kainate at a series of holding potentials. The relative permeability of Ca2+ compared with Cs+ (PCa/PCs) was then determined from the following equation based on the Goldman-Hodgkin-Katz constant-field equation (Iino et al. 1990):
| (2) |
where F is Faraday's constant, R is the universal gas constant, T is the absolute temperature, and PCa and PCs represent the permeability coefficients of Ca2+ and Cs+, respectively. Other ions are neglected and it is assumed that [Ca2+]i (as well as [Cs+]o) is zero. The concentrations were corrected by multiplying by the activity coefficients (0.551 for Ca2+ and 0.707 for Cs+). The mean activity coefficients for CaCl2 and CsCl were estimated by interpolation after fitting an extended Debye-Hückel model (Atkins, 1998) to tabulated values of activity coefficients for these electrolytes (Robinson & Stokes, 1959). For CaCl2, the mean activity coefficient was estimated from the total ionic strength of the extracellular solution and it was assumed that the activity coefficient for Ca2+ was equal to the mean activity coefficient for CaCl2 (γ++ = γ±; cf. Shatkay, 1968). The measured Erev values were also corrected for the liquid junction potential that appeared during local superfusion with the high Ca2+/high NMDG+ solution.
Determination of single-channel conductance
All recordings used to determine single-channel characteristics were carried out on nucleated patches. Two different methods were used to estimate the single-channel chord conductance (γ). First, in several cases step transitions corresponding to single-receptor channel gating could be directly observed in the later portions of agonist responses. To measure the amplitude of completely resolved single-channel openings, we used the mean low-variance method (Patlak, 1988), using routines implemented in Igor Pro (courtesy of J. R. Howe; see Smith et al. 2000). After digital low-pass filtering at 0.5 or 2 kHz (-3 dB), the mean amplitude and variance of the closed-channel baseline points were calculated from a data segment before agonist application and subtracted from all points. The variance was calculated for a sliding window corresponding to a duration of two filter rise times (Tr = 0.3321/fc). Open points were identified according to two criteria: the mean amplitude was >2 s.d. of the baseline current and the variance of the points in the window was less than 25 % of the baseline variance. Histograms of the mean low-variance open points were fitted (TAC; maximum-likelihood algorithm) with a single Gaussian distribution to obtain the mean current of the open levels. In order to avoid binning artefacts, the bin width (usually 50 fA) was set to be an integer multiple of the AD unit during the original digitization of the current. The single-channel current, i, was taken as the difference between the open-channel peak and the baseline. The single-channel chord conductance was calculated as:
| (3) |
from the known holding potential (Em; -60 mV) and assuming Erev = 0 mV.
The second method used stationary and non-stationary noise (fluctuation) analysis. Stationary noise analysis (Neher & Stevens, 1977) was applied to steady-state kainate-evoked responses without significant changes of steady-state channel activity over time. Current was sampled for 10-30 s epochs (sampling interval 100 μs), both in the control condition and during agonist application. The control condition corresponded either to lack of drug application or to application of control solution. No difference between these two conditions was found. Current epochs were segmented and those with artefacts were either discarded or edited accordingly. Accepted traces were digitally high-pass filtered at 0.25 Hz, low-pass filtered at 1 kHz and compressed by a factor of five to generate a new record where the sampling interval was 500 μs. A fast Fourier transformation algorithm was used to obtain single-sided spectral density functions from 1024-point segments (Hann window function). The individual spectra thus obtained were averaged (n = 20.100) and the net spectrum of agonist-evoked current noise was obtained by subtracting the control spectrum from the spectrum calculated in the presence of agonist. Net spectra were fitted with the sum of two Lorentzian components:
 |
(4) |
where G(f) is the net one-sided spectral density, f is the frequency and G(0)1 and G(0)2 are the zero-frequency asymptotes (spectral density value for f = 0) and fc1 and fc2 are the half-power (corner) frequencies. From each half-power frequency value, a time constant was calculated as τ = 1/(2πfc). For curve fitting, the points in the spectrum were weighted as described by Colquhoun et al. (1979). The current variance, σ2(I), was calculated from the fit to the data as:
| (5) |
From current records with low channel open probability (< 0.1) the apparent single-channel current, i, was calculated as:
| (6) |
where I is the mean steady-state agonist-evoked current. For current records evoked by higher agonist concentrations, resulting in higher channel open probability, this underestimated the single-channel current and conductance and current variance was instead plotted against mean steady-state current for a series of different agonist concentrations. The data points were fitted with the parabolic function (Sigworth, 1980):
| (7) |
where i is the apparent single-channel current, I is the mean steady-state current and N is the number of available channels in the nucleated patch membrane (σb2, the variance of the background noise, had already been subtracted out so the fitted curve was constrained to go through the origin).
For non-stationary noise analysis (Sigworth, 1980), current responses to 100 ms duration application of AMPA or glutamate were evoked every 3 s (50 to 500 times). The sampling interval was 100 μs and for analysis the records were low-pass filtered at 2 or 5 kHz. To minimize errors due to run-down of the response amplitude, the ensemble variance was calculated from the difference current between successive records (Heinemann & Conti, 1992; implemented in PulseTools). Records with excessive baseline root mean square (RMS) noise (>15 pA) or excessive baseline variance (‘sigma base’ factor set to 4), as well as records for which the difference from neighbouring records exceeded a specified criterion (‘sigma pulse’ factor set to 5; eqn (15) of Heinemann & Conti, 1992), were discarded. The ensemble variance was plotted against the mean current and fitted with eqn (7) (omitting the rising phase of the response). For some cells the current-variance plot deviated from the theoretically parabolic relationship predicted by eqn (7). In such cases, the apparent unitary current could still be estimated by limiting curve fitting to the initial, linear part of the current-variance plot. The open probability (Po) at any given time is determined by the equation Po = I/iN.
RESULTS
Identification of AII amacrine cells in retinal slices
AII amacrine cells were visually targeted for recording according to the location of the cell body in the inner nuclear layer and the thick primary dendrite that tapers as it descends into the inner plexiform layer (Fig. 1A). Two additional criteria served to verify the identity of the cells as AII amacrine cells. First, all cells, except those recorded in the experiments to determine the relative Ca2+ permeability of AMPA receptor channels, were filled with Lucifer Yellow. Fluorescence microscopy subsequently allowed visualization of each cell's complete morphology, including lobular appendages in sublamina a and arboreal dendrites in sublamina b of the inner plexiform layer (Fig. 1B). This was possible also in the cases where nucleated patches had been pulled from the cell body (time period from breaking into a cell to excision of a nucleated patch was typically 1-3 min). Second, following establishment of the whole-cell recording configuration, 5 mV depolarizing voltage steps (5 ms duration) from a holding potential of -60 mV evoked a characteristic pattern of unclamped inward action currents with a mean amplitude of -186 ± 12.8 pA (range -63 to -511 pA; n = 44; Fig. 1D). The action currents were blocked by tetrodotoxin (300 nm; data not shown), indicating that they depended on activation of voltage-gated Na+ channels. Invariably, all cells that were initially targeted for recording based on the criteria listed above, and that subsequently displayed this response pattern, were identified as AII amacrine cells based on fluorescence microscopy.
Figure 1. AII (rod) amacrine cells in the rat retina.
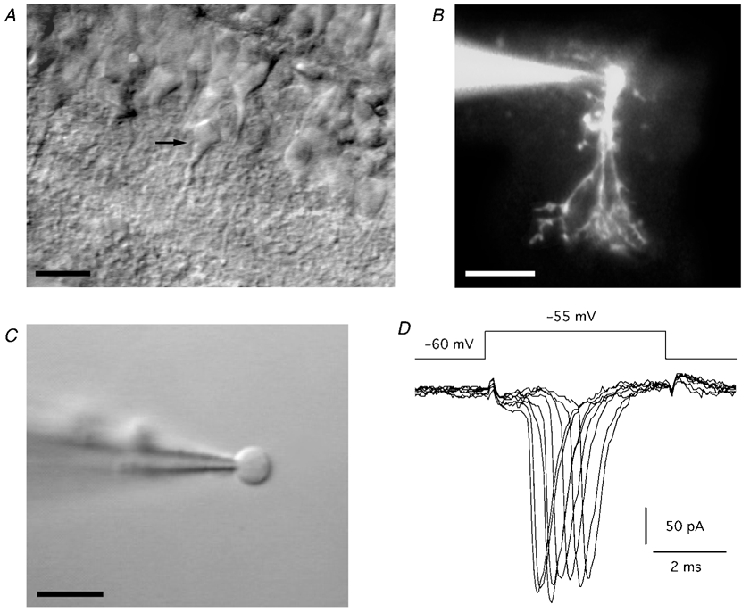
A, infrared differential interference contrast videomicrograph of an AII amacrine cell in a retinal slice. Arrow points towards the cell body. B, composite fluorescence photomicrograph of an AII amacrine cell filled with Lucifer Yellow. C, videomicrograph of a nucleated patch pulled from an AII amacrine cell in the retinal slice. D, electrophysiological ‘signature’ of an AII amacrine cell as observed in whole-cell recording. Notice inward action currents during escape from voltage clamp by brief 5 mV depolarizing steps from holding potential. Scale bars, 20 μm (A-B); 10 μm (C).
Currents activated by application of AMPA and kainate
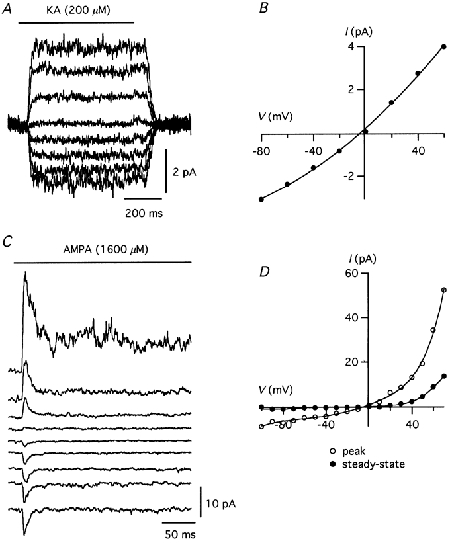
Pressure application of AMPA or kainate activated robust inward currents in all cells tested in the whole-cell configuration (Em = -60 mV; Fig. 2A and B). The amplitude of the response increased with increasing concentration of agonist and the responses rose to a steady-state level with no apparent desensitization (Fig. 2A and B). The averaged concentration-response relationships are shown in Fig. 2C (AMPA; EC50 118 μM, Hill coefficient 0.7) and Fig. 2D (kainate; EC50 169 μM, Hill coefficient 1.4). Because the speed of solution exchange at the receptor channels on the intact cells in the retinal slice is likely to be relatively slow, this could mask desensitization of rapidly activating and desensitizing receptor channels. We therefore repeated the experiments on nucleated outside-out patches from AII amacrine cells (Fig. 1C). For AMPA, low concentrations evoked only a sustained, steady-state response, whereas responses evoked by increasing concentrations showed marked desensitization and decayed to a low steady-state level during sustained agonist application (Fig. 2E). For the peak measurements, the EC50 was 217 μM and the Hill coefficient was 1.2 (Fig. 2G). For the steady-state measurements, the EC50 was 88 μM and the Hill coefficient was 1.6. For kainate, the amplitude of the steady-state component increased with increasing concentration and no apparent desensitization could be observed (Fig. 2F). Curve fitting gave values of 162 μM (EC50) and 2.8 (Hill coefficient; Fig. 2H).
Figure 2. Concentration- response relationships of AMPA- and kainate-evoked currents in whole-cell (slice) and nucleated outside-out patch recordings.
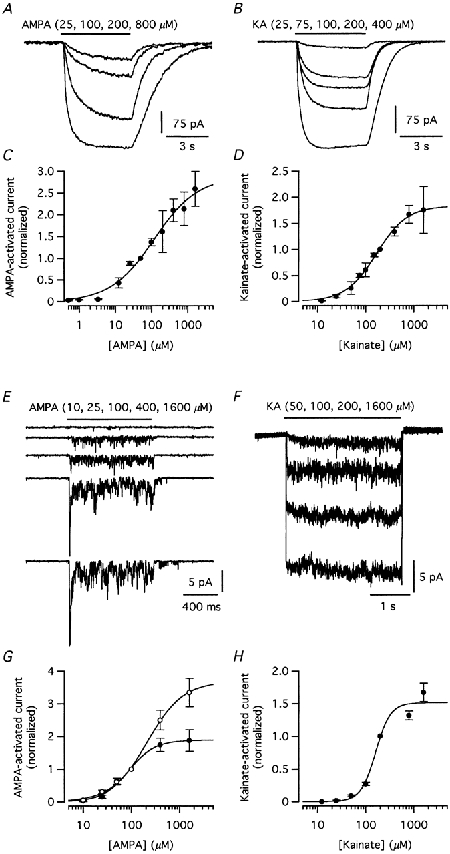
A, currents activated in an AII amacrine cell by application (5 s) of different concentrations of AMPA. In this and subsequent figures, the duration of drug application is indicated by the horizontal bar above the current trace. B, currents activated in an AII amacrine cell by application (5 s) of different concentrations of kainate. C, concentration-response relationship of the steady-state AMPA-activated current. Here and in subsequent figures, the agonist-activated current at each concentration is plotted as mean ± s.e.m. Data points normalized to the current at 50 μM (n = 2.8 cells for each data point). D, concentration-response relationship of the steady-state kainate-activated current. Data points normalized to the current at 200 μM (n = 2.10 cells for each data point). E, currents activated in a nucleated patch by application (1 s) of different concentrations of AMPA. F, currents activated in a nucleated patch by application (3 s) of different concentrations of kainate. G, concentration-response relationship of peak (○) and steady-state (•) current evoked by AMPA. Data points normalized to the current at 100 μM (n = 9 patches for each data point). H, concentration-response relationship of the steady-state current evoked by kainate. Data points normalized to the current at 200 μM (n = 12.16 patches for each data point).
Cyclothiazide potentiates currents evoked by application of AMPA
Cyclothiazide is a benzothiadiazine that modulates AMPA receptors by reducing agonist-evoked desensitization. There is evidence that this action is selective for AMPA receptors, with no effect on kainate receptors (Partin et al. 1993). For both nucleated patches (Fig. 3A and B) and whole-cell recordings (data not shown), application of cyclothiazide led to a clear enhancement of amplitude and duration of the AMPA-evoked current response. The response enhancement (relative to control responses in the absence of cyclothiazide) for nucleated patch experiments was 221 ± 53 % (n = 5; measured as the current integral over the duration of the response). For whole-cell recordings, the enhancement was 134 ± 28 % (n = 14). When response enhancement was estimated from the peak response amplitude, it was somewhat lower: 127 ± 30 % for nucleated patch recordings and 63 ± 4.5 % for whole-cell recordings.
Figure 3. Pharmacological properties of ionotropic non-NMDA receptors of AII amacrine cells.
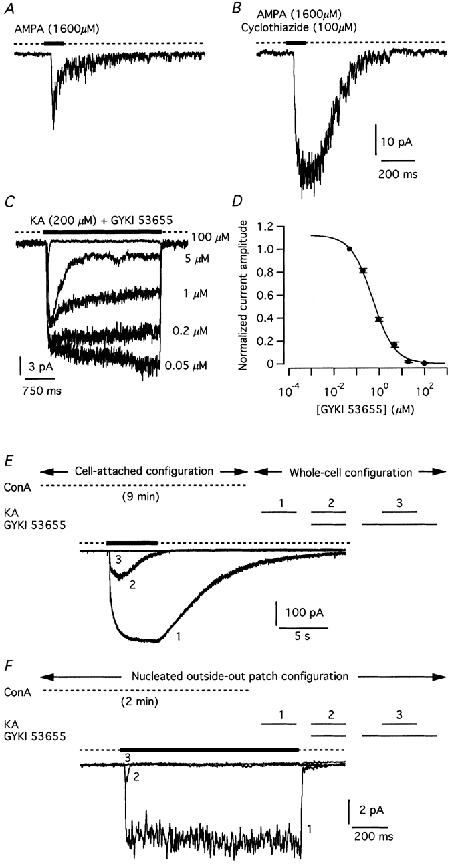
A, control response evoked in a nucleated patch by pressure application (100 ms) of AMPA. The dotted line above the current trace indicates application of control solution before and after application of AMPA. B, enhanced response evoked by AMPA after pre-incubation with 100 μM cyclothiazide (indicated by dotted line above current trace; same patch as in A). C, inhibition of current responses in a nucleated patch evoked by kainate in the presence of increasing concentrations of GYKI 53655 (applied simultaneously with kainate). The dotted line above the current traces indicates application of control solution before and after application of kainate and GYKI 53655. D, concentration- response curve for GYKI 53655 inhibition of steady-state currents evoked by kainate in nucleated patches. Data points normalized to the current evoked by kainate in the presence of 0.05 μM GYKI 53655 with results from 10 patches for each data point. E and F, pretreatment of AII amacrine cells with concanavalin A (ConA) does not reveal kainate-evoked responses resistant to GYKI 53655. Top panels in E and F illustrate experimental protocol and the sequence of drug applications (1, 2 and 3; corresponding to traces 1, 2 and 3 in bottom panels). Bottom panels in E and F illustrate responses evoked by kainate (1, 2 and 3). E, recordings from an intact AII amacrine cell. In the cell-attached configuration, pulses of ConA (2.9 s duration, 0.33 Hz) were applied for 9 min (upper dotted line). After breaking into the cell, the response to kainate (100 μM) was tested in three different ways: kainate alone (trace 1), kainate applied simultaneously with 100 μM GYKI 53655 (trace 2) and kainate applied simultaneously with 100 μM GYKI 53655 after pre-equilibration with 100 μM GYKI 53655 (trace 3). Here and in F, the lower dotted line above current trace indicates application of control solution (1, 2) or GYKI 53655 (3). F, recordings from a nucleated patch. Pulses of ConA (as in A) were applied for 2 min (upper dotted line). The response to kainate (200 μM) was tested in three different ways (as in E). Notice complete block of kainate response after pre-equilibration with GYKI 53655 (trace 3 in E and F).
GYKI 53655 blocks currents evoked by application of AMPA and kainate
The enhancement of the AMPA-evoked current response in the presence of cyclothiazide indicates the presence of AMPA receptors on AII amacrine cells. Both AMPA and kainate are known to act as agonists on such receptors (Dingledine et al. 1999). The question therefore arises whether the current responses evoked by application of kainate and AMPA can be fully accounted for by the presence of AMPA receptors, or whether AII amacrine cells also express kainate receptors. Boos et al. (1993) demonstrated that the response to AMPA and kainate could be blocked by the selective non-NMDA receptor antagonist CNQX (verified for three cells here; data not shown). Because kainate activates both AMPA and kainate receptors, and because CNQX and similar drugs block both AMPA and kainate receptors, this finding does not resolve the potentially different contributions of these two receptor subtypes. We examined this by investigating the effect of GYKI 53655, a non-competitive 2,3-benzodiazepine AMPA receptor antagonist with no or minimal effect on kainate receptors (Wilding & Huettner, 1995). For nucleated outside-out patch recordings, we tested the effect of GYKI 53655 on the response evoked by 200 μM kainate (Fig. 3C and D). In addition, we tested the effect of GYKI 53655 on the response evoked by 50 μM AMPA and 200 μM kainate in whole-cell recordings (data not shown). When GYKI 53655 and AMPA, or GYKI 53655 and kainate, were applied simultaneously (i.e. no pre-equilibration with GYKI 53655), increasing concentrations of GYKI 53655 reduced the steady-state component of the response until it was totally abolished at a concentration of approximately 100 μM. For nucleated patch recordings with kainate, the half-maximal inhibitory concentration (IC50) was 0.54 μM and the Hill coefficient was 0.9 (Fig. 3D). For whole-cell recordings with AMPA, the IC50 was 0.93 μM and the Hill coefficient was 0.7. For whole-cell recordings with kainate, the corresponding values were 1.7 μM (IC50) and 0.7 (Hill coefficient). Even at concentrations of GYKI 53655 that strongly reduced or blocked the steady-state response to AMPA or kainate, the agonist evoked an initial transient peak before the current response decayed to the sustained level (Fig. 3C). This is consistent with the relatively slow kinetics of block by 2,3-benzodiazepines (Donevan & Rogawski, 1993), but could also be caused by a rapidly desensitizing response mediated by receptor channels insensitive to GYKI 53655. However, when receptor channels were pre-equilibrated with GYKI 53655 prior to kainate application, no initial transient peak current could be observed (see Fig. 3E and F and below).
Lack of evidence for high-affinity kainate receptors after treatment with concanavalin A
The results from the experiments with GYKI 53655 suggested that AII amacrine cells do not express kainate receptors at detectable levels. A potential problem of interpretation, however, is that kainate rapidly desensitizes kainate receptors (Dingledine et al. 1999). Although the experiments with nucleated patches suggested that such desensitizing responses were not present, it is possible that kainate receptors, if expressed, are not localized at the cell bodies, from which the nucleated patches were pulled. In order to address this question, we attempted to block desensitization of putative kainate receptors by pre-treating cells with ConA (Partin et al. 1993). Because incubation of retinal slices with ConA in the extracellular medium prevented us from subsequently establishing gigaohm seals, we first established the cell-attached configuration and then applied ConA intermittently by pressure from several barrels of the multi-barrel complex (5-15 min). This method prevented washout and possible rundown of putative kainate-receptor-mediated responses during the period of treatment with ConA. After breaking into the cell, kainate was applied alone or co-applied with GYKI 53655 in order to block AMPA receptors, both with and without pre-equilibration with GYKI 53655 (Fig. 3E). In no case did treatment with ConA uncover a GYKI 53655-resistant current response to application of kainate (n = 26). As a further test, we performed similar experiments on nucleated patches. In this case, ConA was applied after establishing the nucleated patch configuration. There was no evidence for a GYKI 53655-resistant response component (Fig. 3F; n = 8). Taken together, these results suggest that AII amacrine cells do not express kainate receptors at detectable levels in our system and that the observed responses evoked by application of kainate can be fully accounted for by activation of AMPA receptors.
Current-voltage relationship of AMPA- and kainate-evoked currents in Na+-rich external solution
Figure 4 shows examples of nucleated patch responses evoked by AMPA (Fig. 4A) and kainate (Fig. 4C) at a series of membrane potentials. The corresponding I-V relations are shown in Fig. 4B and D. For AMPA, separate I-V relations were constructed for the peak current and for the steady-state component. For each patch, we calculated a rectification index (RI) as the ratio between the slope conductances at +40 mV and -60 mV (Gslope,+40 mV/Gslope,-60 mV). For the peak current (Erev = -0.7 ± 0.9 mV) the RI was 0.96 ± 0.11 (n = 13; Fig. 4B). For the steady-state current (Erev = -3.3 ± 1.8 mV) the RI was 5.6 ± 1.3 (Fig. 4B). For kainate-evoked currents in nucleated patches (Erev = -7.2 ± 1.3 mV) the RI was 0.75 ± 0.05 (n = 10; Fig. 4D). Because intracellular polyamines are known to be important for the rectification behaviour of certain non-NMDA receptor channel types (Kamboj et al. 1995; Koh et al. 1995a), spermine was added to the intracellular solution at either 25 μM (AMPA, n = 8) or 100 μM (AMPA, n = 5; kainate, n = 10). For the RI of the peak current evoked by AMPA, there was no statistically significant difference between patches with 25 and 100 μM spermine (P = 0.76).
Figure 4. Current-voltage (I-V) relationships for AMPA- and kainate-evoked responses in nucleated patch recordings.
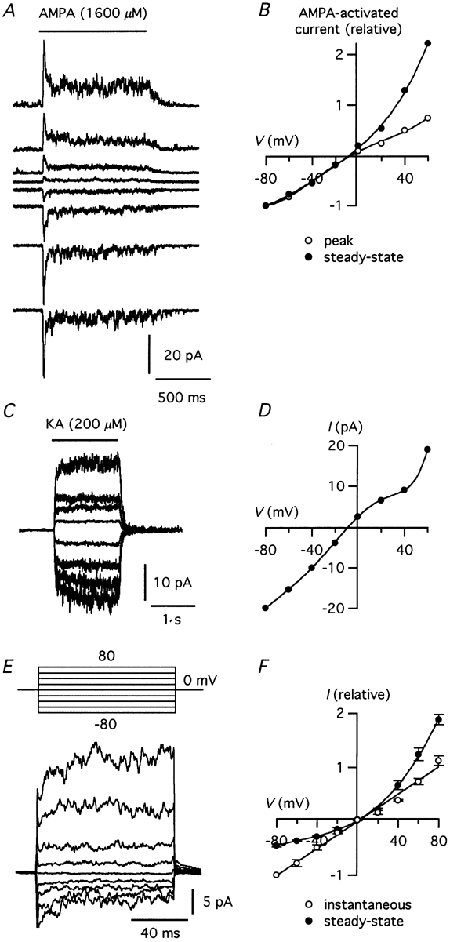
A, responses evoked by application of AMPA (1 s). Membrane potential was varied between -80 and 60 mV (20 mV steps). B, I-V relationship of AMPA-evoked peak (○) and steady-state (•) responses for patch in A. Data points were normalized to the corresponding response at -80 mV. C, responses evoked by kainate (1.5 s). Membrane potential was varied between -80 and 60 mV (20 mV steps). D, I-V relationship of kainate-evoked steady-state responses in C. E, voltage-dependent relaxation of AMPA-evoked currents (bottom) during voltage jumps from a holding potential of 0 mV to potentials from -80 to 80 mV (20 mV steps; top). Each trace is the average of 12 trials and represents the difference between current recorded during application of AMPA (800 μM) and during application of control solution. F, I-V relationships of the instantaneous current (○; fitted with a straight line) and the steady-state current at the end of the voltage pulses (•; fitted with a polynomial function). Data averaged from three patches after normalizing current values to the instantaneous current at -80 mV.
Similar experiments were performed for AMPA- and kainate-evoked currents in whole-cell recordings (data not shown). The evoked current reversed close to 0 mV (Erev (AMPA) = -4.7 ± 1.6 mV; n = 9; Erev (kainate) = -6.3 ± 1.7 mV; n = 8). The RI was 1.22 ± 0.14 for AMPA-evoked currents and 0.83 ± 0.07 for kainate-evoked currents. Spermine was included in the intracellular solution (100 μM). To investigate the mechanism underlying the outward rectification of the steady-state response component evoked by AMPA, we examined the time course of agonist evoked currents during voltage steps applied to nucleated outside-out patches. During continuous application of AMPA at a membrane potential of 0 mV, the membrane potential was stepped to a series of potentials between -80 mV and +80 mV for 100 ms (Fig. 4E). With voltage pulses to positive or negative potentials, a membrane current occurred instantaneously (outward for positive pulses, inward for negative pulses) and was followed by a relaxation to a plateau (increase for positive pulses, decrease for negative pulses). For larger amplitude pulses, the relaxations could be well fitted with monoexponential functions. For smaller amplitude pulses, the membrane currents were instead fitted with straight lines. Similar results were observed for four other patches. The I-V curve corresponding to the instantaneous current (extrapolated to the beginning of the pulse) was approximately linear, whereas the I-V curve corresponding to the plateau current at the end of the voltage pulses displayed clear outward rectification (Fig. 4F).
Ca2+ permeability of AMPA receptor channels
In order to study the selectivity of the receptor channels for Ca2+ ions, we recorded agonist-evoked responses in nucleated patches under bi-ionic conditions (see Methods). Figure 5A and B shows an example of responses evoked by kainate (200 μM) together with the corresponding I-V relationship (Erev = -3.7 mV). The average Erev was -12.4 ± 2.5 mV (n = 5 patches). From these values, the permeability ratio (PCa/PCs) of the somatic AMPA receptors was calculated according to eqn (2), yielding an average value of 1.9 ± 0.24.
Figure 5. Significant Ca2+ permeability of AMPA receptor channels in nucleated patches from AII amacrine cells.
A, responses evoked by kainate (1.5 s) under bi-ionic conditions ([Ca2+]out = 30 mm, [Cs+]in = 171 mm). Membrane potential was varied between -80 and 60 mV (20 mV steps). Each trace is the average of two trials. B, I-V relationship of steady-state responses in A. C, responses evoked by AMPA (500 ms; inital part shown) under bi-ionic conditions (as in A). Membrane potential varied between -100 and 60 mV (20 mV steps). Each trace is the average of two trials. D, I-V relationship of AMPA-evoked peak (○) and steady-state (•) responses of same patch as in C.
For AMPA-evoked responses, I-V relationships could be analysed separately for the peak and steady-state response components. For the example illustrated in Fig. 5C and D, the Erev was -5.5 mV (peak) and -5.2 mV (steady-state). The average Erev was -10.7 ± 1.8 mV for the peak response (n = 10) and -13.2 ± 3.2 mV for the steady-state response (n = 7; for three patches the steady-state response was too small for adequate measurement). The corresponding permeability ratio (PCa/PCs) was 2.1 ± 0.21 (peak) and 1.9 ± 0.36 (steady-state). There was no statistically significant difference between the permeability ratios measured for AMPA- and kainate-evoked responses (P > 0.19, paired t test for comparison of peak and steady-state AMPA-evoked responses). In control experiments, I-V relations were measured in extracellular solution containing 145 mm NMDG+ and nominally 0 mm Ca2+. No inward current was observed during application of 200 μM kainate (Erev < -100 mV), indicating that the channels are not measurably permeable to NMDG+ (n = 3 patches; data not shown). Because Lucifer Yellow was not added to the intracellular solution, only cells that satisfied the general morphological criteria (Fig. 1A), and displayed the electrophysiological ‘AII signature’ (Fig. 1D), were included for analysis.
Single-channel properties determined by stationary noise analysis of steady-state kainate-evoked currents
Both for low and high concentrations of kainate (50-1600 μM; 10-30 s), application caused a marked increase of current noise (Fig. 6A and B). Each net kainate-evoked noise spectrum was fitted with two Lorentzian components (between 1.95 and 1000 Hz). Figure 6 shows the net spectra and resulting curve fits for responses evoked by 50 μM (Fig. 6C) and 200 μM kainate (Fig. 6D) from the same patch. The half-power frequencies of each Lorentzian function (fc1 and fc2) are indicated by vertical arrows. For the response evoked by 50 μM kainate, the estimated time constants of the two Lorentzian functions were τ1 = 1.45 ms and τ2 = 0.47 ms, respectively. For nucleated patches tested with 50 μM kainate, the mean time constants were τ1 = 1.72 ± 0.36 ms and τ2 = 0.51 ± 0.07 ms (n = 4). One possibility is that the two time constants correspond to the time constants of two components in the distributions of burst durations of a single opening level (Howe et al. 1988). Alternatively, they could reflect openings to more than one current level. The average ratio between the zero-frequency spectral density asymptotes (G(0)1/G(0)2) was 3.89 ± 0.32.
Figure 6. Stationary noise analysis of kainate-evoked responses in nucleated patches from AII amacrine cells.
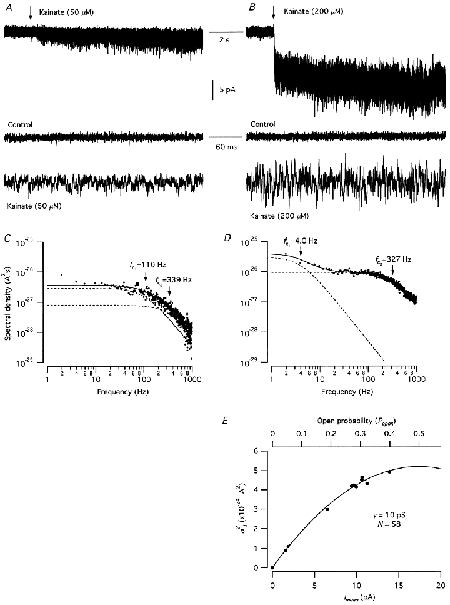
A and B, responses evoked by application of kainate (onset of application indicated by vertical arrows). Top traces illustrate current responses on a slow time scale, and middle and bottom traces illustrate stationary membrane current noise on a faster time scale, during control and during application of kainate, respectively. C and D, net power density spectra obtained from the current noise evoked by 50 μM kainate (C) and 200 μM kainate (D) during the responses illustrated in A and B, respectively. The power spectra for the (net) kainate-evoked noise have been fitted (continuous curves) with the sum of two Lorentzian functions (dashed lines). The half-power cut-off (corner) frequency of each Lorentzian function is indicated by a vertical arrow (fc1, fc2). E, net current variance (σI2) plotted against mean current (Imean) for a series of different kainate-evoked responses in the same nucleated patch (50-1600 μM). The data points were obtained by power spectral density analysis (as illustrated in C and D) and were fitted with a parabolic function (eqn (7)). The apparent single-channel current, i, was 0.6 pA and the number of available receptor channels, N, was 58.
As illustrated in Fig. 6C, there was excess current variance at frequencies below 5-10 Hz. This excess low-frequency variance increased with increasing concentration of kainate, thereby changing the parameters of the fitted Lorentzian functions (Fig. 6D). For the response evoked by 200 μM kainate in the same patch, the estimated time constants of the two Lorentzian functions were τ1 = 39.5 ms and τ2 = 0.49 ms. For nucleated patches tested with 200 μM kainate (one with 800 μM), the mean time constants were τ1 = 51.2 ± 14.1 ms and τ2 = 0.51 ± 0.06 ms (n = 4). One possibility is that the long time constant could correspond to long clusters of bursts of channel openings (cf. Howe et al. 1988). The average ratio between the zero-frequency spectral density asymptotes (G(0)1/G(0)2) was 5.54 ± 0.90. If the lowest frequency point was omitted from curve fitting (cf. Howe et al. 1988), the estimated time constants were similar to those obtained from responses to low concentrations of kainate (see above); the mean values were τ1 = 1.78 ± 0.17 ms and τ2 = 0.37 ± 0.02 ms (n = 3).
We next estimated the net kainate-evoked increase in current variance as the integral under the sum of the two Lorentzian functions fitted to each spectral density plot. The resulting variance was plotted vs. the mean steady-state current. The variance initially increased linearly with mean current, consistent with a low open-probability of the activated channels (n = 4). For three patches, the slope of the variance vs. mean curve declined with increasing agonist concentration (Fig. 6E). The apparent elementary conductance was estimated by fitting the data points either with a straight line (σ2(I) = iI; n = 1) or with eqn (7) (n = 3). The apparent elementary chord conductance (γ) activated by kainate was 8.8 ± 0.6 pS (range 7.3-9.9 pS; cf. eqn (3)). Curve fitting (eqn (7)) also estimated N (the number of available receptor channels in each patch) to be 94 ± 36 (n = 3), corresponding to a maximum Po of 0.51 ± 0.10.
Non-stationary noise analysis of simulated responses
In order to constrain the parameters of eqn (7), it is of advantage when Po undergoes a large variation during the agonist application, ideally exceeding the value of 0.5. With a more slowly rising temporal concentration profile of agonist at the receptors, rapid receptor desensitization could strongly reduce the maximum Po, thereby preventing us from determining both i and N (cf. Traynelis & Wahl, 1997). Even at low Po, however, it should be possible to obtain estimates for i, given that i is the slope at zero of the parabolic function of eqn (7). In order to get an idea about realistic values for Po and the sensitivity of our determination of i to the speed of drug application in our experiments, we measured the typical time course of solution exchange with our pressure application system. Under optimal conditions, the 10-90 % rise time of the response was 1.4-3 ms and the waveform could be well approximated by a step response low-pass filtered at 100-250 Hz (-3 dB, digital Gaussian filter). This is nevertheless an underestimate of the true exchange time because our experiments were done with nucleated patches (Fig. 1D), not small outside-out patches.
Potential errors in the estimates from non-stationary analysis introduced by slow and variable speed of agonist application were examined as described by Traynelis & Wahl (1997). Current responses were generated by stochastic simulations based on a kinetic Markov model proposed for AMPA receptor gating in hippocampal interneurones (Geiger et al. 1999; Fig. 7A). The number of receptor channels was set to 100, the single-channel conductance to 10 pS, the driving force (Em – Erev) to 60 mV, the maximum agonist concentration to 1 mm and the time interval to 10 μs. The rate constants of the kinetic model are indicated in the legend of Fig. 7. Gaussian distributed noise (standard deviation 0.25 pA) was added to all simulated records. Although the parameter estimates of non-stationary noise analysis are model independent, we preferred a more realistic kinetic model over a simpler one (e.g. Traynelis & Wahl, 1997), mainly because Po for a given agonist concentration is not model independent. Each stimulus waveform was generated by digitally filtering a step waveform with a Gaussian filter (-3 dB cut-off; Fig. 7B). For each condition, corresponding to a given speed of drug application (10-90 % rise time ranging from 10 μs to 31 ms), 10 sets of 50 epochs were simulated. This allowed us to calculate 95 % confidence intervals, thereby estimating the variability of the parameter estimates. To examine potential errors introduced by system filtering of current records (Silberberg & Magleby, 1993; Traynelis & Wahl, 1997), the results from each stimulus condition were analysed unfiltered and after low-pass filtering at 1, 2 and 10 kHz (-3 dB cut-off, digital Gaussian filter).
Figure 7. Non-stationary noise analysis of simulated glutamate-activated currents as a function of solution exchange time.
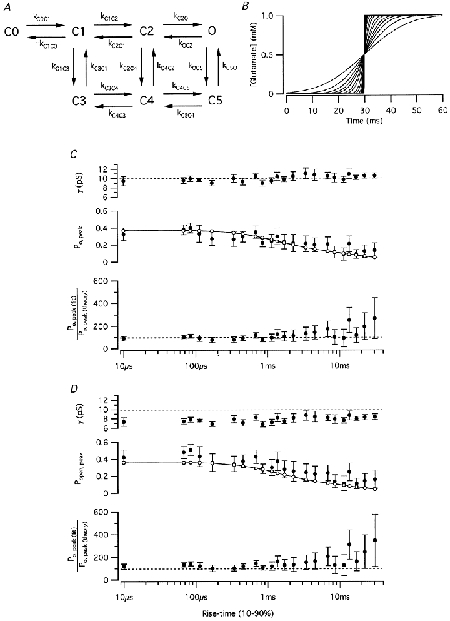
A, kinetic scheme used for simulating agonist responses. The rate constants were as follows: kC0C1 = 17.1 × 10⁶ m−1 s−1, kC1C0 = 0.157 × 10³ s−1, kC1C2 = 3.24 × 10⁶ m−1 s−1, kC2C1 = 3.76 × 10³ s−1, kC2O = 14.9 × 10³ s−1, kOC2 = 4.00 × 10³ s−1, kC1C3 = 1.53 × 10³ s−1, kC3C1 = 0.408 × 10³ s−1, kC2C4 = 0.502 × 10³ s−1, kC4C2 = 0.000377 × 10³ s−1, kOC5 = 0.121 × 10³ s−1, kC5O = 0.191 × 10³ s−1, kC3C4 = 0.611 × 10⁶ m−1 s−1, kC4C3 = 0.00200 × 10³ s−1, kC4C5 = 1.59 × 10³ s−1, kC5C4 = 899 × 103 s−1. B, plots of glutamate concentration versus time for a series of simulated solution exchange times. In the fastest application, the concentration of glutamate rose from baseline (0 mm) to maximum (1 mm) in one simulation time-step (10 μs). C, results from non-stationary analysis of simulated responses (10 sets of 50 responses for each of the agonist exchange times illustrated in B). The top plot shows the estimated γ as a function of exchange time (dashed horizontal line indicates true single-channel conductance of 10 pS). The middle plot shows the open probability at the peak response (Po, peak) as a function of solution exchange time (filled circles = Po, peak(fit), determined from the fitted values for i and N from non-stationary noise analysis; open circles connected by continuous line = Po, peak (theory), calculated from the simulated response amplitude and defined values for i and N). The bottom plot shows the relation between Po, peak(fit) and Po, peak(theory) as a function of solution exchange time. Here and in D, error bars indicate 95 % confidence intervals. D, results from non-stationary analysis of simulated responses after low-pass filtering at 2 kHz. Notice consistent underestimation of apparent single conductance (top plot). Independent of low-pass filtering, increasing solution exchange time has little effect on the reliability of estimating γ, but increases the variability of estimates of N and thereby Po, peak (C and D).
The simulation results verified that even in experiments with very low speed of drug application, the estimates of the apparent single-channel conductance by non-stationary noise analysis is as reliable as estimates with much faster speed of drug application (Fig. 7C). However, for analysis of rapidly activating and desensitizing receptors, our speed of solution exchange will in general be too slow for reliable estimates of the number of available receptor channels (N) and therefore of Po (Fig. 7C). Furthermore, low-pass filtering of the current records consistently underestimated the apparent single-channel conductance and thereby overestimated Po, peak (Fig. 7D). The error increased with increasing degree of filtering.
Non-stationary analysis of transient currents evoked by application of AMPA and glutamate
Non-stationary noise analysis was performed with application of either glutamate (1 mm; with 30 μM CPP to block NMDA-type receptor channels) or AMPA (1.6 mm; 0.8 mm in a few experiments) to nucleated patches. Figure 8A shows three successive records evoked by glutamate and Fig. 8B shows the corresponding differences in current response between the records. The ensemble mean and variance are shown as a function of time in Fig. 8C and D, respectively (n = 2.2 epochs). The variance vs. mean plot clearly deviated from linearity (Fig. 8E), suggesting that the data points spanned a wide enough range for a satisfactory fit with eqn (7), allowing an estimate of N and Po. The apparent glutamate-activated single-channel current was 1.40 pA, corresponding to an apparent single-channel chord conductance of 23 pS. The number of active channels was estimated as 34, corresponding to a maximum Po at the peak response of 0.34. For patches tested with glutamate, the mean single-channel chord conductance was 15.2 ± 2.9 pS (range 5.5-23.0; n = 6). For patches tested with AMPA, the mean single-channel chord conductance was 20.1 ± 2.5 pS (range 9.9-38.4; n = 11). For five patches tested with glutamate or AMPA, Po was high enough to give a reasonably well constrained fit to the data points of the variance vs. mean current plot, yielding values for the maximum Po of 0.26 ± 0.025.
Figure 8. Non-stationary noise analysis of glutamate-evoked responses in nucleated patches from AII amacrine cells.
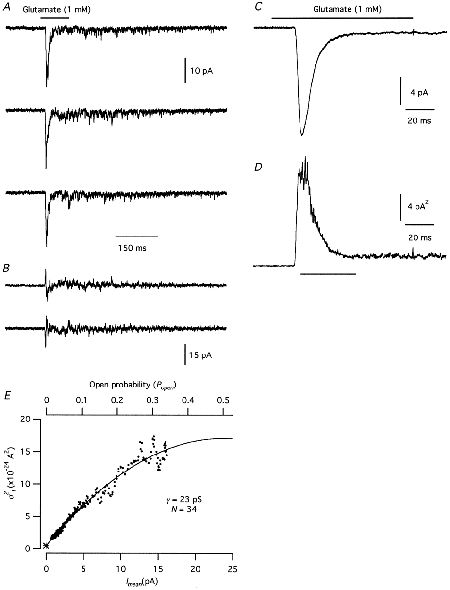
A, three successive records obtained by application of glutamate (100 ms pulses). B, sequential difference currents between successive individual records illustrated in A. C, the mean current of 242 glutamate-evoked responses, three of which are illustrated in A. D, the ensemble current variance for the glutamate-evoked responses, calculated from the difference currents (B) between successive responses (A). E, plot of current variance (σI2) versus mean current (Imean; C). The time range used for the variance versus mean plot is indicated by the horizontal bar below the plot in D. The data points were fitted with a parabolic function (eqn (7)). The baseline variance is indicated by *.
In the noise analysis experiments, we were able to estimate the number of active channels in 10 nucleated patches. Taking into account the capacitance of each nucleated patch, and assuming a specific membrane capacitance of 0.01 pF μm−2, a lower limit of the receptor channel density was estimated to be 0.95 ± 0.15 channels μm−2.
The average apparent single-channel conductance estimated for agonist-evoked responses obscures the fact that there was clear clustering of the estimated values. Figure 9A shows a histogram of apparent single-channel conductance values estimated for responses evoked by glutamate, AMPA and kainate. The most marked clustering is centred at ∼23 pS and at ∼9 pS. In addition, there are observations centred at ∼15 pS, as well as a single observation at 38 pS. Because the receptor population expressed by AII amacrine cells might be heterogeneous, and because each receptor channel might open to different conductance levels (Rosenmund et al. 1998; Smith & Howe, 2000), the apparent single-channel conductance estimated from noise analysis is likely to represent a weighted mean of the conductance of the main and several subconductance states. The weights are determined by the relative number of channels, the single-channel conductance(s) for each channel type and their open probability (Cull-Candy et al. 1988). The question therefore arises whether some of the apparent single-channel conductance values estimated by noise analysis correspond to observable single-channel conductance levels. For several nucleated patches, we could directly observe discrete transitions between open and closed states in late phases of individual current responses. Figure 9B shows an example of single-channel gating in response to application of glutamate. The single-channel current was estimated by constructing a mean low-variance open-point histogram on a sample-to-sample basis for one or more selected segments of the current traces. For the patch illustrated in Fig. 9B, the single-channel chord conductance value was 22.1. For the same patch, other current traces displayed similar openings to the same current level as shown here, as well as openings to lower current levels. Several other patches displayed single-channel openings corresponding to a conductance value of ∼23 pS. Because of multiple current levels and overlapping events, the analysis of single-channel openings was not pursued further.
Figure 9. Single-channel conductance of AMPA receptor channels in nucleated patches from AII amacrine cells.
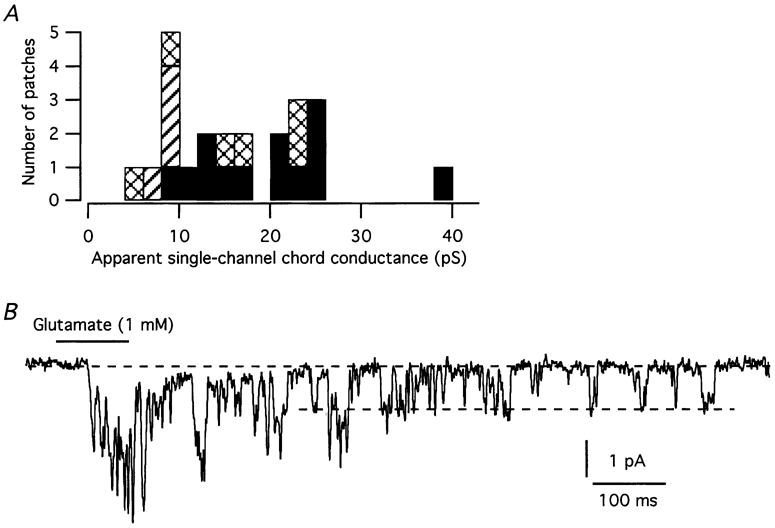
A, frequency distribution of apparent single-channel conductances for AMPA receptor channels estimated by stationary (kainate) and non-stationary (AMPA, glutamate) noise analysis. Bin width 2 pS. Filled bars, AMPA; hatched bars, kainate; cross-hatched bars, glutamate. B, current trace illustrating directly resolvable single-channel gating in response to application of glutamate. Dashed lines indicate either baseline current when no agonist-evoked current flows (top line) or inward current during channel opening (bottom line).
DISCUSSION
Functional properties of AMPA receptors in AII amacrine cells
We identified the responses evoked by AMPA and kainate in AII amacrine cells as being mediated by high-affinity AMPA receptors. Fast application of AMPA to nucleated patches evoked a fast-desensitizing response and the EC50 of the peak response was higher than the EC50 of the steady-state response (similar to the EC50 of the response seen in intact cells). Application of kainate evoked only a steady-state response (patches and intact cells). The EC50 of kainate responses is similar to previous values obtained for kainate activation of AMPA receptors and larger than previous values for kainate activation of kainate receptors (e.g. Pemberton et al. 1998). Cyclothiazide strongly potentiated responses evoked by AMPA in both intact cells and patches. The response to AMPA was completely blocked by the non-competitive AMPA-receptor-specific antagonist GYKI 53655. GYKI 53655 also blocked responses evoked by kainate, even when cells or patches were treated with ConA, a lectin known to reduce, if not completely block, agonist-evoked desensitization of kainate receptors. When receptors were pre-equilibrated with GYKI 53655 the response to kainate was completely blocked, indicating that it was mediated by AMPA receptor channels. The IC50 for GYKI 53655 inhibition of AMPA- and kainate-evoked responses was very similar to previously reported values for inhibition of AMPA receptors (Wilding & Huettner, 1995; Pemberton et al. 1998).
The peak component of AMPA-evoked responses and the steady-state component of kainate-evoked responses displayed approximately linear I-V relations. The steady-state component of desensitizing AMPA-evoked responses displayed outward rectification. Voltage-jump experiments during application of AMPA evoked responses with voltage-dependent relaxation to a steady state, with approximately linear I-V relation of the instantaneous current and clear outward rectification of the steady-state current I-V relation. This suggests that the steady-state outward rectification is caused by a voltage-dependent change in the channel open-close equilibrium. The approximately linear instantaneous I-V relation suggests that there is little voltage dependence of the channel conductance. I-V relations of agonist-evoked responses under bi-ionic conditions indicated a significant Ca2+ permeability of the channels.
In experiments with stationary noise analysis, kainate activated receptor channels with an apparent single-channel conductance around 9 pS. Non-stationary noise analysis of desensitizing responses evoked by glutamate and AMPA yielded apparent single-channel conductances around 9 and 23 pS, as well as one observation at 38 pS and some in a range around 15 pS. The observation at 23 pS was confirmed by direct observations of discrete single-channel gating. Further work is required to decide whether the other apparent conductance levels correspond to discrete conductance levels. It is unclear whether the different conductance levels correspond to different AMPA receptor channel subtypes (Swanson et al. 1997) or whether they correspond to different subconductance levels of the same receptors (Rosenmund et al. 1998; Smith & Howe, 2000; Smith et al. 2000). These possibilities are not mutually exclusive and in any case there would be a differential contribution to the responses observed in different patches.
Comparison of AMPA receptor channels in AII amacrine cells and other native and recombinant AMPA receptor channels
There is evidence that both rectification properties and Ca2+ permeability of AMPA receptor channels are determined by the edited form of the GluR-B subunit (Hollmann et al. 1991; Verdoorn et al. 1991). Accordingly, the relatively high Ca2+ permeability of the (extrasynaptic) AMPA receptors of AII amacrine cells suggests receptors with little GluR-B. This is consistent with results from recent immuno-electronmicroscopic studies, which suggested the location of GluR-D, as well as GluR-C, but not GluR-A or GluR-B, to be in synapses made by rod bipolar cells on AII amacrine cells (Qin & Pourcho, 1999; see also Ghosh et al. 2001). On the other hand, the relatively high Ca2+ permeability would also suggest channels with significant inward rectification, as has been found for channels with high Ca2+ permeability in interneurons in other areas of the CNS (e.g. basket cells in the dentate gyrus; Koh et al. 1995b). Indeed, Ca2+ permeability seems to be more sensitive to GluR-B abundance than is rectification (Washburn et al. 1997). It should be noted, however, that a few previous studies have identified native AMPA receptors with similar properties. Gilbertson et al. (1991) found linear I-V relations and high Ca2+ permability of non-NMDA receptors in bipolar cells of salamander retina. Otis et al. (1995) found outwardly rectifying I-V relations and high Ca2+ permability in neurons of the chick nucleus magnocellularis, and these properties were verified for synaptic receptors. Although polyamine blockers were not included in the pipette solution, both studies used whole-cell recording and it seems unlikely that the absence of inward rectification can be explained by loss of cytoplasmic polyamine channel blockers, as has been observed in recordings from excised outside-out patches (e.g. Kamboj et al. 1995; Koh et al. 1995a).
There is evidence that single-channel conductances are relatively high for Ca2+-permeable receptor channels, and lower for Ca2+-impermeable receptor channels, and conductance seems largely attributable to variable expression of (fully edited) GluR-B (Swanson et al. 1997). Accordingly, the presence of Ca2+-permeable receptors in AII amacrine cells fits well with the presence of the relatively larger conductance levels observed both directly and in non-stationary noise analysis. AMPA receptors with relatively high single-channel conductances have been found in hippocampal basket cells (Haverkampf et al. 1997; Geiger et al. 1999), hippocampal aspiny hilar interneurones (Livsey et al. 1993) and visual cortex interneurones (Hestrin, 1993). Interestingly, Haverkampf et al. (1997) found a mosaic of low-conductance (≈11 pS) and high-conductance channels (≈23 pS and ∼38 pS) and concluded that channels containing the GluR-B subunit corresponded to the low-conductance events. The presence of Ca2+-permeable, high-conductance receptors in AII amacrine cells could also suggest the presence of receptor channels with rapid gating kinetics, possibly corresponding to the presence of GluR-D subunits in heteromeric combinations (Mosbacher et al. 1994; Geiger et al. 1995). Measurement of activation, deactivation and desensitization kinetics will require ultrafast application of agonist to membrane patches (Jonas & Sakmann, 1992).
Glutamatergic input to AII amacrine cells
The receptors examined most extensively in the present study were located in the somatic region of the AII amacrine cells, an area not known to receive glutamatergic synaptic input. If these extrasynaptic AMPA receptor channels are similar to the synaptic receptors, their functional characteristics have implications for the afferent, glutamatergic synaptic pathways. First, our results predict synaptic receptor channels with significant Ca2+ permeability. The presence of Ca2+-permeable AMPA receptor channels opens up another pathway of Ca2+ influx in addition to one mediated by NMDA receptor channels (Hartveit & Veruki, 1997). Influx of Ca2+ during activation of synaptic receptors could have important consequences for the integrative and metabolic properties of AII amacrine cells and it is noteworthy that AII amacrine cells contain the Ca2+-binding protein parvalbumin (Wässle et al. 1993), similar to some hippocampal interneurones (reviewed by McBain & Fisahn, 2001). Interestingly, using imaging techniques to study the intracellular concentration of Ca2+ in mouse retinal slices, Habermann et al. (2000) recently reported that ionotropic non-NMDA receptor agonists evoked an increase of Ca2+ in the arboreal dendrites, but not in the lobular appendages. This suggests that Ca2+-permeable AMPA receptor channels similar to those detected in our study are localized to the arboreal dendrites, while presumed channels with no or low Ca2+ permeability could be targeted to the lobular appendages.
The second prediction from our results is that some of the AMPA receptor channels mediating glutamatergic input to AII amacrine cells are likely to have fast gating kinetics and that the corresponding EPSCs will have a fast time course, similar to that observed for excitatory input to GABAergic interneurones (Livsey & Vicini, 1992; Hestrin, 1993; Geiger et al. 1999) and neurons in the auditory pathway (Zhang & Trussell, 1994). Interestingly, spontaneous EPSCs with rapid rise and decay times (10-90 % rise time ∼300 μs; τdecay ∼700 μs, at ∼25 °C) have been recorded in AII amacrine cells in rat retinal slices (M. L. Veruki, unpublished observations). The cellular localization of these EPSCs and the functional importance of their kinetic properties remain to be elucidated.
Acknowledgments
We thank Dr J. R. Howe for generously supplying software routines for variance mean analysis, and Dr A. Roth for valuable advice on calculation of ionic activity coefficients. Cyclothiazide and GYKI 53655 were generous gifts from Eli Lilly and Company (Indianapolis, USA). Financial support from the Norwegian Research Council (NFR 129566/310, 123485/310, 123487/310 and 132586/300) and the Meltzer fund (University of Bergen) is gratefully acknowledged.
REFERENCES
- Atkins PW. Physical Chemistry. 6. Oxford: Oxford University Press; 1998. [Google Scholar]
- Boos R, Schneider H, Wässle H. Voltage- and transmitter-gated currents of AII-amacrine cells in a slice preparation of the rat retina. Journal of Neuroscience. 1993;13:2874–2888. doi: 10.1523/JNEUROSCI.13-07-02874.1993. [DOI] [PMC free article] [PubMed] [Google Scholar]
- Colquhoun D, Dreyer F, Sheridan RE. The actions of tubocurarine at the frog neuromuscular junction. Journal of Physiology. 1979;293:247–284. doi: 10.1113/jphysiol.1979.sp012888. [DOI] [PMC free article] [PubMed] [Google Scholar]
- Cull-Candy SG, Howe JR, Ogden DC. Noise and single channels activated by excitatory amino acids in rat cerebellar granule neurones. Journal of P hysiology. 1988;400:189–222. doi: 10.1113/jphysiol.1988.sp017117. [DOI] [PMC free article] [PubMed] [Google Scholar]
- Dingledine R, Borges K, Bowie D, Traynelis SF. The glutamate receptor ion channels. Pharmacological Reviews. 1999;51:7–61. [PubMed] [Google Scholar]
- Donevan SD, Rogawski MA. GYKI 52466, a 2,3-benzodiazepine, is a highly selective, noncompetitive antagonist of AMPA/kainate receptor responses. Neuron. 1993;10:51–59. doi: 10.1016/0896-6273(93)90241-i. [DOI] [PubMed] [Google Scholar]
- Geiger JRP, Melcher T, Koh D-S, Sakmann B, Seeburg PH, Jonas P, Monyer H. Relative abundance of subunit mRNAs determines gating and Ca2+ permeability of AMPA receptors in principal neurons and interneurons in rat CNS. Neuron. 1995;15:193–204. doi: 10.1016/0896-6273(95)90076-4. [DOI] [PubMed] [Google Scholar]
- Geiger JRP, Roth A, Taskin B, Jonas P. Glutamate-mediated synaptic excitation of cortical interneurons. In: Jonas P, Monyer H, editors. Ionotropic Glutamate Receptors in the CNS, Handbook of Experimental Pharmacology. Vol. 141. Berlin, Heidelberg: Springer Verlag; 1999. [Google Scholar]
- Ghosh KK, Haverkamp S, Wässle H. Glutamate receptors in the rod pathway of the mammalian retina. Journal of Neuroscience. 2001;21:8636–8647. doi: 10.1523/JNEUROSCI.21-21-08636.2001. [DOI] [PMC free article] [PubMed] [Google Scholar]
- Gilbertson TA, Scobey R, Wilson M. Permeation of calcium ions through non-NMDA glutamate channels in retinal bipolar cells. Science. 1991;251:1613–1615. doi: 10.1126/science.1849316. [DOI] [PubMed] [Google Scholar]
- Goldstein IJ, Hollerman CE, Smith EE. Protein-carbohydrate interaction. II. Inhibition studies on the interaction of concanavalin A with polysaccharides. Biochemistry. 1965;4:876–883. doi: 10.1021/bi00881a013. [DOI] [PubMed] [Google Scholar]
- Habermann CJ, Wässle H, Protti DA. Ionotropic glutamate receptors and voltage-dependent calcium channels in mouse AII amacrine cells. Society for Neuroscience Abstracts. 2000;26:248. [Google Scholar]
- Hartveit E. Membrane currents evoked by ionotropic glutamate receptor agonists in rod bipolar cells in the rat retinal slice preparation. Journal of Neurophysiology. 1996;76:401–422. doi: 10.1152/jn.1996.76.1.401. [DOI] [PubMed] [Google Scholar]
- Hartveit E, Veruki ML. AII amacrine cells express functional NMDA receptors. NeuroReport. 1997;8:1219–1223. doi: 10.1097/00001756-199703240-00032. [DOI] [PubMed] [Google Scholar]
- Haverkampf K, Lübke J, Jonas P. Single-channel properties of native AMPA receptors depend on the putative subunit composition. Society for Neuroscience Abstracts. 1997;23 [Google Scholar]
- Heinemann SH, Conti F. Nonstationary noise analysis and application to patch clamp recordings. Methods in Enzymology. 1992;207:131–148. doi: 10.1016/0076-6879(92)07009-d. [DOI] [PubMed] [Google Scholar]
- Hestrin S. Different glutamate receptor channels mediate fast excitatory synaptic currents in inhibitory and excitatory cortical neurons. Neuron. 1993;11:1083–1091. doi: 10.1016/0896-6273(93)90221-c. [DOI] [PubMed] [Google Scholar]
- Hollmann M, Hartley M, Heinemann S. Ca2+ permeability of KA-AMPA-gated glutamate receptor channels depends on subunit composition. Science. 1991;252:851–853. doi: 10.1126/science.1709304. [DOI] [PubMed] [Google Scholar]
- Howe JR, Colquhoun D, Cull-Candy SG. On the kinetics of large-conductance glutamate-receptor ion channels in rat cerebellar granule neurons. Proceedings of the Royal Society B. 1988;233:407–422. doi: 10.1098/rspb.1988.0030. [DOI] [PubMed] [Google Scholar]
- Iino M, Ozawa S, Tsuzuki K. Permeation of calcium through excitatory amino acid receptor channels in cultured rat hippocampal neurones. Journal of Physiology. 1990;424:151–165. doi: 10.1113/jphysiol.1990.sp018060. [DOI] [PMC free article] [PubMed] [Google Scholar]
- Jonas P, Sakmann B. Glutamate receptor channels in isolated patches from CA1 and CA3 pyramidal cells of rat hippocampal slices. Journal of Physiology. 1992;455:143–171. doi: 10.1113/jphysiol.1992.sp019294. [DOI] [PMC free article] [PubMed] [Google Scholar]
- Kamboj S, Swanson GT, Cull-Candy SG. Intracellular spermine confers rectification on rat calcium-permeable AMPA and kainate receptors. Journal of Physiology. 1995;486:297–303. doi: 10.1113/jphysiol.1995.sp020812. [DOI] [PMC free article] [PubMed] [Google Scholar]
- Koh D-S, Burnashev N, Jonas P. Block of native Ca2+-permeable AMPA receptors in rat brain by intracellular polyamines generates double rectification. Journal of Physiology. 1995a;486:305–312. doi: 10.1113/jphysiol.1995.sp020813. [DOI] [PMC free article] [PubMed] [Google Scholar]
- Koh D-S, Geiger JRP, Jonas P, Sakmann B. Ca2+-permeable AMPA and NMDA receptor channels in basket cells of rat hippocampal dentate gyrus. Journal of Physiology. 1995b;485:383–402. doi: 10.1113/jphysiol.1995.sp020737. [DOI] [PMC free article] [PubMed] [Google Scholar]
- Kolb H, Famiglietti EV. Rod and cone pathways in the inner plexiform layer of cat retina. Science. 1974;186:47–49. doi: 10.1126/science.186.4158.47. [DOI] [PubMed] [Google Scholar]
- Livsey CT, Costa E, Vicini S. Glutamate-activated currents in outside-out patches from spiny versus aspiny hilar neurons of rat hippocampal slices. Journal of Neuroscience. 1993;13:5324–5333. doi: 10.1523/JNEUROSCI.13-12-05324.1993. [DOI] [PMC free article] [PubMed] [Google Scholar]
- Livsey CT, Vicini S. Slower spontaneous excitatory postsynaptic currents in spiny versus aspiny hilar neurons. Neuron. 1992;8:745–755. doi: 10.1016/0896-6273(92)90095-u. [DOI] [PubMed] [Google Scholar]
- McBain CJ, Fisahn A. Interneurons unbound. Nature Reviews Neuroscience. 2001;2:11–23. doi: 10.1038/35049047. [DOI] [PubMed] [Google Scholar]
- Massey SC, Maguire G. The role of glutamate in retinal circuitry. In: Wheal H, Thomson A, editors. Excitatory Amino Acids and Synaptic Transmission. 2. London: Academic Press; 1995. [Google Scholar]
- Mosbacher J, Schoepfer R, Monyer H, Burnashev N, Seeburg P, Ruppersberg JP. A molecular determinant for submillisecond desensitization in glutamate receptors. Science. 1994;266:1059–1062. doi: 10.1126/science.7973663. [DOI] [PubMed] [Google Scholar]
- Neher E, Stevens CF. Conductance fluctuations and ionic pores in membranes. Annual Review of Biophysics and Bioengineering. 1977;6:345–381. doi: 10.1146/annurev.bb.06.060177.002021. [DOI] [PubMed] [Google Scholar]
- Otis TS, Raman IM, Trussell LO. AMPA receptors with high Ca2+ permeability mediate synaptic transmission in the avian auditory pathway. Journal of Physiology. 1995;482:309–315. doi: 10.1113/jphysiol.1995.sp020519. [DOI] [PMC free article] [PubMed] [Google Scholar]
- Partin KM, Patneau DK, Winters CA, Mayer ML, Buonanno A. Selective modulation of desensitization at AMPA versus kainate receptors by cyclothiazide and concanavalin A. Neuron. 1993;11:1069–1082. doi: 10.1016/0896-6273(93)90220-l. [DOI] [PubMed] [Google Scholar]
- Patlak JB. Sodium channel subconductance levels measured with a new variance-mean analysis. Journal of General Physiology. 1988;92:413–430. doi: 10.1085/jgp.92.4.413. [DOI] [PMC free article] [PubMed] [Google Scholar]
- Pemberton KE, Belcher SM, Ripellino JA, Howe JR. High-affinity kainate-type ion channels in rat cerebellar granule cells. Journal of Physiology. 1998;510:401–420. doi: 10.1111/j.1469-7793.1998.401bk.x. [DOI] [PMC free article] [PubMed] [Google Scholar]
- Qin P, Pourcho RG. AMPA-selective glutamate receptor subunits GluR2 and GluR4 in the cat retina: an immunocytochemical study. Visual Neuroscience. 1999;16:1105–1114. doi: 10.1017/s0952523899166100. [DOI] [PubMed] [Google Scholar]
- Robinson RA, Stokes RH. Electrolyte Solutions. 2. London: Butterworths; 1959. [Google Scholar]
- Rosenmund C, Stern-Bach Y, Stevens CF. The tetrameric structure of a glutamate receptor channel. Science. 1998;280:1596–1599. doi: 10.1126/science.280.5369.1596. [DOI] [PubMed] [Google Scholar]
- Shatkay A. Individual activity of calcium ions in pure solutions of CaCl2 and in mixtures. Biophysical Journal. 1968;8:912–919. doi: 10.1016/S0006-3495(68)86528-2. [DOI] [PMC free article] [PubMed] [Google Scholar]
- Sigworth FJ. The variance of sodium current fluctuations at the node of Ranvier. Journal of Physiology. 1980;307:97–129. doi: 10.1113/jphysiol.1980.sp013426. [DOI] [PMC free article] [PubMed] [Google Scholar]
- Silberberg SD, Magleby KL. Preventing errors when estimating single channel properties from the analysis of current fluctuations. Biophysical Journal. 1993;65:1570–1584. doi: 10.1016/S0006-3495(93)81196-2. [DOI] [PMC free article] [PubMed] [Google Scholar]
- Smith TC, Howe JR. Concentration-dependent substate behavior of native AMPA receptors. Nature Neuroscience. 2000;3:992–997. doi: 10.1038/79931. [DOI] [PubMed] [Google Scholar]
- Smith TC, Wang L-Y, Howe JR. Heterogeneous conductance levels of native AMPA receptors. Journal of Neuroscience. 2000;20:2073–2085. doi: 10.1523/JNEUROSCI.20-06-02073.2000. [DOI] [PMC free article] [PubMed] [Google Scholar]
- Strettoi E, Raviola E, Dacheux RF. Synaptic connections of the narrow-field, bistratified rod amacrine cell (AII) in the rabbit retina. Journal of Comparative Neurology. 1992;325:152–168. doi: 10.1002/cne.903250203. [DOI] [PubMed] [Google Scholar]
- Swanson GT, Kamboj SK, Cull-Candy SG. Single-channel properties of recombinant AMPA receptors depend on RNA editing, splice variation, and subunit composition. Journal of Neuroscience. 1997;17:58–69. doi: 10.1523/JNEUROSCI.17-01-00058.1997. [DOI] [PMC free article] [PubMed] [Google Scholar]
- Traynelis SF, Wahl P. Control of rat GluR6 glutamate receptor open probability by protein kinase A and calcineurin. Journal of Physiology. 1997;503:513–531. doi: 10.1111/j.1469-7793.1997.513bg.x. [DOI] [PMC free article] [PubMed] [Google Scholar]
- Verdoorn TA, Burnashev N, Monyer H, Seeburg PH, Sakmann B. Structural determinants of ion flow through recombinant glutamate receptor channels. Science. 1991;252:1715–1718. doi: 10.1126/science.1710829. [DOI] [PubMed] [Google Scholar]
- Washburn MS, Numberger M, Zhang S, Dingledine R. Differential dependence on GluR2 expression of three characteristic features of AMPA receptors. Journal of Neuroscience. 1997;17:9393–9406. doi: 10.1523/JNEUROSCI.17-24-09393.1997. [DOI] [PMC free article] [PubMed] [Google Scholar]
- Wässle H, Grünert U, Röhrenbeck J. Immunocytochemical staining of AII-amacrine cells in the rat retina with antibodies against parvalbumin. Journal of Comparative Neurology. 1993;332:407–420. doi: 10.1002/cne.903320403. [DOI] [PubMed] [Google Scholar]
- Wilding TJ, Huettner JE. Differential antagonism of α-amino-3-hydroxy-5-methyl-4-isoxazolepropionic acid-preferring and kainate-preferring receptors by 2,3-benzodiazepines. Molecular Pharmacology. 1995;47:582–587. [PubMed] [Google Scholar]
- Zhang S, Trussell LO. Voltage clamp analysis of excitatory synaptic transmission in the avian nucleus magnocellularis. Journal of Physiology. 1994;480:123–136. doi: 10.1113/jphysiol.1994.sp020346. [DOI] [PMC free article] [PubMed] [Google Scholar]