

Abstract
Ca2+ signals in cardiac muscle cells are composed of spatially limited elementary events termed Ca2+ sparks. Several studies have also indicated that Ca2+ signals smaller than Ca2+ sparks can be elicited. These signals have been termed Ca2+ quarks and were proposed to result from the opening of a single Ca2+ release channel of the sarcoplasmic reticulum. We used laser-scanning confocal microscopy to examine the subcellular properties of Na+ current (INa)- and L-type Ca2+ current (ICa,L)-induced Ca2+ transients in voltage-clamped ventricular myocytes isolated from guinea-pigs. Both currents, INa and ICa,L, evoked substantial, global Ca2+ transients. To examine the spatiotemporal properties of such Ca2+ signals, we performed power spectral analysis of these Ca2+ transients and found that both lacked spatial frequency components characteristic for Ca2+ sparks. The application of 10 μm verapamil to partially block L-type Ca2+ current reduced the corresponding Ca2+ transients down to individual Ca2+ sparks. In contrast, INa-induced Ca2+ responses were still spatially homogeneous and lacked Ca2+ sparks even for small current amplitudes. By using high resistance patch pipettes (> 4 MΩ) to exaggerate the loss of voltage control during INa, Ca2+ sparks appeared superimposed on a homogeneous Ca2+ release component and were exclusively triggered during the flow of INa. In the presence of 10 μm ryanodine both ICa,L and INa elicited small, residual Ca2+ transients that were spatially homogeneous but displayed distinctively different temporal profiles. We conclude that INa is indeed able to cause Ca2+ release in guinea-pig ventricular myocytes. In contrast to ICa,L-induced Ca2+ transients, which are built up from the recruitment of individual Ca2+ sparks, the INa-evoked cellular responses were always homogeneous, indicating that their underlying elementary Ca2+ release event is distinct from the Ca2+ spark. Thus, INa-induced Ca2+ transients are composed of smaller Ca2+ signals, most likely Ca2+ quarks.
Cardiac excitation-contraction coupling (E-C coupling) links the electrical excitation of the cell membrane, the action potential, to the mechanical activity of the contractile machinery (Callewaert, 1992; Bers, 2001). An important step during this signal transduction is a transient rise in the intracellular Ca2+ concentration ([Ca2+]i). This Ca2+ transient is composed of both, Ca2+ influx across the cell membrane and Ca2+ release from intracellular stores, the sarcoplasmic reticulum (SR). The precise contribution of each mechanism is dependent on the species (Bers, 2001) and on SR Ca2+ load (Han et al. 1994; Spencer & Berlin, 1995; Santana et al. 1997). Ca2+ entry through voltage-activated Ca2+ channels in the plasma membrane is believed to trigger the release of Ca2+ from the SR by a mechanism referred to as Ca2+-induced Ca2+ release (CICR; for reviews see Callewaert, 1992; Niggli, 1999). The relaxation of cardiac myocytes is mediated by various Ca2+ transport processes. The two most important mechanisms responsible for the removal of are the SR Ca2+ pump and the Na+-Ca2+ exchanger in the plasma membrane (for a recent review see Egger & Niggli, 1999; Lipp & Bootman, 1999). The plasma membrane Ca2+ pump removes a minor component, although the exact quantitative contributions again vary between different species (Bers, 2001).
The Na+-Ca2+ exchange is a process controlled by the concentration gradients of both Na+ and Ca2+ as well as the membrane voltage across the plasma membrane. This enables the exchanger to mediate Ca2+ extrusion in its ‘forward mode’ (i.e. Na+ influx and Ca2+ efflux), but Ca2+ can also enter the cell during its ‘reverse mode’ of operation (Na+ efflux and Ca2+ influx; e.g. Horackova & Vassort, 1979; Crespo et al. 1990). While it was known that slow and tonic Ca2+ entry can occur via Na+-Ca2+ exchange, LeBlanc & Hume (1990) provided experimental evidence for the ability of the Na+-Ca2+ exchange to trigger fast SR Ca2+ release during E-C coupling. Their observation also implied the existence of a subsarcolemmal space with restricted diffusion, referred to as the ‘fuzzy space’, to which Ca2+ and Na+ channels as well as the Na+-Ca2+ exchanger have preferential access (Lederer et al. 1990a, b) and from which ions would only slowly diffuse into the cytoplasm. Activation of the fast INa is believed to lead to a short-lived accumulation of Na+ in the ‘fuzzy’ space (model calculation revealed concentrations of up to 30 mm; Lederer et al. 1990b; see also Wendt-Gallitelli et al. 1993), which in turn would be sufficient to cause reverse-mode Na+-Ca2+ exchange. It was postulated that this Ca2+ entry might be able to trigger SR Ca2+ release. Although evidence supporting such a sodium current (INa)-induced Ca2+ release has subsequently been reported by others (e.g. Lipp & Niggli, 1994), this notion did not remain unquestioned. Instead, various experimental studies could not find INa-induced Ca2+ release under similar experimental conditions and proposed other mechanisms causing this phenomenon (see for example Sham et al. 1992; Bouchard et al. 1993; Sipido et al. 1995; Evans & Cannell, 1997).
One alternative explanation involved a loss of voltage control during the large cardiac INa, which can reach amplitudes of more than 10 nA (Makielski et al. 1987). The idea was that during INa voltage control is partly lost, which in turn accidentally activates ICa,L (L-type Ca2+ current). Presumably, the resulting spurious Ca2+ entry could trigger SR Ca2+ release by CICR and INa-induced Ca2+ release could then be seen as an experimental artefact.
In the present paper, we examined the subcellular characteristics of SR Ca2+ release events induced by ICa,L and INa with rapid line-scanning confocal microscopy of voltage-clamped guinea-pig ventricular myocytes. We show that both ionic currents recruit distinct and separate modes of SR Ca2+ release that can be distinguished based on their ‘Ca2+ signalling fingerprint’ and based on their pharmacological profile.
METHODS
Cell isolation and solutions
All experiments were carried out according to the Swiss Animal Protection Law and with the permission of The State Veterinary Office, Bern, Switzerland. Guinea-pig ventricular myocytes were isolated using a standard enzymatic procedure described previously (Lipp & Niggli, 1994). In brief, adult animals were killed by cervical dislocation, the heart rapidly removed and retrogradely perfused on a Langendorff perfusion system at 37 °C. The perfusion solution contained (mm): NaCl 135, KCl 5.4, MgCl2 1, NaH2PO4 0.33, Hepes 5, glucose 11, pH 7.3 adjusted with NaOH. After 5 min, collagenase B (Boehringer Mannheim, Rotkreuz, Switzerland) and protease type XIV (Sigma, Buchs, Switzerland) were added to a final concentration of 0.2 and 0.04 mg ml−1, respectively, and the perfusion continued for another 4–6 min. Subsequently, the ventricles were minced and placed in perfusion solution containing 200 μm CaCl2 on a rocking table to allow for dissociation of the tissue. Cells were taken from the supernatant, transferred into a recording chamber which was mounted on the stage of an inverted microscope (Diaphot TMD, Nikon, Küsnacht, Switzerland). Ca2+-resistant cells readily adhered to the coverslip without coating and were constantly superfused (1-2 ml min−1) with cellular solution containing (mm): NaCl, 135, KCl 5, CaCl2 2, glucose 10, MgCl2 2, Hepes 10 (pH 7.4 adjusted with NaOH). In order to inhibit L-type Ca2+ channels, verapamil was added (10 μm) from a stock solution. All experiments were performed at room temperature (20-22 °C). Extracellular solutions were exchanged by a custom-made solenoid-driven fast perfusion system (time for solution change < 500 ms).
Electrophysiological recordings
Single guinea-pig ventricular myocytes were voltage clamped in the whole-cell configuration of the patch-clamp technique. Patch pipettes were pulled from borosilicate glass on a horizontal puller (Zeitz, Augsburg, Germany). Filled with the intracellular solution, the pipettes had a final resistance of 1–2 MΩ. In some experiments we deliberately produced pipettes with a higher resistance of > 4 MΩ. The solutions used for filling the pipettes consisted of (mm): caesium aspartate 120, TEA-Cl 20, Hepes 10, MgATP 5, MgCl2 1, fluo-3 0.1, pH 7.2 adjusted with CsOH. Application of voltage pulses and recording of the membrane current was performed with an Axopatch 200 patch clamp amplifier (Axon Instruments, Foster City, CA, USA) controlled by custom-made software running under LabView (National Instruments, Ennetbaden, Switzerland). Residual 50 Hz noise was removed off-line by a custom-made routine based on IgorPro software (WaveMetrics, Lake Oswego, OR, USA).
Stimulation protocols
To ensure similar SR Ca2+ loading between cells, we employed a pre-pulse protocol. Ten voltage steps (250 ms in duration, at 0.5 Hz) from a holding potential of −50 to +10 mV were applied before stepping to the appropriate holding potential of −50 mV (for eliciting ICa,L) or −90 mV (for eliciting INa). For experiments in which ICa,L was blocked by verapamil, the pre-pulse protocol comprised voltage steps (250 ms in duration, at 0.5 Hz) from −50 to +50 mV and thus used reverse-mode Na+-Ca2+ exchange to load the SR.
Calcium measurements
The spatiotemporal properties of INa- and ICa,L-induced Ca2+ transients were examined using a laser-scanning confocal microscope (BioRad MRC 1000, Glattbrugg, Switzerland). Due to the limited temporal resolution of the confocal microscope in its image mode, we performed line-scanning at a rate of 500 lines s−1 as shown in Fig. 1. For this, a single line along the longitudinal cell axis was chosen and repetitively scanned. Data analysis was performed off-line on a Macintosh PowerPC 8100 computer (Apple, Walisellen, Switzerland) running a modified version of NIH-image (NIH, Bethesda, USA). Changes of Ca2+i were calculated using the self-ratio method as described earlier (Lipp & Niggli, 1994) assuming a Kd value for fluo-3 of 480 nm (Molecular Probes, Oregon, USA).
Figure 1.
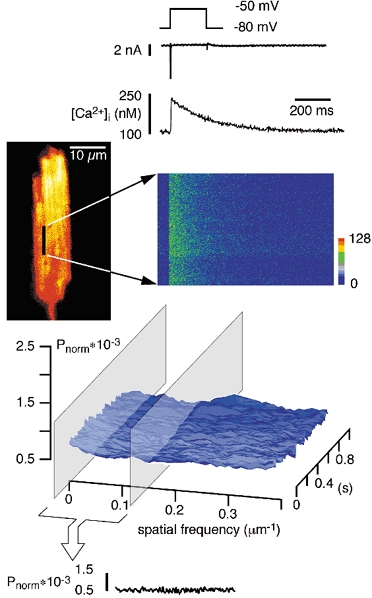
Power spectra of line-scan images (montage)
Traces show from top to bottom: voltage protocol, current recording, time course of average Ca2+ concentration, a confocal image of a fluo-3-loaded guinea-pig ventricular myocyte. The black line indicates the position of a single scanned line (longitudinal) to record fluorescence vs. time, shown in the right panel. A voltage-clamp depolarisation from −80 to −50 mV activated INa and a homogeneous Ca2+ influx signal. Power spectra in the spatial domain and the average power (average Pnorm) over time (spatial low-frequency components averaged between > 0 and 0.13 lines μm−1). Spatial uniformity of the Ca2+ release is confirmed in the power spectra. For this purpose, the raw line-scan images were Fourier transformed in the spatial domain (i.e. in the vertical direction) line by line and the calculated power spectra of all lines were arranged in an identical order to the original line-scan image. For normalisation the power of each frequency component (Pi) was divided by the zero-frequency component (P0) to obtain Pnorm (see Lipp & Niggli, 1996).
Digital image processing (see also Fig. 1)
Figure 2.
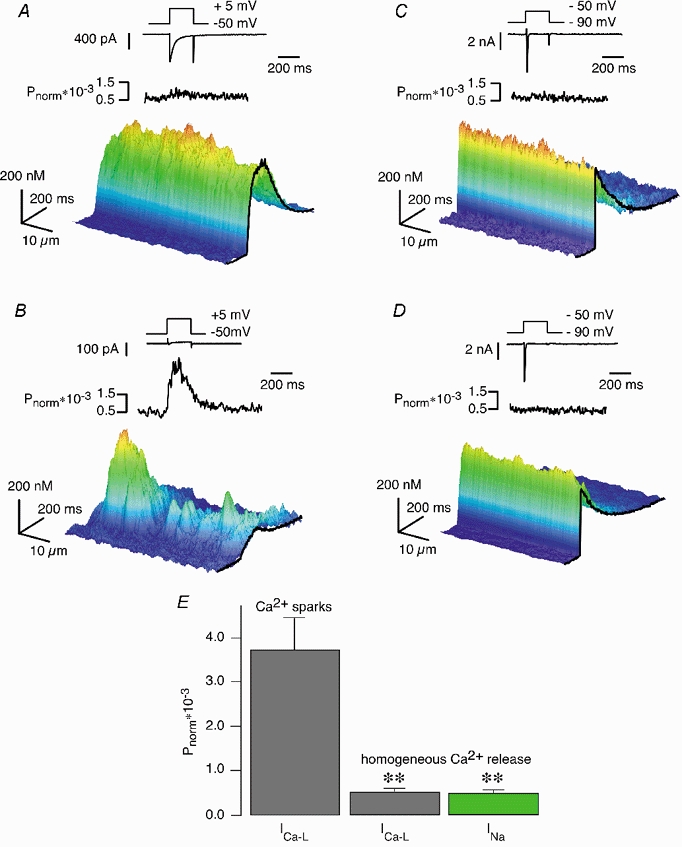
ICa,L- and INa-induced SR Ca2+ release
A-D, from top to bottom: voltage protocols for activating L-type Ca2+ currents (A and B) and sodium currents (C and D), the resulting ICa,L and INa, the averaged power spectra in the spatial domain of the line-scan images and the Ca2+ signals as 3D-surface plots of the line-scan images. B and D, ICa,L and INa, respectively, and the corresponding CICR signal observed in the same cardiac myocyte as in A and C after application of 10 μm verapamil for 2 min. B, although ICa,L was reduced by approximately 95 %, inhomogeneous SR Ca2+ release was still present, characterised by low-frequency components of the power spectra. D, the INa-triggered SR Ca2+ release signal was largely homogeneous and verapamil insensitive. The power spectra exhibit no localised Ca2+ release events (Ca2+ sparks) in the low frequency range. E, comparison of the low-frequency components of the power spectra of ICa,L-induced SR Ca2+ signals in the presence of verapamil (B, Ca2+ sparks, n = 21) vs. the power spectra of homogeneous SR Ca2+ signals induced by ICa,L (A, n = 15) and INa-induced Ca2+ transients (D, n = 11) (mean ± s.e.m., **P < 0.05).
For the power spectral analysis of the line-scan images, the IDL software package was used (Research Systems, Boulder, CO, USA). Initially, we calculated the Fourier transform (in space) of each individual line of the line-scan image as a two-dimensional array, whereby the order of the resulting line-data was preserved. Inhomogeneous distribution of fluo-3 fluorescence along the line was compensated for by normalising each line in the power spectrum image by the zero-order component (P0) (Cheng et al. 1993). We have shown recently that Ca2+ sparks can readily be identified in line-scan images by their characteristic spectral component in the lower spatial frequency range (Lipp & Niggli, 1996; for details see also Cannell et al. 1994). For the present paper, we averaged the low frequency components (between > 0 and < 0.13 lines μm−1) and expressed them as normalised power ratio vs. time. In control line-scan images, we found that these low frequency components were a sufficiently sensitive indication for the presence of Ca2+ sparks in the raw data (not shown). The myocytes were scanned longitudinally; however, the sarcomeric periodicity was not apparent in the line-scan images and in the power spectral analysis. In this paper, we speak of homogeneous Ca2+ signals in the absence of any periodicity in the line-scan image. Nevertheless, noticeable non-periodic inhomogenieties were apparent in almost all line-scan recordings (e.g. Fig. 2A). The values were expressed as means ± s.e.m. Student's paired t tests were used to test for significance. Significance is given as P < 0.05 or < 0.1, as indicated in the figure legends.
RESULTS
Properties of ICa,L- but not INa-induced Ca2+ release were altered by verapamil
In voltage-clamped guinea-pig ventricular myocytes, stepping the membrane voltage from −50 to +5 mV or from −90 to −50 mV elicited ICa,L- or INa-induced Ca2+ release, respectively, that both caused a substantial increase in [Ca2+]i (Fig. 2A and C). In Fig. 2 as well as the following figures, the [Ca2+]i calculated from the line-scan images was coded in the height and the colour of 3D-surface representations in order to allow for a rapid assessment of the spatiotemporal properties of the subcellular Ca2+ transients. While the ICa,L-induced responses showed a rising phase lasting several milliseconds (Fig. 2A), the signals elicited by INa were characterised by a very brief upstroke (Fig. 2C). However, both transients appeared to be spatially uniform, i.e. Ca2+ release occurred evenly along the recorded line. In order to substantiate this qualitative observation, we quantified the subcellular properties of the Ca2+ signals by calculating power spectra of the line scans, as described earlier (Lipp & Niggli, 1996). Particular attention was paid to the characteristic low spatial frequencies indicative of the appearance of detectable Ca2+ sparks (Cannell et al. 1994). For simplification, we averaged those spatial frequencies that were characteristic for the existence of Ca2+ sparks (between 0 and 0.13 lines μm−1). The time course for the normalised power ratio present in this range of spatial frequencies is shown above the surface plot in this and all subsequent figures. The lack of abrupt time-dependent changes in this plot indicates the absence of identifiable Ca2+ sparks during both ICa,L- and INa-induced Ca2+ transients. Figure 2B and D shows current and Ca2+ recordings from the same cardiac myocyte after application of 10 μm verapamil for 2 min. Although the Ca2+ current was reduced by more than 95 % in B, SR Ca2+ release could still be elicited. In comparison to the control situation (Fig. 2A), the Ca2+ signal observed in the presence of verapamil was no longer homogeneous, instead it seemed to comprise a limited number of distinct Ca2+ sparks. This observation was substantiated by the power spectral analysis. During the voltage step a transient rise in the low-frequency components could be observed, suggesting the presence of Ca2+ sparks. In contrast to the recordings obtained during the activation of the ICa,L, the INa-induced Ca2+ signal was largely unaffected by verapamil (Fig. 2D). Despite a marginal decrease in the signal amplitude, the Ca2+ transient was still homogeneous, which was confirmed in the power spectral analysis by the absence of low frequency components. The results are summarised in Fig. 2E, where the power spectra of Ca2+ sparks (Fig. 2B) are compared with the power spectra of homogeneous SR Ca2+ signals induced by ICa,L (Fig. 2A) and INa (Fig. 2D). There are several possible explanations for the slight decrease in the amplitude of the Ca2+ transient in the presence of verapamil. First, verapamil could have inhibited a contaminating ICa,L-induced Ca2+ signal present under control conditions. Second, Ca2+ loading of the SR might have been slightly lower than under control conditions, since Ca2+ entry through L-type Ca2+ channels was blocked during the pre-pulse protocol, although we largely relied on the loading of the SR by reverse-mode Na+-Ca2+ exchange under those conditions (see Methods section). Third, verapamil has also been reported to slightly block INa (Bustamante, 1985) and the reverse mode of the Na+-Ca2+ exchanger (Egger & Niggli, 1999).
From these experiments, we concluded that partial inhibition of ICa,L could reduce the Ca2+ release signals from a homogeneous signal to a signal consisting of a few Ca2+ sparks, while the spatial properties of the INa-induced transients remained unaffected by verapamil. Since Ca2+ sparks cannot be resolved if their number is too large, the possibility exists that INa recruited too many Ca2+ sparks and thus prevented their identification as individual signalling events. Alternatively and more interestingly, INa could have triggered Ca2+ release from the SR with a different spatial signature (i.e. homogeneous SR Ca2+ release vs. Ca2+ sparks).
Na+ current-induced SR Ca2+ release did not recruit Ca2+ sparks
To examine these possibilities, we used experimental conditions that were expected to facilitate the activation of a few L-type Ca2+ channels and the subsequent activation of Ca2+ sparks. In the first series of experiments, we elicited INa under conditions of deliberate loss of voltage control. For these experiments, we used patch-clamp electrodes with a slightly higher series resistance and we did not compensate for electrode resistance. Under such conditions, the membrane potential is known to escape towards the reversal potential for Na+ during flow of INa (Hüser et al. 1996). Figure 3 depicts typical current and Ca2+ recordings from such an experiment and shows that the Ca2+ signals elicited under those conditions had lost their homogeneity. Similar transients were found in eight other cells studied under similar conditions. The spatial inhomogeneity can be read from the three-dimensional surface plot of the line-scan image and also from the transient surge of low frequencies in the power spectral analysis depicted in Fig. 3A. The Ca2+ transient seemed to consist of two superimposed components; the first one was an apparently homogeneous socket of Ca2+ and resembled the Na+ current-induced Ca2+ signal seen in Fig. 2 while the second component resembled Ca2+ sparks. These two signal components are indeed compatible with the idea of a simultaneous activation of Na+ and Ca2+ channels whereby the homogeneous signal is evoked by the Na+ current-induced Ca2+ release while the Ca2+ sparks are triggered by the spurious activation of a few L-type Ca2+ channels during the brief loss of voltage control.
Figure 3.
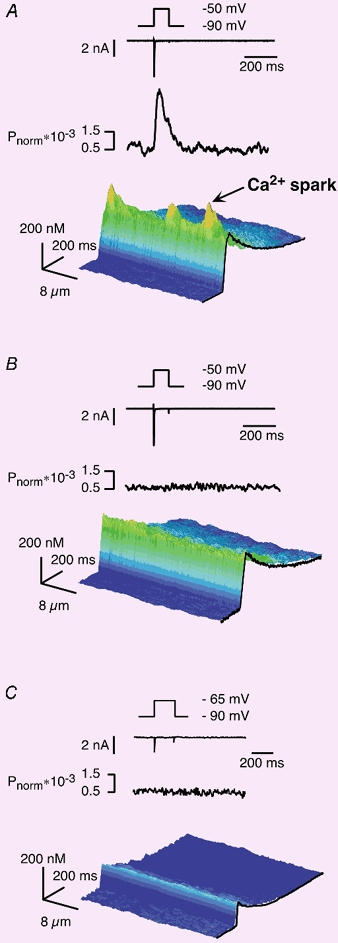
INa-induced SR Ca2+ release events (Ca2+ sparks)
A-C, from top to bottom: voltage protocols for activating sodium currents, the resulting INa, the averaged power spectra in the spatial domain and the corresponding Ca2+ signals as 3D-surface plots of the line-scan images. A, INa measured under conditions of loss of voltage control (patch electrodes with higher series resistance). The resulting inhomogeneous Ca2+ transient consisted of two superimposed components; a Ca2+ spark component and an apparently homogeneous INa-induced component. B, INa and the corresponding homogeneous SR Ca2+ release signal observed in the same cardiac myocyte after application of 10 μm verapamil for 2 min. In the presence of the L-type Ca2+ channel blocker only the Ca2+ spark components were suppressed, indicating that spurious activation of L-type Ca2+ channels did not contribute to the INa-induced SR Ca2+ release. C, INa-induced Ca2+ transients induced by decreasing the depolarisation (voltage step to −65 mV). The resulting Ca2+ signal was decreased compared to Fig. 2B. Nevertheless, the spatial properties of the homogeneous Ca2+ release transient remained unchanged. Similar results were found in all myocytes tested (n = 8).
We verified this notion by applying verapamil that should, under these conditions, suppress only those Ca2+ signals originating from the activation of Ca2+ channels but not the homogeneous Ca2+ release signal triggered by INa and subsequent Na+-Ca2+ exchange reverse mode. Figure 3B shows the result of a verapamil treatment of the same cell as in Fig. 3A. While the localised Ca2+ signals seen in the absence of the L-type Ca2+ channel blocker were suppressed, the homogeneous component of the Ca2+ signal was maintained. The suppression of inhomogeneities was again confirmed with the power spectral analysis. From these results we concluded that spurious activation of Ca2+ channels did not contribute to the homogeneous INa-induced SR Ca2+ release, but rather was responsible for the few clearly visible Ca2+ sparks positioned on top of the homogeneous Ca2+ signal.
The second question we addressed in this series of experiments was related to the nature of SR Ca2+ release induced by INa. We used an approach that was analogous to that applied for the identification of the elementary Ca2+ release events underlying ICa,L-induced Ca2+ release, a reduction of the number of activated channels. In the case of ICa,L this can be achieved either by inhibiting Ca2+ channels or by depolarisations to the threshold of current activation (Cannell et al. 1994, 1995; Lopez-Lopez et al. 1995). For the INa-induced Ca2+ release we chose the second protocol by reducing the degree of depolarisation. A representative example of such a small voltage step (here to −65 mV) is shown in Fig. 3C. The traces were obtained from the same cell as in Fig. 3A and B. The resulting Ca2+ signal was reduced in amplitude by more than 70 %. Despite this change in the amplitude, the spatial properties of the release transient remained unaltered; it was still homogeneous. This important observation was confirmed for all voltages between −75 (the threshold potential for eliciting INa in our experiments) and −50 mV (data not shown). More positive depolarisations were not examined because of the risk of contaminating activation of ICa,L. From these findings we concluded that INa-induced Ca2+ release did not recruit Ca2+ sparks, instead Ca2+ release events were evoked that resulted in a homogeneous SR Ca2+ release signal over the entire voltage range.
Ca2+ release did not reflect the spatial properties of INa and ICa,L
We were left with the question of why INa and ICa,L could recruit different elementary Ca2+ release events. Or in other words, does the INa- and ICa,L-induced Ca2+ release reflect the spatial properties of the Ca2+ influx signals or does the discrepancy arise from the recruitment of different populations of RyRs? In order to examine this, we analysed the subcellular characteristics of INa- and ICa,L-induced Ca2+ influx signals. Figure 4A and B depicts results from a guinea-pig ventricular myocyte in which SR Ca2+ release had been inhibited by preincubation of the cell in 10 μm ryanodine for 20 min, a procedure that completely eliminates Ca2+ release via RyRs (Bers, 2001). Depolarisations from holding potentials of −50 and −90 mV elicited ICa,L and INa, respectively. The Ca2+ influx signal carried by ICa,L had a slow rising and decay phase, as has been described earlier (Cannell et al. 1994). These Ca2+ influx signals were homogeneous over the entire voltage range tested (-30 to +30 mV, data not shown). We could not assess the subcellular properties of the Ca2+ signals for smaller or larger depolarisations since the resulting Ca2+ transients were too small to allow for a reliable power spectral analysis. Membrane depolarisations from a holding potential of −90 to −50 mV elicited INa and an accompanying Ca2+ influx component (Fig. 4B). As shown previously, these INa-induced Ca2+ influx signals were insensitive to L-type Ca2+ channel inhibitors (Lipp & Niggli, 1994) and could therefore be attributed to the activation of INa and subsequent Ca2+ entry via Na+-Ca2+ exchange. We verified this in experiments where we substituted Li+ for Na+, an intervention which resulted in a complete suppression of the Ca2+ influx transients during voltage protocols activating Na+ channels (Fig. 4C). As for ICa,L, we could only test a narrow range of voltages eliciting INa, because of the limiting signal-to-noise ratio for the power spectral analysis (tested voltages: between −70 and −50 mV; data not shown). Figure 4D shows the statistical comparison of [Ca2+]i transients induced by large (Fig. 4B) and small INa (Fig. 3C) in myocytes with intact and blocked SR Ca2+ release function (ryanodine-treated cells). In both cases, INa significantly triggered SR Ca2+ release. From these experimental results, we conclude that the spatial properties of the Ca2+ influx signals induced by the activation of INa and ICa,L did not reflect the subcellular properties of the elementary Ca2+ release signals recruited by each particular current. Therefore, submicroscopic spatial features or the kinetics of the respective Ca2+ entry signals into the dyadic cleft may determine the type of subsequent SR Ca2+ release event that is activated (i.e. Ca2+ sparks or homogeneous release).
Figure 4.
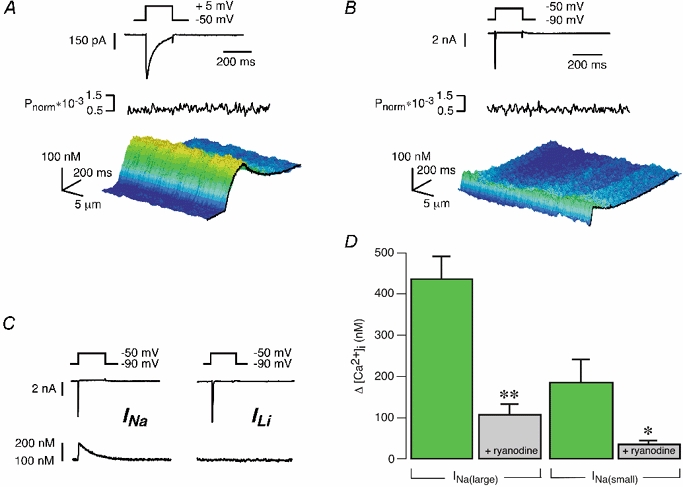
INa- and ICa,L-induced Ca2+ transients in the absence of SR Ca2+ release function
A and B, from topSR to bottom: voltage protocols for activating L-type Ca2+ currents and sodium currents, respectively, the resulting ICa,L and INa, the averaged power spectra in the spatial domain and the resulting Ca2+ signals as 3D-surface plots of the line-scan images under conditions of blocked SR (myocytes were preincubated in 10 μm ryanodine for 20 min). C, INa-induced [Ca2+]i transient most probably mediated by Ca2+ entry via Na+-Ca2+ exchange; substitution of Li+ for Na+ resulted in a complete suppression of this Ca2+ influx signal during INa. D, INa-induced [Ca2+]i transients: comparison of [Ca2+]i changes induced by large INa (voltage steps from −90 to −50 mV) in control (n = 25) and ryanodine-treated myocytes (n = 8) and between [Ca2+]i changes induced by small INa (voltage steps from −90 to −65 mV) in control (n = 7) and ryanodine-treated myocytes (n = 5; mean ± s.e.m., **P < 0.001 vs. control large INa, *P < 0.05 vs. control small INa).
DISCUSSION
During the last few years, the established view of cardiac E-C coupling and Ca2+ signalling has been challenged by several unexpected experimental findings. Some of these observations appeared to suggest trigger pathways for CICR other than the well-known activation via L-type Ca2+ channels. This includes Ca2+ entry by reverse mode Na+-Ca2+ exchange, particularly following activation of Na+ influx via INa (LeBlanc & Hume, 1990; Lipp & Niggli, 1994). In some studies, depolarisation and the subsequent changes of the electrochemical gradients for Na+ and Ca2+ appeared to be sufficient to elicit Na+-Ca2+ exchange reverse mode (i.e. no Na+ influx was required; Levi et al. 1994). A possible contribution of T-type Ca2+ current to triggering CICR has also been suggested in several reports (for example see Sipido et al. 1998). More recently, changes of Ca2+ signalling after β-adrenergic stimulation have been interpreted to arise from a reduced selectivity of the TTX-sensitive Na+ channels with subsequent influx of Ca2+ (‘slip-mode conductance’; Santana et al. 1998). Based on other experimental results, β-adrenergic stimulation was also proposed to unmask a direct allosteric coupling between L-type Ca2+ channels and RyRs, giving rise to voltage-induced Ca2+ release (Hobai et al. 1997; Ferrier et al. 1998; Howlett et al. 1998). None of these additional trigger pathways is fully understood and each has been disputed because of published negative results. A common conclusion of many papers reporting negative results was that the apparent additional trigger pathway might have resulted from an experimental artefact (Sham et al. 1992; Bouchard et al. 1993; Evans & Cannell, 1997; Sipido et al. 1997).
Homogeneous Ca2+ release is distinct from Ca2+ sparks
Similar to many other cell types, cardiac Ca2+ signalling and E-C coupling is notoriously complex. This partly results from the diversity of possible pathways for Ca2+ entry, including several types of voltage-dependent Ca2+ channels. In addition, Ca2+ transporters that usually remove cytosolic Ca2+, such as the Na+-Ca2+ exchanger, can run in a reverse or Ca2+ influx mode. Although some separation between these pathways can be achieved with specific voltage-clamp protocols, the voltage range over which activation or steady-state inactivation occurs shows considerable overlap between the different current components. Moreover, the available pharmacological tools are less than perfect, many show use- or voltage-dependent block or lack specificity. Therefore, experiments aimed at the identification of specific pathways need to be designed and analysed very carefully and the necessary control experiments need to be done.
However, some of the mentioned alternative pathways for Ca2+ entry can be ruled out for the present study. The pipette filling solution did not contain cAMP and the cells were not β-adrenergically stimulated. Thus, both voltage-activated Ca2+ release and slip-mode influx of Ca2+ would not be expected under the experimental conditions used. In addition, for the Ca2+ release signals observed here we can exclude T-type Ca2+ current as the underlying trigger, since the Ca2+ signals were selective for Na+ over Li+, which is more consistent with the Na+-Ca2+ exchange as the underlying transporter. Taken together, the homogeneous Ca2+ release signals elicited by the activation of INa most probably resulted from activation of the Na+-Ca2+ exchange in the Ca2+ influx mode, but, as discussed below, another possible complication had to be considered to further substantiate this conclusion.
The notion that reverse-mode Na+-Ca2+ exchange is activated during INa and is subsequently able to trigger SR Ca2+ release, has been challenged in the past (Sham et al. 1992, Bouchard et al. 1993; Sipido et al. 1997). The issue is not yet resolved completely, but species differences in the expression of the Na+-Ca2+ exchanger have been implied to be important (Sham et al. 1995). As another alternative, it was proposed that a pronounced loss of voltage control and the resulting voltage escape during the large INa may induce spurious activation of L-type Ca2+ channels, that in turn could have activated SR Ca2+ release (Evans & Cannell, 1997). By using a combination of whole-cell voltage-clamp and fluorescent potential-sensitive indicators, we have previously been able to visualise the inevitable voltage escape during INa directly (Hüser et al. 1996). Furthermore, we found that in cells that had undergone β-adrenergic stimulation, spurious activation of L-type Ca2+ channels during voltage escape was indeed dramatically enhanced (DelPrincipe et al. 2000). We therefore had to account for such a possibility in the current study.
With the recent introduction of sophisticated fluorescence imaging techniques, in particular confocal microscopy, spatially restricted Ca2+ signals had been resolved, such as the Ca2+ sparks in muscle cells (for a review see Lipp & Niggli, 1996). These local Ca2+ signals exhibit well defined and easy to recognise spatial and temporal features (also referred to as ‘Ca2+ signalling fingerprint’). In the present study, we took advantage of the confocal imaging technique to discriminate among different triggers and subsequent SR Ca2+ release signals.
The analysis of the ‘Ca2+ signalling fingerprint’ of Ca2+ sparks now allowed us to directly rule out such a possible artefact. Whenever the problem of voltage escape was present in our Ca2+ recordings, we could readily identify the evoked Ca2+ sparks, even if only a few L-type Ca2+ channels were activated. In experiments where we deliberately caused significant loss of voltage control (Fig. 3A), Ca2+ sparks appeared as superimposed Ca2+ signals on top of the homogeneous, INa-induced Ca2+ transient. Moreover, these additional local signals were only triggered during the short period of current flow via Na+ channels and were sensitive to inhibition by verapamil, an inhibitor of L-type Ca2+ channels. Thus, these Ca2+ sparks were most likely triggered by spurious activation of L-type Ca2+ channels during voltage escape. Taken together, the ‘Ca2+ signalling fingerprint’ of the Ca2+ sparks allowed us to indirectly detect openings of a few L-type Ca2+ channels with a sensitivity far superior to the analysis of the voltage-clamp current traces. Therefore, we are left with the question: what is the nature of the homogeneous Ca2+ release signal following INa? It clearly arises from SR Ca2+ release since it was dramatically reduced after treatment with ryanodine (to eliminate CICR). Since it was spatially homogeneous irrespective of its amplitude, the elementary Ca2+ release events underlying this type of SR Ca2+ release were most likely smaller than a Ca2+ spark. In many respects, these signals resembled those observed following flash-photolytic activation of CICR in the same cell type (Lipp & Niggli, 1996). Based on those homogeneous Ca2+ release transients we had proposed the existence of a tiny Ca2+ release signal corresponding to the Ca2+ release flux via a single RyR, the Ca2+ quark. Using two-photon excitation photolysis of caged Ca2+, we were later able to elicit Ca2+ signals arising from events exhibiting 20 to 40 times smaller release flux than a typical Ca2+ spark, possibly corresponding to such Ca2+ quarks (Lipp & Niggli, 1998; Niggli, 1999). Similar homogeneous Ca2+ release signals were also reported in skeletal muscle after suppression of Ca2+ sparks (Shirokova & Rios, 1997), where they were termed ‘small event Ca2+ release’. Likewise, when the cardiac muscle isoform of the RyR (RyR2) was heterologously expressed in Chinese hamster ovary (CHO) cells, uniform Ca2+ release signals without noticeable Ca2+ sparks were recorded (Bhat et al. 1999). Taken together, the homogeneous Ca2+ release signals elicited by Na+ current most likely arise from the initiation of a large number of unresolved Ca2+ quarks.
When comparing the amplification of the Ca2+ influx signals by CICR, INa-induced signals seem to be more efficient in triggering SR Ca2+ release. However, a direct comparison of the trigger efficiency of INa and ICa,L is very difficult because of the vastly different durations of the two influx signals. While in the present experiments most of the Ca2+ influx resulting from INa served as a trigger for CICR, only the first few milliseconds of the ICa,L are triggering release (Sham et al. 1998). The large remainder of the current only leads to refilling of the SR (Trafford et al. 2001). Thus, when only considering the Ca2+ influx during the first few milliseconds of ICa,L, the signal amplification and E-C coupling efficiency of this pathway is far superior.
The missing mechanism for RyR inactivation
Contemporary published computer models of Ca2+ signalling in the dyadic cleft do not seem to be able to account for the present findings. Generally, these models predict that opening of a single RyR channel results in a rapid spread of the Ca2+ signal within the dyadic cleft, reaching almost millimolar concentrations within less than a millisecond (Cannell & Soeller, 1997; Stern et al. 1999). Thus, all RyRs within a cluster of channels would rapidly become activated by CICR and the cluster would exhibit a high degree of positive feedback, essentially resulting in a stereotypical all-or-none response. This model prediction is, however, not only at odds with our observation of Ca2+ quarks, but also with more recent estimations of the number of channels participating in a Ca2+ spark. By recording single channel currents from L-type Ca2+ channels and the resulting Ca2+ signals simultaneously, the number of RyRs underlying a Ca2+ spark has been estimated to be in the range of four to six (Wang et al. 2001), which is surprising given the fact that freeze-fracture studies seemed to suggest a much larger number of feet per dyad (Franzini-Armstrong et al. 1999). Thus, it appears that the presently prevailing understanding of Ca2+ signalling in the dyadic cleft (and the computer models developed based on these ideas) are missing some important features. Most probably, we need to have a better conception for inhibitory mechanisms which may not only govern the degree of activation within a cluster of RyRs, but may also be in charge for the termination of Ca2+ release (Sham et al. 1998; DelPrincipe et al. 1999). Unfortunately, the mechanisms linking the individual RyRs within a functional Ca2+ release unit are not at all clear. There is indirect evidence indicating that CICR may not be the only message these channels understand. For example, communication and synchronisation by allosteric interaction between the densely packed channel proteins has been proposed (Marx et al. 1998, 2001; Bers & Fill, 1998). In fact, such allosteric mechanisms could not only confer synchronised activation between adjacent channels, but could also communicate the inhibitory signals that seem to be required for both, partial activation of a cluster of RyRs (to account for Ca2+ quarks), as well as termination and stability of Ca2+ release (Stern et al. 1999).
Acknowledgments
This work was supported by the Swiss National Science Foundation for E.N. (3100-061442.00). We are grateful to D. Lüthi for technical assistance.
REFERENCES
- Bers DM. Excitation-Contraction Coupling and Cardiac Contractile Force. Dordrecht, The Netherlands: Kluwer Academic Publishers; 2001. [Google Scholar]
- Bers DM, Fill M. Muscle contraction — Coordinated feet and the dance of ryanodine receptors. Science. 1998;281:790–791. doi: 10.1126/science.281.5378.790. [DOI] [PubMed] [Google Scholar]
- Bhat MB, Hayek SM, Zhao JY, Zang WJ, Takeshima H, Wier WG, Ma JJ. Expression and functional characterization of the cardiac muscle ryanodine receptor Ca2+ release channel in Chinese hamster ovary cells. Biophysical Journal. 1999;77:808–816. doi: 10.1016/S0006-3495(99)76933-X. [DOI] [PMC free article] [PubMed] [Google Scholar]
- Bouchard RA, Clark RB, Giles WR. Regulation of unloaded cell shortening by sarcolemmal sodium-calcium exchange in isolated rat ventricular myocytes. Journal of Physiology. 1993;469:583–599. doi: 10.1113/jphysiol.1993.sp019831. [DOI] [PMC free article] [PubMed] [Google Scholar]
- Bustamante JO. Block of sodium currents by the calcium antagonist D600 in human heart cell segments. Pflügers Archiv. 1985;403:225–227. doi: 10.1007/BF00584106. [DOI] [PubMed] [Google Scholar]
- Callewaert G. Excitation-contraction coupling in mammalian cardiac cells. Cardiovascular Research. 1992;26:923–932. doi: 10.1093/cvr/26.10.923. [DOI] [PubMed] [Google Scholar]
- Cannell MB, Cheng H, Lederer WJ. Spatial non-uniformities in [Ca2+]i during excitation-contraction coupling in cardiac myocytes. Biophysical Journal. 1994;67:1942–1956. doi: 10.1016/S0006-3495(94)80677-0. [DOI] [PMC free article] [PubMed] [Google Scholar]
- Cannell MB, Cheng H, Lederer WJ. The control of calcium release in heart muscle. Science. 1995;268:1045–1049. doi: 10.1126/science.7754384. [DOI] [PubMed] [Google Scholar]
- Cannell MB, Soeller C. Numerical analysis of ryanodine receptor activation by L-type channel activity in the cardiac muscle diad. Biophysical Journal. 1997;73:112–122. doi: 10.1016/S0006-3495(97)78052-4. [DOI] [PMC free article] [PubMed] [Google Scholar]
- Cheng H, Lederer WJ, Cannell MB. Calcium sparks: elementary events underlying excitation-contraction coupling in heart muscle. Science. 1993;262:740–744. doi: 10.1126/science.8235594. [DOI] [PubMed] [Google Scholar]
- Crespo LM, Grantham CJ, Cannell MB. Kinetics, stoichiometry and role of the Na-Ca exchange mechanism in isolated cardiac myocytes. Nature. 1990;345:618–621. doi: 10.1038/345618a0. [DOI] [PubMed] [Google Scholar]
- DelPrincipe F, Egger M, Niggli E. Calcium signalling in cardiac muscle: refractoriness revealed by coherent activation. Nature Cell Biology. 1999;1:323–329. doi: 10.1038/14013. [DOI] [PubMed] [Google Scholar]
- DelPrincipe F, Egger M, Niggli E. L-type Ca2+ current as the predominant pathway of Ca2+ entry during INa activation in β-stimulated cardiac myocytes. Journal of Physiology. 2000;527:455–466. doi: 10.1111/j.1469-7793.2000.00455.x. [DOI] [PMC free article] [PubMed] [Google Scholar]
- Egger M, Niggli E. Regulatory function of Na-Ca exchange in the heart: Milestones and outlook. Journal of Membrane Biology. 1999;168:107–130. doi: 10.1007/s002329900502. [DOI] [PubMed] [Google Scholar]
- Evans AM, Cannell MB. The role of L-type Ca2+ current and Na+ current-stimulated Na/Ca exchange in triggering SR release in guinea-pig cardiac ventricular myocytes. Journal of Cardiovascular Research. 1997;35:294–302. doi: 10.1016/s0008-6363(97)00117-x. [DOI] [PubMed] [Google Scholar]
- Ferrier GR, Zhu J, Redondo IM, Howlett SE. Role of cAMP-dependent protein kinase A in activation of a voltage-sensitive release mechanism for cardiac contraction in guinea-pig myocytes. Journal of Physiology. 1998;513:185–201. doi: 10.1111/j.1469-7793.1998.185by.x. [DOI] [PMC free article] [PubMed] [Google Scholar]
- Franzini-Armstrong C, Protasi F, Ramesh V. Shape, size, and distribution of Ca2+ release units and couplons in skeletal and cardiac muscles. Biophysical Journal. 1999;77:1528–1539. doi: 10.1016/S0006-3495(99)77000-1. [DOI] [PMC free article] [PubMed] [Google Scholar]
- Han S, Schiefer A, Isenberg G. Ca2+ load of guinea-pig ventricular myocytes determines efficacy of brief Ca2+ currents as trigger for Ca2+ release. Journal of Physiology. 1994;480:411–421. doi: 10.1113/jphysiol.1994.sp020371. [DOI] [PMC free article] [PubMed] [Google Scholar]
- Hobai IA, Howarth FC, Pabbathi VK, Dalton GR, Hancox JC, Zhu JQ, Howlett SE, Ferrier GR, Levi AJ. Voltage-activated Ca release’ in rabbit, rat and guinea-pig cardiac myocytes, and modulation by internal cAMP. Pflügers Archiv. 1997;435:164–173. doi: 10.1007/s004240050496. [DOI] [PubMed] [Google Scholar]
- Horackova M, Vassort G. Sodium-calcium exchange in regulation of cardiac contractility. Evidence for an electrogenic, voltage-dependent mechanism. Journal of General Physiology. 1979;73:403–424. doi: 10.1085/jgp.73.4.403. [DOI] [PMC free article] [PubMed] [Google Scholar]
- Howlett SE, Zhu J, Ferrier GR. Contribution of a voltage-sensitive calcium release mechanism to contraction in cardiac ventricular myocytes. American Journal of Physiology. 1998;274:H155–170. doi: 10.1152/ajpheart.1998.274.1.H155. [DOI] [PubMed] [Google Scholar]
- HÜSER J, Lipp P, Niggli E. Confocal microscopic detection of potential-sensitive dyes used to reveal loss of voltage control during patch-clamp experiments. Pflügers Archiv. 1996;433:194–199. doi: 10.1007/s004240050267. [DOI] [PubMed] [Google Scholar]
- LeBlanc N, Hume JR. Sodium current-induced release of calcium from cardiac sarcoplasmic reticulum. Science. 1990;248:372–376. doi: 10.1126/science.2158146. [DOI] [PubMed] [Google Scholar]
- Lederer WJ, Berlin JR, Cohen NM, Hadley RW, Bers DM, Cannell MB. Excitation-contraction coupling in heart cells. Roles of the sodium-calcium exchange, the calcium current, and the sarcoplasmic reticulum. Annals of the New York Academy of Sciences. 1990a;588:190–206. doi: 10.1111/j.1749-6632.1990.tb13210.x. [DOI] [PubMed] [Google Scholar]
- Lederer WJ, Niggli E, Hadley RW. Sodium-calcium exchange in excitable cells: fuzzy space. Science. 1990b;248:283. doi: 10.1126/science.2326638. [DOI] [PubMed] [Google Scholar]
- Levi AJ, Spitzer KW, Kohmoto O, Bridge JHB. Depolarization-induced Ca entry via Na-Ca exchange triggers SR release in guinea pig cardiac myocytes. American Journal of Physiology. 1994;266:H1422–1433. doi: 10.1152/ajpheart.1994.266.4.H1422. [DOI] [PubMed] [Google Scholar]
- Lipp P, Bootman MD. The physiology and molecular biology of the Na/Ca exchange. In: Zippe, Jalife, editors. Cardiac Electrophysiology. Philadelphia, USA: W. N. Saunders Company; 1999. pp. 41–51. [Google Scholar]
- Lipp P, Niggli E. Sodium current-induced calcium signals in isolated guinea-pig ventricular myocytes. Journal of Physiology. 1994;474:439–446. doi: 10.1113/jphysiol.1994.sp020035. [DOI] [PMC free article] [PubMed] [Google Scholar]
- Lipp P, Niggli E. Submicroscopic calcium signals as fundamental events of excitation-contraction coupling in guinea-pig cardiac myocytes. Journal of Physiology. 1996;492:31–38. doi: 10.1113/jphysiol.1996.sp021286. [DOI] [PMC free article] [PubMed] [Google Scholar]
- Lipp P, Niggli E. Fundamental calcium release events revealed by two-photon excitation photolysis of caged calcium in guinea-pig cardiac myocytes. Journal of Physiology. 1998;508:801–809. doi: 10.1111/j.1469-7793.1998.801bp.x. [DOI] [PMC free article] [PubMed] [Google Scholar]
- LopeZ-Lopez JR, Shacklock PS, Balke CW, Wier WG. Local calcium transients triggered by single L-type calcium channel currents in cardiac cells. Science. 1995;268:1042–1045. doi: 10.1126/science.7754383. [DOI] [PubMed] [Google Scholar]
- Makielski JC, Sheets MF, Hanck DA, January CT, FoARDZZ HA. Sodium current in voltage clamped internally perfused canine cardiac Purkinje cells. Biophysical Journal. 1987;52:1–11. doi: 10.1016/S0006-3495(87)83182-X. [DOI] [PMC free article] [PubMed] [Google Scholar]
- Marx SO, Gaburjakova J, Gaburjakova M, Henrikson C, Ondrias K, Marks AR. Coupled gating between cardiac calcium release channels (ryanodine receptors) Circulation Research. 2001;88:1151–1158. doi: 10.1161/hh1101.091268. [DOI] [PubMed] [Google Scholar]
- Marx SO, Ondrias K, Marks AR. Coupled gating between individual skeletal muscle Ca2+ release channels (ryanodine receptors) Science. 1998;281:818–821. doi: 10.1126/science.281.5378.818. [DOI] [PubMed] [Google Scholar]
- Niggli E. Localized intracellular calcium signaling in muscle: Calcium sparks and calcium quarks. Annual Review of Physiology. 1999;61:311–335. doi: 10.1146/annurev.physiol.61.1.311. [DOI] [PubMed] [Google Scholar]
- Santana LF, Gomez AM, Lederer WJ. Ca2+ flux through promiscuous cardiac Na+ channels: slip-mode conductance. Science. 1998;279:1027–1033. doi: 10.1126/science.279.5353.1027. [DOI] [PubMed] [Google Scholar]
- Santana LF, Kranias EG, Lederer WJ. Calcium sparks and excitation-contraction coupling in phospholamban-deficient mouse ventricular myocytes. Journal of Physiology. 1997;480:411–421. doi: 10.1111/j.1469-7793.1997.021bi.x. [DOI] [PMC free article] [PubMed] [Google Scholar]
- Sham JSK, Cleemann L, Morad M. Gating of the cardiac Ca2+ release channel: the role of Na+ current and Na+-Ca2+ exchange. Science. 1992;255:850–853. doi: 10.1126/science.1311127. [DOI] [PubMed] [Google Scholar]
- Sham JSK, Hatem SN, Morad M. Species differences in the activity of the Na+-Ca2+ exchanger in mammalian cardiac myocytes. Journal of Physiology. 1995;488:623–631. doi: 10.1113/jphysiol.1995.sp020995. [DOI] [PMC free article] [PubMed] [Google Scholar]
- Sham JSK, Song LS, Chen Y, Deng LH, Stern MD, Lakatta EG, Cheng HP. Termination of Ca2+ release by a local inactivation of ryanodine receptors in cardiac myocytes. Proceedings of the National Academy of Sciences of the USA. 1998;95:15096–15101. doi: 10.1073/pnas.95.25.15096. [DOI] [PMC free article] [PubMed] [Google Scholar]
- Shirokova N, Rios E. Small event Ca2+ release: a probable precursor of Ca2+ sparks in frog skeletal muscle. Journal of Physiology. 1997;502:3–11. doi: 10.1111/j.1469-7793.1997.003bl.x. [DOI] [PMC free article] [PubMed] [Google Scholar]
- Sipido KR, Carmeliet E, Pappano A. Na+ current and Ca2+ release from the sarcoplasmic reticulum during action potentials in guinea-pig ventricular myocytes. Journal of Physiology. 1995;489:1–17. doi: 10.1113/jphysiol.1995.sp021025. [DOI] [PMC free article] [PubMed] [Google Scholar]
- Sipido KR, Carmeliet E, Van de Werf F. T-type Ca2+ current as a trigger for Ca2+ release from the sarcoplasmic reticulum in guinea-pig ventricular myocytes. Journal of Physiology. 1998;508:439–451. doi: 10.1111/j.1469-7793.1998.439bq.x. [DOI] [PMC free article] [PubMed] [Google Scholar]
- Sipido KR, Maes M, Van de Werf F. Low efficiency of Ca2+ entry through the Na-Ca exchanger as trigger for Ca2+ release from the sarcoplasmic reticulum. A comparison between L-type Ca2+ current and reverse-mode Na-Ca exchange. Circulation Research. 1997;81:1034–1044. doi: 10.1161/01.res.81.6.1034. [DOI] [PubMed] [Google Scholar]
- Spencer CI, Berlin JR. Control of sarcoplasmic reticulum calcium release during calcium loading in isolated rat ventricular myocytes. Journal of Physiology. 1995;488:267–279. doi: 10.1113/jphysiol.1995.sp020965. [DOI] [PMC free article] [PubMed] [Google Scholar]
- Stern MD, Song LS, Cheng HP, Sham JSK, Yang HT, Boheler KR, Rios E. Local control models of cardiac excitation-contraction coupling — A possible role for allosteric interactions between ryanodine receptors. Journal of General Physiology. 1999;113:469–489. doi: 10.1085/jgp.113.3.469. [DOI] [PMC free article] [PubMed] [Google Scholar]
- Trafford AW, Diaz ME, Eisner DA. Coordinated control of cell Ca2+ loading and triggered release from the sarcoplasmic reticulum underlies the rapid inotropic response to increased L-type Ca2+ current. Circulation Research. 2001;88:195–201. doi: 10.1161/01.res.88.2.195. [DOI] [PubMed] [Google Scholar]
- Wang SQ, Song LS, Lakatta EG, Cheng HP. Ca2+ signalling between single L-type Ca2+ channels and ryanodine receptors in heart cells. Nature. 2001;410:592–596. doi: 10.1038/35069083. [DOI] [PubMed] [Google Scholar]
- Wendt-Gallitelli MF, Voigt T, Isenberg G. Microheterogeneity of subsarcolemmal sodium gradients. Electron probe microanalysis in guinea-pig ventricular myocytes. Journal of Physiology. 1993;472:33–44. doi: 10.1113/jphysiol.1993.sp019934. [DOI] [PMC free article] [PubMed] [Google Scholar]