

Abstract
This study assessed the effects of long-term consumption of the United States Recommended Dietary Allowance (RDA) for protein by older people who were sedentary or performed resistive training (RT) on body composition, skeletal muscle size and protein metabolism, and if the number of muscle groups trained influenced the muscle hypertrophy response to RT. Twelve men and 17 women (age range 54–78 years) completed this 14 week controlled diet and exercise study. Throughout the study, each subject completely consumed daily euenergetic menus that provided the RDA of 0.8 g protein kg−1 day−1. From study weeks 3–14 (weeks RT1-RT12), 10 subjects (four men, six women) performed whole body RT (WBRT), nine subjects (four men, five women) performed lower body RT (LBRT) and 10 subjects (four men, six women) remained sedentary (SED). Both the LBRT and WBRT groups performed knee extension and flexion exercises, and the WBRT group also performed chest press and arm pull exercises (three sets per exercise at 80 % of one repetition maximum, 3 days per week for 12 weeks). From week 2 (baseline) to week RT12, muscle strength increased in muscle groups trained in the LBRT and WBRT groups, and was not changed in the SED group. From baseline to week RT12, whole body muscle mass and protein-mineral mass were not changed, fat-free mass (P = 0.004) and total body water (P = 0.013) were decreased, and percentage body fat was increased (P = 0.011) in these weight-stable older people, independent of group assignment. The RT-induced increases in mid-thigh muscle area (from computed tomography scans) were comparable in the LBRT and WBRT groups (2.13 ± 1.26 cm2 and 2.17 ± 1.24 cm2, respectively), and were different from those in the SED group, which lost muscle area (-1.74 ± 0.57 cm2; group-by-time P < 0.05). From baseline to week RT12, 24 h urinary total nitrogen excretion decreased (P < 0.001), nitrogen balance shifted from near equilibrium to positive, whole body leucine oxidation (from the infusion of L-[13C]leucine) decreased (P < 0.05) and net (postabsorptive vs. postprandial) leucine balance (P < 0.05) increased from near equilibrium to positive, with no differences in responses over time among the three groups. In conclusion, the number of muscle groups trained did not influence whole body protein metabolism or RT-induced muscle hypertrophy in older people. Most of these data are consistent with a successful adaptation to the RDA for protein. However, research should continue to question whether the decreases in fat-free mass and total body water observed in all subjects, and the decrease in mid-thigh muscle area in the SED group, are physiological accommodations, and whether the RDA for protein might be marginally inadequate for older people to maintain skeletal muscle.
Controversy exists as to whether the current United States Recommended Dietary Allowance (RDA) of 0.8 g protein kg−1 day−1 (National Research Council, 1989) is adequate to meet the dietary needs of older people. Results from a limited number of shorter-term (2-4 week) nitrogen balance experiments in older people are conflicting, with the adequacy of the RDA for protein supported by some studies (Cheng et al. 1978; Zanni et al. 1979), and questioned by others (Uauy et al. 1978; Gersovitz et al. 1982; Bunker et al. 1987). The conclusion that the RDA for protein may not be adequate for older people was supported by retrospective re-analyses (Campbell et al. 1994a) of data from these shorter-term nitrogen studies using nitrogen balance calculations recommended by the Joint FAO/WHO/UNU Expert Consultation (1985). However, this conclusion has been questioned (Millward & Roberts, 1996; Millward et al. 1997), as has the definitive utility of shorter-term nitrogen balance experiments to assess the RDA for protein in older people (Morse et al. 2001).
The word ‘accommodation’ refers to the adverse compromises or loss in physiological function that must occur within the body to re-establish metabolic steady state in response to a decrease of protein intake below the range of adequacy (i.e. a survival response) (Waterlow, 1984, 1990; Young, 1987; Young & Marchini, 1990). In contrast, the word ‘adaptation’ refers to the re-establishment of metabolic steady state without a compromise or loss of physiological function in response to a decrease in protein intake within the range of adequacy. Castaneda et al. (1995a, b) clearly demonstrated that older women who consumed inadequate protein (56 % of the RDA) for 10 weeks accommodated with losses of body cell mass and muscle mass, reduced muscle strength and impaired immune responses, while older women who consumed 115 % of the RDA successfully adapted and maintained these parameters. Recently, Campbell et al. (2001) reported that older people who consumed the RDA for protein for 14 weeks accommodated with a decrease in skeletal muscle area. Thus, the adequacy of 0.8 g protein kg−1 day−1 to provide for the physiological needs of older people remains in question.
For many elderly adults, an age-associated decline in muscle strength and mass (i.e. sarcopenia) contributes to diminished muscle function and the onset of physical frailty. Research with older men (Frontera et al. 1988) and elderly men and women (Fiatarone et al. 1990) demonstrated that resistive training increased maximal strength of the muscles used to perform knee extension and flexion exercises by up to 200 %, and that this response was associated with an increase in mid-thigh muscle size of about 10 %. Subjects in these studies only trained the muscle groups involved in knee extension and flexion. More recent research from the same laboratory confirmed that resistive training effectively and significantly increases muscle strength in older and elderly people (Campbell et al. 1994b, 1995; Fiatarone et al. 1994). However, significant muscle hypertrophy of the resistive-trained muscle groups was not consistently observed in these studies (Campbell et al. 1994 b, 1995; Fiatarone et al. 1994), in contrast with the previous studies (Frontera et al. 1988; Fiatarone et al. 1990). One of the differences in experimental design among these studies was that the participants in the more recent studies (Campbell et al. 1994b, 1995; Fiatarone et al. 1994) performed whole body (upper and lower body) resistive training programmes, in contrast to the lower body only resistive training programmes used in the earlier studies (Frontera et al. 1988; Fiatarone et al. 1990). We questioned if the number of muscle groups stimulated as part of a resistive training programme influenced the degree of hypertrophy of a given group of muscles. Data from a whole body resistive training study showed a significant retention of body nitrogen with resistive training (Campbell et al. 1995). However, the amount of nitrogen retained, if distributed proportionally to all muscle groups trained, would not result in a detectable amount of muscle hypertrophy, given the body composition techniques used.
The first aim of this study was to continue to assess the adequacy of the current RDA for protein to meet the dietary need of older people (Campbell et al. 1994a, 2001). The second aim was to examine in older people if the number of muscle groups trained (i.e. whole body versus lower body resistive training) influenced the degree of resistive training-induced muscle hypertrophy. We hypothesized that mid-thigh muscle area would increase in older people who performed resistive training, compared with a sedentary control group. It was further hypothesized that the muscle hypertrophy would be greater in the group who performed lower body only resistive training, compared with those who performed whole body resistive training. The third aim of this study was to assess if these hypothesized group-specific muscle hypertrophy responses would be related to differential changes in protein metabolism. To accomplish these aims, all of the older people who participated in this 14 week strictly controlled dietary and exercise study consumed euenergetic diets that provided 0.8 protein kg−1 day−1, and longer-term preservation of whole body and muscle protein metabolism and mass was assessed in groups of subjects who were sedentary or performing lower body or whole body resistive training.
METHODS
Subjects
Twelve men and 17 women, age range 55–78 years, participated in this study. Prior to the study, each subject completed a recruitment interview and medical evaluation, and was deemed apparently healthy and capable of successfully completing the protocol. The medical evaluation included routine blood and urine chemistries, a resting electrocardiogram, a resistive exercise stress test, a physician-administered physical examination, and written and oral medical histories. For the resistive exercise stress test, blood pressure, heart rate and electrocardiogram measurements were taken immediately after each subject finished two sets of eight repetitions of bilateral leg extension exercise at 80 % of their estimated maximal abilities. Each subject had clinically normal heart, thyroid, kidney and liver function, and was a non-smoker. None of the women was taking any oestrogen replacement medications. Each subject signed a written informed consent agreement. The study protocol and consent form were reviewed and approved by the Institutional Review Board, the Pennsylvania State University, University Park, PA and the Clinical Investigation Committee, the Pennsylvania State University, the Milton S. Hershey Medical Center, Hershey, PA, USA. All procedures conformed with the Declaration of Helsinki.
Experimental design
The protocol was a 14 week controlled diet and exercise study. It was conducted at a General Clinical Research Center (GCRC) located at the Noll Physiological Research Center on the University Park campus of the Pennsylvania State University. During weeks 2, 3, 8 and 14, the study was conducted on an inpatient basis at the GCRC. For the other 10 weeks, the study was conducted on an outpatient basis, and the subjects maintained their usual lifestyles and daily activities as much as possible while residing at home.
Prior to enrolment into the study, each subject was assigned to one of three groups: (1) sedentary (SED, n = 4 men and n = 6 women); (2) lower body resistive training (LBRT, n = 4 men and n = 5 women); or (3) whole body resistive training (WBRT, n = 4 men and n = 6 women). Group assignments were done using separate randomization schemes for the men and women. All baseline testing was completed during weeks one and two, at which time all of the subjects remained sedentary. The subjects in the LBRT and WBRT groups participated in the resistive training programme from study weeks 3-14. For descriptive purposes, the methods and results of the study are presented in relation to the week of resistive training, i.e. baseline (study week 2), week RT6 (study week 8) and week RT12 (study week 14).
Dietary control
Throughout the 14 week study, each subject was provided foods and beverages, using a rotating schedule of three menus, portioned to provide sufficient total dietary energy to maintain body weight, 0.8 protein kg−1 day−1 and a non-protein energy content of 60 % carbohydrate and 40 % fat. Whereas animal striated tissues (i.e. poultry, pork, beef and fish) were not used due to the high protein content of these foods, animal-based proteins were provided in the forms of egg-based proteins (10 % of total protein) and milk-based proteins (29 % of total protein). A detailed description of the menus was previously published (Campbell et al. 1997). The subjects were instructed to completely consume only the foods and beverages provided. Ad libitum water intake was allowed. Compliance with the controlled diet was reinforced by requiring the subjects to scrape and rinse the glasses, dishes and utensils that they used and to consume the rinse water. The subjects were also required to consume all of their meals during the residency periods, and a minimum of one meal each weekday during the free-living periods, at the GCRC dining facility under the supervision of the dietary staff. Each subject was required to return the used glasses, dishes and utensils from all of their meals unwashed for inspection by the dietary staff.
Each subject's total energy intake was initially set to equal 1.70 times their resting energy expenditure (REE), with REE estimated using the sex-specific equations of Harris-Benedict (Harris & Benedict, 1919). The macronutrient, fibre and energy contents of each subject's menus were determined using Nutritionist IV software (version 4.0, N-Squared Computing, First DataBank, Inc.,San Bruno, CA, USA), and the general Atwater values of 16.7, 16.7 and 37.7 kJ (g metabolizable energy)−1 for protein, carbohydrate and fat, respectively. Total energy intake was adjusted, as necessary, during the free-living study weeks to maintain body weight at ± 0.5 kg of each subject's mean body weight during study days 4-15. An adjustment in energy intake was made if a subject's body weight was greater than 0.5 kg different from their baseline weight for three consecutive days, and was accomplished by adding or subtracting protein-free or low-protein foods and beverages from the daily menus while keeping the non-protein energy ratio at 60 % carbohydrate and 40 % fat.
Resistive training programme
The people assigned to the LBRT and WBRT groups performed progressive resistive training three times per week using Keiser pneumatic resistive exercise equipment (Keiser Sports Health Equipment Company, Fresno, CA, USA). The LBRT group performed unilateral knee extension and bilateral seated leg curl exercises only. The WBRT group performed unilateral knee extension and bilateral seated leg curl exercises (exactly the same as the LBRT group), and seated chest press and seated arm pull exercises. For each exercise, two sets of eight repetitions at 80 % of the one repetition maximum, followed by a third set of repetitions to voluntary muscular fatigue, were done. If twelve repetitions were successfully completed for set three, the training resistance was increased by 5 % for the next exercise session. One repetition maximum testing was done during the first two exercise sessions, and again at weeks RT6 and RT12. The SED group completed all one repetition maximum testing, but did not engage in the resistive training sessions.
Resting energy expenditure and the energy expenditure of physical activity
At baseline and week RT12, fasting state resting energy expenditure was measured using a ventilated hood indirect calorimeter, as previously described by Campbell et al. (1997). At baseline, week RT6 and week RT12, the energy expenditure associated with habitual physical activity was estimated using the Yale Physical Activity Survey (DiPietro et al. 1993). The questionnaire was administered each time by the same interviewer during a private session with a subject.
Body composition measurements
At baseline, body height without shoes was measured to the nearest 0.1 cm with a wall-mounted stadiometer. Fasting, nude body weight was measured each weekday throughout the study to the nearest 0.1 kg using digital scales (Toledo Scale, model 2181, Toledo, OH, USA). Hydrostatic weighing (Akers & Buskirk, 1969), with lung residual volume measured by nitrogen dilution (Wilmore, 1969), was used to determine body density at baseline and week RT12. Total body water was determined at baseline and week RT12 using the deuterium oxide dilution technique, as previously described by Campbell et al. (1994b). Percentage body fat was calculated from body density (kg l−1) and total body water (expressed as a decimal fraction of body mass) from the three-compartment model equation of Siri (1961):
Fat-free mass was calculated as body mass minus fat mass and protein plus mineral mass was calculated as fat-free mass minus body water mass. Measurements of body density were not obtained for one woman due to her uneasiness with the hydrostatic weighing procedure.
Twenty-four-hour urine collections were obtained on four consecutive days during baseline, week RT6 and week RT12. The creatinine concentration of aliquots of these samples was determined using a Technicon Autoanalyzer II (Technicon Instruments, Tarrytown, NY, USA) by using the Jaffe reaction (Bousnes & Taussky, 1945). Twenty-four-hour urinary creatinine excretion is used as an indirect indicator of whole body muscle mass (Heymsfield et al. 1983; Welle et al. 1996).
Computed tomography (CT) scanning (Picker 2000 operating at 130 kVp, Picker International Inc., Cleveland, OH, USA) and image analyses (National Institutes of Health IMAGE, version 1.60) were used to measure the muscle and fat areas of the dominant side mid-thigh and mid-arm at baseline and week RT12. For the mid-thigh measurement, a 10 mm CT slice was taken midway between the inguinal crease and the lower pole of the patella. For the mid-arm measurement, a 10 mm slice was taken midway between the acromioclavicular joint and the olecranon. At baseline, the exact locations of the mid-thigh and mid-arm CT slices were determined from bony landmarks on the femur and humerus, respectively. These bony landmarks were used to identify the identical slice location for the week RT12 scans. Details of the image transfer hardware and software have been previously published (Campbell et al. 2001). The results from the SED group are presented for n = 8 subjects (three men and five women), since the image data from two SED subjects were inadvertently lost during processing.
Nitrogen and energy intakes and excretions
At baseline, week RT6 and week RT12, samples from four consecutive 24 h urine collections, four-day faeces collections (made between two dye markers), and duplicate menu composites, were obtained and stored frozen at −20 °C. The total nitrogen content of each food, urine and faeces sample was measured using an Elementar Macro N nitrogen analyser (Elementar Analysensytene GmBh, Hanau, Germany). In-house pooled food and urine standards and the National Institute of Standards and Technologies Total Diet standard reference material were used as quality controls for the nitrogen analyses. Nitrogen balance was calculated as:
where IN = daily dietary nitrogen intake; UN = daily urinary nitrogen excretion; FN = daily faecal excretion; and MN = daily miscellaneous nitrogen losses, assumed to be 8 mg nitrogen kg−1 day−1 (FAO/WHO/UNU, 1985).
The food, urine and faeces samples were also analysed for gross energy content using a bomb calorimeter (model 1261, Parr Instrument Company, Moline, IL, USA). Whole egg, egg white and olive oil were used as quality control samples. The metabolizable energy intake (MJ day−1) of each subject was calculated to equal dietary gross energy intake minus gross energy in urine minus gross energy in faeces.
Infusion procedures and calculations
At the end of baseline and week RT12 (48 h post-exercise for the WBRT and LBRT groups), a primed constant infusion of l-[1-13C]leucine was used to determine postabsorptive and postprandial whole body leucine kinetics. After baseline blood and expired breath samples were obtained in triplicate, the infusion of the isotopes was started with the intraveneous administration of priming doses of NaH13CO3 (2.35 μmol kg−1) and l-[1-13C]leucine (7.6 μmol kg−1). Immediately following these priming doses, a continuous infusion of l-[1-13C]leucine (7.6 μmol kg−1 h−1) was started and maintained constant using a calibrated syringe pump (Harvard Apparatus, model 55-222, Natick, MA, USA).
The subjects remained in the postabsorptive state during the first four hours, and were in a postprandial state during the last four hours of the eight-hour infusion. The postprandial state was established by having each subject consume hourly (minutes 240, 300, 360 and 420 of the infusion procedure) a formula beverage that contained one-twelfth of his or her daily protein and energy intakes at baseline. Postprandial dietary leucine intakes for the SED, LBRT and WBRT groups were 42 ± 2, 43 ± 2 and 45 ± 1 μmol leucine kg−1 min−1, respectively. Blood and expired breath samples were obtained at 15 min intervals during hours 3–4 (postabsorptive) and 7–8 (postprandial) of the infusion, and processed using standard methods (Matthews et al. 1980; Wolfe, 1992). The rate of carbon dioxide production was measured using a ventilated hood indirect calorimeter prior to and during the fourth and eighth hours of the infusions.
One week prior to an infusion procedure, each subject consumed the formula beverage hourly for four hours and breath samples were collected on the same schedule as during the infusion procedure. The 13CO2 enrichments of these breath samples were measured and subtracted from the corresponding samples collected on the infusion day to account for any changes in 13CO2 associated with consuming the formula beverages.
The 13C-enrichment of plasma α-ketoisocaproic acid (KIC) was determined by gas chromatography mass spectrometry (Hewlett-Packard, model HP 5989, Palo Alto, CA, USA), and the 13CO2 enrichment of expired breath samples was determined by isotope ratio mass spectrometry (VG Isogas, model SIRA 2, VG Instruments, Middlewich, UK; Wolfe, 1992). The isotope enrichment of each sample was calculated as atom percentage excess (Wolfe, 1992).
All kinetics parameters are expressed as μmol leucine kg−1 h−1. Leucine turnover was calculated using a two-pool steady state approach (Pacy et al. 1994; Gibson et al. 1996), with the intracellular leucine pool estimated by the plasma α-[13C]KIC enrichment at plateau (Matthews et al. 1982):
where i represents the infusion rate of l-[1-13C]leucine, E is the isotope enrichment, Ei is the 13C enrichment of the l-[1-13C]leucine infusate, and Ep is the 13C enrichment of plasma α-[13C]KIC. This calculation of turnover includes the leucine infusate. The rate of leucine oxidation was calculated from the 13CO2 excretion rate and the plasma α-[13C]KIC enrichment:
F13CO2 represents the 13CO2 excretion rate and was calculated as (FCO2 × ECO2 × 60 × 41.6)/BW, where FCO2 is the CO2 production rate (ml min−1); ECO2 is the 13CO2 enrichment in expired breath (mole fraction); the constants 60 min h−1 and 41.6 μmol ml−1 (at standard temperature and pressure) convert FCO2 to μmol h−1; and BW is the subject's body weight in kg. The R is the fractional bicarbonate retention factor (i.e. the fraction of 13CO2 released from l-[1-13C]leucine oxidation and present in expired breath) and Ep is the 13C enrichment of plasma α-[13C]KIC. The values of 0.70 and 0.82, respectively, were used for R in the postabsorptive and postprandial states (Hoerr et al. 1989).
In a steady state, the components of leucine turnover are represented by the following equation:
Leucine incorporation into protein (synthesis) was calculated as turnover minus oxidation. Leucine release from protein (breakdown) was calculated as turnover minus dietary leucine intake minus infusate intake. In the postabsorptive state intake from diet was zero, and breakdown equalled turnover minus infusate intake. Postabsorptive and postprandial leucine balances were calculated from intake (diet + infusate) minus oxidation. Net leucine balance was calculated as postabsorptive leucine balance plus postprandial leucine balance.
Statistical analyses
Values are reported as means ± s.e.m. At baseline and week RT12, differences among groups in mean values for all dependent variables were assessed using a one-factor ANOVA. The main effects and interactions of group and time were assessed using two-factor repeated measures ANOVA. Statistical significance was assigned at P < 0.05 (two-sided). For the two-factor ANOVA, when a statistically significant group-by-time effect was established, the change over time in the variable was calculated and separate comparisons (Student's unpaired t tests) were then done. Data processing was accomplished using Microsoft Excel 5.0 (Microsoft, Redmond, WA, USA) software. Statistical evaluations were done using JMP software (version 3.2.2, SAS Institute Inc., Cary, NC, USA).
RESULTS
At baseline, dietary protein, carbohydrate, fat, fibre and metabolizable energy intakes were not different among the SED, LBRT and WBRT groups (Table 1). Metabolizable energy intakes had to be increased over time to maintain stable body weights, and this was accomplished by increasing carbohydrate and fat intakes while protein intake remained constant. The increase in energy intake was necessary for all three groups. Metabolizable energy intake was not different among the three groups at week RT12. At baseline, resting energy expenditure and the energy expenditure of physical activity were not different among the SED, LBR, and WBRT groups, and these parameters were not changed over time in any of the groups (Table 1).
Table 1.
Dietary intakes and energy expenditures of the subjects in the sedentary, lower body resistive training, and whole body resistive training groups
| Parameter | Group | Baseline | Week RT6 | Week RT12 |
|---|---|---|---|---|
| Protein intake (g day−1) | SED | 53 ± 3 | 53 ± 3 | 53 ± 3 |
| LBRT | 56 ± 5 | 56 ± 5 | 56 ± 5 | |
| WBRT | 57 ± 3 | 57 ± 3 | 57 ± 3 | |
| Carbohydrate* (g day−1) | SED | 347 ± 43 | 365 ± 40 | 362 ± 35 |
| LBRT | 331 ± 24 | 357 ± 31 | 362 ± 33 | |
| WBRT | 318 ± 14 | 338 ± 15 | 329 ± 15 | |
| Fat* (g day−1) | SED | 96 ± 7 | 105 ± 10 | 106 ± 10 |
| LBRT | 97 ± 7 | 105 ± 9 | 106 ± 9 | |
| WBRT | 93 ± 4 | 98 ± 4 | 96 ± 5 | |
| Fibre (g day−1) | SED | 25 ± 1 | 25 ± 1 | 25 ± 1 |
| LBRT | 26 ± 1 | 26 ± 1 | 26 ± 1 | |
| WBRT | 25 ± 1 | 25 ± 1 | 25 ± 1 | |
| MEI*(MJ day−1) | SED | 8.06 ± 0.71 | 8.90 ± 1.27 | 9.45 ± 0.95 |
| LBRT | 8.18 ± 0.44 | 8.51 ± 0.66 | 9.40 ± 0.83 | |
| WBRT | 7.88 ± 0.58 | 8.52 ± 0.83 | 8.64 ± 0.53 | |
| REE (MJ day−1) | SED | 5.77 ± 0.18 | — | 5.72 ± 0.21 |
| LBRT | 5.89 ± 0.33 | — | 5.85 ± 0.44 | |
| WBRT | 5.77 ± 0.27 | — | 5.65 ± 0.27 | |
| EEPA (MJ day−1) | SED | 3.10 ± 0.53 | 2.55 ± 0.45 | 2.31 ± 0.32 |
| LBRT | 2.70 ± 0.53 | 2.52 ± 0.40 | 2.37 ± 0.40 | |
| WBRT | 3.03 ± 0.56 | 2.27 ± 0.36 | 2.72 ± 0.46 |
Values are means ± s.e.m. The subjects were sedentary (SED), lower body resistive trained (LBRT) and whole body resistive trained (WBRT) older people. *Change over time, P < 0.001. MEI, metabolizable energy intake = dietary gross energy intake minus gross energy in urine minus gross energy in faeces; REE, resting energy expenditure, measured using a ventilated hood indirect calorimeter; EEPA, energy expenditure of physical activity, estimated using the Yale Physical Activity Survey for older adults (DiPietro et al. 1993).
At baseline, there were no differences in age, height, body weight, percentage body fat, fat-free mass, total body water, protein-mineral mass, urinary creatinine excretion, mid-thigh muscle area, mid-thigh fat area, mid-arm muscle area and mid-arm fat area, among the subjects in the SED, LBRT and WBRT groups (Table 2). Over time from baseline to week RT12, body weight, protein-mineral mass and urinary creatinine excretion were not changed, percentage body fat increased (P = 0.011) and fat-free mass (P = 0.004) and total body water (P = 0.013) decreased. These changes over time in whole body composition occurred in all three groups; i.e. there were no significant group-by-time interactions. For mid-thigh muscle area, a significant group-by-time interaction (P = 0.038) indicated that it changed in a group-dependent manner. The change over time was different for the LBRT and WBRT groups than for the SED group. There was no difference in response over time for mid-thigh muscle area between the LBRT and WBRT groups, and it increased significantly (P < 0.05) for these 19 subjects combined. Mid-thigh muscle area was decreased significantly (P < 0.05) for the eight subjects in the SED group. Mid-thigh fat area, mid-arm muscle area and mid-arm fat area were not changed over time or in a group-dependent manner.
Table 2.
Characteristics of the subjects in the sedentary, lower body resistive training and whole body resistive training groups
| Parameter | Group | Baseline | Week RT12 | Change |
|---|---|---|---|---|
| Age (years) | SED | 66 ± 3 | ||
| LBRT | 67 ± 3 | |||
| WBRT | 65 ± 2 | |||
| Height (cm) | SED | 167 ± 3 | ||
| LBRT | 166 ± 3 | |||
| WBRT | 166 ± 4 | |||
| Weight (kg) | SED | 67.7 ± 4.1 | 67.7 ± 4.0 | 0.0 ± 0.2 |
| LBRT | 69.2 ± 5.9 | 68.7 ± 5.7 | −0.5 ± 0.3 | |
| WBRT | 72.1 ± 3.6 | 71.9 ± 3.7 | −0.3 ± 0.3 | |
| Percentage body fat* | SED | 38.7 ± 2.8 | 40.1 ± 2.8 | 1.4 ± 1.2 |
| LBRT | 37.8 ± 1.8 | 39.4 ± 1.3 | 1.6 ± 0.8 | |
| WBRT | 40.5 ± 3.5 | 42.1 ± 3.2 | 1.6 ± 0.8 | |
| Fat-free mass* (kg) | SED | 42.1 ± 3.1 | 41.0 ± 3.0 | −1.1 ± 0.8 |
| LBRT | 43.0 ± 4.0 | 41.8 ± 3.8 | −1.2 ± 0.5 | |
| WBRT | 42.6 ± 2.8 | 41.1 ± 2.3 | −1.5 ± 0.7 | |
| Total body water* (l) | SED | 28.9 ± 2.3 | 27.8 ± 2.0 | −1.1 ± 1.0 |
| LBRT | 30.4 ± 2.9 | 29.5 ± 2.8 | −0.9 ± 0.6 | |
| WBRT | 30.6 ± 2.0 | 28.9 ± 1.5 | −1.7 ± 0.8 | |
| Protein–mineral mass (kg) | SED | 12.5 ± 0.9 | 12.6 ± 0.9 | 0.1 ± 0.4 |
| LBRT | 12.6 ± 1.2 | 12.3 ± 1.3 | −0.3 ± 0.3 | |
| WBRT | 12.0 ± 1.0 | 12.3 ± 1.0 | 0.3 ± 0.2 | |
| Urinary creatinine (g day−1) | SED | 1.08 ± 0.12 | 1.00 ± 0.11 | −0.08 ± 0.04 |
| LBRT | 1.14 ± 0.17 | 1.04 ± 0.12 | −0.10 ± 0.07 | |
| WBRT | 1.00 ± 0.11 | 1.03 ± 0.10 | 0.03 ± 0.06 | |
| Mid-thigh muscle area † (cm2) | SED | 100.4 ± 8.0 | 98.7 ± 7.5 | −1.7 ± 0.6 |
| LBRT | 115.6 ± 12.6 | 117.7 ± 12.3 | 2.1 ± 1.3† | |
| WBRT | 113.5 ± 8.8 | 115.7 ± 8.7 | 2.2 ± 1.2† | |
| Mid-thigh fat area (cm2) | SED | 76.8 ± 14.1 | 78.3 ± 14.1 | 1.5 ± 1.3 |
| LBRT | 57.1 ± 8.9 | 57.2 ± 8.5 | 0.1 ± 1.3 | |
| WBRT | 105.1 ± 21.0 | 103.2 ± 21.0 | −1.9 ± 1.5 | |
| Mid-arm muscle area (cm2) | SED | 29.6 ± 3.6 | 29.4 ± 3.7 | −0.2 ± 0.4 |
| LBRT | 35.1 ± 3.8 | 34.9 ± 3.8 | −0.3 ± 0.7 | |
| WBRT | 32.2 ± 3.3 | 32.7 ± 3.4 | 0.5 ± 0.6 | |
| Mid-arm fat area (cm2) | SED | 34.9 ± 6.4 | 34.1 ± 6.1 | −0.8 ± 1.3 |
| LBRT | 36.3 ± 4.4 | 36.2 ± 4.9 | −0.1 ± 0.8 | |
| WBRT | 40.6 ± 7.1 | 40.0 ± 7.2 | −0.6 ± 0.6 | |
| Upper body strength † (N) | SED | 672 ± 98 | 657 ± 89 | −1 ± 2 % |
| LBRT | 640 ± 106 | 668 ± 88 | 10 ± 5 % | |
| WBRT | 686 ± 76 | 810 ± 93 | 18 ± 3 % | |
| Lower body strength † (Nm) | SED | 297 ± 42 | 288 ± 33 | −0 ± 7 % |
| LBRT | 290 ± 50 | 357 ± 50 | 36 ± 11 %† | |
| WBRT | 280 ± 40 | 361 ± 43 | 32 ± 6 %† |
Values are means ± s.e.m. The subjects were sedentary (SED), lower body resistive trained (LBRT), and whole body resistive trained (WBRT) older people. *Week RT12 different from baseline for all subjects (i.e. a main effect of time), P < 0.05. † Group-by-time interaction, P < 0.05. ± Change with time different than SED group, P < 0.05.
At baseline, the SED, LBRT and WBRT groups were not different in upper body and lower body strength (Table 2). Over time, the groups responded differently in upper body and lower body strength (group-by-time interactions, P = 0.001 and P = 0.001, respectively). For upper body strength, the WBRT group increased compared with the SED group, with the LBRT response intermediate to these two groups. For lower body strength, the LBRT and WBRT groups increased strength, compared with the SED group, with no difference in response between the LBRT and WBRT groups.
Dietary total nitrogen intake averaged 131.8 ± 1.4 mg N kg−1 day−1 at baseline for all subjects, with no difference among groups, and was purposefully maintained constant throughout the entire study period (Table 3). Urinary total nitrogen excretion averaged 101.9 ± 3.4 mg N kg−1 day−1 at baseline for all subjects, with no difference among groups. Over time from baseline to week RT6 to week RT12, urinary total nitrogen excretion decreased (P = 0.001), with no statistically significant differences in response among the three groups (group-by-time interaction, P = 0.158). However, as shown in Fig. 1, there was the appearance of a difference in response for the SED group, compared with the LBRT and WBRT groups from week RT6 to week RT12. At week RT12, urinary total nitrogen excretion was different for the SED group, compared with the LBRT and WBRT groups (P = 0.038, one-way ANOVA for group effect using week RT12 data only). Nitrogen excretion in faeces was not different among the three groups at baseline, and was not changed over time (Table 3). Nitrogen balance was near equilibrium at baseline and shifted to positive over time (P = 0.009). At week RT12, nitrogen balance was not significantly different among the SED, LBRT and WBRT groups (P = 0.198, one-way ANOVA for group effect using week RT12 data only).
Table 3.
Nitrogen balance of the subjects in the sedentary, lower body resistive training, and whole body resistive training groups
| Parameter | Group | Baseline | Week RT6 | Week RT12 |
|---|---|---|---|---|
| Dietary nitrogen intake (mg N kg−1 day−1) | SED | 131 ± 1 | 131 ± 1 | 130 ± 1 |
| LBRT | 133 ± 3 | 132 ± 3 | 133 ± 3 | |
| WBRT | 131 ± 3 | 130 ± 2 | 129 ± 2 | |
| Urinary nitrogen excretion* (mg N kg−1 day−1) | SED | 103 ± 4 | 88 ± 4 | 80 ± 4 |
| LBRT | 103 ± 8 | 88 ± 6 | 93 ± 5 | |
| WBRT | 100 ± 5 | 89 ± 5 | 95 ± 3 | |
| Faeces nitrogen excretion (mg N kg−1 day−1) | SED | 24 ± 2 | 25 ± 2 | 22 ± 2 |
| LBRT | 22 ± 1 | 25 ± 1 | 23 ± 2 | |
| WBRT | 22 ± 2 | 24 ± 2 | 23 ± 2 | |
| Nitrogen balance*† (mg N kg−1 day−1) | SED | −3 ± 5 | 10 ± 4 | 20 ± 7 |
| LBRT | −2 ± 11 | 10 ± 9 | 9 ± 8 | |
| WBRT | 1 ± 3 | 9 ± 4 | 3 ± 5 |
Values are means ± s.e.m. The subjects were sedentary (SED), lower body resistive trained (LBRT) and whole body resistive trained (WBRT) older people. *Change over time, P < 0.01. † Nitrogen balance, equal to dietary nitrogen intake minus (urine + faeces + miscellaneous nitrogen excretions). Miscellaneous nitrogen excretion was assumed to be 8 mg N kg−1 day−1 for each subject.
Figure 1.
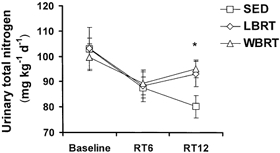
Urinary total nitrogen excretion in older people who were either sedentary (SED), or who completed a 12 week resistive training programme exercising lower body (LBRT) or whole body (WBRT) muscle groups
All groups were sedentary at baseline and the resistive training programme was conducted from study weeks RT1-RT12. * Different in SED group, compared with LBRT and WBRT groups, at week RT12 (P < 0.05, one-way ANOVA for group effect).
There were no differences among the SED, LBRT and WBRT groups for any of the leucine kinetics parameters at baseline or in the responses over time from baseline to week RT12 (Table 4). For all subjects together, leucine turnover (P < 0.0001), oxidation (P < 0.0001), synthesis (P = 0.049) and balance (P < 0.0001) were higher, and breakdown (P = 0.003) was lower, in the postprandial state versus the postabsorptive state. Leucine oxidation was lower (P = 0.017), and leucine balance (P = 0.005) and net leucine balance (P = 0.008) were greater, at week RT12, compared with baseline, for all subjects combined.
Table 4.
Whole body leucine kinetics (μmol leucine kg−1 min−1) of the subjects in the sedentary, lower body resistive training and whole body resistive training groups
| Parameter | Repletion state | Group | Baseline | Week RT12 | Change |
|---|---|---|---|---|---|
| Turnover* | Fasting | SED | 113 ± 3 | 109 ± 3 | −5 ± 2 |
| LBRT | 107 ± 5 | 105 ± 7 | −2 ± 3 | ||
| WBRT | 95 ± 9 | 97 ± 8 | 2 ± 4 | ||
| Fed | SED | 130 ± 4 | 129 ± 4 | −1 ± 4 | |
| LBRT | 128 ± 3 | 137 ± 6 | 9 ± 4 | ||
| WBRT | 134 ± 9 | 134 ± 7 | 0 ± 5 | ||
| Oxidation*† | Fasting | SED | 22 ± 1 | 20 ± 2 | −2 ± 2 |
| LBRT | 20 ± 1 | 18 ± 1 | −2 ± 2 | ||
| WBRT | 17 ± 2 | 16 ± 1 | −1 ± 2 | ||
| Fed | SED | 38 ± 1 | 35 ± 1 | −3 ± 2 | |
| LBRT | 39 ± 3 | 36 ± 2 | −3 ± 3 | ||
| WBRT | 40 ± 3 | 37 ± 2 | −3 ± 2 | ||
| Synthesis* | Fasting | SED | 90 ± 3 | 88 ± 3 | −2 ± 2 |
| LBRT | 87 ± 5 | 87 ± 6 | 0 ± 3 | ||
| WBRT | 78 ± 8 | 81 ± 7 | 3 ± 4 | ||
| Fed | SED | 93 ± 5 | 94 ± 4 | 1 ± 4 | |
| LBRT | 89 ± 3 | 101 ± 6 | 11 ± 4 | ||
| WBRT | 93 ± 7 | 97 ± 6 | 4 ± 6 | ||
| Breakdown* | Fasting | SED | 106 ± 3 | 102 ± 3 | −4 ± 2 |
| LBRT | 100 ± 5 | 97 ± 6 | −3 ± 3 | ||
| WBRT | 88 ± 9 | 90 ± 8 | 2 ± 4 | ||
| Fed | SED | 81 ± 4 | 80 ± 4 | −1 ± 4 | |
| LBRT | 78 ± 3 | 86 ± 5 | 8 ± 4 | ||
| WBRT | 81 ± 9 | 81 ± 6 | 0 ± 6 | ||
| Balance*† | Fasting | SED | −15 ± 1 | −13 ± 2 | 2 ± 2 |
| LBRT | −13 ± 1 | −10 ± 1 | 3 ± 1 | ||
| WBRT | −10 ± 2 | −9 ± 1 | 1 ± 1 | ||
| Fed | SED | 12 ± 2 | 14 ± 1 | 2 ± 2 | |
| LBRT | 12 ± 3 | 15 ± 3 | 3 ± 3 | ||
| WBRT | 13 ± 2 | 16 ± 2 | 3 ± 2 | ||
| Net† | SED | −3 ± 2 | 1 ± 2 | 4 ± 3 | |
| LBRT | −2 ± 3 | 5 ± 3 | 7 ± 3 | ||
| WBRT | 3 ± 3 | 7 ± 3 | 4 ± 4 |
Values are means ± s.e.m. The subjects were sedentary (SED), lower body resistive trained (LBRT) and whole body resistive trained (WBRT) older people. *Fed state different from fasting state (i.e. a main effect of metabolic state), P < 0.05. † Week RT12 different from baseline for all subjects (i.e. a main effect of time), P < 0.05.
DISCUSSION
The first aim of this study was to assess the longer-term adequacy of the RDA for protein to maintain body composition, muscle size and protein metabolism in older people. Thus, dietary protein intake was strictly controlled at the current RDA of 0.8 g protein kg−1 day−1 throughout this study. The adequacy of this amount of protein intake to completely meet the dietary needs of older people has been questioned (Campbell et al. 1994a; Campbell & Evans, 1996), based mainly on results from two- to three-week nitrogen balance experiments. Castaneda et al. (1995a) documented that weight-stable elderly women who consumed inadequate protein (0.45 g protein kg−1 day−1, 56 % of the RDA) for 10 weeks experienced declines in lean body mass (from hydrostatic weighing and dual energy X-ray absorptiometry), whole body muscle mass (from 24 h urinary creatinine excretion) and body cell mass (from total body potassium). Castaneda et al. (1995b) also reported that postprandial state whole body leucine oxidation decreased progressively over time in these women, and the authors suggested that this shift might provide one mechanism for humans to adapt their metabolism to conserve protein mass during a period of inadequate dietary protein intake.
For the present study, most of the outcomes were consistent with a successful adaptation. The positive shifts in nitrogen balance and net leucine balance from near equilibrium to somewhat positive from baseline to week RT12, coupled with the apparent maintenance of whole body muscle mass, whole body protein and mineral mass, resting metabolic rate, and upper body and lower body strength in the SED group, are consistent with adaptation. The decrease over time in leucine oxidation is consistent with a shift in protein metabolism to conserve whole body protein mass (Castaneda et al. 1995a). In contrast, the decrease in fat-free mass (possibly due to a change in whole body hydration) observed in all subjects and the decrease in mid-thigh muscle area observed in the SED group (Table 1; Campbell et al. 2001), are consistent with accommodation. Collectively, the majority of these data indicate that the RDA for protein is adequate for older people; however, it is prudent to continue to question if this protein intake might be marginally inadequate and result in longer-term accommodation in skeletal muscle. Future research in older humans using longer-term protein and energy balance experiments with multiple protein intakes spanning the range of adequacy is required to evaluate this important issue further.
The second aim of this study was to determine in older people if the number of muscle groups trained (i.e. lower body versus whole body resistive training) influenced the degree of resistive training-induced muscle hypertrophy. Based on previous observations in our laboratory (Frontera et al. 1988; Fiatarone et al. 1990, 1994; Campbell et al. 1994b, 1995), we hypothesized that the extent of hypertrophy of the mid-thigh muscles would be greater if only these muscles were trained (LBRT group), compared with training these muscles at the same frequency, intensity and duration, along with other muscles (WBRT group). The increase in mid-thigh muscle area for the LBRT and WBRT groups, compared with the SED group, indicates that the resistive training programme effectively caused muscle hypertrophy (albeit modestly). However, contrary to expectation, the lack of difference in response for the LBRT and WBRT groups indicates that the total number of muscle groups involved in training did not affect the extent of muscle hypertrophy. We are unaware of published research that addressed this issue previously.
The cross-sectional muscle area of the mid-arm was also measured, with the hypothesis that the responses over time would be different in the WBRT group (increased muscle area consistent with hypertrophy), compared with the LBRT and SED groups. These data showing that mid-arm muscle area did not significantly change in any of the groups should be viewed cautiously. The computed tomography scans of the mid-arm were taken with the subjects laying on their backs, arms stretched overhead and wrists secured together with tape. This position was somewhat uncomfortable and difficult to maintain for several of the subjects. Some of the images were not focused clearly, a factor that probably contributed to increased variability in the results.
The significant decrease over time in urinary nitrogen excretion is consistent with past observations from our laboratory (Campbell et al. 1995). Older men and women were provided strictly controlled euenergetic diets containing either the RDA or twice the RDA for protein for 2 weeks before and throughout a 12 week whole body resistive training programme. Before the resistive training programme was started, mean nitrogen balance was negative in the RDA group and positive in the 2 × RDA group. Urinary nitrogen excretion decreased and apparent nitrogen retention increased with the onset of resistive training. These responses were not quantitatively different in the RDA and 2 × RDA groups. Thus, the efficiency of nitrogen retention and amino acid utilization was higher in the RDA group. Previously, we interpreted the shift in urinary nitrogen excretion to reflect a resistive training-induced conservation of body nitrogen favouring protein synthesis and anabolism, and to be consistent with a decrease in dietary protein needs (Campbell et al. 1995). That study lacked a sedentary control group and the results from the present study suggest that the decrease in urinary nitrogen excretion attributed to resistive training might also reflect a prolonged metabolic response to altered protein intake. This interpretation is plausible because the SED group in the present study also decreased urinary nitrogen excretion over time. For the SED group, the decrease over time in urinary nitrogen excretion, coupled with the decrease in mid-thigh muscle area, is consistent with metabolic and physiological accommodations, i.e. a survival response to inadequate protein intake (Waterlow, 1990; Young & Marchini, 1990).
While the overall response was for urinary nitrogen excretion to decrease over time, at week RT12, the urinary excretion of nitrogen was greater in the LBRT and WBRT groups, compared with the SED group (Fig. 1). There was no difference in urinary nitrogen excretion at week RT12 between the LBRT and WBRT groups. Given the considerable length of dietary control, these week RT12 data may provide an important insight into the effect of resistive training on nitrogen excretion and balance. These data indicate that after a prolonged period of adjustment to a precisely controlled dietary protein intake, urinary nitrogen excretion is higher in older people who train using resistive exercises, compared with sedentary people. This observation may indicate that resistive training by older people increases the need for dietary protein, a conclusion reached by several researchers based on studies in young men (Tarnopolsky et al. 1988; Lemon et al. 1992). However, it is important to note that the increase in urinary nitrogen excretion with resistive training was modest and did not result in a significant difference in nitrogen balance among the three groups. It would be inappropriate to recommend protein supplementation of older people who participate in resistive training based on these data.
One could view the decision to feed all of the subjects the RDA for protein, and the fact that the subjects lost fat-free mass, as a limitation of the study with regard to assessing the potential differential muscle hypertrophy responses of the LBRT versus WBRT groups. The marginal protein intake could possibly limit amino acid availability and blunt a maximal resistive training-induced muscle hypertrophy response. The lack of differential body composition and muscle size responses to resistive training in older people who consumed either the RDA or twice the RDA for protein (Campbell et al. 1995), does not support this possibility. The present study is the longest-term strictly controlled diet study where older people consumed the RDA for protein ever completed. While most of the results from this study suggest that the RDA for protein is adequate, the finding that these people lost fat-free mass and the SED group lost mid-thigh muscle area warrants further investigation. The RDA for protein should be sufficient for older people to maintain fat-free mass and muscle mass. Future studies with subjects who consume higher protein intakes would be necessary to support the present findings that the hypertrophy response to resistive training is not influenced by the number of muscle groups trained.
For the present study it was necessary to increase energy intake from baseline to week RT12 to maintain stable body weight. The need to increase energy intake highlights the inherent uncertainty and difficulty of accurately estimating an individual's energy needs. The achievement of body weight stability within less than 1 % of each person's baseline body weight demonstrates the success of the strict dietary control during the study. It is known that nitrogen balance is influenced by changes in energy intake over a wide range below or above energy needs (Pellett & Young, 1991), although it is less clear if this energy intake-nitrogen balance relationship is demonstrable over a more limited range of energy intakes near the energy requirement of older people (Campbell et al. 1995). The positive shifts in nitrogen balance and net leucine balance from baseline to week RT12, independent of group assignment, could be due, in part, to increased energy intake.
The apparent increase in whole body fat in these weight-stable subjects suggests that energy intake was not limiting. Indeed, the achievement of stable body weight during a period of time when fat-free mass was decreased is consistent with a slightly hyperenegetic state and fat deposition. The increased body fat was not apparently due to decreases in either resting energy expenditure or the energy expenditure of physical activity.
Another potential limitation of this study was the inclusion of both men and women in the study groups. Indeed, subsequent to the initiation of data collection for this study, gender-specific differences in body composition and skeletal muscle size and function in response to resistive training were documented (Joseph et al. 1999; Jozsi et al. 1999; Tracy et al. 1999), and could factor in the variable muscle responses to lower body and whole body resistive training (Frontera et al. 1988; Fiatarone et al. 1990, 1994; Campbell et al. 1994b). Future studies with adequate statistical power to assess gender-related responses to the dietary protein and resistive training are necessary.
The relatively short (12 week) resistive training period may be viewed as another limitation of this study. It is recognized that improved neuromuscular function accounts for the majority of muscle strength gains with the initiation of resistive training, compared with muscle hypertrophy (Komi, 1986). The 12-week period of resistive training was sufficiently long to result in muscle hypertrophy in the LBRT and WBRT groups. While unmeasured, perhaps this muscle hypertrophy occurred mainly towards the end of the training period. If so, this could help explain why the apparent difference in urinary nitrogen excretion of the SED group versus the LBRT and WBRT groups was shown at week RT12, but not at week RT6 (Fig. 1).
In conclusion, the RDAs are defined as ‘the levels of intake of essential nutrients that, on the basis of scientific knowledge, are judged … to be adequate to meet the known nutrient needs of practically all healthy persons’ (National Research Council, 1989). The results of this study show that resistive training-induced increases in muscle strength and muscle hypertrophy can occur in older people who consume the RDA for protein and that the number of muscle groups trained does not influence the hypertrophy response. The apparent ability of older people to successfully adapt their protein metabolism and to preserve their whole body protein-mineral mass, resting energy expenditure and muscle strength during this 14 week controlled diet period suggests that the RDA of 0.8 g protein kg−1 day−1 is adequate for this segment of the population. However, the loss of fat-free mass, possibly related to a decline in whole body hydration status, and the decrease in mid-thigh muscle area in the SED group may represent an undesired accommodation, and research should continue to evaluate the adequacy of the RDA for protein in older people.
Acknowledgments
We would like to thank the staff members of the GCRC nursing and metabolic kitchen for providing expert support for this study. We especially thank Deanna Cyr-Campbell, MS, RD for developing the menus and co-ordinating the production and distribution of the meals. We also thank Arny Ferrando, PhD, for providing expert assistance with the stable isotope analyses. We are grateful to the volunteers in this study for their co-operation and dedication. This work was supported by NIH RO1 AG11811, NIH 1 R29 AG13409 and General Clinical Research Center Grant MO1 RR10732.
REFERENCES
- Akers R, Buskirk ER. An underwater weighing system utilizing force cube transducers. Journal of Applied Physiology. 1969;26:649–652. doi: 10.1152/jappl.1969.26.5.649. [DOI] [PubMed] [Google Scholar]
- Bousnes RW, Taussky HH. On the colorimetric determination of creatinine by the Jaffe reaction. Journal of Biological Chemistry. 1945;158:581–591. [Google Scholar]
- Bunker VW, Lawson MS, Stanfield MF, Clayton BE. Nitrogen balance studies in apparently healthy elderly people and those who are housebound. British Journal of Nutrition. 1987;57:211–221. doi: 10.1079/bjn19870027. [DOI] [PubMed] [Google Scholar]
- Campbell WW, Crim MC, Dallal GE, Young VR, Evans WJ. Increased protein requirements in elderly people: new data and retrospective reassessments. American Journal of Clinical Nutrition. 1994a;60:501–509. doi: 10.1093/ajcn/60.4.501. [DOI] [PubMed] [Google Scholar]
- Campbell WW, Crim MC, Young VR, Evans WJ. Increased energy requirements and body composition changes with resistance training in older adults. American Journal of Clinical Nutrition. 1994b;60:167–175. doi: 10.1093/ajcn/60.2.167. [DOI] [PubMed] [Google Scholar]
- Campbell WW, Crim MC, Young VR, Joseph LJ, Evans WJ. Effects of resistance training and dietary protein intake on protein metabolism in older adults. American Journal of Physiology. 1995;268:E1143–1153. doi: 10.1152/ajpendo.1995.268.6.E1143. [DOI] [PubMed] [Google Scholar]
- Campbell WW, Cyr-Campbell D, Weaver JA, Evans WJ. Energy requirement for long-term body weight maintenance in older women. Metabolism. 1997;46:884–889. doi: 10.1016/s0026-0495(97)90074-3. [DOI] [PubMed] [Google Scholar]
- Campbell WW, Evans WJ. Protein requirements of elderly people. European Journal of Clinical Nutrition. 1996;50(suppl. 1):S180–185. [PubMed] [Google Scholar]
- Campbell WW, Trappe TA, Wolfe RR, Evans WJ. The Recommended Dietary Allowance for protein may not be adequate for older people to maintain skeletal muscle. Journal of Gerontology: Biological Sciences and Medical Sciences. 2001;56:M373–380. doi: 10.1093/gerona/56.6.m373. [DOI] [PubMed] [Google Scholar]
- Castaneda C, Charnley JM, Evans WJ, Crim MC. Elderly women accommodate to a low-protein diet with losses of body cell mass, muscle function, and immune response. American Journal of Clinical Nutrition. 1995a;62:30–39. doi: 10.1093/ajcn/62.1.30. [DOI] [PubMed] [Google Scholar]
- Castaneda C, Dolnikowski GG, Dallal GE, Evans WJ, Crim M. Protein turnover and energy metabolism of elderly women fed a low-protein diet. American Journal of Clinical Nutrition. 1995b;62:40–48. doi: 10.1093/ajcn/62.1.40. [DOI] [PubMed] [Google Scholar]
- Cheng A, Gomez A, Bergan J, Tung-Ching L, Monckeberg F, Chichester C. Comparative nitrogen balance study between young and aged adults using three levels of protein intake from a combination wheat-soy-milk mixture. American Journal of Clinical Nutrition. 1978;31:12–22. doi: 10.1093/ajcn/31.1.12. [DOI] [PubMed] [Google Scholar]
- DiPietro L, Caspesen CJ, Ostfeld AM, Nadel ER. A survey for assessing physical activity among older adults. Medicine and Science in Sports and Exercise. 1993;25:628–642. [PubMed] [Google Scholar]
- FAO/WHO/UNU. Energy and Protein Requirements. Geneva: 1985. World Health Organization. [Google Scholar]
- Fiatarone MA, Marks EC, Ryan ND, Meredith CN, Lipsitz LA, Evans WJ. High-intensity strength training in nonagenarians. Effects on skeletal muscle. Journal of the American Medical Association. 1990;263:3029–3034. [PubMed] [Google Scholar]
- Fiatarone MA, O'Neill EF, Ryan ND, Clements KM, Solares GR, Nelson ME, Roberts SB, Kehayias JJ, Lipsitz LA, Evans WJ. Exercise training and nutritional supplementation for physical frailty in very elderly people. New England Journal of Medicine. 1994;330:1769–1775. doi: 10.1056/NEJM199406233302501. [DOI] [PubMed] [Google Scholar]
- Frontera WR, Meredith CN, O'Reilly KP, Knuttgen HG, Evans WJ. Strength conditioning in older men: skeletal muscle hypertrophy and improved function. Journal of Applied Physiology. 1988;64:1038–1044. doi: 10.1152/jappl.1988.64.3.1038. [DOI] [PubMed] [Google Scholar]
- Gersovitz M, Munro H, Scrimshaw N, Young V. Human protein requirements: assessment of the adequacy of the current recommended dietary allowance for dietary protein in elderly men and women. American Journal of Clinical Nutrition. 1982;35:6–14. doi: 10.1093/ajcn/35.1.6. [DOI] [PubMed] [Google Scholar]
- Gibson NR, Fereday A, Cox M, Halliday D, Pacy PJ, Millward DJ. Influences of dietary energy and protein on leucine kinetics during feeding in healthy adults. American Journal of Physiology. 1996;270:E282–291. doi: 10.1152/ajpendo.1996.270.2.E282. [DOI] [PubMed] [Google Scholar]
- Harris JA, Benedict FG. A Biometric Study of Basal Metabolism in Man. Washington, DC: Carnegie Institute of Washington; 1919. Publication No. 279. [Google Scholar]
- Heymsfield S, Ateaga C, McManus C, Smith J, Moffitt S. Measurement of muscle mass in humans: validity of the 24-hour urinary creatinine method. American Journal of Clinical Nutrition. 1983;37:478–494. doi: 10.1093/ajcn/37.3.478. [DOI] [PubMed] [Google Scholar]
- Hoerr RA, Yu YM, Wagner DA, Burke JF, Young VR. Recovery of 13C in breath from NaH13CO3 infused by gut and vein: effect of feeding. American Journal of Physiology. 1989;257:E426–438. doi: 10.1152/ajpendo.1989.257.3.E426. [DOI] [PubMed] [Google Scholar]
- Joseph LJO, Davey SL, Evans WJ, Campbell WW. Differential effect of resistance training on the body composition and lipoprotein-lipid profile of older men and women. Metabolism. 1999;48:1474–1480. doi: 10.1016/s0026-0495(99)90162-2. [DOI] [PubMed] [Google Scholar]
- Jozsi AC, Campbell WW, Joseph LJO, Davey SL, Evans WJ. Changes in power with resistance training in older and younger men and women. Journal of Gerontology: Medical Sciences. 1999;54:M591–596. doi: 10.1093/gerona/54.11.m591. [DOI] [PubMed] [Google Scholar]
- Komi P. Training of muscle strength and power: interaction of neuromotoric, hypertrophic, and mechanical factors. International Journal of Sports Medicine. 1986;7:10–15. doi: 10.1055/s-2008-1025796. [DOI] [PubMed] [Google Scholar]
- Lemon PW, Tarnopolsky MA, MacDougall JD, Atkinson SA. Protein requirements and muscle mass/strength changes during intensive training in novice bodybuilders. Journal of Applied Physiology. 1992;73:767–775. doi: 10.1152/jappl.1992.73.2.767. [DOI] [PubMed] [Google Scholar]
- Matthews D, Schwarz H, Yang R, Motil K, Young V, Bier D. Relationship of plasma leucine and α-ketoisocaproate during a l-[1-13C]leucine infusion in man: a method for measuring human intracellular leucine tracer enrichment. Metabolism. 1982;31:1105–1112. doi: 10.1016/0026-0495(82)90160-3. [DOI] [PubMed] [Google Scholar]
- Matthews DE, Motil KJ, Rohrbaugh DK, Burke JF, Young VR, Bier DM. Measurement of leucine metabolism in man from a primed, continuous infusion of l-[1-13C]leucine. American Journal of Physiology. 1980;238:E473–479. doi: 10.1152/ajpendo.1980.238.5.E473. [DOI] [PubMed] [Google Scholar]
- Millward DJ, Fereday A, Gibson N, Pacy PJ. Aging, protein requirements, and protein turnover. American Journal of Clinical Nutrition. 1997;66:774–786. doi: 10.1093/ajcn/66.4.774. [DOI] [PubMed] [Google Scholar]
- Millward DJ, Roberts SB. Protein requirements of older individuals. Nutrition Research Reviews. 1996;9:67–87. doi: 10.1079/NRR19960006. [DOI] [PubMed] [Google Scholar]
- Morse MH, Haub MD, Evans WJ, Campbell WW. Protein requirement of elderly women: nitrogen balance responses to three levels of protein intake. Journal of Gerontology: Medical Sciences. 2001;56:M724–730. doi: 10.1093/gerona/56.11.m724. [DOI] [PMC free article] [PubMed] [Google Scholar]
- National Research Council. Recommended Dietary Allowances. Washington, DC: National Academy Press; 1989. [Google Scholar]
- Pacy JP, Price GM, Halliday D, Quevedo MR, Millward DJ. Nitrogen homeostasis in man: the diurnal responses of protein synthesis and degradation and amino acid oxidation to diets with increasing protein intakes. Clinical Science. 1994;86:103–118. doi: 10.1042/cs0860103. [DOI] [PubMed] [Google Scholar]
- Pellett PL, Young VR. Protein-Energy Interactions, I/D/E/C/G. NH, USA: Waterville Valley; 1991. The Effects of Different Levels of Energy Intake on Protein Metabolism and of Different Levels of Protein Intake on Energy Metabolism: A Statistical Evaluation from the Published Literature. [Google Scholar]
- Siri WE. Techniques for Measuring Body Composition. Washington, DC: National Academy of Sciences; 1961. Body Composition from Fluid Spaces and Density: Analysis of Methods; pp. 223–244. [Google Scholar]
- Tarnopolsky MA, MacDougall JD, Atkinson SA. Influence of protein intake and training status on nitrogen balance and lean body mass. Journal of Applied Physiology. 1988;64:187–193. doi: 10.1152/jappl.1988.64.1.187. [DOI] [PubMed] [Google Scholar]
- Tracy BL, Ivey FM, Hurlbut D, Martel GF, Lemmer JT, Siegel EL, Metter EJ, Fozard JL, Fleg JL, Hurley BF. Muscle quality. II. Effects of strength training in 65- to 75-yr-old men and women. Journal of Applied Physiology. 1999;86:195–201. doi: 10.1152/jappl.1999.86.1.195. [DOI] [PubMed] [Google Scholar]
- Uauy R, Scrimshaw N, Young V. Human protein requirements: nitrogen balance response to graded levels of egg protein in elderly men and women. American Journal of Clinical Nutrition. 1978;31:779–785. doi: 10.1093/ajcn/31.5.779. [DOI] [PubMed] [Google Scholar]
- Waterlow JC. Protein turnover with special reference to man. Quarterly Journal of Experimental Physiology. 1984;69:405–438. doi: 10.1113/expphysiol.1984.sp002829. [DOI] [PubMed] [Google Scholar]
- Waterlow JC. Nutritional adaptation in man: general introduction and concepts. American Journal of Clinical Nutrition. 1990;51:259–263. doi: 10.1093/ajcn/51.2.259. [DOI] [PubMed] [Google Scholar]
- Welle S, Thornton C, Totterman S, Forbes G. Utility of creatinine excretion in body-composition studies of healthy men and women older than 60 y. American Journal of Clinical Nutrition. 1996;63:151–156. doi: 10.1093/ajcn/63.2.151. [DOI] [PubMed] [Google Scholar]
- Wilmore JH. A simplified method for determination of residual lung volumes. Journal of Applied Physiology. 1969;27:96–100. doi: 10.1152/jappl.1969.27.1.96. [DOI] [PubMed] [Google Scholar]
- Wolfe RR. Radioactive and Stable Isotope Tracers in Biomedicine: Principles and Practice of Kinetic Analysis. New York: Wiley-Liss Inc.; 1992. [Google Scholar]
- Young VR. Kinetics of human amino acid metabolism: nutritional implications and some lessons. American Journal of Clinical Nutrition. 1987;46:709–725. doi: 10.1093/ajcn/46.5.709. [DOI] [PubMed] [Google Scholar]
- Young VR, Marchini JS. Mechanisms and nutritional significance of metabolic responses to altered intakes of protein and amino acids, with reference to nutritional adaptation in humans. American Journal of Clinical Nutrition. 1990;51:270–289. doi: 10.1093/ajcn/51.2.270. [DOI] [PubMed] [Google Scholar]
- Zanni E, Calloway D, Zezulka A. Protein requirements of elderly men. Journal of Nutrition. 1979;109:513–524. doi: 10.1093/jn/109.3.513. [DOI] [PubMed] [Google Scholar]