

Abstract
Skeletal muscles of the mdx mouse lack dystrophin offering the possibility to study the role of intracellular Ca2+ ions in fibre degeneration. Flexor digitorum brevis muscles of 3-month-old mdx and normal mice were dissociated with collagenase; fibres were maintained in culture for 6 days (d0 to d5) and their survival was assessed. Cytosolic [Ca2+], passive Mn2+ influx (indicative of Ca2+ influx) and activity of mechanosensitive/voltage-independent Ca2+ channels were studied over the same period. Survival of normal fibres declined steadily from d0 to d3, but an acceleration of fibre death occurred in mdx fibres from d1 to d2. This could be greatly reduced but not abolished by lowering external [Ca2+] 10-fold. In the d0-d5 period, both mdx and normal fibres showed transient increases of Mn2+ influx and activity of the Ca2+ channels; these peaked at d1 and disappeared by d3–d4. Increases were always significantly larger in mdx fibres. Altogether, over the 6 days, 130 paired measurements of [Ca2+]i and Mn2+ influx were made on 68 fibres from mdx and 62 fibres from normal mice. In 90 % of the fibres, [Ca2+]i remained within the 25–85 nm limits while Mn2+ influx varied more than 10-fold. The median for Mn2+ influx was 45 % greater in fibres from mdx mice than in fibres from control C57 mice. However, there was no significant difference between [Ca2+]i medians in fibres from normal and mdx mice. Addition of 25–75 nm of a Ca2+ ionophore (4-bromo-A23187) to the medium did not affect the level of cytosolic [Ca2+] in both types of fibres, while markedly increasing the rate of Mn2+ influx, as expected. Thus, Ca2+ homeostasis was equally robust in mdx and normal fibres. The remaining 10 % of the fibres showed, at d1, high levels of Mn2+ influx and/or elevated [Ca2+]i above 100 nm. This did not affect survival of normal fibres but was probably responsible of the increased death rate in mdx fibres.
Skeletal muscles of the mdx mouse lack dystrophin as a result of a mutation of the dystrophin gene producing an early stop codon (Sicinski et al. 1989). Genetically, the mdx mouse is thus an animal model of Duchenne muscular dystrophy (DMD). However, the clinical phenotype is much milder than for human patients. Adult mdx mice seem little affected for the major part of their life, after the first wave of massive and largely synchronous fibre degeneration, which occurs at 3 weeks of age and is followed by active regeneration. Nonetheless, some distinct cycles of muscle degeneration and regeneration continue to occur. Histology reveals discrete foci of degeneration with the presence of inflammatory cells. A large percentage of fibres become centronucleated and fibre diameters become variable. Serum creatine kinase remains chronically elevated (5-10 times normal values). Thus muscles of the adult mouse (3-12 months) appear to be composed of fibres at different steps of the regeneration or the degeneration processes.
The sequence of events leading to fibre degeneration in dystrophin-deficient muscle is still poorly understood. Loss of the intracellular Ca2+ homeostasis has been proposed as an early process initiating activation of Ca2+-dependent proteases (Turner et al. 1991, 1993). For technical reasons, a detailed study of intracellular Ca2+ handling is difficult to perform on whole muscle and requires a single fibre preparation. Measurements of Ca2+ influx on single fibres have revealed a 2-fold increase in passive Ca2+ entry into mdx fibres (Tutdibi et al. 1999), possibly through mechanosensitive/voltage-insensitive Ca2+ channels which show a higher activity in mdx fibres (Franco-Obregón & Lansman, 1994). However, the consequence of this increased influx on the cytosolic concentration of free Ca2+ ([Ca2+]i) in adult, differentiated fibres is a matter of controversy. [Ca2+]i was reported to be doubled in mdx fibres isolated by manual microdissection (Turner et al. 1991, 1993), while no, or only very marginal increases (≈10 %), were observed by several other groups working on single fibres isolated by enzymatic dissociation of the muscle with collagenase (Gailly et al. 1993; Head, 1993; Pressmar et al. 1994; Collet et al. 1999). Possibly the basis of the discrepancy may lie in the method used to obtain isolated fibres (Gillis, 1999).
One of the advantages of the collagenase method is that a large number of dissociated fibres can be obtained from the same muscle, yielding a sample that is probably representative of the fibre population in vivo (see Discussion). They can be maintained in culture for several days with preservation of structure and function (excitability and contractility) (Liu et al. 1997). This offers the opportunity to examine how a population of dystrophin-deficient fibres maintains or loses its [Ca2+]i homeostasis over several days of observation. We monitored over 6 days (d0 to d5) the progression of the passive Ca2+ influx and of the corresponding values of cytosolic [Ca2+], together with the properties of the mechanosensitive/voltage-independent Ca2+ channels. These results were correlated with the time course of fibre survival over the same period of observation. In addition, the resilience of Ca2+ homeostasis was challenged by the use of Ca2+ ionophores, which greatly increase the inward Ca2+ flux.
For about 90 % of the fibres studied, both normal and mdx, the ability of the homeostasis mechanisms to cope with significant changes of Ca2+ influx was such that the bulk cytosolic [Ca2+] remained unaffected. However, we observed that a small fraction of the fibres (about 10 % in each group) showed, after 1 day in culture, very high increases of the Mn2+ influx and/or increase of [Ca2+]i above 100 nm. This situation did not affect survival in normal fibres but was probably responsible for the increased death rate in mdx fibres. Ca2+ homeostasis seemed compromised in only a small fraction of the mdx fibres and this could be revealed by culture conditions.
Methods
Fibre isolation
Young adult (75- to 90-day-old) mdx and C57 black mice were killed by cervical dislocation, a procedure approved by the local animal ethics committee. The flexor digitorum brevis (FDB) muscle was dissected out and placed in an oxygenated Krebs solution (mm: NaCl 135; KCl 5.9; MgCl2 1.2; CaCl2 1.5; Hepes 11.5, glucose 11.5) containing 0.2 % type IV collagenase (Sigma C-5138), for 45 min, at 37 °C. After two washes, the muscle was gently dissociated by several passages through a series of Pasteur pipettes of progressively decreasing diameter. Isolated fibres were plated on circular glass coverslips, covered with the Extracellular Matrix Basement Membrane (Harbor Bio-Products, Norwood, MA, USA) which produced fibre attachment within 2 h. Coverslips were kept in small Petri dishes filled with Dulbecco's modified Eagle's medium (Sigma DMEM/HAM F12), supplemented with fetal bovine serum 2 % and penicillin/streptomycin at the final concentrations of 100 i.u. and 0.1 mg ml−1 respectively; culture dishes were kept in an incubator, with 5 % CO2, at 30 °C. This medium is widely used for cultures of muscle cells. Its nominal [Ca2+] is 0.8 mm, i.e. only 60 % of the usual 1.5 mm [Ca2+] of the Krebs solution. This reduction of external [Ca2+] was adopted to avoid calcium precipitates which tend to occur in long-term unstirred medium buffered with CO2/bicarbonate (the latter buffer was retained because of its excellent ability to buffer the intracellular pH, a critical parameter in successful long-term cell culture). Measurement of cytosolic [Ca2+], of Mn2+ influx and of Ca2+ channel activity were made in non-sterile conditions, after replacement of the culture medium by a Krebs solution containing 1.5 mm Ca2+. Fibre survival (see below) was studied in preparations maintained continuously in culture medium, to avoid fibre detachment upon medium exchange (which would have made fibre counts meaningless).
Measurements of cytosolic [Ca2+]
The culture medium was replaced with a Krebs solution containing the membrane-permeant Ca2+ indicator Fura-PE3/AM (Calbiochem) 1 μM (from a stock solution of 5 mm in DMSO, for 1 h at room temperature) to which Pluronic F-127 was added at the final concentration of 0.004 %. Fura-PE3/AM was preferred over Fura-2/AM as it is stable during long lasting experiments, with little or no compartmentation (Hopf et al. 1996). Fibres were studied through an inverted Nikon microscope, with a 40 × magnification objective. A 40 μm segment of the fibre was illuminated over its entire width (25 μm), through a fixed rectangular aperture. Before measurements of [Ca2+]i, the preparation was rinsed for 15 min with Krebs solution. Fluorescence was excited alternatively (2 Hz) at 340 and 360 nm, recorded at 510 nm and the ratio R340/360 of the fluorescence intensity emitted at the two excitation wavelengths was determined. As in situ determination of the calibration parameters Rmin and Rmax for each fibre studied (n = 132) would have been extremely time-consuming, we calculated cytosolic [Ca2+] from calibration parameters obtained in a cuvette with a Fura-PE3 free acid solution, using the formula of Grynkiewicz et al. (1985), with the following calibration values: Rmin 0.374; Rmax 1.23; Kd 204 nm; β 1 (at 360 nm) and application of a correction factor (0.66) for cytosol viscosity and ionic strength (Hopf et al. 1996). In the case of Fura-2/AM, we reported previously (Gailly et al. 1993) that the calibration parameters Rmin and Rmax were 10 % different in mdx and C57 fibres. However as the fluorescence ratio R in the resting state is usually very close to Rmin, a small change of Rmin would greatly affect the calculated values of [Ca2+]i, while the same relative change of Rmax would have a much smaller effect. To see if the in situ behaviour of Fura-PE3 was different in normal and mdx fibres, we determined Rmin(340/360) by incubating the fibres in a Ca2+-free Krebs solution containing 50 μM EGTA and 50 μM of EGTA-AM, a diffusible form of the chelator. We obtained 0.325 ± 0.003 (s.e.m., n = 16) and 0.325 ± 0.001 (s.e.m., n = 16) for mdx and C57 fibres respectively. Thus the difference of Rmin reported when using Fura-2/AM was no longer observed with Fura-PE3/AM, suggesting that this difference resulted from some difference of compartmentation of the former dye. In situ determination of Rmax is usually obtained by application of ionomycin, which produces a saturating elevation of [Ca2+]i; in muscle fibres, this frequently produces a strong contraction, making further optical measurements impossible. We thus assumed that Rmax was identical in normal and mdx fibres. Even if it was 10 % different, as with Fura-2/AM, this would have introduced a change in [Ca2+]i calculation of about 10 nm, which is much less than the variation of [Ca2+]i from fibre to fibre (see Fig. 2). Measurements of cytosolic [Ca2+] were always performed in normal Krebs solution, before measurements of the Mn2+ influx. All fibres where [Ca2+]i and Mn2+ influx were measured presented a regular striation pattern and the elongated shape characteristic of the relaxed state. Both measurements followed each other in a close sequence (60-100 s interval) as explained below.
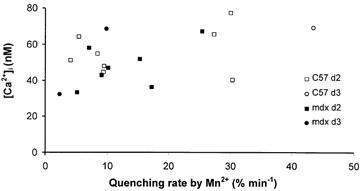
Figure 2. Correlation between the Mn2+ quenching rate and the cytosolic [Ca2+] in normal and mdx fibres.
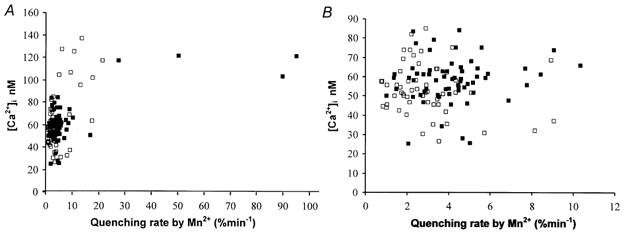
A, individual correlation between the Mn2+ quenching rate and the cytosolic [Ca2+] for 130 paired measurements (62 normal fibres, 68 mdx fibres, from data plotted in Fig. 1). B, expanded view of the cluster of 116 individual paired measurements at the far left of Fig. 2A (53 normal fibres, 63 mdx fibres). □, normal fibres; ▪, mdx fibres.
Measurements of Mn2+ influx
Passive Ca2+ influx was estimated by measuring the passive influx of Mn2+ ions used as a replacement for Ca2+ ions. Influx of Mn2+ into fibres loaded with Fura-PE3, quenches the fluorescence of the dye and the quenching rate reflects the influx rate (Merritt et al. 1989). To avoid any interference of Ca2+, Fura-PE3 fluorescence was excited at 360 nm where the dye is insensitive to changes of [Ca2+] (isosbestic point) and the intensity obtained before Mn2+ perfusion was set to 100 % (after background subtraction). Though the absolute intensity of fluorescence varied from fibre to fibre, reflecting different levels of loading with Fura-PE3, no systematic difference in loading was observed between normal and mdx fibres (loading took place in normal Krebs solution). Then, the fibre chamber was perfused with a Ca2+-free Krebs (no Ca2+ added), containing MnCl2 (500 μM). After the first 30–60 s following Mn2+ application, the decrease of fluorescence intensity was fairly linear and the slope of this linear part of the recording was taken as the rate of Mn2+ influx and expressed as percentage decrease of Fura-PE3 fluorescence per minute. For most of the fibres, the linear decrease lasted 10–12 min, but in some rare cases (see results and Fig. 1), the quenching rate was much faster and complete extinction of the fluorescence took place in 1–2 min; even then quenching was linear for most of its time course. We observed that Mn2+ incubated fibres eventually contracted after about 45 min; this effect combined with the absence of sterile conditions, made it impossible to follow their long-term survival. To artificially increase the Mn2+ influx in some experiments, the non-fluorescent Ca2+ ionophore 4-bromo-A23187 (Alexis Corporation, Laüfelfingen, Switzerland) was added at final concentrations ranging from 25 to 75 nm (from a 5 mm stock solution in DMSO).
Figure 1. Pattern of changes over 6 days of the Mn2+ quenching rate in isolated normal and mdx fibres.
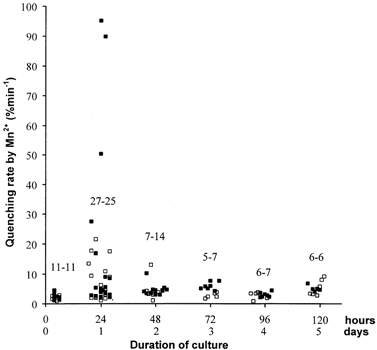
One hundred and thirty-two individual measurements of the fluorescence-quenching rate by Mn2+ in Fura-PE3 loaded fibres. Temporal progression from 2 h after enzymatic isolation (d0) to 120 h after (d5). The time scale is also given in hours because the position of each point corresponds to the exact time after isolation when the measurement was made. Above each group of points, the first figure is the number of normal fibres (C57, open squares), the second is the number of mdx fibres (filled squares). Fibres were obtained from 18 normal and 20 mdx mice.
Histology
The percentage of centronucleated fibres (CNF) in the population of collagenase-isolated mdx fibres was determined after nucleus staining with the cell-permeant stain Hoechst 33258 (Calbiochem, La Jolla, CA, USA; 5 μg ml−1, 10 min, 37 °C); this percentage was also determined on standard haematoxylin-eosin stained cross sections of FBD from age-matched mice.
Survival of collagenase-isolated fibres
After isolation, the fibre suspensions were placed in plastic troughs coated with the Extracellular Matrix Basement Membrane (see above). After 2 h, the troughs were rinsed with fresh culture medium to remove unattached material. Well relaxed and attached fibres were counted and this was taken as the 100 % value at the day (d) of isolation, designated hereafter as d0. Any fibre, normal or mdx, showing this appearance, when tested, remained excitable throughout the 6 days of culture and would twitch in response to single electrical pulses. Usually, 5–6 troughs were examined, at each time point, from a given dissociated muscle and 150–250 fibres were counted in each trough. Counts were made, in sterile conditions, at d1, 2, 3, 4 and 5 and the number of relaxed fibres with conspicuous striations was expressed as a percentage of the d0 count. The culture medium was not changed from d0 to d5, and the troughs were kept in the incubator.
Detection of Ca2+ channels and measurements of their characteristics
Single-channel activity was recorded from cell-attached patches using the technique described (Hamill et al. 1981). Patch electrodes were fabricated using a DMZ-Universal puller (Zeitz-Instruments, Germany) in three stages from borosilicate glass capillaries (1.5 mm in diameter, Harvard Apparatus, USA) to a tip diameter of 1–2 μm. Patch electrodes had a resistance of 2–5 MΩ. The cells were viewed under phase contrast optics with an Axiovert S100 (Zeiss, Germany) inverted microscope. The intrapipette solution contained 110 mm CaCl2 (unless otherwise stated, see Table 2) with 10 mm Hepes and 0.01 mm DIDS (4,4′-diisothyocyanate stilbene-2,2′-disulfonic acid). The bathing solution was an isotonic potassium aspartate solution containing (mm): 150 K-aspartate, 5 MgCl2, 10 EGTA and 10 Hepes. The pH of each solution was adjusted to 7.4 with NaOH. The osmolarity of each solution was adjusted to 320–330 mosmol l−1 by adding glucose. The potassium aspartate bathing solution was used to zero the cell's resting potential so that the patch potential would be equal to the applied voltage command. DIDS was used to block any chloride conductance.
Table 2.
Gating characteristics of voltage-insensitive Ca2+ channels in collagenase-isolated fibres
| Solution | g (pS) | Erev (mV) | n | τ (ms) | Fibre origin |
|---|---|---|---|---|---|
| 110 mm | 8 ± 2 | 19 ± 4 | 5 | 14 ± 2* | C57 |
| CaCl2 | 8 ± 1 | 20 ± 3 | 6 | 13.5 ± 1.3* | mdx |
| 110 mm | 16 ± 1 | 18 ± 3 | 4 | — | C57 |
| BaCl2 | 17 ± 2 | 17 ± 2 | 6 | — | mdx |
| 110 mm | 11 ± 2 | 17 ± 2 | 3 | — | C57 |
| MnCl2 | 11 ± 3 | 18 ± 2 | 5 | — | mdx |
| Physiological | 19 ± 4 | 10 ± 1 | 5 | — | C57 |
| saline | 20 ± 5 | 9 ± 3 | 7 | — | mdx |
g, single channel conductance; Erev, reversal potential; τ, time constant for the open time distribution; n, number of measurements, ±s.d.
n = 15.
The activity of Ca2+ channels was recorded using a HEKA EPC-9 amplifier. Current records were filtered with a Bessel filter at 3 kHz and digitised at 10 kHz. The single-channel data were analysed using Pulse-Fit, Pulse-Tools and Origin 6.1 software. All recordings were made from cell-attached patches at a constant holding potential of - 60 mV, and were undertaken at room temperature.
Statistics
Student's t test was used for simple comparisons of means. For multiple comparisons, data were first analysed by ANOVA, if the significant level of P = 0.05 was reached, the Student-Newman-Keuls test was then used. Significance was indicated by * for P ≥ 0.05, by ** for P ≥ 0.01. This applied to the results presented in Fig. 4 and Fig. 5. The non-parametric Mann-Whitney rank sum test was used for comparison of medians (data of Fig. 2 and Table 1).
Figure 4. Survival of collagenase-isolated FDB fibres from normal and mdx mice.
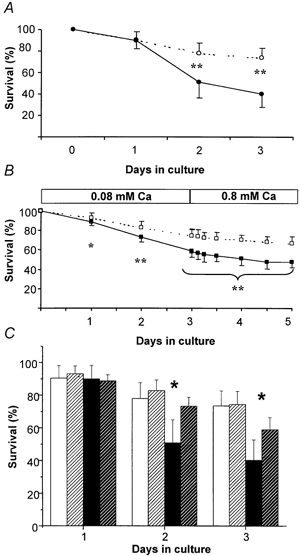
A, survival of collagenase-isolated fibres kept in a medium containing 0.8 mm Ca2+, from d0 to d3. Open symbols: normal fibres; filled symbols: mdx fibres. Means ± s.d. B, survival in a medium containing 0.08 mm Ca2+, from d0 to d3, followed by a return to 0.8 mm Ca2+ (d4-d5). For both A and B, level of significance of the difference between normal and mdx fibres: * P ≥ 0.05, ** P ≥ 0.01. Fibres were obtained from seven normal mice and seven mdx mice. C, survival data of Fig. 4A and B for d1, d2 and d3, rearranged to emphasise the effect of external [Ca2+] on survival of normal and mdx fibres. White columns: normal fibres; filled columns: mdx fibres. Plain columns: 0.8 mm external [Ca2+]; hatched columns: 0.08 mm external [Ca2+]. Level of significance of the difference between survival in the two [Ca2+]o: * P ≥ 0.05. Error bars represent +s.d.
Figure 5. Patterns of change, from d0 to d5, of three characteristics of the voltage-insensitive Ca2+ channels in collagenase-isolated fibres.
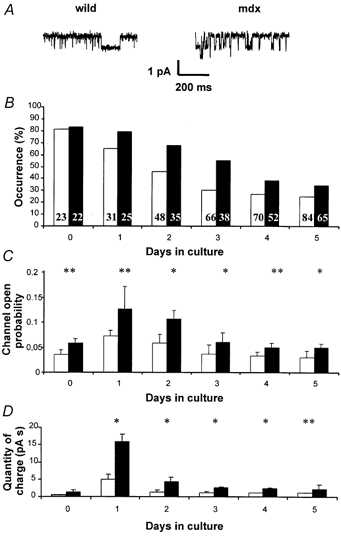
A, examples of channel activity records. B, occurrence of voltage-insensitive Ca2+ channels, the number of fibres tested is given for each column. C, mean open probabilities of the same channels. D, integrated (over 120 s) amounts of charges carried through the channels. Open bars, normal fibres; filled bars, mdx fibres. Level of significance of the difference between normal and mdx fibres: * P ≥ 0.05, ** P ≥ 0.01. Fibres were obtained from seven normal and eight mdx mice.
Table 1.
Medians and 25–75 percentiles of Mn2+ influx rate and the corresponding cytosolic [Ca2+] (from data displayed in Fig. 2A)
| C57 (n = 62) | mdx (n = 68) | |||
|---|---|---|---|---|
| Mn2+ influx rate (% min−1) | Cytosolic [Ca2+] (nm) | Mn2+ influx rate (% min−1) | Cytosolic [Ca2+] (nm) | |
| Median | 2.89 | 53.9 | 4.21 | 59.3 |
| p25 | 1.97 | 46.7 | 2.97 | 52.5 |
| p75 | 4.33 | 69.2 | 5.16 | 64.2 |
Results
The population of collagenase-isolated fibres
It is well documented that skeletal muscles of adult mdx mice have a high percentage of centrally nucleated fibres (CNF) reflecting the continuous process of regeneration. This percentage varies from muscle to muscle (Boland et al. 1995; Pastoret & Sebille, 1995). We observed that the percentage of CNF in the population of collagenase-isolated mdx fibres was around 25 % and was not significantly different from the values we obtained on standard histological sections. Thus, the collagenase digestion of the muscle did not produce a selection of fibres on the basis of their state of differentiation (assessed by the nuclei position). Moreover, the same percentage of CNF was maintained over the 6 days of culture.
Mn2+ influx in collagenase-isolated fibres: changes from d0 to d5
Individual quenching rates of Fura-PE3 fluorescence in the presence of external Mn2+ ions are shown in Fig. 1. At d0, the influx remained below 5 % min−1 and no significant difference was detected between normal and mdx fibres. At d1, most of the values remained within the 5 % limits, while a small fraction of the fibres (8/27 and 9/25 for normal and mdx respectively) showed larger and widely dispersed values: from 6.1 to 21.5 % min−1 for normal fibres, and from 5.3 to 95 % min−1 for those from mdx muscles (we checked that this was not due to particularly high levels of Fura-PE3 loading). At d2, most values were again concentrated within the 5 % min−1 limit with only 1/7 (normal) and 1/14 (mdx) showing values around 10–13 % min−1. At d3, the mean values were 2.5 and 5 % min−1 for normal and mdx fibres respectively, a significant difference (P < 0.01). These latter rates are very similar to those reported previously for collagenase-isolated fibres after 3 days of culture (Tutdibi et al. 1999); at this age of culture, these authors never observed fluxes over 10 % min−1 in a set of more than 150 individual observations of both normal and mdx fibres (H. Brinkmeier, personal communication). However, when we extended observations to d4 and d5, the difference of Ca2+ influx between normal and mdx fibres was no longer significant.
The correlation between Mn2+ influx and [Ca2+]i
The cytosolic [Ca2+] was measured for each fibre before the Mn2+ quenching rate was determined (see Methods) in order to assess the relationship between Ca2+ influx (estimated from the Mn2+ influx) and the steady-state value of [Ca2+]i. Among the 132 fibres studied (Fig. 1), 130 individual pairs of values were obtained over the 6 days of study (68 mdx, 62 normal). They are displayed in Fig. 2A, without reference to the day of observation. The largest fraction of the results (116/130) is clustered within 0–10 % min−1 quenching rate and 25–85 nm[Ca2+]i, as extreme limits. Results from normal and mdx fibres overlap. This densely populated cluster at the far left of Fig. 2A is presented as an expanded view in Fig. 2B. The whole set of data (Fig. 2A) exhibits an extremely skewed distribution, rendering calculation of arithmetic means inappropriate. Instead, the medians and the 25–75 percentile ranges were determined for both the quenching rates and the cytosolic [Ca2+] as reported in Table 1. Medians were compared by a non-parametric statistical analysis (Mann-Whitney Rank sum test). Although the median of the quenching rate was significantly larger in mdx fibres (P < 0.01), the median of cytosolic [Ca2+] did not differ from normal (P = 0.2). Outside the main cluster of results, a small fraction of the fibres (12/130) showed both higher [Ca2+]i values in the 100–140 nm range and a wide dispersion of the influx rate from > 5 to 95 % min−1. All but one of the results of this second fraction were obtained at d1. Here, results from normal and mdx no longer overlap, due to the much higher values for Mn2+ influx in four mdx fibres (as already seen in Fig. 1). Notwithstanding the very high influx values in some mdx fibres, [Ca2+]i values in this group were not different from those obtained with the normal fibres of this high Mn2+ influx fraction and remained within the 100–140 nm range, without reaching the contraction threshold, for all fibres were relaxed with visible striations at the time of measurement. We checked that these results did not come from the same animal. Moreover, the four fibres showing high Mn2+ influx rates came from different cultures each of which also contained fibres having quenching rates as low as 2 % min−1. Thus, the dispersion of the results reflected the heterogeneity of the fibre population and not the differences among animals.
The relationship between the Ca2+ influx rate and the cytosolic [Ca2+] was further studied by artificially increasing the Ca2+ influx with low concentrations of the Ca2+ ionophore 4-bromo A23187. We restricted our study to fibres cultured for 2 and 3 days, when those fibres with elevated influx had been naturally eliminated (see below). As seen in Fig. 3, we obtained influx rates ranging from 2 to 44 % min−1 while [Ca2+]i remained within the 30–78 nm limits, with no difference between normal and mdx fibres. The results of Fig. 3 show that, within the duration of the experiment (< 120 min), the ‘robustness’ of the cytosolic Ca2+ homeostasis in response to a large increase of Ca2+ influx is as good in mdx fibres as in normal ones, even when this influx was up to 10-fold above naturally occurring values.
Figure 3. Correlation between Mn2+ quenching rate and cytosolic [Ca2+] in the presence of 4-bromo-A23187.
Open symbols, normal fibres; filled symbols, mdx fibres. Key: day of measurement. Fibres were obtained from 11 normal and 3 mdx mice. A23187 concentrations: 25–75 nm.
Fibre survival and Mn2+ influx
The appearance of some fairly high values of Mn2+ influx at d1, indicated that abnormally high Ca2+ influx was occurring for some mdx and normal fibres. This prompted us to examine the survival of the fibres. However, for technical reasons, it was impossible to follow the fate of individual fibres where Mn2+ influx had been measured. We thus had to rely on a study of the survival of a population of fibres. Six cultures were run in parallel and the number of remaining fibres were counted from d0 to d3. Only well elongated fibres (thus maintaining the resting state), showing no structural alterations, were counted. As shown in Fig. 4A, mdx fibres show a 10 % decline in number from d0 to d1, followed by a sharper decline such that survival was reduced to 51 %, at d2. This rate of decline subsequently slowed. In contrast, normal fibres showed a steady decline of 10–12 % per day (Fig. 4A, dotted line) so that survival at d2 was still 78 %. Thus, taking the loss rate of normal fibres as reference, mdx fibres showed an excess loss of 27 % (i.e. the difference between 78 and 51 %) from d0 to d2. For normal fibres, survival declined smoothly in spite of the fact that a fraction of the fibres (8/27) displayed, at d1, values of Ca2+ influx in the > 5 to 21 % min−1 range. In Fig. 4A and B, statistical significance (marked *) concerns the difference between mdx and normal fibres.
To see if the sharp decrease of survival of mdx fibres from d1 to d2 could be attenuated, fibres were isolated and maintained in a medium containing one-tenth of the normal [Ca2+]o of the culture medium, i.e. 0.08 mm, assuming that the reduction of [Ca2+]o would similarly reduce the influx of Ca2+. Under these conditions, survival of mdx fibres decreased regularly from d0 to d3, as seen in Fig. 4B, without any sharp decrease between d1 and d2. The excess of mdx fibre death from d0 to d2 was now reduced from 27 % (at 0.8 mm [Ca2+]o) to 10 %. For normal fibres, the reduction of external [Ca2+] did not affect the survival time course. To facilitate the comparison between the 0.8 and 0.08 mm Ca2+ conditions, data from d1, d2 and d3 of Fig. 4A and B were compiled in Fig. 4C where the statistical analysis now concerns differences of survival in the two [Ca2+]o media.
On return to normal [Ca2+]o, neither type of fibre showed any sudden significant change of survival rate. Both survival profiles from d0 to d4 approximate to a smooth exponential decay, with time constants of 225 for normal and 147 h for mdx fibres. Thus, even at low [Ca2+]o, elimination of mdx fibres proceeded about 1.5 times faster than for normal fibres. When comparing survival at d2 in Fig. 4A and B, it is clear that a fraction of cell death (≈one-third) observed in 0.8 mm [Ca2+]o also occurred at 0.08 mm when the size of the Ca2+ entry was reduced proportionately. From d4 to d5, however, no further significant decrease of survival could be detected for either type of fibre.
Voltage-independent Ca2+ channels: characteristics and progression from d0 to d5
Channel activity was observed on collagenase-isolated FDB fibres, by the patch clamp technique (cell-attached configuration) at holding potential of −60 mV (Fig. 5A). Results displayed in Table 2 give the single-channel conductance and the reversal potential for different solutions within the patch pipette. The I-V relationship is strictly ohmic, showing no sign of voltage activation or inactivation and is identical in mdx and normal fibres (not shown). Cationic selectivity is poor and allows fluxes of Ca2+, Ba2+, Mn2+ and Na+ (and most likely K+ from within the cell). The estimated PCa/PNa ratio (Lee & Tsien, 1984) is around 0.7. Moreover, the open probability is greatly reduced by trivalent cations (e.g. 50 μM La3+). Open times showed a Poisson-like distribution, approximating to an exponential decay, the time constant of which is also reported in Table 2. These characteristics bear strong resemblance to those of the mechanosensitive channels already described in similar preparations (Franco-Obregón & Lansman, 1994). Indeed, when gentle suction was applied to the patches, we observed, in all fibres tested (10 mdx and 10 C57), a significant increase of the mean open probabilities which amounted to 69 ± 8 % and 53 ± 8 % (s.e.m.), for mdx and C57 fibres respectively (with no significant difference between mouse lines, P = 0.7, t test). Interestingly, the mechanosensitivity of these channels was present in the absence of dystrophin. All these gating properties were identical in normal and mdx fibres. Moreover, we observed that they remained unchanged from d0 to d5.
In contrast with this stability, the occurrence of these channels and the open probabilities are different between normal and mdx fibres and showed typical patterns of change from d0 to d5. Channel occurrence was estimated as the percentage of the fibres that, when sampled by the patch pipette, show channel activity (each fibre was sampled only once). Soon after isolation, channel activity was recorded in 80 % of the fibres, both in normal and mdx fibres. As shown in Fig. 5B, the occurrence steadily decreased from d0 to d5, but the decrease was always less marked for mdx fibres. Eventually, by d5, occurrence had declined to 20 and 32 % for normal and mdx fibres, respectively.
Figure 5C gives the change in the average channel open probabilities from d0 to d5. At d0, the values for normal and mdx fibres are very similar to that reported previously, with a significant difference between the two types of fibres. Surprisingly, for both types of fibres, the average open probability nearly doubled at d1 and recovered the d0 values by d3, remaining stable thereafter. At d5, the average value of mdx fibre was about twice the value for normal fibres (P < 0.05). These transient changes are still better illustrated by the histograms of the open probabilities from d0 to d5 (Fig. 6). At d0, the values did not exceed 0.1, while at d1, values for mdx fibres spread up to 0.27. Gradually both distributions narrowed again and recovered their d0 patterns by d5.
Figure 6. Pattern of change from d0 to d5 of the distribution of the open probabilities of voltage-insensitive Ca2+ channels.
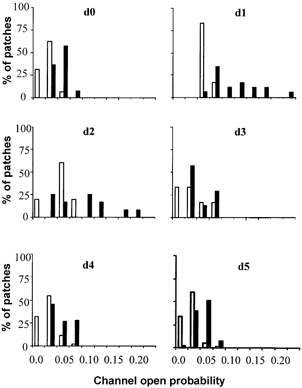
Open columns, normal fibres; filled columns, mdx fibres.
By integration of the current records over the 120 s of observation, the quantity of charge (pA s) passing through the membrane patch was calculated, when using a patch pipette filled with 110 mm CaCl2. As seen in Fig. 5D, a large increase at d1 followed by a progressive return towards the d0 values was observed for both types of fibre. For each day, values for mdx fibres were about twice those for normal fibres, except at d1 when the mean quantity of charge was tripled in mdx.
In spite of the large difference in experimental conditions, estimates of Ca2+ influx by either the Mn2+ fluorescence quenching technique (Fig. 1) or by electrical measurements with a Ca2+ filled patch pipette (Fig. 5 and Fig. 6) provide remarkably consistent information on three points: (1) a large increase of Ca2+ influx had developed at d1; (2) this was accompanied by large fibre-to-fibre differences, over the same d1-d2 period; (3) a progressive return towards the low d0 values took place within the next 2 days (d2-d4). However, in contrast with the measurements of charges passing through the patch pipettes which were systematically higher in mdx fibres (Fig. 5D), estimation of Ca2+ influx by the Mn2+ quenching rate detected no difference at d0, d4 and d5 (Fig. 1). We think that the latter measurements better reflect the physiological situation since they were obtained in near-physiological conditions (in the presence of 140 mm Na+), while the patch technique artificially amplified the Ca2+ influx, as pipettes were filled with 110 mm Ca2+.
Discussion
Pattern of change in primary cultures of collagenase-isolated fibres
We report here several properties of collagenase-isolated fibres, examined over a period of 6 days (d0-d5) following isolation: Mn2+ influx from the external medium (an estimation of the actual Ca2+ influx) and the corresponding cytosolic [Ca2+], occurrence and properties of Ca2+ channels and fibre survival. The study was performed on normal and on dystrophin-deficient (mdx) fibres. For clarity the behaviour of normal fibres will be examined first.
Our study revealed that collagenase-isolated fibres kept in culture over several days display transitory changes on some aspects of Ca2+ handling which take more than 24 h to appear and which spontaneously disappear over the next 2–3 days. There were significant increases of the rate of Mn2+ influx from the external medium, of the open probabilities of Ca2+ channels and of the charge carried through them. The extent of the changes varied widely from fibre to fibre, but the temporal course of these three parameters was remarkably similar. This synchrony suggests that Ca2+ influx (detected by the Mn2+ quenching technique) took place through the Ca2+ channels active at −60 mV which present a similar unitary conductance for Ca2+ and Mn2+ (Table 2).
The mechanisms and significance of these transient increases is unclear. It is unlikely that they result from some unwanted proteolytic action during the collagenase digestion as they occurred long after the washing out of the enzyme. Fibre isolation led automatically to denervation. To our knowledge, there is no report of the effect of denervation on the behaviour of the type of Ca2+ channels studied here. However, a transient decrease of the activity of the sarcoplasmic reticulum (Ca2+ storage rate and amount released) has been observed at d2 after denervation of rat soleus muscle, this decrease was reversed at d7 (Midrio et al. 1997). The similarity of the time courses raises the possibility that the transient changes in Ca2+ channel activity reported here could be due to denervation. On the other hand, in the only other study of collagenase-isolated fibres maintained up to 8 days in culture, no significant changes of Ca2+ transients upon stimulation were observed from d0-d4; later, a sharp reduction of the parvalbumin content occurred around d5 with a corresponding slowing of the Ca2+ transients (Liu et al. 1997). Alternatively, the transient changes of channel activity could be related to the activation of satellite cells, which start to leave the fibres on which they resided, 12–36 h after fibre isolation (Bockhold et al. 1998).
Are these changes reversible? The fact that individual fibres could not be followed over several days after the measurements, makes a direct answer impossible. However, the histograms of open probabilities distribution from d0 to d5 (Fig. 6), both for mdx and C57 fibres, showed that the low values (on the left-hand side of the medians) at d0, which increased at d1-d2, did return to the low d0 values at d4-d5. For those fibres, this is a clear indication that the transient changes of channel open probability were reversible. On the other hand, for the fibres already exhibiting high open probabilities at d0 (on the right-hand side of the medians), the return to d0 values after the transient increase at d1-d2, does not allow us to distinguish between reversibility and fibre elimination.
In contrast with these transient changes, we observed a slow and regular decline of the occurrence of Ca2+ channels and of fibre survival, from d0 to d5. Apparently, both increased Ca2+ influx and Ca2+ channel activity, as well as a 10 times reduction of the external [Ca2+] had little or no corresponding effect on fibre survival. The steady down-regulation of the Ca2+ channel occurrence might be related to the fact that collagenase-isolated fibres are no longer submitted to any mechanical stress after the digestion of the myotendinous junction. This is plausible since the Ca2+ channels studied here have the characteristics of the mechanosensitive Ca2+ channel previously described.
Mdx fibres showed a similar pattern of change but the transient increases were accentuated, both for Ca2+ channel behaviour and Mn2+ influx. The progressive down-regulation of the occurrence of Ca2+ channels was less conspicuous in the absence of dystrophin, as if the lack of mechanical stress was less ‘sensed’ by the fibres, suggesting that dystrophin, besides its structural properties, could have some role in the transduction of mechanical signals (even if some aspects of the mechanosensitivity were not affected by the lack of dystrophin, see above). However, survival of mdx fibres showed a sharp decrease within the d1-d2 interval, which was not observed in normal fibres. This point will be examined later.
Ca2+ homeostasis in collagenase-isolated fibres
The large amount of data collected over 6 days, allows us to assemble a long-term view of the impact of Ca2+ influx (estimated by the Mn2+ influx) and of Ca2+ channel activity on the bulk cytosolic [Ca2+], especially because the former and the latter were measured sequentially on 130 individual fibres. We were able to study this impact during the transient changes of Ca2+ influx and of Ca2+ channel activity, which occurred spontaneously during the course of the culture, and also during artificial increases of Ca2+ influx obtained by using a Ca2+ ionophore.
It is clear from the data presented in Figs 1, 2A and 2B that, for the vast majority of mdx fibres studied, [Ca2+] remained within the range observed in normal fibres in spite of changes of Ca2+ influx and of Ca2+ channel activity. Indeed, for both types of fibre, Mn2+ influx could vary from 2 to 20 % min−1 (and even more, see Fig. 2A) while [Ca2+]i remained within the 25–85 nm range, with mean values around 55 nm, as in previous studies (Gailly et al. 1993; Head, 1993; Pressmar et al. 1994; Collet et al. 1999). Clearly, the ‘robustness’ of intracellular Ca2+ homeostasis is equivalent in normal and mdx fibres, both of which can cope with large and sustained variations of Ca2+ influx. Thus the doubled value of the Mn2+ influx, observed at d3 in mdx fibres in comparison to normal ones (Tutdibi et al. 1999) (and confirmed here) is without practical consequences as far as [Ca2+]i is concerned.
Our longitudinal study of collagenase-isolated fibres revealed a delayed and transient increase of Mn2+ influx and of Ca2+ channel activity which extended over several days of culture (d1 to d3) and was systematically larger in dystrophin-deficient fibres (Fig. 5 and Fig. 6) suggesting a mechanistic interaction between dystrophin and the activity of the Ca2+ channels. Even if this is without impact on the bulk value of [Ca2+]i, it is possible that it contributed to building a localised elevation of [Ca2+], e.g. in the sub-membranous space, which could explain the lower threshold of activation of the Ca2+-activated K+ channels observed in mdx fibres (Mallouk et al. 2000).
So far, the discussion has dealt with results obtained in 90 % of the fibres studied. During the critical d1-d3 period, a small fraction of the fibres, both normal and mdx, manifested larger rates of Mn2+ influx (>10 % min−1) together with [Ca2+]i values within the 100–140 nm range (see Fig. 1 and Fig. 2A). Among the 68 mdx fibres studied here, obtained from FDB of young adult mice, only four, i.e. about 6 %, showed values of Mn2+ influx that exceeded the highest values recorded in normal fibres (this figure becomes 16 %, if only the 25 mdx fibres studied at d1 are considered). In some infrequent cases, mostly mdx fibres, this may have led to the loss of Ca2+ homeostasis and elimination of the fibre. This observation raises the interesting possibility that among the numerous fibres composing a given anatomical muscle, only a small fraction of them are engaged in the first steps of the process of degeneration which would include the loss of Ca2+ homeostasis if challenged.
Mn2+ influx, Ca2+ channel activity and fibre survival
Long-term culture of collagenase-isolated fibres could provide such a challenge and thus reveal these fibres. Our results provide some indication when this might occur by comparing Mn2+ influx and survival. However, as previously pointed out, the fate of individual fibres could not be followed over days after Mn2+ influx measurements, thus the comparison was based on the behaviour of a fibre population and is therefore of a probabilistic nature. As noted before, survival of normal fibres declined smoothly in spite of the fact that a fraction of the fibres (8/27, see Fig. 1) showed, at d1, values of Mn2+ influx up to 21 % min−1. The latter value could be considered as an upper ‘safe’ limit above which cell death occurs at a higher rate than in normal fibres. In the 25 mdx fibres studied at d1, four of them (16 %) exhibited Ca2+ influxes ranging from 27 to 95 % min−1, thus exceeding this supposed ‘safe’ limit. Though it is based on a small number of fibres, these results suggest that when Ca2+ influx exceeds a safe limit, corresponding to a Mn2+ influx of 20–25 % min−1, over a long period of time, say > 24 h, Ca2+ homeostasis of the cytosol is eventually lost. This may be partly (but not completely) prevented by reducing to one-tenth the external Ca2+ concentration during the critical period from d1 to d3. By comparing the decrease of survival from d1 to d2, presented in Fig. 4A (0.8 mm Cao) and 4B (0.08 mm Cao) it can be calculated that among 25 mdx fibres studied at d1, six would die in a Ca2+-dependent manner, from d1 to d2; this is close to the number (four) of mdx fibres where Mn2+ influx exceeded the proposed ‘safe’ limit.
Numerous studies, reviewed by Gillis (1999), have concluded that cytosolic [Ca2+] was not abnormally elevated in collagenase-isolated mdx fibres. This made questionable the idea that degeneration of dystrophin-deficient fibres was primarily caused by a cytosolic Ca2+ overload (Turner et al. 1988). Indeed, at d0, we detected significant elevation of neither Mn2+ influx nor [Ca2+]i in mdx fibres compared to normal ones. Moreover, when transient increases of Mn2+ influx and Ca2+ channel activity spontaneously developed during the course of the culture or were produced by ionophore application, [Ca2+]i remained within normal values in 90 % of the fibres studied. However, under these conditions, we spotted a small fraction of fibres where Ca2+ homeostasis seemed compromised. Most likely these fibres did not survive further. The picture emerging from the present study is thus more complex than previously thought. One could envisage that the mdx muscle is composed of a large population of fibres where cytosolic [Ca2+] is tightly maintained within physiological limits in spite of an increased Ca2+ influx, probably resulting from an increased activity of voltage-independent Ca2+ channels. However, this Ca2+ homeostasis could become compromised in some fibres, possibly by the action of triggering factors e.g. by a local excessive mechanical stress, as during eccentric contractions to which dystrophin-deficient fibres are particularly susceptible (Moens et al. 1993; Petrof et al. 1993). Indeed, local experimental ruptures of the sarcolemma increased the activity of the Ca2+ leak channels in normal myotubes (McCarter & Steinhardt, 2000). This picture would fit well with the classical histological observations of mdx muscles where discrete foci of degeneration are surrounded by a large population of healthy looking fibres.
Acknowledgments
We thank Dr T. Partridge (MRC Clinical Sciences Centre, London) for reading the manuscript. This work was supported by the Association Française contre les Myopathies (AFM), the Association Belge contre les Maladies neuro-Musculaires (ABMM) and the ‘Concerted Action’ (no. 00/05-260). P.G. is Associate Research Fellow of the F.N.R.S. (Belgium). C.V. is recipient of a 2 year post-doctoral fellowship of the AFM.
References
- Bockhold KJ, Rosenblatt JD, Partridge TA. Aging normal and dystrophic mouse muscle: analysis of myogenicity in cultures of living single fibers. Muscle and Nerve. 1998;21:173–183. doi: 10.1002/(sici)1097-4598(199802)21:2<173::aid-mus4>3.0.co;2-8. [DOI] [PubMed] [Google Scholar]
- Boland B, Himpens B, Denef JF, Gillis JM. Site-dependent pathological differences in smooth muscles and skeletal muscles of the adult mdx mouse. Muscle and Nerve. 1995;18:649–657. doi: 10.1002/mus.880180612. [DOI] [PubMed] [Google Scholar]
- Collet C, Allard B, Tourneur Y, Jacquemond V. Intracellular calcium signals measured with indo-1 in isolated skeletal muscle fibres from control and mdx mice. Journal of Physiology. 1999;520:417–429. doi: 10.1111/j.1469-7793.1999.00417.x. [DOI] [PMC free article] [PubMed] [Google Scholar]
- Franco-Obregón AJ, Lansman JB. Mechanosensitive ion channels in skeletal muscle from normal and dystrophic mice. Journal of Physiology. 1994;481:299–309. doi: 10.1113/jphysiol.1994.sp020440. [DOI] [PMC free article] [PubMed] [Google Scholar]
- Gailly P, Boland B, Himpens B, Casteels R, Gillis JM. Critical evaluation of cytosolic calcium determination in resting muscle fibres from normal and dystrophic (mdx) mice. Cell Calcium. 1993;14:473–483. doi: 10.1016/0143-4160(93)90006-r. [DOI] [PubMed] [Google Scholar]
- Gillis JM. Understanding dystrophinopathies: an inventory of the structural and functional consequences of the absence of dystrophin in muscles of the mdx mouse. Journal of Muscle Research and Cell Motility. 1999;20:605–625. doi: 10.1023/a:1005545325254. [DOI] [PubMed] [Google Scholar]
- GrynkiewicZ G, Poenie M, Tsien RY. A new generation of Ca2+ indicators with greatly improved fluorescent properties. Journal of Biological Chemistry. 1985;260:3440–3450. [PubMed] [Google Scholar]
- Hamill OP, Marty A, Neher E, Sakmann B, Sigworth FJ. Improved patch-clamp techniques for high-resolution current recording from cells and cell-free membrane patches. Pflügers Archiv. 1981;391:85–100. doi: 10.1007/BF00656997. [DOI] [PubMed] [Google Scholar]
- Head SI. Membrane potential, resting calcium and calcium transients in isolated muscle fibres from normal and dystrophic mice. Journal of Physiology. 1993;469:11–19. doi: 10.1113/jphysiol.1993.sp019801. [DOI] [PMC free article] [PubMed] [Google Scholar]
- Hopf FW, Turner PR, Denetclaw WF, Reddy P, Steinhardt RA. A critical evaluation of resting intracellular free calcium regulation in dystrophic mdx muscle. American Journal of Physiology. 1996;271:C1325–1339. doi: 10.1152/ajpcell.1996.271.4.C1325. [DOI] [PubMed] [Google Scholar]
- Lee KS, Tsien RW. High selectivity of calcium channels in single dialysed heart cells of the guinea-pig. Journal of Physiology. 1984;354:253–272. doi: 10.1113/jphysiol.1984.sp015374. [DOI] [PMC free article] [PubMed] [Google Scholar]
- Liu Y, Carroll SL, Klein MG, Schneider MF. Calcium transients and calcium homeostasis in adult mouse fast-twitch skeletal muscle fibers in culture. American Journal of Physiology. 1997;272:C1919–1927. doi: 10.1152/ajpcell.1997.272.6.C1919. [DOI] [PubMed] [Google Scholar]
- McCarter GC, Steinhardt RA. Increased activity of calcium leak channels caused by proteolysis near sarcolemmal ruptures. Journal of Membrane Biology. 2000;176:169–174. doi: 10.1007/s00232001086. [DOI] [PubMed] [Google Scholar]
- Mallouk N, Jacquemond V, Allard B. Elevated subsarcolemmal Ca2+ in mdx mouse skeletal muscle fibers detected with Ca2+-activated K+ channels. Proceedings of the National Academy of Sciences of the USA. 2000;97:4950–4955. doi: 10.1073/pnas.97.9.4950. [DOI] [PMC free article] [PubMed] [Google Scholar]
- Merritt JE, Jacob R, Hallam TJ. Use of manganese to discriminate between calcium influx and mobilization from internal stores in stimulated human neutrophils. Journal of Biological Chemistry. 1989;264:1522–1527. [PubMed] [Google Scholar]
- Midrio M, Danieli-Betto D, Megighian A, Betto R. Early effects of denervation on sarcoplasmic reticulum properties of slow-twitch rat muscle fibres. Pflügers Archiv. 1997;434:398–405. doi: 10.1007/s004240050413. [DOI] [PubMed] [Google Scholar]
- Moens P, Baatsen PHWW, Maréchal G. Increased susceptibility of EDL muscles from mdx mice to damage induced by contractions with stretch. Journal of Muscle Research and Cell Motility. 1993;14:446–451. doi: 10.1007/BF00121296. [DOI] [PubMed] [Google Scholar]
- Pastoret C, Sebille A. mdx mice show progressive weakness and muscle deterioration with age. Journal of the Neurological Sciences. 1995;129:95–107. doi: 10.1016/0022-510x(94)00276-t. [DOI] [PubMed] [Google Scholar]
- Petrof BJ, Shrager JB, Stedman HH, Kelly AM, Sweeney HL. Dystrophin protects the sarcolemma from stresses developed during muscle contraction. Proceedings of the National Academy of Sciences of the USA. 1993;90:3710–3714. doi: 10.1073/pnas.90.8.3710. [DOI] [PMC free article] [PubMed] [Google Scholar]
- Pressmar J, Brinkmeier H, Seewald MJ, Naumann T, Rüdel R. Intracellular Ca2+ concentrations are not elevated in resting cultured muscle from Duchenne (DMD) patients and in MDX mouse muscle fibres. Pflügers Archiv. 1994;426:499–505. doi: 10.1007/BF00378527. [DOI] [PubMed] [Google Scholar]
- Sicinski P, Geng Y, Ryder-Cook AS, Barnard EA, Darlison MG, Barnard BJ. The molecular basis of muscular dystrophy in the mdx mouse: a point mutation. Science. 1989;244:1578–1580. doi: 10.1126/science.2662404. [DOI] [PubMed] [Google Scholar]
- Turner PR, Fong P, Denetclaw WF, Steinhardt RA. Increased calcium influx in dystrophic muscle. Journal of Cell Biology. 1991;115:1701–1712. doi: 10.1083/jcb.115.6.1701. [DOI] [PMC free article] [PubMed] [Google Scholar]
- Turner PR, SchultZ R, Ganguly B, Steinhardt RA. Proteolysis results in altered leak channel kinetics and elevated free calcium in mdx muscle. Journal of Membrane Biology. 1993;133:243–251. doi: 10.1007/BF00232023. [DOI] [PubMed] [Google Scholar]
- Turner PR, Westwood T, Regen CM, Steinhardt RA. Increased protein degradation results from elevated free calcium levels found in muscle from mdx mice. Nature. 1988;355:735–738. doi: 10.1038/335735a0. [DOI] [PubMed] [Google Scholar]
- Tutdibi O, Brinkmeier H, Rudel R, Fohr KJ. Increased calcium entry into dystrophin-deficient muscle fibres of MDX and ADR-MDX mice is reduced by ion channel blockers. Journal of Physiology. 1999;515:859–868. doi: 10.1111/j.1469-7793.1999.859ab.x. [DOI] [PMC free article] [PubMed] [Google Scholar]