

Abstract
The effects of inorganic phosphate (Pi, a product released during ATP hydrolysis in active muscle) on tension transients induced by length perturbation (∼0.3 ms) were examined in chemically skinned (0.5 % Brij), maximally Ca2+-activated rabbit psoas muscle fibres at 10 °C (ionic strength 200 mm, pH 7.1). In one type of experiment, the tension transients induced by length release and stretch of a standard amplitude (0.4-0.5 % of Lo, muscle fibre length) were examined at a range of added [Pi] (range 3–25 mm). The steady active tension was depressed ∼45 % with 25 mm added Pi. The initial tension recovery (from T1, extreme tension reached after length step, to T2, tension after quick recovery) was analysed by half-time measurement and also by exponential curve fitting - extracting a fast (phase 2a) and a slow (phase 2b) component. The tension decay after a stretch became faster with increased [Pi], whereas the quick tension rise induced by a length release was insensitive to added Pi. Consequently, the asymmetry in the speed of tension recovery from stretch and release was reduced at high [Pi]. A plot of the phase 2b rate (or 1/half-time) of tension decay after stretch versus [Pi] was approximately hyperbolic and showed saturation at higher [Pi] levels. In a second type of experiment, the tension transients induced by length steps of different amplitudes were examined in control (no added Pi) and in the presence of 25 mm added Pi. Over a range of length step amplitudes (up to 1 % L0), the tension decay after stretch was consistently faster in the presence of Pi than in the control; this was particularly pronounced in phase 2b. The rate of tension rise after length release remained high but similar in the presence and absence of added Pi. These observations indicate that a stretch and release perturb different molecular steps in the crossbridge cycle. The Pi sensitivity of tension decay (phase 2b) after stretch is similar to that seen using other perturbations (e.g. [Pi] jumps, hydrostatic pressure jumps and temperature jumps and sinusoidal length oscillations). The results indicate that the Pi-sensitive force generation identified in previous studies is strain sensitive (as expected), but it is seen only with respect to positive strain (stretches).
Inorganic phosphate (Pi) is a product of actomyosin ATP hydrolysis that is released during active muscle contraction. An increase of [Pi] has been shown to depress isometric active force (/ tension) in skinned muscle fibres (Rüegg et al. 1971; Cooke & Pate, 1985; Hibberd et al. 1985) and in myofibrils (Tesi et al. 2000). A number of studies (Fortune et al. 1991; Kawai & Halvorson, 1991; Dantzig et al. 1992; Tesi et al. 2000) have shown that Pi release during ATP hydrolysis is closely coupled to crossbridge force generation in muscle fibres and that force generation occurs in a reversible step prior to Pi release (see, however, Davis & Rodgers, 1995). Rapid temperature jump measurements (Davis & Harrington, 1987; Goldman et al. 1987; Bershitsky & Tsaturyan, 1992; Ranatunga, 1996) and sinusoidal oscillations of muscle length (Zhao & Kawai, 1994; Wang & Kawai, 2001) suggest that crossbridge force generation is endothermic. The basic common observation that led to such a unified thesis from experiments using different perturbations was that the particular tension component identified as crossbridge force generation became faster with increased [Pi] and showed saturation at higher [Pi] levels. An observation consistent with this hypothesis was that the tension depression induced by increased [Pi] is accompanied by a more rapid approach to the new steady state following a perturbation (e.g. pressure jump or temperature (T) jump; see Gutfreund & Ranatunga, 1999). Thus, the molecular step that underlies muscle force generation is probed by a rapid perturbation at different [Pi].
As postulated by Huxley & Simmons (1971), muscle force during isometric contraction may be maintained by equilibrium between two crossbridge states (low and high force states); the equilibrium would be sensitive to strain changes such as sudden shortening (negative strain) that reduces the force (see Huxley & Tideswell, 1996). Thus, the crossbridge force-generating step can be studied by analysing the quick tension recovery in the tension transients induced by a rapid length perturbation (length release). Following the definitive observations and analyses of Ford et al. (1977), the structural changes that accompany sudden length perturbations are better understood (see Irving et al. 1992, 1995; Lombardi et al. 1992). Because the tension recovery after sudden length releases is much faster than the tension rise induced by pressure jumps (Fortune et al. 1991; see also Vawda et al. 1999) or temperature jumps (Ranatunga, 1996; 1999b), it was suggested that tension recovery after length release and T-jump may be different steps on the basis of X-ray diffraction studies (Bershitsky et al. 1997). Therefore, it is important to determine the sensitivity of the length step-induced tension transient to [Pi] as has been done with the other perturbations summarised above. This was the primary aim of this study.
Experiments were carried out at 10 °C on single skinned muscle fibres isolated from rabbit psoas muscle and the effect of added Pi on tension transients induced by small stretches and releases complete in < 0.4 ms was examined. The results show that whereas the stretch-induced tension transient is sensitive to [Pi], the length release-induced tension transient is insensitive to added Pi: the stretch and release protocols perturb different steps in the crossbridge cycle. Two abstracts on these experiments have been published (Coupland & Ranatunga, 2000; Ranatunga, 2001a).
Methods
The trough system with temperature control used in this study and the design of the tension transducer (natural resonant frequency was 14 kHz) have been described before (Ranatunga, 1996, 1999a). The motor used in the study was built using a small permanent magnet (25 mm outer diameter) taken from a loudspeaker; the moving coil was wound round an aluminium-foil cylinder (‘former’); it was held by plastic hinges and its axial movement was monitored photo-electrically. The motor was capable of producing ramp stretches of up to 60 μm in 200 μs.
The buffer solutions contained 6–7 mm Mg-acetate, 5.5 mm ATP, 12.5 mm creatine phosphate (and 1–2 mg ml−1 of creatine kinase), 15 mm EGTA (relaxing solution) or Ca-EGTA (activating solution) or HDTA (1,6,-diaminohexane-N,N,N‘,N‘-tetraacetic acid; pre-activating solution), 10 mm glutathione, 10 mm glycerol-2-phosphate (as a temperature-insensitive pH buffer, see Goldman et al. 1987) and ∼50 mm K-acetate. K-acetate was replaced with K2HPO4 in Pi-added solutions (i = 200 mm; pH = 7.1). Solutions also contained 4 % Dextran (molecular mass ∼500 kDa) to compress the filament lattice spacing in the fibres to normal dimensions (Maughan & Godt, 1979; Matsubara et al. 1985; Xu et al. 1993).
Experimental procedures and protocols
Bundles of fibres were obtained from the psoas muscles of adult male rabbits that were killed in accordance with UK legislation by an intravenous injection of an overdose of sodium pentobarbitone (200 mg (kg body weight)−1 of Euthatal). The bundles were chemically skinned using 0.5 % Brij 58 and prepared as described previously. A segment of a single fibre (2-4 mm in length) was mounted (using nitro-cellulose glue) between two hooks, one attached to the tension transducer and the other to the motor. To reduce the series-elasticity, the glued fibre ends were then fixed with 8 % glutaraldehyde (containing 5 % Toluidine Blue), by adopting a procedure essentially similar to that described by Hilber & Galler (1998). The fibre was first put in rigor and kept immersed in low ionic strength (100 mm) rigor solution at 20 °C. It was raised above the solution and, by means of a small wire loop of 1 mm diameter, a ∼0.2 μl drop of cold (∼5 °C) glutaraldehyde was applied to each of the glued fibre ends for ∼5 s. The fibre was washed quickly by immersing in the same rigor solution and in a fresh rigor solution held in a second trough at 20 °C, when the cold fixative was seen to sink to the bottom of each trough; the fibre was then relaxed in a third trough. The fixed length was < 15 % of the total fibre length. The unfixed fibre length (Lo) and the fibre width (and in some cases, the fibre depth) were determined by optical microscopy and were used to calculate the fibre cross-sectional area. In addition, the sarcomere length change in a 0.5 mm region of the fibre near the tension transducer was monitored using He-Ne laser diffraction as described previously (see Ranatunga, 2001b). The initial resting sarcomere length was ∼2.6 μm (range 2.55-2.7 μm, in different experiments) and the sarcomere length in steady activation was ∼2.5 μm due to some shortening; the experimental temperature was 10 °C.
The procedure adopted in one type of experiment was basically similar to that used in previous experiments in which hydrostatic pressure (Fortune et al. 1991) and temperature (Ranatunga, 1999a) perturbations were employed to examine force generation. Thus, the tension transients to a standard stretch and release (0.4-0.5 % L0 in different experiments) were examined after a fibre was activated to steady state in the presence of different concentrations of added Pi. A fibre was transferred from relaxing solution, through pre-activating to activating solution, all solutions containing 3.12, 6.25, 12.5 or 25 mm added Pi or no added Pi (control). Control tension was measured before and after the series. On the basis of previous calculations (see Coupland et al. 2001), the Pi concentration within active fibres at this temperature (10 °C) was taken to be 0.735 mm in control solutions (i.e. with no added Pi) and as 0.735 + x mm, where x = added [Pi], in other activating solutions.
In a second type of experiment, the tension transients induced by a series of length steps of different amplitude were examined firstly during a control activation (with no added Pi), then during an activation in the presence of 25 mm added Pi and finally in a control activation. From such data, the T1 (the peak tension reached at the end of a length step) and T2 (the tension level after quick recovery) curves and t1/2 (the half-time of quick tension recovery) tension rise/decay were analysed against length step amplitude. Sarcomere length recording during active contractions was made in these experiments and, as reported by Galler et al. (1996), the sarcomere length change was proportional to the applied fibre length change under these conditions. In the presentations given in the Results, the tensions were plotted against changes in fibre length. Additionally, the fibres were regularly examined under the microscope and an experiment was terminated when evidence of fibre damage and/or irregularities was observed.
Data recording, analyses and presentation
The outputs from the transducer (tension), the motor (fibre length) and the diffractometer (sarcomere length) were examined on two digital cathode ray oscilloscopes and, using CED 1401 (plus) laboratory interface and Signal Averager software (Cambridge Electronic Design Ltd., Cambridge, UK.), stored in a PC-based computer (486, CENCE Systems). The sampling rate was 15 kHz and the duration of a sweep examined was 1 s. Measurements of the steady active tension prior to a length step (T0), the peak tension reached at the end of a length step (T1), the tension level after quick recovery (T2) and the half-time of quick tension recovery (t1/2) were made using the Signal Averager software. Further analyses of the transients, involving bi-exponential curve fitting to the quick recovery phase, were made using Fig.P software (Biosoft). The two exponential components extracted from curve fitting will be referred to as phase 2a (fast) and phase 2b (slow) for compatibility with the nomenclature used in previous studies (Vawda et al. 1999; Ranatunga, 1999b). Thus, the two exponential components, phases 2a and 2b, define the recovery of tension from T1 to T2.
Results
Some of the observations in this paper were first made in preliminary experiments reported elsewhere (see Coupland & Ranatunga, 2000). These experiments showed that the tension transient induced by a moderately rapid stretch of 0.3-1.0 % L0 amplitude was sensitive to inorganic phosphate (Pi). The data presented here are from a separate final set of experiments on eight fibres that were done under more controlled conditions. The mean (± s.e.m.) control steady tension in the eight fibres was 204 (± 21) kN m−2; the tension in the presence of 25 mm added Pi was depressed to a fraction, 0.56 (± 0.035) of the control. The last control tension in a fibre that was taken for analyses was within 10 % of the first, so that the last/first mean ratio for control tension was 1.00 (± 0.02, n = 8).
Tension transients with and without 25 mm added Pi
Figure 1 shows experimental records from one muscle fibre where each panel shows the tension transient (upper trace) and the sarcomere length change (bottom trace) induced by a length step (middle trace). Fig. 1A and C show transients induced by a standard length step (∼0.5 L0) while the fibre was in steady activation in the control solution (no added Pi). Fig. 1B and D give the corresponding transients induced by the same length step when the fibre was activated in the presence of 25 mm added Pi. The steady tension (T0) was reduced to about ∼50 % in the presence of 25 mm added [Pi]. Qualitatively, the tension transients show the features that have been definitively described in the original experiments on tetanised frog muscle fibres (Huxley & Simmons, 1971; Ford et al. 1977). Thus, the tension induced by a length step reaches a peak during the step (T1) and is followed by a partial quick recovery (T2 level). Also, the initial recovery is faster in a release-induced transient than in the corresponding stretch (compare Fig. 1A with 1C). The figure shows that this initial quick recovery after a stretch (tension decay) is faster in the presence of 25 mm added Pi (compare Fig. 1A and B), whereas the initial quick recovery after length release (tension rise) is not much altered by added Pi (compare Fig. 1C with 1D).
Figure 1. Effect of Pi on tension transients.
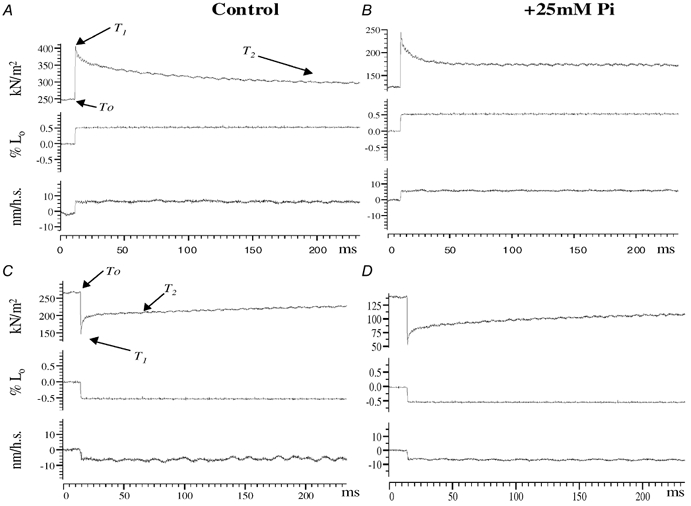
Sample records of tension transients (upper trace in each panel) initiated by a standard length step (∼0.5 % Lo, middle trace) from a single muscle fibre; bottom trace in each panel is the change in half-sarcomere length obtained from He-Ne diffraction (see methods). A (stretch) and C (length release) show records when the fibre was activated in control activating solution (no added Pi). The initial tension recovery (T1 to T2) from a length release is faster than the decay from a stretch, as is well known from original studies in frog fibres (Huxley & Simmons, 1971). B (stretch) and D (length release) show records when the fibre was activated in the presence of 25 mm added Pi. Note that the steady tension before perturbation (T0) is depressed with 25 mm Pi. Records in A and B show that the initial tension decay after stretch is faster in the presence of added Pi; half-time for tension decay is ∼20 ms in the control, whereas it is ∼4 ms with 25 mm Pi. The quick recovery after length release, however, is not much altered in the presence of added Pi (compare C and D).
Figure 2 shows an analysis of the T1 and T2 tensions recorded in experiments on three fibres (Fig. 2A and B). In each panel, the tension ratios T1/T0 and T2/T0 are plotted on the ordinate and the amplitude of the length step as a percentage of the fibre length (L0) is plotted in the abscissa. Figure 2A shows T1 (○) and T2 (•) data obtained under control conditions and includes data collected after previous exposure to 25 mm Pi. The line through the T1 data is the fitted linear regression to the stretch data (and releases < 0.4 % Lo), where the data distribution appeared linear. The line intersects the abscissa at 0.75 % Lo (∼9 nm per half-sarcomere). The T2 curve shows that the zero tension (no tension recovery on release) occurs at −1.3 % Lo (∼16 nm per half-sarcomere). These values are comparable to those obtained by Galler et al. (1996) for different types of rat fibres (∼6 nm and 14–15 nm at 6 °C, from their Fig. 5); the difference may be partly due to temperature. The same lines as in Fig. 2A are shown in Fig. 2B together with the T1 and T2 data obtained with 25 mm Pi. It is seen that the T2 (▪) data deviate from the control line particularly with stretches. The distribution of T1 data (□) is such that the slope of the fitted line (dashed line) is steeper than in the control, indicating an increase of normalised stiffness (ΔT/T0, stiffness/tension ratio) in the presence of added Pi. The increase in stiffness/tension ratio with 25 mm Pi is 33 % (see figure legend); the intercept on the abscissa is 0.6 % Lo (7.5 nm per half-sarcomere).
Figure 2. Characteristics of tension transients versus length step amplitude.
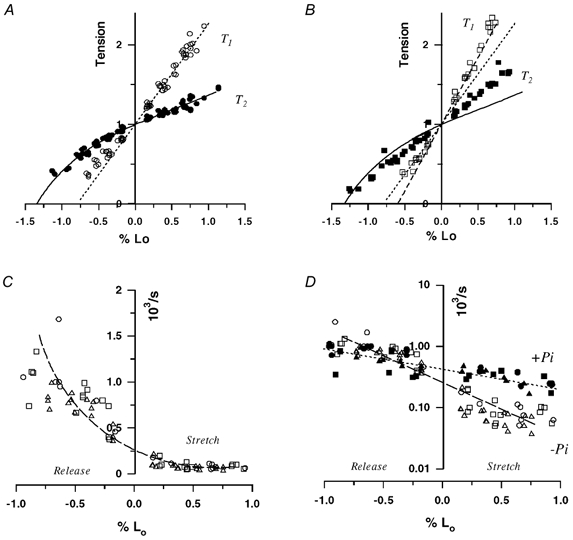
Data are from three fibres, in each of which tension transients at a range of length steps were recorded in control activation and in activation with 25 mm added Pi. A and B, T1 and T2 tensions, measured as shown in Fig. 1, are plotted on the ordinates as ratios of the steady tension (T0) against the applied length changes (% Lo) on the abscissae. A, control data, where the dotted line through the T1 tensions (○) is the fitted linear regression to data (r > 0.9, n = 63) collected with stretches (and releases of < 0.4 % L0). Some data with larger releases are not shown for clarity. The continuous curve through the T2 tensions (•), was fitted by eye (n = 78). The T2 intercept and the T1 intercept (y0) on the abscissa correspond to 1.3 % and 0.75 % L0, respectively. Taking the sarcomere length as 2.5 μm, these translate to 16.3 nm and 9.4 nm per half-sarcomere length, respectively. B, data collected with activation in 25 mm Pi-containing solutions, where the control curves (from A) are also shown for comparison. Compared to the controls, T2 tensions (▪, n = 58) deviate particularly with stretches (plus % L0) and the fitted T1 curve (□, dashed line; r > 0.9, n = 34) has a greater slope. The T1 intercept on the abscissa is 0.6 % L0 (7.5 nm per half-sarcomere) and the [Pi]/control ratio of the T1 slopes from the data is 1.33. C, reciprocal half-time (ms−1, = ×103 s−1) is plotted on the ordinate against the length step amplitude. Data are from three fibres (different symbols, ○, □, ▵) with control activation and the line was fitted by eye. As described more definitively in the original intact frog fibre experiments (Ford et al. 1977), the initial recovery is faster after a length release than after a stretch. D, control data in C (open symbols) are plotted along with the data obtained from same fibres in the presence of 25 mm added Pi (filled symbols). For convenient comparison, the ordinate is logarithmic and the lines were fitted by eye (n = 83 for control and n = 58 for Pi). Note that over a range of length step amplitudes, the initial tension recovery (= decay) after stretch is faster in the presence of Pi than in the controls.
Figure 2C shows the reciprocal half-time of the initial quick tension recovery in control conditions from the above experiments, where different symbols denote the data from different fibres. The rate of recovery was higher after releases than after stretches. The data show that for a length step of 0.4-0.5 % L0, the rate is 75 s−1 (75.3 ± 9.2 s−1, n = 10) for stretch whereas it is ∼10-fold higher (821 ± 31 s−1) for release. The corresponding values obtained by Martyn & Chase (1995) for rabbit psoas at 15 °C were 400 s−1 and 1000 s−1 (for smaller steps) and they may be considered as comparable, since the tension recovery after stretch is more temperature sensitive than for release (see below). Figure 2D shows the same data (open symbols) and the data collected from the same fibres when they were activated in the presence of 25 mm added Pi (filled symbols); for convenient comparison, the data have been plotted on a logarithmic ordinate. The difference between the rates with and without added Pi is clearly marked in the stretch-induced responses. From data obtained with Pi, the mean (± s.e.m.) reciprocal half-time with a ∼0.4 % stretch was 375 ± 24 s−1 (n = 8) whereas it was 662 ± 68 s−1 for a similar release. In comparison with the control data given above, the increase in the rate of recovery after a stretch was significantly higher (P << 0.001, Student's t test) with increased Pi. The difference between the two means for release was not significant.
For comparison with findings from other types of perturbations, the tension transients were also analysed by exponential curve fitting. The initial quick recovery component (T1 to T2 region) from stretch or release required a bi-exponential function and, hence, a curve fit extracted the rate constant and amplitude of two components (phase 2a - fast and phase 2b - slow) from each transient. Figure 3A shows an example of a tension transient with a fitted curve superimposed on it. Figure 3B shows plots of the extracted rates, where the phase 2a data (rate 2a) are shown by small sized symbols; the rate constants have been plotted on a logarithmic ordinate. In general, the data shows that the effect of added Pi (filled symbols) is particularly pronounced in the stretch-induced tension transients, as found from half-time measurements (see Figure 2D). The analysis also shows some other interesting features. Firstly, the rate constant of phase 2a decreases with decrease in length step amplitude in releases (negative strain), but increases with decrease in length step amplitude in stretches (positive strain). This is seen in the control data (open symbols) as well as in the +Pi data (filled symbols). Although the change is less with added Pi, the data with and without added Pi show considerable overlap. Secondly, the distribution of control rate 2b data indicates a difference and an apparent discontinuity between releases and stretches. With stretches, the rate 2b is low (∼20 s−1) and remains constant at different length step amplitudes whereas, it is higher with releases (50-80 s−1), and shows a slight decrease with length step amplitude. Thirdly, compared to the control values of ∼20 s−1, the rate constant of phase 2b in stretches is ∼5-fold higher in the presence of 25 mm added Pi (80-100 s−1): additionally, the +Pi data shows a decrease with increase of stretch amplitude. Such a discrepancy between the control and +Pi data is not seen in the data from length releases. Figure 3C and 3D show respectively the amplitude data for phase 2a and phase 2b. It is seen that the amplitudes of both components increase with the amplitude of the length step, both for stretches and releases and both in the control (open symbols) and with 25 mm added Pi (filled symbols). The amplitude of the two exponential components could also be used to generate T1 and T2 curves as illustrated in Fig. 2A and B and they indicated the same basic findings as presented in Fig. 2 from direct measurement.
Figure 3. Analysis of tension transients by curve fitting.

A, the tension transient (upper trace,) and the sarcomere length change (lower trace) induced by a stretch of 0.5 % Lo in a muscle fibre (+25 mm Pi). A bi-exponential curve fitted to the initial part of the tension record is superimposed on the tension trace. Note that the curve deviates from the later part of the tension record. Curve fitting allowed extraction of two rate constants and amplitudes (for phases 2a - fast and 2b - slow) to define the T1 to T2 region in all transients. B, the calculated rates (s−1) for phases 2a and 2b are plotted as in Fig. 2D. Given the large scatter, rate 2a (smaller symbols) remains similar with (filled symbols) and without added Pi (open symbols), particularly with length releases. The fitted regressions (r > 0.46, n > 57) (continuous line, controls) indicate that log rate (2a) changes monotonically; i.e. log rate 2a decreases with decrease of length step amplitude in releases and with increase in amplitude in stretches. The change, however, is less with added Pi. Values of rate 2b (larger symbols) from length releases are similar between control and +Pi, whereas they are clearly different from stretches. Phase 2b rate is more or less constant with increase of stretch amplitude in the controls but it is higher and shows a decrease with increase of stretch amplitude in the presence of 25 mm Pi. C and D, the amplitudes of phase 2a (C) and phase 2b (D) components plotted as ratios of the steady tension (T0). The amplitudes of both components increase with amplitude of the length perturbation (abscissa), both for length releases (plotted on a positive ordinate) and for stretches (on a negative ordinate). In general, the relative amplitudes remain similar with (filled symbols) and without added Pi (open symbols); however, amplitude with Pi for phase 2a in stretches (C) is somewhat higher than in the controls.
[Pi] dependence of tension transient induced by a standard length step
Figure 4 shows pooled data from experiments on five fibres, in each of which the tension transients to a standard length step (∼0.5 % L0) were examined in the control (no added Pi) and at four different levels of added [Pi]. Figure 4A shows the [Pi] dependence of the steady tension (•) and the stiffness (○, calculated from the peak tension change induced by the stretch, see figure legend) from these experiments. Results show that the steady tension at ∼25 mm Pi is decreased to about 50–60 % of the control. The stiffness is decreased to a lesser extent (to ∼70 %), as reported in previous studies in which stiffness was measured by sinusoidal length oscillation (Martyn & Gordon, 1992; Dantzig et al. 1992 and references therein). This discrepancy between the tension change and the stiffness change was such that the stiffness/tension ratio (×) increased with increasing [Pi]; this is indicated by the dotted line with a positive slope. Calculations showed that the stiffness/ tension ratio was 1.34 with 25 mm Pi, which is comparable to the change obtained in the slope of the T1 curve with 25 mm Pi in Fig. 2.
Figure 4. [Pi] dependence of tension, stiffness and initial tension recovery.
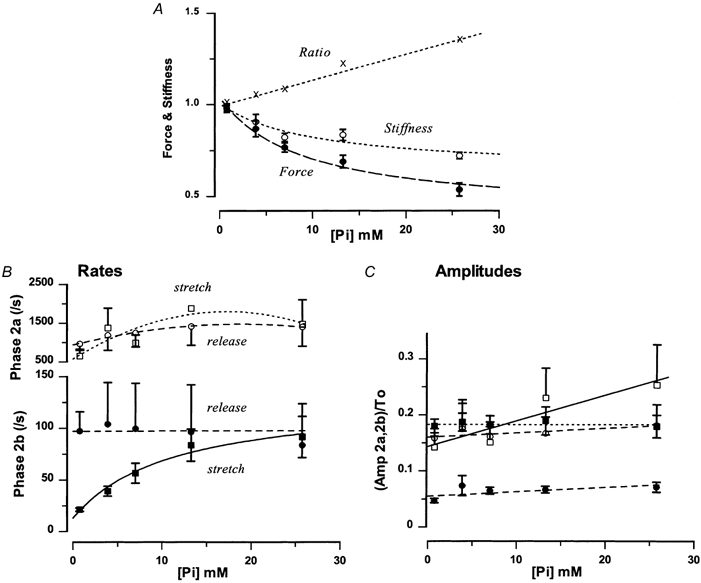
A, the mean (± s.e.m.) steady tension (•) and the mean (± s.e.m.) stiffness (○) recorded at different levels of [Pi] are shown. Data are from five fibres in each of which data were collected at each level of [Pi]. Stiffness was determined as the tension change (i.e. as ΔT = T1 - T0) to a standard stretch (0.4-0.5 % L0)) and both the steady tension and the stiffness are plotted as ratios of that in the control solution (no added Pi). The abscissa is the [Pi] within active fibres calculated as given in Methods (see Coupland et al. 2001). A hyperbolic curve was fitted to each set of data. Note that both stiffness and tension are depressed with added Pi, but the tension depression is greater than the stiffness change. Consequently, the average stiffness/tension ratio (ΔT/T0) increases with added [Pi], as shown by the (×) symbols and the dotted line. The average ratio for 25 mm [Pi] is 1.34, which compares with the ratio of the T1 slopes (1.33) given in Fig. 3. B, the initial recovery of tension (the decay in stretches and rise in releases, between T1 and T2) was analysed by fitting a bi-exponential curve (see Fig. 3A). The two rate constants (for phases 2a and 2b) for different [Pi] are shown as means (± s.e.m.) where, rate 2a (□, ○ - upper ordinate) and rate 2b (▪, • - lower ordinate) are plotted separately for stretches (□, ▪) and releases (○, •). For clarity, plus or minus error bars are not shown for some data points. The slower phase 2b rate (▪, continuous curve) from stretches (only) is correlated with [Pi] and the hyperbolic curve gives a maximum rate of 129 s−1, minimum of 13 s−1 and half-maximum [Pi] of 11 mm (continuous curve through the points, r = 0.77). Others show no correlation with [Pi] (dotted and dashed curves). (The hyperbolic relation was also found for reciprocal half-time data from stretches; it corresponded to a maximum rate of 760 s−1, a minimum rate of 99 s−1 and a half-maximal [Pi] of 11 mm. The data from releases showed no correlation with [Pi] (P > 0.05)). C, the amplitudes of the two exponential components for stretches (□, ▪) and releases (○, •) are plotted separately against [Pi]; each amplitude is plotted as a ratio of steady force (T0). Both amplitudes of release and of phase 2b from stretches show no correlation (dotted and dashed lines, P > 0.05), but the amplitude of phase 2a from stretches is positively correlated (□, continuous line, P < 0.05).
As expected from the previous type of experiment (Fig. 1 and 2), the initial tension recovery became faster with increased [Pi] in the stretch-induced transients, but it was not much changed in the transients induced by releases. The rate constant data extracted by curve fitting (see Fig. 3A) are plotted against [Pi] in Figure 4B. The data show that the rate of phase 2a - from release (○) and from stretch (□) was high (1000-2000 s−1), variable and showed no clear dependence on [Pi]. Also, the rate 2b from release (•) was variable (∼100 s−1) but showed no apparent dependence on [Pi]. In contrast, the rate of the phase 2b of the stretch-induced transient (▪) showed a clear hyperbolic dependence on [Pi]. The phase 2b rate constant with stretches increased from ∼15 s−1 with no [Pi] to ∼130 s−1 with excess [Pi]; [Pi] for half-maximum was 11 mm. Figure 4C shows the amplitudes of the two exponential components for releases and stretches. Only the amplitude of phase 2a with stretches (□) showed a positive correlation (continuous line, see figure legend for details). The basic finding shown above is that the speed of recovery of the stretch-induced tension transient increased with changing [Pi] in a concentration-dependent manner, whereas that of the length release-induced transient did not. Interestingly, the reciprocal half-time of initial tension decay after a stretch also increased non-linearly with [Pi] and a hyperbolic curve could be fitted to describe the data (not illustrated, see Fig. 4 legend).
Discussion
A number of previous studies have reported that the stretch-induced tension transient is sensitive to added [Pi] (Iwamoto, 1995; Sun et al. 1996). Our study shows that the initial recovery phase of the tension transient induced by stretch of different amplitudes is markedly sensitive to changes in [Pi] so that the initial tension decline becomes faster with increasing [Pi]. Such [Pi] sensitivity was not apparent in the tension transients induced by length release. Since the recovery after release is considerably faster than after a stretch (see Fig. 2C), it may be that it is not completely insensitive to [Pi]. Moreover, the effect of truncation may have concealed a change in the phase 2 tension recovery after release. What is clear, however, is that the Pi effects are much less pronounced on the tension transient after a release than after a stretch (see Fig. 2D). The differential effect of Pi is such that the well known asymmetry in the time course of the stretch- and release-induced responses becomes less marked in the presence of added Pi. It is interesting to note that this is also evident in the data on rabbit fibres of Abbott & Steiger (1977), who used activating solutions containing 20 mm Pi in their experiments.
[Pi] dependence of the initial tension recovery after a standard stretch shows that the increase in the speed of recovery with increasing [Pi] is concentration dependent. Analysis by exponential curve fitting shows a clear relationship with [Pi] for the slower of the two components of recovery after stretch (phase 2b), and it saturates at higher [Pi]; the faster phase 2a is invariant with [Pi] (see Fig. 4B). The hyperbolic curve fitted to this phase 2b rate constant data gives a maximum of ∼130 s−1 and a minimum of ∼15 s−1. Although there was considerable scatter in the data, the normalised amplitude of this component after stretch was not [Pi] dependent, indicating that phase 2b amplitude is directly proportional to Pi -induced depression of steady tension (Fig. 4C).
Comparison with other perturbation studies
Several studies using different perturbation techniques have led to a thesis that active crossbridge force generation in isometric muscle fibres occurs in a molecular step prior to the release of Pi during ATP hydrolysis (see Introduction). The minimal scheme for actomyosin ATPase and the crossbridge cycle that could account for the basic observations in these studies is given below (Scheme 1; for details, see Dantzig et al. 1992 and Zhao & Kawai, 1994). The scheme could also account for the effect of Pi on the sigmoidal temperature dependence of steady active tension in muscle fibres (Coupland et al. 2001).
Scheme 1.
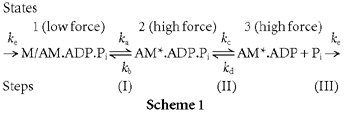
The forward rate constant (ka) of step I is a moderately fast, temperature-sensitive (endothermic) force-generating step whereas its reverse rate constant (kb) is not temperature sensitive (Zhao & Kawai, 1994; Ranatunga, 1999a). Step II is a rapid release/binding (kc/kd) of phosphate and step III, i.e. AM*.ADP → M/AM.ADP.Pi, is taken as irreversible and rate limiting (ke) representing all the steps necessary to reprime the crossbridges for the next cycle. State I (M/AM.ADP.Pi) is a low force state whereas states II and III (AM*.ADP.Pi and AM*.ADP) are high and equal force states. Thus, the sum of the fractional occupancy of states II and III is taken to be proportional to muscle force (see Dantzig et al. 1992; Zhao & Kawai, 1994). With this scheme, the [Pi] dependence of the observed rate of tension recovery after a standard perturbation would be hyperbolic and given by: Observed rate = ka + kb[Pi]/(Kd + [Pi]), so that it will increase with [Pi] and show saturation at higher [Pi]; the minimum rate at zero [Pi] is ka and the maximum rate (with high [Pi]) is ka + kb in the above Scheme 1 (Kd = dissociation constant of Pi).
The analogous data for step I in the Scheme 1 for rabbit psoas fibres - as obtained in the different perturbation studies - are summarised in Table 1, where the phase 2b rate of tension decay from stretches (present study) are given in the last row. The data show considerable basic correspondence among different studies regarding characterisation of the step 1 in relation to [Pi] dependence. The temperature coefficient for this step was found to be high in different studies (Q10 3.7-6.8: Dantzig et al. 1992; Ranatunga, 1996, 1999b; Zhao & Kawai, 1994). The normalised amplitude of the exponential component increased with [Pi] in temperature jump experiments (Ranatunga, 1999a), but was invariant with [Pi] in pressure release (Fortune et al. 1991), phosphate release (Dantzig et al. 1992) and in stretch experiments (present study). The rate constants from temperature jump experiments are also in the higher range, and the discrepancy, probably, cannot be entirely due to the slightly higher experimental temperature. It may be that a temperature jump perturbs steps other than the force generation (step I above). Thus, it is important to note the underlying differences between the perturbations. Rapid changes in Pi concentrations from caged compounds (Dantzig et al. 1992) and Pi jumps (Tesi et al. 2000) specifically perturb the Pi -release step (step II). Length perturbation including sinusoidal length oscillation (Zhao & Kawai, 1994) is limited to attached crossbridge states, strain being transmitted through the actin filaments, although the recovery probably indicates those steps that are strain-sensitive. Temperature jump and hydrostatic pressure-release can perturb not only attached steps but also any steps in the ATPase pathway that are temperature or pressure sensitive, respectively. Indeed, the open to closed transition in myosin S1 is perturbed by temperature in solution studies (Werner et al. 1999; Malnasi-Csizmadia et al. 2000) that would of course correspond to a pre-force generating step(s) in Scheme 1. Therefore, whereas the basic correspondence seen in the data in Table 1 may be significant, the occurrence of small differences in them is probably not surprising.
Table 1.
Summary of the kinetic data from various perturbation studies on skinned rabbit psoas at ∼10 °C, for the Pi-sensitive, pre-phosphate release, force generation step
| Perturbation | Min. rate (s−1) | Max. rate (s−1) | Kd (mm) | Q10 | Source |
|---|---|---|---|---|---|
| Hydrostatic pressure (12 °C)* | 17 (∼25)* | 52 (∼82)* | 4 | ∼4 | Fortune et al. 1991 (Q10–Fortune et al. 1989). |
| Sinusoidal length (10 °C) | ∼20 | ∼80 | 8 | 4 | Zhao & Kawai, 1994 (Fig. 8) |
| Phosphate release (10 °C) | 21 | 123 | 12 | 3.7 | Dantzig et al. 1992 |
| Temperature jump (12 °C) | 50 | 185 | 9 | ∼4 | Ranatunga, 1996, 1999a |
| Length step (stretch) (10 °C) phase 2b slow | 13 | 129 | 11 | 2.6–3.9 | Present study (Fig. 4B) (Q10–Abbott & Steiger, 1977; Piazzesi et al. 1992) |
The observed rate increased with [Pi] and the data give the minimum and maximum rate constants determined by hyperbolic curve fit to the observed rates (phase 2b) at various [Pi]. [Pi] for half-maximal change is given as Kd.
In a subsequent study using pressure jump, where the tension recording technique was probably improved, we obtained a rate constant with no added [Pi] of 27 s−1 (see Fortune et al. 1994). An approximate correction on that basis gives minimum and maximum rate constants shown within brackets for pressure perturbation. Q10 values for stretch were taken from studies on insect, rabbit psoas (skinned) and frog (intact) fibres; Q10 for length release transient is low ∼2 (Ford et al. 1977; Piazzesi et al. 1992). Note that the equilibrium constant (as, min rate/(max rate – min rate)) for the step is lowest with stretch perturbation (< 0.15); this is probably the expected finding since work is done during the step.
As mentioned in the Introduction, muscle force during isometric contraction is maintained by equilibrium between low and high force crossbridge states, so that sudden shortening (negative strain) that reduces the force will perturb the equilibrium and lead to a quick rise (recovery) of tension (Huxley & Simmons, 1971). Conversely, a stretch (positive strain) that increases force would also perturb the equilibrium but lead to a quick decline of tension; the stretch-induced force responses, however, remain less understood. Applying this to step I above (i.e. to AM.ADP.Pi ⇌ AM*.ADP.Pi), the rate of quick tension recovery after a length perturbation is expected to increase with [Pi] and show saturation at high [Pi]. This was indeed found but only with respect to the slow phase 2b component induced by stretches (positive strain). It may be argued that such a differential Pi sensitivity (asymmetry) indicates that stretch and length release perturb two different molecular steps in the crossbridge (ATPase) cycle. In general, this would be consistent with the differences in their temperature sensitivities (see above) and also with the asymmetry in the time courses of stretch-induced and release-induced transients (Fig. 1 and Fig. 2). The fast phase 2a probably represents non-specific strain effects on all the attached crossbridge states.
The basic observation made above is that the slow phase 2b in the stretch-induced tension transient represents perturbation of the Pi -sensitive force generation step, whereas the identity of the tension recovery after length release remains unclear. In their experiments using sinusoidal analysis, Kawai and colleagues (Kawai et al. 1993; Zhao & Kawai, 1994; Wang & Kawai, 2001) correlated the force generation step to phase 3 in length release transients. Phase 3 was not prominent in our records and the analyses were limited to phase 2. The cause of this discrepancy between studies is unclear; probably this is not a major contradiction if the rate constants of these phases are not vastly different.
Asymmetry in tension behaviour and uncertainties
A general implication from our findings is that different molecular states/steps in the crossbridge cycle are sensitive to positive and negative strains but the exact interpretations are not readily apparent. A possible explanation is that during length releases (rapid shortening), operation of a more rapid molecular step elsewhere releases the negative strain in the filaments (+crossbridges) and this shields the AM.ADP.Pi ⇌ AM*.ADP.Pi transition from being exposed to negative strain. A molecular step that is potentially (negative) strain sensitive is a step coupled to ADP release (see Dantzig et al. 1991; Regnier et al. 1995; Geeves & Holmes, 1999). Thus Scheme 1 may be extended to include further step(s) - a transition between two AM*.ADP states or ADP release step or a step after ADP release - which, occurring after Pi release (and slow step) in the cycle, would be insensitive to [Pi]. The latter possibility has been proposed and discussed from other studies (see Zhao & Kawai, 1994). However, the recent findings of Piazessi et al. (2002) rule out crossbridge detachment as a possible cause of tension rise after length release. On the other hand, a marked increase of crossbridge detachment rate during shortening (negative strain) was indeed a characteristic feature of Huxley's (1957) original formulations. Moreover, these formulations have been used profitably in more recent studies in the analyses of the force-velocity relation, work output and efficiency determinations in muscle fibres (see He et al. 1999, 2000). Further work is necessary to identify the molecular step that underlies the initial quick tension rise after length release in muscle fibres and whether it represents another crossbridge force generation step.
Tesi et al. (2000) reported an interesting observation from their experiments on myofibrils that the rate of tension change was different when a given final [Pi] was approached from a higher versus a lower [Pi]. Basically, the tension change (tension decline) obtained when [Pi] was increased to a certain level was faster than the tension change (tension rise) obtained when [Pi] was decreased to the same final [Pi]. Our finding that an apparent asymmetry exists in the [Pi] dependence of the tension transients induced by positive and negative strains may also be related to their finding. However, the underlying causes of such asymmetries and whether they can be modelled by any linear crossbridge (ATPase) scheme remain unclear at present.
Acknowledgments
We thank the Wellcome Trust for the support of our research and Professor M. A. Geeves (University of Canterbury), Professor Y. E. Goldman (University of Pennsylvania) and Dr Gerald Offer (University of Bristol) for reading and making useful comments on the manuscript.
References
- Abbott RH, Steiger GJ. Temperature and amplitude dependence of tension transients in glycerinated skeletal and insect fibrillar muscle. Journal of Physiology. 1977;266:13–42. doi: 10.1113/jphysiol.1977.sp011754. [DOI] [PMC free article] [PubMed] [Google Scholar]
- Bershitsky SY, Tsaturyan AK. Tension responses to joule temperature jump in skinned rabbit muscle fibres. Journal of Physiology. 1992;447:425–448. doi: 10.1113/jphysiol.1992.sp019010. [DOI] [PMC free article] [PubMed] [Google Scholar]
- Bershitsky SY, Tsaturyan AK, Bershitskaya ON, Mashanov GI, Brown P, Burns R, Ferenczi MA. Muscle force is generated by myosin heads stereospecifically attached to actin. Nature. 1997;388:188–190. doi: 10.1038/40651. [DOI] [PubMed] [Google Scholar]
- Cooke R, Pate E. The effects of ADP and phosphate on the contraction of muscle fibers. Biophysical Journal. 1985;48:789–798. doi: 10.1016/S0006-3495(85)83837-6. [DOI] [PMC free article] [PubMed] [Google Scholar]
- Coupland ME, Puchert E, Ranatunga KW. Temperature dependence of active tension in mammalian (rabbit psoas) muscle fibres: effect of inorganic phosphate. Journal of Physiology. 2001;510:247–278. doi: 10.1111/j.1469-7793.2001.00879.x. [DOI] [PMC free article] [PubMed] [Google Scholar]
- Coupland ME, Ranatunga KW. Stretch-induced tension response and delayed tension rise in skinned rabbit psoas muscle fibres. Journal of Physiology. 2000;526P:31P. [Google Scholar]
- Dantzig JA, Goldman YE, Millar NC, Lacktis J, Homsher E. Reversal of the cross-bridge force-generating transition by photogeneration of phosphate in rabbit psoas muscle fibres. Journal of Physiology. 1992;451:247–278. doi: 10.1113/jphysiol.1992.sp019163. [DOI] [PMC free article] [PubMed] [Google Scholar]
- Davis JS, Harrington W. Force generation by muscle fibers in rigor: a laser temperature-jump study. Proceedings of the National Academy of Sciences of the USA. 1987;84:975–979. doi: 10.1073/pnas.84.4.975. [DOI] [PMC free article] [PubMed] [Google Scholar]
- Dantzig JA, Hibberd ME, Trentham DR, Goldman YE. Crossbridge kinetics in the presence of MgADP investigated by photolysis of caged ATP in rabbit psoas muscle fibres. Journal of Physiology. 1991;432:639–680. doi: 10.1113/jphysiol.1991.sp018405. [DOI] [PMC free article] [PubMed] [Google Scholar]
- Davis JS, Rodgers ME. Indirect coupling of phosphate release to de-novo tension generation during muscle contraction. Proceedings of the National Academy of Sciences of the USA. 1995;92:10482–10486. doi: 10.1073/pnas.92.23.10482. [DOI] [PMC free article] [PubMed] [Google Scholar]
- Ford LE, Huxley AF, Simmons RM. Tension responses to sudden length change in stimulated frog muscle fibres near slack length. Journal of Physiology. 1977;269:441–515. doi: 10.1113/jphysiol.1977.sp011911. [DOI] [PMC free article] [PubMed] [Google Scholar]
- Fortune NS, Geeves MA, Ranatunga KW. Tension transients initiated by pressure perturbation in isolated skinned muscle fibres. Journal of Physiology. 1989;418P:158P. [Google Scholar]
- Fortune NS, Geeves MA, Ranatunga KW. Tension responses to rapid pressure release in glycerinated rabbit muscle fibers. Proceedings of National Academy of Science. 1991;88:7323–7327. doi: 10.1073/pnas.88.16.7323. [DOI] [PMC free article] [PubMed] [Google Scholar]
- Fortune NS, Geeves MA, Ranatunga KW. Contractile activation and force generation in skinned rabbit muscle fibres: effects of hydrostatic pressure. Journal of Physiology. 1994;474:283–290. doi: 10.1113/jphysiol.1994.sp020021. [DOI] [PMC free article] [PubMed] [Google Scholar]
- Galler S, Hiber K, Pette D. Force responses following stepwise length changes of rat skeletal muscle fibre types. Journal of Physiology. 1996;493:219–227. doi: 10.1113/jphysiol.1996.sp021377. [DOI] [PMC free article] [PubMed] [Google Scholar]
- Geeves MA, Holmes KC. Structural mechanism of muscle contrcation. Annual Reviews of Biochemistry. 1999;68:687–728. doi: 10.1146/annurev.biochem.68.1.687. [DOI] [PubMed] [Google Scholar]
- Goldman YE, McCray JA, Ranatunga KW. Transient tension changes initiated by laser temperature jumps in rabbit psoas muscle fibres. Journal of Physiology. 1987;392:71–95. doi: 10.1113/jphysiol.1987.sp016770. [DOI] [PMC free article] [PubMed] [Google Scholar]
- Gutfreund H, Ranatunga KW. Simulation of molecular steps in muscle force generation. Proceedings of the Royal Society B. 1999;266:1471–1475. [Google Scholar]
- He Z-H, Bottinelli R, Pellegrino MA, Ferenczi MA, Reggiani C. ATP consumption and efficiency of human single muscle fibres with different myosin isoform composition. Biophysical Journal. 2000;79:945–961. doi: 10.1016/S0006-3495(00)76349-1. [DOI] [PMC free article] [PubMed] [Google Scholar]
- He Z-H, Chillingworth RK, Brune M, Corrie JET, Webb MR, Ferenczi MA. The efficiency of contraction in rabbit skeletal muscle fibres, determined from the rate of release of inorganic phosphate. Journal of Physiology. 1999;517:839–854. doi: 10.1111/j.1469-7793.1999.0839s.x. [DOI] [PMC free article] [PubMed] [Google Scholar]
- Hibberd MG, Dantzig JA, Trentham DR, Goldman YE. Phosphate release and force generation in skeletal muscles fibers. Science. 1985;228:1317–1319. doi: 10.1126/science.3159090. [DOI] [PubMed] [Google Scholar]
- Hilber K, Galler S. Improvement of the measurements on skinned muscle fibres by fixation of the fibre ends with glutaraldehyde. Acta Physiologica Scandinavica. 1998;19:365–372. doi: 10.1023/a:1005393519811. [DOI] [PubMed] [Google Scholar]
- Huxley AF. Muscle structure and theories of contraction. Progress in Biophysics. 1957;7:285–318. [PubMed] [Google Scholar]
- Huxley AF, Simmons RM. Proposed mechanism of force generation in striated muscle. Nature. 1971;233:533–538. doi: 10.1038/233533a0. [DOI] [PubMed] [Google Scholar]
- Huxley AF, Tideswell S. Filament compliance and tension transients in muscle. Journal of Muscle Research and Cell Motility. 1996;17:507–511. doi: 10.1007/BF00123366. [DOI] [PubMed] [Google Scholar]
- Irving M, Allen TStC, Sabido-David C, Craik JS, Brandmeir B, Kendrick-Jones J, Corrie JET, Trentham DR, Goldman YE. Tilting of the light-chain region of myosin during step length changes and active force generation in skeletal muscle. Nature. 1995;375:688–691. doi: 10.1038/375688a0. [DOI] [PubMed] [Google Scholar]
- Irving M, Lombardi V, PiaESIZZ G, Ferenczi MA. Myosin head movements are synchronous with elementary force-generating process in muscle. Nature. 1992;357:156–158. doi: 10.1038/357156a0. [DOI] [PubMed] [Google Scholar]
- Iwamoto H. Strain sensitivity and turnover rate of low force cross-bridges in contracting skeletal muscle fibers in the presence of phosphate. Biophysical Journal. 1995;68:243–250. doi: 10.1016/S0006-3495(95)80180-3. [DOI] [PMC free article] [PubMed] [Google Scholar]
- Kawai M, Halvorson HR. Two step mechanism of phosphate release and the mechanism of force generation in chemically skinned fibers of rabbit psoas muscle. Biophysical Journal. 1991;59:329–342. doi: 10.1016/S0006-3495(91)82227-5. [DOI] [PMC free article] [PubMed] [Google Scholar]
- Kawai M, Saeki Y, Zhao Y. Crossbridge scheme and the kinetic constants of elementary steps deduced from chemically skinned papillary and trabecular muscles from the ferret. Circulation Research. 1993;73:35–50. doi: 10.1161/01.res.73.1.35. [DOI] [PubMed] [Google Scholar]
- Lombardi V, PiaESIZZ G, Linari M. Rapid regeneration of the actin-myosin power stroke in contracting muscle. Nature. 1992;355:638–641. doi: 10.1038/355638a0. [DOI] [PubMed] [Google Scholar]
- Martyn DA, Chase PB. Faster force transient kinetics at submaximal Ca2+ activation of skinned psoas fibers from rabbit. Biophysical Journal. 1995;68:235–242. doi: 10.1016/S0006-3495(95)80179-7. [DOI] [PMC free article] [PubMed] [Google Scholar]
- Martyn DA, Gordon AM. Force and stiffness in glycerinated rabbit psoas fibers. Journal of General Physiology. 1992;99:795–816. doi: 10.1085/jgp.99.5.795. [DOI] [PMC free article] [PubMed] [Google Scholar]
- Malnasi-Csizmadia A, Woolley RJ, Bagshaw CR. Resolution of conformational states of Dictyostelium myosin II motor domain using tryptophan (W501) mutants: Implications for the open-closed transition identified by crystallography. Biochemistry. 2000;39:16135–16146. doi: 10.1021/bi001125j. [DOI] [PubMed] [Google Scholar]
- Matsubara I, Umazume Y, Yagi N. Lateral filamentary spacing in chemically skinned murine muscles during contraction. Journal of Physiology. 1985;360:135–148. doi: 10.1113/jphysiol.1985.sp015608. [DOI] [PMC free article] [PubMed] [Google Scholar]
- Maughan DW, Godt RE. Stretch and radial compression studies on relaxed skinned muscle fibers of the frog. Biophysical Journal. 1979;28:391–402. doi: 10.1016/S0006-3495(79)85188-7. [DOI] [PMC free article] [PubMed] [Google Scholar]
- Piazzesi G, Francini F, Linari M, Lombardi V. Tension transients during steady lengthening of tetanized muscle fibres of the frog. Journal of Physiology. 1992;445:659–711. doi: 10.1113/jphysiol.1992.sp018945. [DOI] [PMC free article] [PubMed] [Google Scholar]
- Piazzesi G, Reconditi M, Linari M, Lucil L, Sun Y-B, Narayan T, Boesecke P, Lombardi V, Irving M. Mechanism of force generation by myosin heads in skeletal muscle. Nature. 2002;415:659–662. doi: 10.1038/415659a. [DOI] [PubMed] [Google Scholar]
- Ranatunga KW. Endothermic force generation in fast and slow mammalian (rabbit) muscle fibers. Biophysical Journal. 1996;71:1905–1913. doi: 10.1016/S0006-3495(96)79389-X. [DOI] [PMC free article] [PubMed] [Google Scholar]
- Ranatunga KW. Effects of inorganic phosphate on endothermic force generation in muscle. Proceedings of the Royal Society B. 1999a;266:1381–1385. doi: 10.1098/rspb.1999.0791. [DOI] [PMC free article] [PubMed] [Google Scholar]
- Ranatunga KW. Endothermic force generation in skinned cardiac muscle from rat. Journal of Muscle Research and Cell Motility. 1999b;20:489–490. doi: 10.1023/a:1005509731881. [DOI] [PubMed] [Google Scholar]
- Ranatunga KW. Effect of phosphate on force recovery following length steps in muscle fibers. Biophysical Journal. 2001a;80:275a. [Google Scholar]
- Ranatunga KW. Sarcomeric visco-elasticity of chemically skinned skeletal muscle fibres of the rabbit at rest. Journal of Muscle Research and Cell Motility. 2001b;22:399–414. doi: 10.1023/a:1014502610259. [DOI] [PubMed] [Google Scholar]
- Regnier M, Morris C, Homsher E. Regulation of the crossbridge transition from a weakly to strong bound state in skinned rabbit muscle fibers. American Journal of Physiology. 1995;269:C1532–1539. doi: 10.1152/ajpcell.1995.269.6.C1532. [DOI] [PubMed] [Google Scholar]
- Rüegg JC, Schädler M, Steiger GJ, Müller G. Effects of inorganic phosphate on the contractile mechanism. Pflügers Archiv. 1971;325:359–364. doi: 10.1007/BF00592176. [DOI] [PubMed] [Google Scholar]
- Sun PL, Goldman YE, Shuman H. Phosphate release and length step transients in rabbit skinned psoas muscle fibers. Biophysical Journal. 1996;70:A126. [Google Scholar]
- Tesi C, Colomo F, Nencini S, Piroddi N, Poggesi C. The effect of inorganic phosphate on force generation in single myofibrils from rabbit skeletal muscle. Biophysical Journal. 2000;78:3081–3092. doi: 10.1016/S0006-3495(00)76845-7. [DOI] [PMC free article] [PubMed] [Google Scholar]
- Vawda F, Geeves MA, Ranatunga KW. Force generation upon hydrostatic pressure release in tetanized intact frog muscle fibres. Journal of Muscle Research and Cell Motility. 1999;20:477–488. doi: 10.1023/a:1005565917768. [DOI] [PubMed] [Google Scholar]
- Wang G, Kawai M. Effect of temperature on elementary steps of the cross-bridge cycle in rabbit soleus slow twitch muscle fibres. Journal of Physiology. 2001;531:219–234. doi: 10.1111/j.1469-7793.2001.0219j.x. [DOI] [PMC free article] [PubMed] [Google Scholar]
- Werner J, Urbanke C, Wray J. Fluorescence temperature-jump studies of myosin S1 structures. Biophysical Journal. 1999;76:A146. [Google Scholar]
- Xu S, Brenner B, Yu LC. State-dependent radial elasticity of attached cross-bridges in single skinned fibres of rabbit psoas muscle. Journal of Physiology. 1993;461:283–299. doi: 10.1113/jphysiol.1993.sp019514. [DOI] [PMC free article] [PubMed] [Google Scholar]
- Zhao Y, Kawai M. Kinetic and thermodynamic studies of the cross-bridge cycle in rabbit psoas muscle fibers. Biophysical Journal. 1994;67:1655–1668. doi: 10.1016/S0006-3495(94)80638-1. [DOI] [PMC free article] [PubMed] [Google Scholar]