

Abstract
In addition to activating more Ca2+ release sites via voltage sensors in the t-tubular membranes, it has been proposed that more depolarised voltages enhance activation of Ca2+ release channels via a voltage-dependent increase in Ca-induced Ca2+ release (CICR). To test this, release permeability signals in response to voltage-clamp pulses to two voltages, –60 and –45 mV, were compared when Δ[Ca2+] was decreased in two kinds of experiments. (1) Addition of 8 mm of the fast Ca2+ buffer BAPTA to the internal solution decreased release permeability at –45 mV by > 2-fold and did not significantly affect Ca2+ release at –60 mV. Although some of this decrease may have been due to a decrease in voltage activation at –45 mV – as assessed from measurements of intramembranous charge movement – the results do tend to support a Ca-dependent enhancement with greater depolarisations. (2) Decreasing SR (sarcoplasmic reticulum) Ca content ([CaSR]) should decrease the Ca2+ flux through an open channel and thereby Δ[Ca2+]. Decreasing [CaSR] from > 1000 μm (the physiological range) to < 200 μm decreased release permeability at –45 mV relative to that at –60 mV by > 6-fold, an effect shown to be reversible and not attributable to a decrease in voltage activation at –45 mV. These results indicate a Ca-dependent triggering of Ca2+ release at more depolarised voltages in addition to that expected by voltage control alone. The enhanced release probably involves CICR and appears to involve another positive feedback mechanism in which Ca2+ release speeds up the activation of voltage sensors.
In 1973, Schneider & Chandler described a non-linear capacitance termed intramembranous charge movement in skeletal muscle. Later, Adrian & Peres (1977; 1979) identified two components of charge movement, an early component with an exponential time course termed Qβ and a delayed ‘hump’ component termed Qγ. Several lines of evidence support the idea that Qγ charge is caused by movement of voltage sensors (dyhydropyridine receptors or DHPRs) in the t-tubular membrane that activate Ca2+ release channels (ryanodine receptors or RyRs) in the closely apposed sarcoplasmic reticulum (SR) membrane, presumably via mechanical coupling (Huang, 1982; Hui, 1983; Vergara & Caputo, 1983; Hui & Chandler, 1990, 1991; Pape & Carrier, 2002).
In response to a voltage-clamp step to more depolarised potentials (> −57 mV), the permeability of the SR for Ca2+ release (denoted release permeability) reaches an early peak followed by a rapid decline to a steady level. This decline is due to Ca inactivation of Ca2+ release, a negative feedback mechanism of Ca2+ on the Ca2+ release channels (Baylor et al. 1983; Simon et al. 1985, 1991; Schneider & Simon, 1988; Jong et al. 1995a). Following the observation of Block et al. (1988) that every other RyR in the junctional region is not coupled to DHPRs, Ríos & Pizarro (1988) proposed that the peak of release permeability arises from non-coupled RyRs activated by Ca-induced Ca2+ release (denoted CICR) and closed by Ca inactivation. According to their idea, the steady level is due to voltage-activated, coupled RyRs that are neither activated nor inactivated by calcium. A seemingly direct experimental approach to evaluate this idea has been to add a high concentration of a high affinity Ca2+ buffer, either BAPTA or fura-2. Experiments in Schneider's laboratory indicated that 1–2 mm BAPTA or fura-2 eliminated the peak component, consistent with the removal of CICR (Jacquemond et al. 1991). In contrast, experiments of Baylor et al. (1983) indicated that 2–4 mm fura-2 did not significantly change the magnitude of the peak and may have actually increased it somewhat. In addition, 2–4 mm fura-2 significantly increased the steady component of release so that it was about the same magnitude as the early peak, an effect attributed to a decrease in Ca inactivation (Hollingworth et al. 1992; Jong et al. 1993; Pape et al. 1993). Despite efforts to use similar conditions, the discrepancy with the results from Schneider's laboratory was never resolved and it was suggested that a difference in fibre conditions may have been responsible. It should be noted that the results of Baylor and colleagues do not rule out CICR at the peak of release permeability, rather they raise doubts about possible evidence in favour of this idea. Pape et al. (1993) and Jong et al. (1993) did observe a large decrease in Ca2+ release when the concentration of fura-2 was increased to 6–8 mm, but it was not possible to rule out a pharmacological effect due to the high concentration of fura-2. With regard to this latter possibility, it should be noted that Stroffekova & Heiny (1997a) observed that 10 mm BAPTA produced a large decrease in total intramembranous charge and the loss of a kinetically distinct Qγ ‘hump’ component.
One result that contradicts the initial hypothesis of Ríos & Pizarro (1988) is that the time course of release permeability at less depolarised potentials does not have a distinct peak component (e.g. ≥ 57 mV in our fibres). In order to account for this, Ríos and colleagues proposed that the calcium trigger for CICR requires a high density of voltage-activated Ca2+ release channels only present with more depolarised potentials (Shirokova et al. 1996; Ríos & Stern, 1997; this model is discussed in detail in the Discussion of this article). One difficulty with the initial hypothesis and this amendment is that the release permeability waveform and its voltage dependence can also be explained by a uniform population of RyRs that can all be inactivated (see e.g. Jong et al. 1995a). In this case, the steady level at more depolarised potentials arises because an equilibrium is reached between the rates of inactivation of Ca2+ release channels and recovery from inactivation. The brief review above indicates that there is no clear evidence supporting the interpretation that the peak and steady components reflect triggering by calcium and voltage, respectively. Without this support, it is questionable whether evidence based on manoeuvres influencing the ratio of the peak to steady components of release indicate that CICR is involved in the peak component as proposed by Ríos and colleagues (reviewed by Ríos & Stern, 1997).
The aim of this article was to more directly evaluate whether or not the peak of release permeability does in fact involve some type of extra Ca-dependent activation that is only present at more depolarised potentials. The experimental aim was to decrease Δ[Ca2+] in the vicinity of open SR Ca2+ release channels. If the proposal is correct, this should tend to decrease release permeability at more depolarised potentials compared to less depolarised potentials. Two kinds of experiments were used to reduce Δ[Ca2+]; one was to add a high concentration of BAPTA and the other was to decrease the SR Ca content (denoted [CaSR]). Decreasing [CaSR] should decrease the flux of Ca2+ through a Ca2+ release channel, which in turn should decrease Δ[Ca2+] in the vicinity of the channel (Neher, 1986; Stern, 1992; Pape et al. 1995; Pape & Carrier, 2002). In each case, effects of changing Δ[Ca2+] were evaluated on the release permeability at −45 mV compared to −60 mV. In addition, intramembranous charge movement was measured in order to monitor possible changes in voltage activation.
Methods
The apparatus and experimental protocols are detailed in Pape et al. (1995) and Pape & Carrier (1998). Briefly, frogs (Rana temporaria) were cold adapted for at least 4 days at 3–5 °C. They were decapitated and double pithed using protocols approved by the Comité d’éthique de l'expérimentation animale at the Université de Sherbrooke. Leg muscles were removed and used within 36 h. Fast-twitch fibres from the semi-tendinosus or ileo-fibularis muscle were mounted in a double-Vaseline gap chamber, stretched to a sarcomere length of 3.5-4.3 μm, and maintained at 13–16 °C. A voltage-clamp set-up controlled voltage in one of the end pools (denoted V1). The resting potential was maintained at −90 mV with a holding current.
Composition of the internal and external solutions
The end-pool solutions without BAPTA contained (mm): 45 Cs-glutamate, 20 EGTA, 6.8 MgSO4, 5 Cs2-ATP, 20 Cs2-creatine phosphate, 5 Cs3-phospho(enol)pyruvate and 5 3-(N-morpholino)propanesulfonic acid (MOPS). One of these internal solutions contained no Ca and the other contained 1.76 mm Ca (estimated free [Ca2+] was 36 nm). The end-pool solution with 8 mm BAPTA contained 33 mm Cs-glutamate and 3.32 mm Ca (estimated free [Ca2+] was also 36 nm). The concentrations of EGTA, MgSO4, Cs2-ATP, Cs2-creatine phosphate, Cs3-phospho(enol)pyruvate and MOPS were the same as those in the BAPTA-free solutions. In each case, the pH was adjusted to 7.0 with CsOH and the estimated [Mg2+] was 1 mm.
The central pool solution contained 110 mm TEA-gluconate, 10 mm MgSO4, 1 μm tetrodotoxin (TTX) and 10 mm MOPS adjusted to pH 7.1. It was nominally Ca-free.
Estimation of release permeability with the EGTA/phenol red method in the presence of BAPTA
As described in detail elsewhere (Pape et al. 1995), the total amount of Ca released from the SR into the myoplasm of a fibre containing a large concentration of EGTA can be estimated with the EGTA/phenol red method. Briefly, essentially all of the released Ca2+ rapidly binds to H2EGTA2-, the predominant form of Ca-free EGTA in the range of myoplasmic pH values present in fibres, releasing two protons for each Ca bound. Δ[CaEGTA] (units referred to myoplasmic volume) is estimated from the pH change with the equation:
| (1) |
β is the buffering power of myoplasm, taken to be 22 mm (pH unit)−1, and ΔpH is measured with the pH indicator dye phenol red. In the absence of another added Ca2+ buffer such as BAPTA, Δ[CaEGTA] is taken to be the total amount of Ca2+ released into the myoplasm (denoted Δ[CaT]). The amount of Ca in the SR at the start of a stimulation, denoted [CaSR]R, is estimated from the maximum of the Δ[CaT] signal after all of the Ca is released. The amount of Ca in the SR at any time (denoted [CaSR]) is given by [CaSR]R - Δ[CaT]. The rate of Ca2+ release is given by dΔ[CaT]/dt. The permeability of the SR for Ca2+ release or release permeability is expected to be proportional to dΔ[CaT]/dt divided by [CaSR] to normalise for the driving force for Ca2+ release. The fraction of SR Ca content released by a pulse is given by:
| (2) |
where Δ[CaT] is the amount of Ca released by the pulse and [CaSR] is the SR content before the pulse. When a small fraction of SR Ca content is released, fCa is essentially the same as the integral of the release permeability thereby providing an indication of the extent of activation of Ca2+ release channels during the pulse. In the absence of BAPTA, eqn (2) can also be written:
| (3) |
It turns out that eqn (3), provides a very good estimate of the actual fCa even in the presence of BAPTA (see Appendix A) if each of the Δ[CaEGTA]s refers to equilibrium conditions. For example, Δ[CaEGTA]after refers to the value of Δ[CaEGTA] after sufficient time has passed after the pulse so that redistribution of Ca from BAPTA to EGTA is complete. The reason eqn (3) provides a good estimate is that Δ[CaT] is essentially the sum of Δ[CaEGTA] and Δ[CaBAPTA], both of which are approximately proportional to Δ[Ca2+] and, therefore, each other. Values of fCa in this article were determined with eqn (3).
Intramembranous charge movement
Electrical parameters monitored included holding current, apparent fibre capacitance (Capp), internal resistance per unit length of fibre (ri), and capacitance per unit length of fibre (cm). The charge movement current (Icm) was obtained by correcting the Itext - Icontrol signal for the small non-linear ionic current. Unless indicated, Qcm was obtained from the integral of Icm during the OFF pulse. Details of the electrical measurements and this latter correction are described in Chandler & Hui (1990) and Hui & Chandler (1990).
Filtration of signals
All signals were filtered with a 1 kHz 4-pole Bessel filter. All optical traces were also filtered with a 50 Hz digital Gaussian filter (Colquhoun & Sigworth, 1983). This digital filter was also applied to the Icm signals in Fig. 3 and Fig. 4 in which relationships between the time courses of Icm and release permeability are evaluated.
Figure 3. Effect of BAPTA on intramembranous charge movement.

A, Qcm plotted vs. time after saponin treatment for the pulses to −60 mV (filled circles), the short pulse to −45 mV (open circles), the long pulse to −45 mV (asterisks), and the pulse to −20 mV (open diamonds). With the exception of the short pulse to −45 mV (see text), Qcm values are from the OFF pulse (see Methods). The horizontal line segment at the top indicates the period when 8 mm BAPTA was present in the end pools. The constant line through the results at −45 mV is the average of the values before adding BAPTA. This line helps with the observation that QON for the short pulse to −45 mV decreased in BAPTA and recovered to the level before BAPTA following its removal. B, the continuous and dotted traces at the top are short voltage pulses to −45 mV, respectively, before and 53 min after adding BAPTA. The traces at the bottom are the corresonding Itest - Icontrol signals. C, continuous traces are the same as those shown in B before adding BAPTA. The dotted traces were obtained 72 min after removing BAPTA. The labels a, b and c for the traces correspond to the points with the same labels in A. Results are for the same fibre shown in Figs 1, 2A and 2C.
Figure 4. Charge movement and Ca2+ release signals at different times during an experiment.

In each panel, the top trace (V1) shows a voltage step to −45 mV. The next traces, from top to bottom, show the corresponding Icm, Δ[CaT], dΔ[CaT]/dt and release permeability signals. The vertical lines mark the time-to-peak of the dΔ[CaT]/dt signal determined by the fit of a quadratic function to points spanning the peak of the signal. The calibration bars on the left of the V1, Icm and release permeability signals apply to all four panels. The calibration bars for the dΔ[CaT]/dt traces give the peaks of the dΔ[CaT]/dt signals. The value of [CaSR]R is shown at the top of each panel. Times of saponin treatment for panels A-D, respectively, were 91, 141, 197 and 245 min.
Statistical test of significance
Results were considered to be significantly different if the Student's t test parameter P was < 0.05.
Results
Stimulation protocol and effect of 8 mm BAPTA on Δ[CaEGTA]MAX
As mentioned in the Introduction, the aim of the BAPTA experiments was to compare the effects of buffering Δ[Ca2+] in the vicinity of open Ca2+ release channels on the release permeability elicited by membrane potential changes to −45 and −60 mV. The top trace in Figure 1A illustrates the voltage protocol, which included pulses to −60, −45, −45 and −20 mV having durations of 400, 30, 1600 and 800 ms, respectively, interspersed by long periods at the resting potential of −90 mV. The bottom pair of traces shows Δ[CaEGTA] signals before and 57 min after adding 8 mm BAPTA to the end pools. As mentioned in the Introduction, we were specifically interested in the effect of BAPTA on the peak of the release permeability at −45 mV. The reason a 30-ms duration was chosen for the first pulse to −45 mV is that it is slightly greater than the time to peak of the rate of Ca2+ release signal in the absence of BAPTA. The actual information extracted for this pulse is essentially the average release permeability during this 30-ms period (fCa, see Methods), which should be related to the release permeability at the peak. One purpose of the last two pulses to −45 and −20 mV was to assess whether BAPTA shifts the voltage dependence or alters the maximum amount of intramembranous charge movement. Another purpose was to release all of the Ca from the SR. In the absence of BAPTA, the maximum of the Δ[CaEGTA] signal (denoted Δ[CaEGTA]MAX) provides an estimate of [CaSR]R (see Methods). As seen in Fig. 1A, Δ[CaEGTA]MAX was smaller after adding BAPTA as expected if BAPTA captures a large fraction of the released Ca. The remainder of this section assesses whether the extent of reduction in Δ[CaEGTA]MAX is consistent with the Ca2+-buffering properties of BAPTA.
Figure 1. Effect of BAPTA on Δ[CaEGTA].

A, top trace, the voltage protocol used to evaluate the effect of BAPTA. Given in order of application, pulses to −60, −45, −45 and −20 mV had durations, respectively, of 400, 30, 1600 and 800 ms. The duration of the periods at −90 mV at the start and between the pulses were all 800 ms. The larger and smaller traces below show, respectively, the associated Δ[CaEGTA] signals before and 56 min after exchanging the end-pool solution with the one containing 8 mm BAPTA. B, plot of Δ[CaEGTA]MAXvs. time after saponin treatment. The filled circles and horizontal line indicate the period when 8 mm BAPTA was present in the end-pool solution. Vertical line segments mark the points from the traces shown in A. C, the start of the same Δ[CaEGTA] signals shown in A on expanded time and vertical scales. D, the noisy trace is the same Δ[CaEGTA] signal in the presence of BAPTA shown in C on an expanded vertical scale and plotted only during the pulse to −60 mV. The associated two smooth traces are modelled Δ[CaEGTA] signals. See text for details. Parameter values associated with larger and smaller Δ[CaEGTA] signals, respectively, in A and C: holding current, −19 and −25 nA; pHR 7.12 and 6.83. Values for first and last points, respectively, in B: fibre diameter, 66 and 56 μm; holding current, −18 and −25 nA; concentration of phenol red at optical site, 0.8 and 2.5 mm; estimated pHR, 7.15 and 6.90; Capp, 0.00710 and 0.00758 μF.
Figure 1B plots Δ[CaEGTA]MAXvs. time of the experiment. Δ[CaEGTA]MAX decreased with time even before adding BAPTA to the internal solution. Some or all of this progressive decrease was probably due to the likelihood that [Ca2+] in the end-pool solutions (nominally 36 μm) was significantly less than the physiological value. In this and all of the other experiments, introduction of BAPTA significantly increased the rate of decline of Δ[CaEGTA]MAX. When BAPTA was removed from the internal solution, Δ[CaEGTA]MAX partially recovered. Full recovery would not be expected due to the progressive decrease in Δ[CaEGTA]MAX not related to BAPTA.
Table 1 summarises the effect on several parameters of a 50–60 min exposure of 8 mm BAPTA in the end-pool solution. The following calculation gives an estimate of the percentage of total Ca released bound to BAPTA 50–60 min after adding BAPTA (given by (100 × Δ[CaBAPTA]MAX)/ [CaSR]R). Results in row 1 indicate that BAPTA reduced Δ[CaEGTA]MAX to 0.42 on average of its value before the solution change vs. 0.73 in the control experiments. Assuming the fractional decrease in [CaSR]R after the solution change in the BAPTA experiments was the same as in the control experiments, the average value of [CaSR]R 50–60 min after adding BAPTA was 0.73 × [CaSR]R,before, where [CaSR]R,before is the value before adding BAPTA. Since Δ[CaBAPTA]MAX should essentially be given by [CaSR]R - Δ[CaEGTA]MAX, it follows that the average value of Δ[CaBAPTA]MAX 50–60 min after adding BAPTA would have been (0.73 - 0.42) or 0.31 × [CaSR]R,before. These results suggest that about 42 % (100 × 0.31/0.73) on average of the total Ca released was bound to BAPTA. Assuming a value of 1.1 × 10⁻⁶ cm2 s−1 for the diffusion constant of BAPTA and that BAPTA does not bind to sites inside muscle, the solution of the diffusion equation (e.g. eqn (6) on p. 47 of Maylie et al. 1987) indicates that [BAPTAT] at the optical recording site would have reached 7.4 mm 55 min after its introduction to the end pools. Assuming that [EGTAT] was 20 mm, it is estimated that BAPTA should have captured 53 % of the released calcium (obtained from the measured Δ[CaEGTA] signal and Δ[CaBAPTA], estimated as described in Appendix A). Given the various assumptions, we conclude that this expected decrease is reasonably consistent with the experimentally estimated decrease above of 42 %. This agreement is one indication that BAPTA produced effects consistent with its Ca2+-buffering properties.
Table 1.
Effect of BAPTA on Ca2+ release and charge movement
| Before | After/before | ||||
|---|---|---|---|---|---|
| Control | BAPTA | Control | BAPTA | ||
| 1 | Δ[CaEGTA]MAX (μm) | 2383 ± 117 | 2062 ± 187 | 0.73 ± 0.04 | 0.42 ± 0.06 |
| 2 | QON(–45) (nC μF−1) | 4.70 ± 0.49 | 4.22 ± 0.96 | 1.03 ± 0.12 | 0.88 ± 0.10 |
| 3 | QOFF(–20) (nCμF−1) | 22.3 ± 2.5 | 16.6 ± 2.2 | 1.11 ± 0.07 | 1.08 ± 0.03 |
| 4 | fCa(–60) | 0.0212 ± 0.0027 | 0.0215 ± 0.0041 | 1.90 ± 0.25 | 1.54 ± 0.27 |
| 5 | fCa(–45) | 0.0642 ± 0.0210 | 0.0485 ± 0.0170 | 0.847 ± 0.050 | 0.400 ± 0.046 |
Values were obtained before and 50–60 min after exchanging the end-pool solution for one containing no BAPTA (control) or 8 mm BAPTA. Values are means ± s.e.m. For control, n = 5; for BAPTA, n = 7. These values were obtained 80 min on average after saponin treatment in both the BAPTA and control experiments. Δ[CaEGTA]MAX: maximum of Δ[CaEGTA] signal. QON(–45): integral of the Itest– Icontrol signal during the short ON pulse to –45 mV. QOFF(–20): estimate of the amount of charge from the OFF current following the pulse to –20 mV. fCa(–60) and fCa(–45): fCa at –60 and –45 mV, respectively. Average values before and 50–60 min after the solution change in the BAPTA experiments were: holding current, –44.8 and –64.1 nA; phenol red concentration, 1.07–1.97 mm; resting pH, 7.18–7.07; Capp, 0.0149–0.0159 μF; ri, 4.40–5.52 Mω cm−1; cm, 0.193–0.191 μF cm−1. The corresponding values in the control experiment were –41.5 and –49.6 nA; 1.07–1.88 mm; 7.15–7.07; 0.0142–0.0142 μF; 4.85–5.30 MΩ cm−1; and 0.182–0.175 μF cm−1. With the exception of a small increase in Capp in the BAPTA experiments, none of these parameter values or changes in values with time were significantly different in the BAPTA vs. the control experiments.
Effect of BAPTA on time course of Δ[CaEGTA]
Figure 1C shows the first part of the Δ[CaEGTA] traces in Fig. 1A with expanded time and concentration scales. The apparent delay of the Δ[CaEGTA] signal by BAPTA is attributed to the fact that BAPTA should rapidly capture most of the Ca that is initially released owing to its faster binding kinetics with Ca2+. This is essentially the same behaviour that occurs when large concentrations of fura-2 and EGTA are present (Pape et al. 1995).
The noisy trace in Fig. 1D shows the same Δ[CaEGTA] signal associated with the pulse to −60 mV measured in the presence of BAPTA on expanded vertical and horizontal scales. In order to make a further assessment of whether or not BAPTA produced effects consistent with its Ca2+-buffering properties, model calculations were done to estimate the expected time course of Δ[CaEGTA] in the presence of BAPTA as described in Appendix B. The Δ[CaT] signal driving the model was assumed to be a ramp function, as observed in the absence of BAPTA (cf. the trace labelled ‘no BAPTA’ in Fig. 1C). The earlier smooth trace in Fig. 1D shows the predicted Δ[CaEGTA] signal calculated with parameters given in the second to last section in Appendix B. The calculated and measured Δ[CaEGTA] signals have similar properties including an apparent delay with a large fraction of the change in Δ[CaEGTA] occurring after the pulse as Ca2+ redistributed from BAPTA to EGTA. As indicated in Appendix B, the predicted redistribution is essentially mono-exponential with a time constant of 262 ms. Fits of single exponential functions to the recovery periods after the pulses to −60 and −45 mV were very good (fits shown in Fig. 1C but difficult to distinguish from the data). The exponential time constants for the fits were 339 and 315 ms, respectively, values that are reasonably close to the predicted time constant of 262 ms.
The predicted exponential time constant for redistribution of Ca from BAPTA to EGTA is sensitive to the off rate of Ca from EGTA which, in turn, is sensitive to pH. It was previously shown that phenol red provides an accurate measure of ΔpH in muscle, but that the absolute value of pH is too acidic by 0.1-0.4 units with an average shift of about 0.2 pH units, observations consistent with a simple shift in its pK (Pape 1990; discussed also in Pape et al. 1995). If the actual pH had been more alkaline, the predicted redistribution of Ca from BAPTA to EGTA would have been slower and there would have been more of an apparent delay in the predicted Δ[CaEGTA] signal thereby giving a better match to the measured Δ[CaEGTA] signal. The additional delay was small, however, and did not account for the difference between the measured and the early, predicted Δ[CaEGTA] signal in Fig. 1D. A factor that appears to account for this discrepancy is that counter-ion movements of protons into the SR should produce an alkalisation superimposed on the ΔpH signal associated with Ca binding to EGTA. There was in fact a slight early undershoot in the Δ[CaEGTA], probably due to such counter-ion movements, that was more evident with the more depolarised potentials (indicated by arrow in Fig. 1C). The more delayed smooth trace in Fig. 1D shows the predicted Δ[CaEGTA] signal taking into account counter-ion movements of protons as described in the last section of Appendix B. In this case, there is a close correspondence between the predicted and measured Δ[CaEGTA] signals during the full trace. Similar agreement was observed in all of the experiments, thereby providing another indication that BAPTA produced effects consistent with its Ca2+-buffering properties.
Effect of BAPTA on fCa
Since it was not possible to reliably estimate the time course of Ca2+ release with BAPTA present, the approach taken was to estimate fCa(V), the fraction of SR Ca2+ released by a pulse to voltage V (in mV). When only a small fraction of SR Ca is released, as occurs with the first two pulses of the stimulation protocol, fCa is very close to the integral of the release permeability during the pulse. As evaluated in Appendix A, fCa estimated with the EGTA/ phenol red method (eqn (3)) should be very close to the actual fCa even in the presence of 8 mm BAPTA.
Figure 1C indicates that fCa(-60) increased following the addition of BAPTA since the magnitude of Δ[CaEGTA] following the pulse to −60 mV did not change much whereas Δ[CaEGTA]MAX decreased (Fig. 1A). As discussed below, this unexpected increase also occurred during control experiments. The large reduction of Δ[CaEGTA] at −45 mV in Fig. 1C, however, was associated with the addition of BAPTA. These results are consistent with a Ca-dependent extra activation component of Ca2+ release during the first 30 ms of a pulse to −45 mV that was not present at −60 mV.
Figures 2A and B indicate that there was a clear time-dependent decrease in fCa(-45) following the addition of BAPTA that was not observed in the control experiment. Values in Table 1 indicate that BAPTA produced a large and statistically significant decrease in fCa(-45); fCa(-45) was reduced to 0.400 of its value before the solution change vs. 0.847 in the control experiments. Although consistent with a Ca-dependent extra activation component, it is important to note that fCa(-45) in Fig. 2A did not recover following the removal of BAPTA from the internal solution. This raises the concern, addressed more fully in the Discussion, that some of the decrease in fCa(-45) was not related to the Ca2+-buffering action of BAPTA.
Figure 2. Time course of fCa(-45) and fCa(-60) in BAPTA and control experiments.

A, plot of fCa(-45) vs. time after saponin treatment. The filled circles and horizontal line indicate the period when 8 mm BAPTA was present in the end-pool solution. B, plot of fCa(-45) in a control experiment. The start and end of the horizontal line segment are the times when the end-pool solution was exchanged with the same solution that was already present, i.e. with no BAPTA. C and D correspond to A and B, respectively, except that fCa(-60) is plotted instead of fCa(-45). A and C are results from the same fibre shown in Fig. 1.Values for first and last points, respectively, for fibre in B and D: fibre diameter, 84 and 78 μm; holding current, −43 and −73 nA; concentration of phenol red at optical site, 0.3 and 2.8 mm; estimated pHR, 7.31 and 7.07; Capp, 0.01303 and 0.01526 μF.
Figure 2C and D shows the time courses of fCa(-60) for the experiments shown Fig. 2A and B, respectively. As mentioned with Fig. 1, there was a gradual increase in fCa(-60), whether or not BAPTA was added. The average increases of 1.54 and 1.90 for the BAPTA and control experiments, respectively, were not significantly different (row 4 of Table 1). The reason for the increase and the fact that it was not observed or was not as pronounced in earlier experiments (cf. approximately constant values of release permeability values at −60 mV in Fig. 5A when [CaSR] was > 1 000 μm) is not known.
Figure 5. Release permeability vs. [CaSR] at −45 and −60 mV.
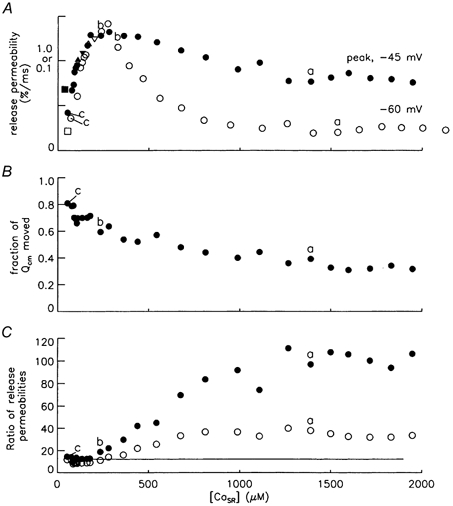
A, the filled symbols plot release permeability at −45 mV at the time of the peak of the dΔ[CaT]/dt signal vs. [CaSR]peak. The open symbols plot release permeability vs. [CaSR] at −60 mV, both average values during the last 100 ms of the pulse to −60 mV. The y axis scales of 1.0 and 0.1 apply to points for −45 and −60 mV, respectively. The interval of time between points was usually 5 min. This interval was reduced to ≈1 min between the inverted triangle and the following square symbol and then increased back to 5 min before the following triangle. [CaSR] in each case is the value at the time of the determination of the release permeability value. (The points are not aligned because the [CaSR] for a point at −45 mV was less than that at −60 mV for the same stimulation since more Ca had been released by the time of the determination of the release permeability at −45 mV.) Points at the largest and smallest values of [CaSR] were obtained, respectively, 66 and 199 min after saponin treatment. With the exception of the squares, [CaSR] decreased monotonically with time of the experiment. After the first three points, Ca2+ was removed from the internal solution. Points are not shown after Ca2+ was added back to the internal solution and [CaSR] partially recovered (e.g. that obtained from the release permeability trace in Fig. 4D). B, plot of the fraction of steady-state Qcm moved by the time-to-peak of the dΔ[CaT]/dt signal at −45 mV. C, an open circle plots the ratio of release permeability at −45 mV to that at −60 mV in A obtained with the same stimulation. A filled symbol plots this ratio divided by the fraction of Qcm moved by the time-to-peak of the dΔ[CaT]/dt signal at −45 mV given in B. The constant line has a value of 12.2 (see text for details). Results are for the same fibre shown in Fig. 4. The points labelled a-c correspond to the traces shown in panels A-C, respectively, of Fig. 4. Range of values from first to last point: fibre diameter, 106–111 μm; holding current, −37 to −78 nA; concentration of phenol red at optical site, 1.4-3.0 mm; estimated pHR, 6.80-6.71; Capp, 0.0167-0.0152 μF.
Effect of BAPTA on intramembranous charge movement
Figure 3A plots Qcmvs. time after saponin treatment for the four voltage pulses illustrated in Fig. 1A. Taking into account random scatter in the data, the amount of charge appeared to be approximately constant. The reason the data points for the short pulse to −45 mV (open circles) show less scatter is that each point represents the amount of charge moved during the ON pulse without a correction for non-linear ionic current (this correction is the main reason for the scatter in the data at the other voltages). There was a small average increase of 8 % in the Qcm at −20 mV after 50–60 min in BAPTA (row 3 of Table 1). This increase was not, however, significantly different from the increase of 11 % in the control experiments. In contrast to the charge at −20 mV and the long pulse to −45 mV, there appeared to be a small decrease in the Qcm values for the short pulse to −45 mV during the period in BAPTA (cf. horizontal line and open circles in Fig. 3A). The average change, −12 %, was lower than that in the control experiments of +3 % (row 2 of Table 1), though the difference was not statistically significant. The decrease in BAPTA, however, was consistently observed.
Figure 3B shows superimposed Itest - Icontrol currents associated with the short pulse to −45 mV measured just before and 1 h after the addition of BAPTA. BAPTA produced a decrease in the Itest - Icontrol trace after the peak without significantly affecting the early peak. Figure 3C indicates that the decrease was reversed after BAPTA was removed. The decrease can be explained by an inhibitory effect of BAPTA on the Qγ component of charge with little or no effect on the early Qβ component. Since BAPTA did not significantly affect the maximum amount of charge or the charge during the long pulse to −45 mV, it seems reasonable to suppose that BAPTA decreased the speeding effect of Ca2+ release on Qγ charge. This conclusion is similar to that reached by Stroffekova & Heiny (1997a,b) that 10–20 mm BAPTA inhibits the movement of Qγ charge, presumably at voltage sensors near an open SR Ca2+ release channel. In contrast to the results of Stroffekova & Heiny (1997a), however, 8 mm BAPTA did not significantly reduce the maximum amount of charge whereas they found a large reduction. The reason for the discrepancy is not know though it is noted that different frog species were used.
Effect of [CaSR] on the time course of intramembranous charge movement and Ca2+ release at −45 mV
The remainder of the results are from the same experiments described in Pape & Carrier (1998) which evaluated the effect of [CaSR] on release permeability in response to less depolarised potentials (-70 to −60 mV). Briefly, the usual stimulation protocol consisted of a series of pulses to −70, −65, −60, −45 and −20 mV interspersed by 400 ms periods at −90 mV. One of the reasons for the first three pulses was to monitor the voltage steepness of release when only a small fraction of channels were activated. This voltage steepness and the total amounts of intramembranous charge at −45 and −20 mV were generally stable indicating that steady-state voltage activation was relatively constant during these long experiments. This article is mainly concerned with the release permeability at −45 mV. Because only a small amount of Ca is released during the first three pulses and they were followed by a relatively long resting period, the first three pulses should have had little if any influence on the Ca2+ release at −45 mV.
The top trace in Fig. 4A shows the start of a voltage pulse to −45 mV early in an experiment when [CaSR]R was 1640 μm. The next traces from top to bottom show the corresponding intramembranous charge movement current (Icm), Δ[CaT], rate of Ca release (dΔ[CaT]/dt), and release permeability signals. Prior to the stimulation shown in Fig. 4A, Ca was removed from the end pools. The fibre was then stimulated usually every 5 min thereby producing a slow removal of Ca from the fibre. The traces in Fig. 4B and C were obtained when [CaSR]R had declined to 422 and 74 μm, respectively. Shortly after the stimulation shown in Fig. 4C, Ca was added back to the end pools. The traces in Fig. 4D were obtained when [CaSR]R had recovered to 347 μm.
The time courses of the Icm traces differed due to effects of Ca2+ release on the kinetics of the Qγ component, effects that do not alter the amount of steady-state charge (Jong et al. 1995b; Pape et al. 1996). These effects are discussed below. The release permeability signal in Fig. 4A had a somewhat complex time course. The rapid decrease from the peak to the local minimum is due to Ca inactivation of Ca2+ release and the subsequent increase to increasing voltage activation as intramembranous charge continues to move. The time courses of the release permeability signals in Fig. 4B–D were simpler with a relatively slow monotonic decline after the peak. A comparison of the release permeability signals in Fig. 4B–D indicates that the decrease in release permeability when [CaSR] decreased from 422 to 74 μm was not reversed when Ca was added to the end-pool solution and [CaSR] had recovered to 347 μm. This lack of long-term reversibility was typical of most of the experiments, though the peak values were partially reversed in some experiments and almost fully reversed in one experiment. The overall lack of this type of reversibility contrasts with the consistent reversibility observed for the pulses to −70 to −60 mV from these same experiments (Pape & Carrier, 1998). These results indicate that some type of long-term change can occur which reduces the release permeability at −45 mV but not at more negative voltages. Although this raises some concerns, results described later indicate that effects of changing [CaSR] were reversible earlier in the experiments when the main results of interest were obtained.
The next section evaluates the magnitude of the release permeability signal at −45 mV at the time of the peak of the dΔ[CaT]/dt signal (marked by vertical bars in Fig. 4). One reason for selecting this time is that Ca inactivation was very evident after this point with larger values of [CaSR]R (Fig. 4A). Another reason is that the time-to-peak of the release permeability signal was not well defined with smaller values of [CaSR]R whereas that of the dΔ[CaT]/dt signal was easier to estimate. [CaSR] at the time of the peak of the dΔ[CaT]/dt signal is denoted below as [CaSR]peak.
Comparison of release permeability vs. [CaSR] at −45 and −60 mV
Figure 5A plots release permeability vs. [CaSR] for pulses to −45 and −60 mV. Both sets of data show similar features including (1) an increase in release permeability to its maximum value when [CaSR] increased from < 100 μm to 200–400 μm, (2) a decrease in release permeability when [CaSR] increased from 200–400 μm to ≈1000 μm, and (3) approximately constant values when [CaSR] was > 1000 μm (denoted the plateau region). The major difference is that the release permeability at −45 mV relative to that at −60 mV was greater in the plateau regions.
One procedure to test for reversibility was to decrease [CaSR] by decreasing the time between stimulations from the usual 5 min to about 1 min (see explanation of inverted triangle, square and triangle symbols in legend of Fig. 5). Results at −45 mV in Fig. 5A indicate that most of the long-term decrease of release permeability with decreasing [CaSR] was reversible over the short term with this procedure. Similar results were obtained in the five other experiments in which [CaSR] was similarly reduced from 200–300 μm to < 100 μm. The conclusion from these results is that the reversible part of decrease of release permeability at −45 mV when [CaSR] decreases in this range of [CaSR] values is similar to that observed with pulses to less depolarised potentials (-70 to −60 mV). Pape & Carrier (1998) concluded that CICR is probably responsible for the dependence on [CaSR] of release permeability at less depolarised potentials in this range of [CaSR] values. These results suggest that the same explanation applies to the release permeability at −45 mV.
Results in Fig. 4 indicate that only a fraction of the steady-state intramembranous charge had moved by the time the release permeability values at −45 mV were determined. Values of this fraction plotted in Fig. 5B started at less than 0.4 when [CaSR] was > 1200 μm and progressively increased as [CaSR] decreased.
Figure 5C plots the ratio of the release permeability at −45 mV to that at −60 mV in Fig. 5A, obtained during the same stimulation protocol (open circles). A filled circle is this ratio divided by the corresponding fraction of steady-state intramembranous charge moved from Fig. 5B. This normalisation roughly accounts for the fact that only a fraction of the maximum voltage activation had been reached at the time of the determination of the release permeability at −45 mV (this normalisation is discussed below). The constant line is an estimate of the ratio of voltage activation of Ca2+ release at −45 mV to that at −60 mV in the absence of Ca2+ feedback mechanisms and after essentially all of the charge in the Qγ ‘hump’ component had moved. Its value, 12.2, was calculated from average parameters of a Boltzmann function fitted to release permeability vs. voltage data when [CaSR] was reduced to ≥ 60 μm (columns 4 and 5 of Table 1 in Pape & Carrier, 2002). It is clear that the ratio values approached this constant line at low values of [CaSR]. An important point to note is that the normalised ratio of the release permeability in the plateau region was about 8-fold larger than the ratio obtained at the smallest values of [CaSR]. These results are consistent with a Ca-dependent, extra activation component of Ca2+ release present at −45 mV but not at −60 mV.
Summary of release permeability at −45 mV compared to −60 mV
Table 2 gives mean values of all of the experiments (n = 7) for results like those in Fig. 5. The third and fourth columns give average values when [CaSR]peak was 100–200 μm and 1000–1800 μm, respectively. Row 6 gives the normalised ratio of release permeabilities, which correspond to the filled circles in Fig. 5C. Row 7 gives this normalised ratio at the higher values of [CaSR] divided by that at the low values (values in column 4 divided by those in column 3 of row 6). This value - termed the enhancement factor - is the factor by which the normalised ratios of release permeabilities increased when [CaSR] increased from 100–200 to 1000- 1800 μm. Its value of 7.3 supports the presence of a large, Ca-dependent extra activation component of Ca2+ release at −45 mV.
Table 2.
Effect of SR Ca content on the ratio of release permeabilities at two voltages with [CaSR]peak at 100–200 μm or 1000–1800 μm
| 100–200 μm | 1000–1800 μm | ||
|---|---|---|---|
| 1 | [CaSR]R (μm) | 273 ± 58 | 1649 ± 67 |
| 2 | [CaSR] at –60 mV (μm) | 174 ± 4 | 1566 ± 45 |
| 3 | [CaSR]peak at –45 mV (μm) | 135 ± 3 | 1464 ± 38 |
| 4 | Release permeability at –45 mV (% ms−1) | 0.95 ± 0.14 | 0.48 ± 0.07 |
| 5 | Fraction of charge at peak | 0.69 ± 0.02 | 0.40 ± 0.03 |
| 6 | Normalized ratio of release permeabilities | 31.3 ± 7.5 | 193.3 ± 29.1 |
| 7 | Enhancement factor | — | 7.3 ± 0.9 |
| 8 | Corrected enhancement factor | — | 5.9 ± 0.7 |
Values are means ± s.e.m.; n = 7 experiments. Comparison of release permeability values at –45 mV and –60 mV with normal and reduced values of [CaSR]R. A value in each experiment was the average from several stimulations in which [CaSR]peak was within a certain range. Rows 1–3, respectively, give [CaSR]R and the values of [CaSR] when the release permeabilities at –60 mV and –45 mV were determined. Rows 4 and 5 give release permeability and fraction of steady-state charge moved, respectively, at the time of the peak of the dΔ[CaT]/dt signal (corresponding to filled symbols in Fig. 5A and B, respectively). Row 6 gives the ratio of release permeability at –45 mV to that at –60 mV normalised by the fraction of steady-state charge moved (corresponding to the filled symbols in Fig. 5C). Row 7 gives the ratio of values in row 6 for [CaSR]peak between 1000 and 1800 μm to those for [CaSR]peak between 100 and 200 μm. Row 8 gives row 7 divided by values in row 2 and multiplied by values in row 3, both for [CaSR]peak between 100 and 200 μm(see text).
As seen in Fig. 5A, release permeability was approximately proportional to [CaSR] at both −60 and −45 mV when [CaSR] increased from < 100 μm to ≈300 μm, an effect attributed to CICR (see above). The relatively small ratios at the lower [CaSR] level in Fig. 5C may be due in part to the fact that [CaSR] at the time of the evaluation of the release permeability at −45 mV was smaller than that at −60 mV ([CaSR] values in rows 2 and 3, respectively, in the third column of Table 2). Scaling the enhancement factors in row 7 by the ratio of these [CaSR] values should provide a reasonable correction for this effect (see Appendix of Pape & Carrier, 2002). This correction reduces the average enhancement factor from 7.3 (row 7) to 5.9 (row 8), which still indicates a substantial Ca-dependent enhancement of Ca2+ release at −45 mV.
In the normalisation of the ratio data above, the ratio was divided by the fraction of steady-state intramembranous charge moved. This fraction is meant to provide a rough estimate of the fraction of coupled SR Ca2+ release channels activated by their associated voltage sensors. The estimated fraction is likely to be too high for two reasons. One is that Qβ charge - which is not directly associated with Ca2+ release - moves early during the ON pulse. Another reason is that the time course of voltage activation of Ca2+ release is expected to lag behind that of Qγ (Pape & Carrier, 2002). Since the overestimation of the fraction would be more pronounced at larger values of [CaSR] when less charge had moved, the corrected enhancement factor in row 8 of Table 2 should be adjusted upwards to 6 or greater.
Ca-dependent, early enhancement of release permeability
The top traces in Fig. 6 show superimposed Icm signals at −45 mV when [CaSR]R was 1640, 422 and 74 μm (traces labelled a-c, respectively). The middle traces in Fig. 6 show dΔ[CaT]/dt at 1640 and 422 μm only, and the bottom traces in Fig. 6 show the corresponding release permeability signals. The changes in the time course of the Icm traces with [CaSR]R were similar to those observed previously and attributed to two feedback mechanisms of Ca2+ release on the kinetics of Qγ charge movement. The early enhancement of Icm at the larger [CaSR] values (traces a and b) relative to that at the reduced [CaSR] (trace c) was caused by the speeding-up effect of Ca2+ release on Qγ (Jong et al. 1995b). The rapid decrease of Icm after its peak at the highest value of [CaSR] (trace a) was due to a slowing of the kinetics of Qγ that occurs at larger rates of Ca2+ release (Pape et al. 1996). The observation of most interest in Fig. 6 is that the initial increase of the release permeability signal was much greater with the larger [CaSR]. It is possible that this early enhancement was due to a faster voltage activation as suggested by the somewhat greater, early enhancement of the Icm trace labelled a (indicated with arrow). However, since the kinetics of Qγ were sped up in both a and b and only slightly more in a, it does not appear that the enhanced voltage activation can account for the large early enhancement of the release permeability. Therefore, the results suggest that the early enhancement of release permeability involves a Ca-dependent process in addition to the speeding up effect of Ca2+ release on Qγ. It seems reasonable to suppose that this early enhancement is caused by the same mechanism responsible for the Ca-dependent enhancement of Ca2+ release at −45mV indicated above.
Figure 6. Superimposed Icm and Ca2+ release signals at −45 mV at different values of [CaSR].

The top, middle and bottom sets of traces show Icm, dΔ[CaT]/dt and release permeability signals, respectively. The start of the time calibration bar marks the start of the step to −45 mV (not shown). The traces labelled a-c were obtained when [CaSR]R was 1640, 422, 74 μm, respectively, i.e. from panels A-C in Fig. 4 and points labelled a-c in Fig. 5. All of the traces in this figure were digitally filtered with a 0.05 kHz cut-off frequency.
Evaluation of reversibility when [CaSR] decreases from ≈1000 to ≈400 μm
As mentioned with Fig. 4D, a long-term, irreversible decrease in release permeability at −45 mV occurred in most experiments as evidenced by a lack of recovery after Ca was added back to the end pools late in the experiments. If the irreversible decrease occurred early in experiments, it could explain the decrease in the ratio of release permeability at −45 mV to that at −60 mV when [CaSR] decreased from ≈1000 to 300 μm. It was previously shown that the increase in release permeability at −60 mV was reversible in this range of [CaSR] values (Fig. 6 in Pape & Carrier, 1998). The experiment illustrated in Fig. 7 tested whether or not this is the case at −45 mV by reducing the time between stimulations to ≈1 min from the usual 5 min in order to produce a short-term decrease in [CaSR]. Fig. 7A shows Icm, dΔ[CaT]/dt, and release permeability traces in the same format as Fig. 6 when [CaSR]R was reduced in this manner from 1083 (continuous traces) to 445 μm (dotted traces). As is the case in Fig. 6, the early parts of the Icm and release permeability signals were enhanced with the larger [CaSR].
Figure 7. Effect of short-term and long-term changes of [CaSR] on Icm and release permeability at −45 mV.

Each panel from top to bottom shows superimposed voltage, Icm, dΔ[CaT]/dt and release permeability signals. The continuous traces in A were obtained 69 min after saponin treatment when [CaSR]R was 1083 μm. The dotted traces were obtained 1 min later instead of the usual 5 min and [CaSR]R had recovered to only 445 μm. The values of [CaSR]R are shown at the top. B, the continuous traces are the same as those shown in A. The dotted traces were obtained 5 min after the dotted traces in A, and therefore give bracketing measurements for the short-term reduction in [CaSR]. C, the continuous traces are the same as the dotted traces shown in A. The dotted traces were obtained 20 min later in the experiment at which time [CaSR]R had declined to 410 μm. Range of values: holding current, −47 to −51 nA; fibre capacitance, 0.01274-0.1299 μF; concentration of phenol red at optical site, 1.96-2.46 mm; estimated pHR, 6.705-6.699.
The continuous traces in Fig. 7B are the same as those in Fig. 7A before reducing [CaSR]R and the dotted traces are from the bracketing stimulation made after a 5 min recovery period following the short-term reduction of [CaSR]. The effects of reducing [CaSR] were mostly reversed. The difference in the later part of the release permeability signals can be attributed to the fact that [CaSR] only partially recovered to a value on the descending limb of the release permeability vs. [CaSR] relationship (cf. Fig. 5A). The continuous traces in Fig. 7C are the traces in Fig. 7A associated with the short-term decrease in [CaSR]R. The dotted traces were obtained 26 min later in the experiment when [CaSR]R had decreased to about the same level due to the slow removal of Ca from the fibre. The Icm signals were very similar. The magnitude of the release permeability signal was only slightly reduced indicating that it was reasonably stable during the early part of the experiments. Similar results were obtained in the one other experiment in which [CaSR]R was reversibly decreased from ≈1000 μm to ≈400 μm. In summary, the major part of the decrease in the normalised ratio of release permeabilities when [CaSR] decreases below 1000 μm (Fig. 5C and Table 2) is reversible and therefore not due to a long-term change.
The results in Fig. 7 are less clear concerning reversibility of the early enhancement of release permeability at larger [CaSR] values. Figure 7A shows that the early release permeability was reduced at the lower [CaSR] value (indicated with an arrow) and Fig. 7B indicates that this reduction was reversed. Traces in Fig. 7C, however, indicate that the early signal was more reduced later in the experiment even though [CaSR] had declined to about the same level as that produced by shortening the interval between stimulations. Therefore, some, but not all, of the early enhancement of release permeability at the higher [CaSR] level in Fig. 6 may be due to the fact that the enhanced signal was obtained earlier in the experiment before any long-term change had occurred.
Discussion
The experimental aim of this study was to evaluate whether or not there is a Ca-dependent enhancement of Ca2+ release present only at more depolarised potentials. This was done by evaluating effects of modulating myoplasmic Δ[Ca2+] in the vicinity of open Ca2+ release channels on the release permeability at −45 mV relative to that at −60 mV. One approach for varying Δ[Ca2+] was to add a large concentration of the fast Ca2+ buffer BAPTA. The other was to vary [CaSR] (see Introduction).
Effects of BAPTA
Results in this article indicate that 8 mm BAPTA produces a clear reduction in release permeability (monitored by fCa) at −45 mV with no significant effect at −60 mV (Fig. 1C and Fig. 2, and Table 1). This result is consistent with a Ca-dependent enhancement of Ca2+ release that depends on voltage. One problem with the BAPTA experiments, however, is that fCa(-45) did not recover when BAPTA was removed from the end-pool solutions even after an hour (Fig. 2A). This apparently was not due to BAPTA remaining in the fibre, since Δ[CaEGTA]MAX recovered somewhat after removing BAPTA (Fig. 1B). (Full recovery of Δ[CaEGTA]MAX would not be expected since Δ[CaEGTA]MAX tended to decline during the experiments even in the absence of BAPTA.) In addition, the delay in the Δ[CaEGTA] signal produced by BAPTA and the slow exponential component associated with redistribution of Ca from BAPTA to EGTA after the pulse (Fig. 1C) were both nearly fully reversible (not shown). It appears, therefore, that BAPTA produces some type of irreversible decrease of the Ca2+ release process at −45 mV not related to its maintained presence in the myoplasm. Another problem is that BAPTA decreased the early Icm signal at −45 mV consistent with a reduction of the speeding up effect of Ca2+ release on Qγ. Therefore, a decrease in voltage activation at −45 mV could have caused some or all of the reduction in fCa(-45).
In summary, it is not possible to conclude whether fast Ca2+ buffering, an irreversible change, and/or a decrease in voltage activation is responsible for the major part of the decrease in release permeability at −45 mV produced by BAPTA. It should be noted, however, that BAPTA did produce changes in the magnitude and time course of Δ[CaEGTA] consistent with the expected Ca2+-buffering properties of BAPTA (Table 1 and Fig. 1B and D). In addition, BAPTA did not significantly decrease fCa(-60) compared to control values as might be expected if BAPTA produced some toxic effect. Therefore, although not conclusive, the BAPTA results do support the presence of a Ca-dependent enhancement of release permeability at more depolarised potentials.
Ca-dependent extra activation component at more depolarised potentials
The other approach was to compare the ratio of release permeabilities at −45 mV and −60 mV when [CaSR] was near physiological values (> 1000 μm) to when it was < 300 μm. In the latter condition, Ca2+ feedback mechanisms were greatly reduced or eliminated and most of the steady-state charge had moved so that the ratio should approach that due to steady-state voltage activation alone. The main finding is that the ratio of release permeabilities is much larger than expected from voltage activation alone (at least 6-fold) when [CaSR] is in the physiological range (row 8 of Table 2). This result was shown to be reversible with short-term decreases in [CaSR] (Fig. 7).
Possible explanations for the enhanced ratio include the presence of some type of extra activation component at −45 mV due to CICR or some other Ca-dependent process or that Ca inactivation is somehow more pronounced at −60 mV compared to −45 mV (either the numerator of the ratio is greater or the denominator is smaller at larger values of [CaSR]). The latter explanation seems less likely since the rate of Ca2+ release is less at −60 mV so that Ca inactivation should also be less. In addition, Ca2+ spark results with most of the voltage sensors immobilised indicate no voltage dependence of the duration or amplitude of Ca2+ sparks with presumably physiological SR Ca contents (Klein et al. 1997). Since Ca2+ sparks were probably terminated by Ca inactivation, the results of Klein et al. (1997) indicate that there is no intrinsic voltage dependence of Ca inactivation that would make it more pronounced at −60 mV compared to −45 mV. We conclude with near certainty that there is some type of Ca-dependent extra activation component at −45 mV that is not present at −60 mV.
Ca-dependent enhancement of early release permeability signal at −45 mV
In almost all of the experiments, the early release permeability signal at −45 mV was enhanced at the start of experiments when [CaSR] was greater (Fig. 6). At least some of this enhancement is reversible as revealed by short-term decreases in [CaSR] (Fig. 7A and B). The early enhancement of release permeability was always accompanied by a small enhancement of the Icm trace consistent with a slightly greater speeding up effect of Ca2+ release on Qγ. As a result, it is not yet possible to rule out the possibility that the early enhancement is due to increased voltage activation alone. The additional Qγ charge, however, appears to be too small to account for the enhanced release permeability. It seems likely that the early enhancement of the release permeability signal at −45 mV is caused by the same mechanism that produced the Ca-dependent enhancement in the ratio of permeabilities at −45 and −60 mV. This is important because it suggests that the latter enhancement starts early in the pulse when only a small amount of charge has moved (see below).
Possibility that enhanced release is triggered by summation of Ca2+ from two voltage-activated Ca2+ release channels appears to require link with speeding up effect of Ca2+ release on Qγ
One possible explanation for the extra activation at −45 mV is that additional channels are recruited by CICR resulting from the summation of Ca2+ from closely spaced voltage-activated Ca2+ release sites. Figure 8 is useful for evaluating how this might happen. This figure is adapted from Shirokova et al. (1996), who used essentially the same scheme to account for the voltage dependence of the peak to steady ratio of Ca2+ release (see Introduction). Each panel shows a double array of ryanodine receptors in the SR junctional region illustrated by circles. As indicated by the label V (for voltage sensor), alternate RyRs are associated with DHPRs. Panel A depicts two neighbouring voltage-activated RyRs indicated by the squares. The lower curves are the predicted steady-state Δ[Ca2+] gradients due to Ca2+ release from each of the two channels in the presence of 20 mm EGTA. The curve in the middle - the sum of the two lower curves - is the predicted Δ[Ca2+] with both RyRs open. As expected, summation results in a doubling of Δ[Ca2+] at the RyR midway between the two voltage-activated sites. The dotted-dashed line - indicating a hypothetical threshold for activating an intermediate channel by CICR - is above the midpoint Δ[Ca2+] with just one channel and below that with two channels. This hypothetical threshold would account for the enhanced release at −45 mV and explain why it is not observed at −60 mV or in the Ca2+ spark experiments of Klein et al. (1997) in which most of the voltage sensors were immobilised (see above).
Figure 8. Effect of summation and 8 mm BAPTA on Δ[Ca2+] gradients in the vicinity of open SR Ca2+ release channels.

A, the double array of circles show the distribution of Ca2+ release channels in the junctional SR. Ca2+ release channels labelled V are associated with DHPRs (voltage sensors) in the t-tubular membrane. Channels enclosed in a box are open. Each of the two lower curves above depict the Δ[Ca2+] gradient from one side of an open Ca2+ release channel in the presence of 20 mm EGTA. The curves were calculated with the steady-state solution given by eqns (B14) and (B21) in Pape et al. (1995). Assumed parameter values were, diffusion constant of Ca (DCa) / 3.0 × 10⁻⁶ cm2 s−1, forward rate constant for Ca2+ binding to EGTA = 0.025 × 10⁸m−1 s−1, concentration of Ca2+-free EGTA = 18.24 mm (same as end-pool solution), and flux of Ca2+ ions = 5 × 10⁵ ions s−1 (same values used in Fig. 15 of Pape et al. 1995). NB that the steady-state gradient in the vicinity of a channel should become established essentially instantaneously on a millisecond time scale (Fig. 16 in Pape et al. 1995). The higher curve shows the summation of these two gradients, which is the predicted gradient when both channels are open simultaneously. The distance scale for the gradients is the same as that for the RyRs depicted below, namely 30 nm between RyRs or 60 nm between the two calibration bars. The horizontal dot-dashed line shows a hypothetical threshold of 8 μm for activation of a Ca2+ release channel by CICR (see text). B is the same as A except that the distance between the two open channels is greater. The vertical dashed line marks the position of a nearest channel to one of the open channels. C is the same as A except that the calculations were made with 8 mm BAPTA and no EGTA. The gradients should be almost the same with a more complete (and more involved) solution including the presence of 20 mm EGTA. Assumed parameter values were: forward rate constant for Ca2+ binding to BAPTA = 1 × 10⁸m−1 s−1 (from Kits et al. 1999); concentration of Ca-free BAPTA = 6.28 mm (same as end-pool solution); values of DCa and Ca2+ flux were the same as those given above. With the assumed parameters, the characteristic space constant for the distance a Ca2+ ion diffuses before binding to buffer (given by eqn (B14) in Pape et al. 1995) is 22 nm for BAPTA as opposed to 81 nm for EGTA.
Figure 8B shows the predicted gradients with a separation of 120 nm between neighbouring voltage-activated sites. This result indicates that there would be only a modest increase in Δ[Ca2+] resulting from summation at one of the nearest RyRs, indicated by the dashed line. Therefore, a significant summation effect could only come from two nearest-neighbour, voltage-activatable RyRs (either laterally or diagonally apposed) that are simultaneously activated. Once one intermediate channel is activated by CICR, other channels would become activated due to the summation of Δ[Ca2+]s from now three closely spaced channels, a self-propagating process which could result in the recruitment of many channels. Modelling results of Stern et al. (1997) indicate that an all-or-none response could be prevented by Ca inactivation and/or periodic gaps in the double-array disposition of channels (Franzini-Armstrong et al. 1999).
One potential difficulty with the explanation above is its apparent requirement for the simultaneous activation by voltage of closely spaced RyRs to get the process started. As discussed in the preceding section, it appears that the enhancement starts when only a small amount of intramembranous charge has moved so that the average density of voltage-activated channels must be relatively small. If the voltage-activated Ca2+ release sites are randomly distributed, the likelihood of the requirement being met is small. As shown in Jong et al. (1995b) and discussed above with Fig. 6, however, an increase in [CaSR] results in faster kinetics of the Qγ component of intramembranous charge movement, an effect that is probably due to Δ[Ca2+] from neighbouring open RyRs. Therefore, Ca2+ from one voltage-activated RyR should enhance the probability of activation by voltage of a nearby site resulting in two closely spaced voltage-activated RyRs. The explanation of an enhanced rate of Ca2+ release due to summation of Δ[Ca2+] appears to require a link with the effect of Ca2+ release to speed up the kinetics of Qγ.
Alternative explanations for extra activation component at −45 mV not involving recruitment of non-coupled Ca2+ release channels by CICR
There are several possible explanations for a Ca-dependent extra activation component of Ca2+ release at −45 mV that do not involve recruitment of uncoupled RyRs. Analogous to the relationship of release permeability vs. [CaSR] (Fig. 5A), Tripathy & Meissner (1996) evaluated the relationship of the open probability of reconstituted SR Ca2+ release channels in bilayers (Po) vs. Ca2+ flux through the channels. Po was near zero when the Ca2+ flux was near zero and it increased as the Ca2+ flux increased, reaching a peak at intermediate Ca2+ fluxes. The increase in Po was due to an increase in mean open time and was attributed to myoplasmic as opposed to luminal Ca regulatory sites (Tripathy & Meissner, 1996). Because of the similarity of the rising phase of Povs. Ca2+ flux and the increase in release permeability when [CaSR] increases from < 100 μm to ≈300 μm at both −60 and −45 mV, it seems likely that the same regulatory mechanism is involved in the more intact preparation (an assessment also made by Pape & Carrier, 1998). One possible explanation for the results in this study is that the voltage sensor somehow regulates Ca binding to or the efficacy of the Ca regulatory site so that the increased mean open time is more pronounced at −45 mV compared to −60 mV. The voltage independence of Ca2+ spark properties indicated by Klein et al. (1997; see above) appears to rule out this explanation, as well as several other possibilities.
One possibility not ruled out is that voltage-activatable (coupled) RyRs can also be at least partially activated by Ca. In the model of Jong et al. (1995b), the voltage sensor is composed of four particles - corresponding to the four subunits of the DHPR - and all four particles must undergo transitions to an activating state before the associated SR Ca2+ release can be opened. A recent study of Qγ and Ca2+ release (Pape & Carrier, 2002) supports the idea that some Qγ charge moves during non-opening transitions in partial support of this and similar models proposed by other researchers. It is possible that Ca binding to a subunit of the DHPR could replace a requirement for its activation by voltage. The result of this combined voltage/CICR activation would be an enhanced Ca2+ release from coupled RyRs with little or no additional charge movement. This effect would tend to progress to neighbouring, coupled RyRs though some voltage control would be maintained since recruitment of an additional channel would generally require at least partial activation by voltage. In addition to its dependence on Ca, this explanation would account for the lack of enhanced release at −60 mV or when a large fraction of charge is immobilised as in the Ca2+ spark results of Klein et al. (1997). To also account for a possible enhancement early in the release permeability signal, this mechanism would also have to act in concert with the speeding up effect of Ca2+ release on Qγ.
Regardless of the mechanism involved, the Ca-dependent enhancement of Ca2+ release at more depolarised potentials is likely to be important for a muscle fibre's ability to reach near maximal activation during a single action potential.
Method to assess release permeability in the presence of BAPTA and EGTA
The determination of release permeability requires information about dΔ[CaT]/dt which is not directly available when BAPTA is present. The alternative approach used in this study is to evaluate fCa, the fraction of SR Ca2+ content released by a pulse, given by the equation:
| (A1) |
The numerator is the total Ca2+ released by the pulse and the denominator is equivalent to [CaSR] before the pulse (Δ[CaT]before is zero for the first pulse of a series and non-zero for later pulses, e.g. for the pulse to −45 mV in Fig. 1C). It should be noted that fCa is in fact very close to the integral of the release permeability when a small fraction of SR Ca2+ is released.
The following assessment indicates that fCa estimated with the EGTA/phenol red method still provides a good estimate of the actual fCa when 8 mm BAPTA is present. With BAPTA present:
| (A2) |
For the conditions of our experiments, both Δ[CaEGTA] and Δ[CaBAPTA] are approximately proportional to the free Δ[Ca2+], since free [Ca2+] remained below the apparent KDs of both compounds. This means that Δ[CaEGTA] is approximately proportional to Δ[CaT] so that substitution into eqn (A1) gives:
| (A3) |
which is the same relationship used to estimate fCa in the absence of BAPTA. In order to assess errors in this estimate, [CaBAPTA] was estimated from [CaEGTA] and [EGTA] by equating the equilibrium binding functions as shown here:
 |
(A4) |
In analogy to the case of EGTA (Appendix A of Pape et al. 1995), the apparent KD of BAPTA was estimated from the relationship:
| (A5) |
where KD,B is the dissociation constant of the reaction of Ca2+ with BAPTA. The values of KD,B, pK1 and pK2 assumed here, 0.107 μm, 6.36 and 5.47, respectively, were determined from in vitro measurements at 22 °C by Tsien (1980). The concentrations of total EGTA and BAPTA ([EGTAT] and [BAPTAT]) are assumed to be those present in the end pools, 20 and 8 mm, respectively. As in Pape et al. (1995), [CaEGTA] at rest was also assumed to be the same as that present in the end pools, and [CaEGTA] at later times was given by this resting value plus the measured Δ[CaEGTA]. Equation (A4) was then used to calculate [CaBAPTA] at rest and at later times, thereby providing an estimate of Δ[CaBAPTA]. The actual fCa from eqns (A1) and (A2) was then compared with the value from eqn (A3). With this approach, eqn (A3) produces an overestimation of fCa(-45) of between 3 and 15 % with an average of 8.6 % (s.e.m. / 1.6 %) for the values used for the last value in row 5 of Table 1. Essentially the same error applied to the fCa(-60) values used for the last value in row 4 of Table 1 with an average error of 8.9 % (s.e.m. = 1.6 %). Most of the error is due to the fact that Δ[CaBAPTA] is not exactly proportional to Δ[Ca2+]. This assessment also took into account the fact that some protons are released when Ca2+ binds to BAPTA (0.2 protons on average vs. 2 for EGTA). Neglecting this component produces only a 0.5 % error in fCa.
In summary, fCa estimated with eqn (A3) is expected to provide a good estimate of the actual value. Because of all of the assumptions used to calculate [CaBAPTA], and thereby the actual fCa, the fCa values reported in this article were determined with eqn (A3).
This appendix gives a solution for the expected time course of Δ[CaEGTA] when BAPTA is present. This solution was used to evaluate whether BAPTA affected the time course of the measured Δ[CaEGTA] signal in response to a 400-ms pulse to −60 mV in a manner consistent with its Ca2+-buffering properties.
The principle binding equations of Ca2+ with BAPTA and EGTA are:
| (B1) |
and
| (B2) |
The equations describing these reactions are given by:
| (B3) |
and
| (B4) |
where kf,B and kr,B are the forward and backward rate constants, respectively, of the reaction between Ca2+ and BAPTA and kf,E and kr,E are the corresponding rate constants for the reaction with EGTA. All four rate constants are assumed to be unchanged during the release process. The backward rate constant of EGTA (and presumably that of BAPTA as well) is sensitive to pH and would therefore be expected to change during a stimulation. The effect of assuming that rate constants do not vary was tested with the final solution with values of kr,B and kr,E determined from the pH values before and after the simulated pulse to −60 mV. The solutions are almost identical indicating that the assumption is valid.
Since the concentrations of total EGTA and total BAPTA should be essentially constant during a relatively short period of release (order of seconds), [BAPTAT] and [EGTAT] are assumed to be constant during the stimulation. [BAPTA] and [EGTA] are given by [BAPTAT] - [CaBAPTA] and [EGTAT] - [CaEGTA], respectively. Each of the concentrations can be written as its resting value (indicated by a subscript R) and the change with respect to this resting value (indicated with the prefix Δ); e.g. [Ca2+] / [Ca2+]R + Δ[Ca2+]. Substituting all of these relationships into eqns (B3) and (B4), subtracting the corresponding steady-state equations before the initiation of Ca2+ release, and rearranging yields:
 |
(B5) |
and
 |
(B6) |
As confirmed with the solutions of these equations, the 2nd terms on the right-hand sides of each of these equations are very small and can be neglected. This follows since kf,BΔ[Ca2+] << kr,B and kf,E Δ[Ca2+] << kr,E (the maximum of kf,E Δ[Ca2+] was less than 3 % of kr,E for the simulated 400-ms pulse to −60 mV). Neglecting the 2nd terms on the right yields the following linear equations:
 |
(B7) |
and
 |
(B8) |
Since essentially all of the Ca2+ that is released should be captured by either BAPTA or EGTA or appear in the Ca-free form (see Pape et al. 1995), it follows that the change in total myoplasmic Ca is given by:
| (B9) |
After using eqn (B9) to eliminate Δ[Ca2+] in eqns (B7) and (B8), rearranging the modified eqn (B8) to give Δ[CaBAPTA] in terms of Δ[CaEGTA] and substituting this into the modified eqn (B7), and rearranging, one obtains the following 2nd order differential equation for Δ[CaEGTA]:
 |
(B10) |
a, b, c and d are constants given by the following relationships,
 |
and
where
 |
and
| (B11) |
with the substitution y = Δ[CaEGTA], eqn (B10) can be written in the more concise form:
| (B12) |
The solution of this equation is given by the sum of the homogeneous solution in which the right-hand side is set to zero and a particular solution, i.e.
| (B13) |
The homogeneous solution is given by:
| (B14) |
The exponential time constantsare given by:
| (B15) |
and
| (B16) |
Solution for Δ[CaEGTA] when Δ[CaT] is a ramp function
The solution of eqn (B12) requires information about Δ[CaT]. We consider the case in which Δ[CaT] is a ramp function, i.e. it increases linearly with time after the start of a pulse. Following the end of the pulse, Δ[CaT] remains constant. This is the approximate time course of Δ[CaT] in response to a 400-ms pulse to −60 mV in the absence of BAPTA (cf. Fig. 1C). (The measured Δ[CaT] signal is actually well described by a ramp function starting ≈20 ms after the start of the pulse and ending ≈20 ms after the end of the pulse. For simplicity, these delays are not incorporated in the solution below, but they were included in the simulations plotted in Fig. 1D.) It is assumed that Δ[CaT] is still given by a ramp function in the presence of BAPTA though its magnitude can change. The solution is divided into two parts. During the pulse:
| (B17) |
where the rate of Ca2+ release, m, is given by Δ[CaT] at the end of the pulse divided by the duration of the pulse, denoted Tpulse. After the pulse, detailed in the next section:
| (B18) |
During the pulse, the particular solution is given by:
| (B19) |
The constants c1 and c2 in eqn (B14) are determined from the initial conditions:
| (B20) |
The values are:
| (B21) |
and
| (B22) |
This completes the solution for Δ[CaEGTA] (or y) during the pulse, i.e. eqns (B13), (B14) and (B19) with constants determined from eqns (B11), (B15)–(B17), (B21) and (B22).
Solution for Δ[CaEGTA] after the pulse when Δ[CaT] is constant
After the pulse (t > Tpulse), Δ[CaT] remains constant at Δ[CaT](Tpulse) as given by eqn (B18). The differential equation then becomes:
| (B23) |
and the homogeneous solution becomes:
| (B24) |
The particular solutions in this case is a constant given by the value of Δ[CaEGTA] at infinite time. This value is:
| (B25) |
The constants c1 and c2 in eqn (B14) are determined from the conditions that y and dy/dt are continuous with the solution before the pulse, i.e. the initial values are Δ[CaEGTA](Tpulse) and dΔ[CaEGTA]/dt(Tpulse), respectively, from the solution in the preceding section. With this condition:
 |
(B26) |
and
| (B27) |
This completes the solution for Δ[CaEGTA] (or y) after the pulse, i.e. eqns (B13), (B24) and (B25) with constants determined from eqns (B11), (B15), (B16), (B18), (B26) and (B27).
Calculation of earlier Δ[CaEGTA] signal in Fig. 1D
This section discusses an example of the above solution of Δ[CaEGTA] based on the experimental conditions when the Δ[CaEGTA] signal with BAPTA present in Fig. 1D was measured. The forward rate constants for BAPTA and EGTA (kf,B and kf,E) were assumed, respectively, to be 1.0 × 10⁸m−1 s−1 (from Kits et al. 1999) and 2.5 × 10⁶m−1 s−1 (p. 313 of Pape et al. 1995). The apparent dissociation constant for BAPTA was calculated from eqn (A5) with the value of pH given by the measured pHR value of 6.833. The corresponding apparent dissociation constant for EGTA was calculated with eqn (A9) in Pape et al. (1995). The reverse rate constants for BAPTA and EGTA (kr,B and kr,E), were obtained from these dissociation constants multiplied by the corresponding forward rate constant above; the resulting values were 14.5 and 2.0 s−1, respectively. The value of [Ca2+]R was estimated with the EGTA/phenol red method as described in Pape et al. (1995; pp. 312-314). This value of [Ca2+]R was then used to estimate [BAPTA]R and [EGTA]R with the corresponding apparent dissociation constants and values of [BAPTAT] and [EGTAT], respectively. [EGTAT] was assumed to be 20 mm, the same as in the end pools. [BAPTAT] was assumed to be 7.5 mm, determined from the diffusion equation (eqn (6) on p. 47 of Maylie et al. 1987) assuming a diffusion constant of 1.1 × 106 cm2 s−1 and the fact that 8 mm BAPTA was added to the end pools 56 min before the stimulation. The values of a, b, c and d in eqn (B11) were then calculated. The resulting values of τ1 and τ2 from eqns (B15) and (B16) were 262 and 0.0018 ms, respectively.
For the solution after the pulse, the values of c1 and c2 from eqns (B26) and (B27) were −34.0 and 0.00024 μm, respectively. Therefore, the second exponential component is negligible and the solution is closely approximated by:
| (B28) |
This indicates a simple mono-exponential redistribution of Ca2+ from BAPTA to EGTA after the pulse with a time constant of 262 ms.
For the calculation of the early Δ[CaEGTA] signal in Fig. 1D, the total amount of Ca2+ released during the pulse was assumed to be 2 times the amount captured by EGTA after steady-state conditions were reached (used to calculate m in eqn (B17)).
Solution taking into account counter-ion movements of protons
Pape et al. (1990) reported an alkalisation of myoplasm during Ca2+ release and suggested that it was due to counter-ion movements of protons into the SR partially balancing the charge deficit caused by Ca2+ leaving the SR. The magnitude of the alkalisation suggested that proton movements accounted for 12 % on average of the charge deficit caused by Ca2+ release. In the absence of BAPTA, this error means that Δ[CaT] should actually be given by the Δ[CaEGTA] signal multiplied by a linear scaling factor, (1-0.12)−1 or 1.14 (Pape et al. 1995). Since the EGTA/ phenol red method has generally been used to evaluate relative changes, this scaling factor has not been taken into account. In the case of the BAPTA experiments in this study, however, counter-ion movements of protons would influence the time course of Δ[CaEGTA] (though, importantly, not fCa). In order to take this into account for the predicted Δ[CaEGTA] signal, 0.12 times the assumed Δ[CaT] driving function was subtracted from Δ[CaEGTA] estimated as described in the preceding section. As seen in Fig. 1D, this produces a relatively larger decrease in Δ[CaEGTA] during the pulse compared to that after the pulse and a better match to the measured Δ[CaEGTA] signal.
For the calculation of the later Δ[CaEGTA] signal in Fig. 1D, the total amount of Ca2+ released during the pulse was assumed to be 2.7 times the amount captured by EGTA after steady-state conditions were reached (used to calculate m in eqn (B17)).
References
- Adrian RH, Peres A. A ‘gating’ signal for the potassium channel? Nature. 1977;267:800–804. doi: 10.1038/267800a0. [DOI] [PubMed] [Google Scholar]
- Baylor SM, Chandler WK, Marshall MW. Sarcoplasmic reticulum calcium release in frog skeletal muscle fibres estimated from arsenazo III calcium transients. Journal of Physiology. 1983;334:625–666. doi: 10.1113/jphysiol.1983.sp014959. [DOI] [PMC free article] [PubMed] [Google Scholar]
- Block BA, Imagawa T, Campbell KP, Franzini-Armstrong C. Structural evidence for direct interaction between the molecular components of the transverse tubule/sarcoplasmic reticulum junction in skeletal muscle. Journal of Cell Biology. 1988;107:2587–2600. doi: 10.1083/jcb.107.6.2587. [DOI] [PMC free article] [PubMed] [Google Scholar]
- Chandler WK, Hui CS. Membrane capacitance in frog cut twitch fibers mounted in a double Vaseline-gap chamber. Journal of General Physiology. 1990;96:225–256. doi: 10.1085/jgp.96.2.225. [DOI] [PMC free article] [PubMed] [Google Scholar]
- Colquhoun D, Sigworth FJ. Fitting and statistical analysis of single-channel records. In: Sakmann B, Neher E, editors. Single-Channel Recording. New York: Plenum Publishing Corp.; 1983. pp. 191–263. [Google Scholar]
- Franzini-Armstrong C, Protasi F, Ramesh V. Shape, size, and distribution of Ca2+ release units and couplons in skeletal and cardiac muscles. Biophysical Journal. 1999;77:1528–1539. doi: 10.1016/S0006-3495(99)77000-1. [DOI] [PMC free article] [PubMed] [Google Scholar]
- Hollingworth S, Harkins AB, Kurebayashi N, Konishi M, Baylor SM. Excitation-contraction coupling in intact frog skeletal muscle fibers injected with mmolar concentrations of fura-2. Biophysical Journal. 1992;63:224–234. doi: 10.1016/S0006-3495(92)81599-0. [DOI] [PMC free article] [PubMed] [Google Scholar]
- Huang C L-H. Pharmacological separation of charge movement components in frog skeletal muscle. Journal of Physiology. 1982;324:375–387. doi: 10.1113/jphysiol.1982.sp014118. [DOI] [PMC free article] [PubMed] [Google Scholar]
- Hui CS. Differential properties of two charge components in frog skeletal muscle. Journal of Physiology. 1983;337:531–552. doi: 10.1113/jphysiol.1983.sp014640. [DOI] [PMC free article] [PubMed] [Google Scholar]
- Hui CS, Chandler WK. Intramembranous charge movement in frog cut twitch fibers mounted in a double Vaseline-gap chamber. Journal of General Physiology. 1990;96:257–297. doi: 10.1085/jgp.96.2.257. [DOI] [PMC free article] [PubMed] [Google Scholar]
- Hui CS, Chandler WK. Qβ and Qγ components of intramembranous charge movement in frog cut twitch fibers. Journal of General Physiology. 1991;98:429–464. doi: 10.1085/jgp.98.3.429. [DOI] [PMC free article] [PubMed] [Google Scholar]
- Jacquemond V, Csernoch L, Klein MG, Schneider MF. Voltage-gated and calcium-gated calcium release during depolarization of skeletal muscle fibers. Biophysical Journal. 1991;60:867–873. doi: 10.1016/S0006-3495(91)82120-8. [DOI] [PMC free article] [PubMed] [Google Scholar]
- Jong D-S, Pape PC, Chandler WK. Calcium inactivation of calcium release in frog cut muscle fibers that contain millimolar EGTA or fura-2. Journal of General Physiology. 1995a;106:337–388. doi: 10.1085/jgp.106.2.337. [DOI] [PMC free article] [PubMed] [Google Scholar]
- Jong D-S, Pape PC, Chandler WK. Effect of sarcoplasmic reticulum calcium depletion on intramembranous charge movement in frog cut muscle fibers. Journal of General Physiology. 1995b;106:659–704. doi: 10.1085/jgp.106.4.659. [DOI] [PMC free article] [PubMed] [Google Scholar]
- Jong D-S, Pape PC, Chandler WK, Baylor SM. Reduction of calcium inactivation of sarcoplasmic reticulum calcium release by fura-2 in voltage-clamped cut twitch fibers from frog muscle. Journal of General Physiology. 1993;102:333–370. doi: 10.1085/jgp.102.2.333. [DOI] [PMC free article] [PubMed] [Google Scholar]
- Kits KS, de Vlieger TA, Kooi BW, Mansvelder HD. Diffusion barriers limit the effect of mobile calcium buffers on exocytosis of large dense cored vesicles. Biophysical Journal. 1999;76:1693–1705. doi: 10.1016/S0006-3495(99)77328-5. [DOI] [PMC free article] [PubMed] [Google Scholar]
- Klein MG, Lacampagne A, Schneider MF. Voltage dependence of the pattern and frequency of discrete Ca2+ release events after brief repriming in frog skeletal muscle. Proceedings of the National Academy of Sciences of the USA. 1997;94:11061–11066. doi: 10.1073/pnas.94.20.11061. [DOI] [PMC free article] [PubMed] [Google Scholar]
- Maylie J, Irving M, Sizto NL, Chandler WK. Comparison of arsenazo III optical signals in intact and cut frog twitch fibers. Journal of General Physiology. 1987;89:41–81. doi: 10.1085/jgp.89.1.41. [DOI] [PMC free article] [PubMed] [Google Scholar]
- Neher E. Concentration profiles of intracellular calcium in the presence of a diffusible chelator. In: Heinemann U, Klee M, Neher E, Singer W, editors. Calcium Electrogenesis and Neuronal Functioning. Berlin, Heidelberg: Springer-Verlag; 1986. pp. 80–96. [Google Scholar]
- Pape PC. pH in cut frog muscle fibers. Biophysical Journal. 1990;57:347A. [Google Scholar]
- Pape PC, Carrier N. Effect of sarcoplasmic reticulum (SR) calcium content on SR Ca release elicited by small voltage-clamp depolarizations in frog cut skeletal muscle fibers. Journal of General Physiology. 1998;112:161–179. doi: 10.1085/jgp.112.2.161. [DOI] [PMC free article] [PubMed] [Google Scholar]
- Pape PC, Carrier N. Calcium release and intramembranous charge in frog skeletal muscle with reduced (< 250 μm) calcium content. Journal of Physiology. 2002;539:1253–1266. doi: 10.1113/jphysiol.2001.012728. [DOI] [PMC free article] [PubMed] [Google Scholar]
- Pape PC, Jong D-S, Chandler WK, Baylor SM. Effect of fura-2 on action-potential stimulated calcium release in cut twitch fibers from frog muscle. Journal of General Physiology. 1993;102:295–332. doi: 10.1085/jgp.102.2.295. [DOI] [PMC free article] [PubMed] [Google Scholar]
- Pape PC, Jong D-S, Chandler WK. Calcium release and its voltage dependence in frog cut muscle fibers equilibrated with 20 mm EGTA. Journal of General Physiology. 1995;106:259–336. doi: 10.1085/jgp.106.2.259. [DOI] [PMC free article] [PubMed] [Google Scholar]
- Pape PC, Jong D-S, Chandler WK. A slow component of intramembranous charge movement during sarcoplasmic reticulum calcium release in frog cut muscle fibers. Journal of General Physiology. 1996;107:79–101. doi: 10.1085/jgp.107.1.79. [DOI] [PMC free article] [PubMed] [Google Scholar]
- Pape PC, Konishi M, Hollingworth S, Baylor S. Perturbation of sarcoplasmic reticulum calcium release and phenol red absorbance transients by large concentrations of fura-2 injected into frog skeletal muscle fibers. Journal of General Physiology. 1990;96:493–516. doi: 10.1085/jgp.96.3.493. [DOI] [PMC free article] [PubMed] [Google Scholar]
- Ríos E, Pizarro G. Voltage sensors and calcium channels of excitation-contraction coupling. News in Physiological Sciences. 1988;3:223–227. [Google Scholar]
- Ríos E, Stern MD. Calcium in close quarters, microdomain feedback in excitation-contraction coupling and other cell biological phenomena. Annual Review of Biophysics and Biomolecular Structure. 1997;26:47–82. doi: 10.1146/annurev.biophys.26.1.47. [DOI] [PubMed] [Google Scholar]
- Schneider MF, Chandler WK. Voltage dependent charge movement in skeletal muscle, a possible step in excitation-contraction coupling. Nature. 1973;242:244–246. doi: 10.1038/242244a0. [DOI] [PubMed] [Google Scholar]
- Schneider MF, Simon BJ. Inactivation of calcium release from the sarcoplasmic reticulum in frog skeletal muscle. Journal of Physiology. 1988;405:727–745. doi: 10.1113/jphysiol.1988.sp017358. [DOI] [PMC free article] [PubMed] [Google Scholar]
- Shirokova N, García J, Pizarro J, Ríos E. Ca2+ release from the sarcoplasmic reticulum compared in amphibian and mammalian skeletal muscle. Journal of General Physiology. 1996;107:1–18. doi: 10.1085/jgp.107.1.1. [DOI] [PMC free article] [PubMed] [Google Scholar]
- Simon BJ, Klein MG, Schneider MF. Calcium dependence of inactivation of calcium release from sarcoplasmic reticulum in skeletal muscle fibers. Journal of General Physiology. 1991;97:437–471. doi: 10.1085/jgp.97.3.437. [DOI] [PMC free article] [PubMed] [Google Scholar]
- Simon BJ, Schneider MF, Szucs G. Inactivation of sarcoplasmic reticulum calcium release in frog skeletal muscle is mediated by calcium. Journal of General Physiology. 1985;86:36A. [Google Scholar]
- Stern MD. Buffering of calcium in the vicinity of a channel pore. Cell Calcium. 1992;13:183–192. doi: 10.1016/0143-4160(92)90046-u. [DOI] [PubMed] [Google Scholar]
- Stern MD, Pizarro G, Ríos E. Local control model of excitation-contraction coupling in skeletal muscle. Journal of General Physiology. 1997;110:415–440. doi: 10.1085/jgp.110.4.415. [DOI] [PMC free article] [PubMed] [Google Scholar]
- Stroffekova K, Heiny JA. Triadic Ca2+ modulates charge movement in skeletal muscle. General Physiology and Biophysics. 1997a;16:59–77. [PubMed] [Google Scholar]
- Stroffekova K, Heiny JA. Stimulation-dependent redistribution of charge movement between unavailable and available states. General Physiology and Biophysics. 1997b;16:79–89. [PubMed] [Google Scholar]
- Tripathy A, Meissner G. Sarcoplasmic reticulum lumenal Ca2+ has access to cytosolic activation and inactivation sites of skeletal muscle Ca2+ release channel. Biophysical Journal. 1996;70:2600–2615. doi: 10.1016/S0006-3495(96)79831-4. [DOI] [PMC free article] [PubMed] [Google Scholar]
- Tsien RY. New calcium indicators and buffers with high selectivity against magnesium and protons, design, synthesis, and properties of prototype structures. Biochemistry. 1980;19:2396–2404. doi: 10.1021/bi00552a018. [DOI] [PubMed] [Google Scholar]
- Vergara J, Caputo C. Effects of tetracaine on charge movement and calcium signals in frog skeletal muscle fibers. Proceedings of the National Academy of Sciences of the USA. 1983;80:1477–1481. doi: 10.1073/pnas.80.5.1477. [DOI] [PMC free article] [PubMed] [Google Scholar]