

Abstract
Ca2+ wave activity was monitored in the longitudinal (LM) layer of isolated murine caecum and proximal colon at 35 °C with fluo-4 AM and an iCCD camera. Both intracellular (within LM cells) and intercellular (also spreading from cell to cell) Ca2+ waves were observed. Intracellular Ca2+ waves were associated with a lack of muscle movement whereas intercellular Ca2+ waves, which were five times more intense than intracellular waves, were often associated with localized contractions. Several intracellular Ca2+ waves were present at the same time in individual LM cells. Waves in adjacent LM cells were not coordinated and were unaffected by TTX (1 μM) but were blocked by IP3 receptor antagonists xestospongin-C (Xe-C; 2 μM) or 2-aminoethyl diphenylborate (2-APB; 25 μM), and by ryanodine (10 μM). Caffeine (5 mm) restored wave activity following blockade with Xe-C. NiCl2 (1 mm) blocked intracellular Ca2+ waves, and nicardipine (2 μM) reduced their frequency and intensity, but did not affect their velocity, suggesting the sarcoplasmic reticulum may be fuelled by extracellular Ca2+ entry. Intercellular Ca2+ waves often occurred in bursts and propagated rapidly across sizeable regions of the LM layer and were blocked by heptanol (0.5 mm). Intercellular Ca2+ waves were dependent upon neural activity, external Ca2+ entry through L-type Ca2+ channels, and amplification via calcium-induced calcium release (CICR). In conclusion, intracellular Ca2+ waves, which may reduce muscle excitability, are confined to individual LM cells. They depend upon Ca2+ release from internal Ca2+ stores and are likely to be fuelled by extracellular Ca2+ entry. Intercellular Ca2+ waves, which are likely to underlie smooth muscle tone, mixing and propulsion, depend upon neural activity, muscle action potential propagation and amplification by CICR.
The large intestine transforms liquid chyme into solid stools by absorbing water and electrolytes. To do this, the large bowel exhibits a repertoire of motor behaviours that include mixing, storage and propulsion of contents. These motor patterns are produced by the contractile state of the longitudinal and circular smooth muscles, which are regulated by activity of the enteric nervous system and interstitial cells of Cajal (ICC; Smith & Sanders, 1994).
The contractile state of smooth muscle is regulated by Ca2+ which is a complex intracellular messenger involved in both contraction and relaxation (Nelson et al. 1995). An increase in global cytoplasmic concentration of Ca2+ activates myosin light chain kinase to cause cell shortening (see review: Bolton et al. 1999; Smith & Sanders, 1994). In intestinal smooth muscle, cell shortening is dependent on Ca2+ entry through L-type voltage-dependent Ca2+ channels located on the plasma membrane, as Ca2+ transients associated with muscle action potentials are blocked by dihydropyridine antagonists (Kohda et al. 1997). However, additional Ca2+ release may be recruited from intracellular stores located in the sarcoplasmic reticulum (portal vein myocytes: Arnaudeau et al. 1997). In intact smooth muscle, intercellular Ca2+ waves spread quickly between adjacent cells, apparently being initiated by action potentials that spread through the syncitium (urinary bladder: Hashitani et al. 2001; guinea-pig colon: Stevens et al. 1999, Spencer et al. 2002; guinea-pig ileum: Stevens et al. 2000). It still remains to be determined how the pattern of intercellular Ca2+ wave activity produces the wide range of motor behaviours seen in the gastrointestinal tract.
Release of Ca2+ from intracellular stores in small discrete regions associated with the plasma membrane has little effect on global cytoplasmic Ca2+ concentration, but does result in high Ca2+ concentrations locally. These ‘sparks’ or ‘puffs', depending on which store Ca2+ is released from, activate any Ca2+-dependent channels/processes in close proximity to the release site, but do not activate contractile proteins directly (see review: Jaggar et al. 2000a). Simultaneous recordings of Ca2+-induced fluorescence and membrane currents/voltage have shown that ‘sparks’ activate Ca2+-dependent K+ channels to cause membrane hyperpolarization and relaxation (Mironneau et al. 1996). Under certain conditions, the spatio-temporal recruitment of ‘sparks’ from local release sites produces an intracellular Ca2+ wave (Bolton & Gordienko, 1998; Gordienko et al. 1998) that propagates some distance from the site of origin. Apart from activating spontaneous outward (K+) currents (STOCS; Bolton & Gordienko et al. 1998; Jaggar et al. 2000a) that reduce excitability of smooth muscle cells to promote relaxation, these intracellular waves also appear, in some situations, to activate spontaneous inward (Cl−) currents (STICS; Mironneau et al. 1996) that can depolarize the cell.
The majority of studies on intracellular Ca2+ waves have been performed on single smooth muscle cells (dispersed or cultured) at room temperature. It is currently unknown if the characteristics of these waves are different in intact muscle syncitia at physiological temperatures. Similarly, it is unknown if intracellular Ca2+ wave activity spreads between adjacent cells in intact muscle syncitia to coordinate activity between a number of cells. In this study we have examined the nature and pattern of both intracellular and intercellular Ca2+ waves in the murine caecum/proximal colon. A preliminary account of these results has been published in abstract form (Hennig & Smith, 2000).
Methods
Tissue preparation
Mice (C57/Black 6) of either sex, weighing 15–25 g were killed by CO2 inhalation followed by exsanguination, in accordance with the requirements of the Animal Ethics Committee at the University of Nevada, Reno, USA. A ventral midline incision was made to expose the peritoneal cavity and the caecum/proximal colon was removed. The tissue was opened along the mesenteric border and pinned flat in a Sylgard-lined petri dish. After flushing with oxygenated (97 % O2-3 % CO2) Krebs solution, composition (mm): NaCl 120.35, KCl 5.9, NaHCO3 15.5, MgCl2 1.2, NaH2PO4 1.2, CaCl2 2.5, d-glucose 11.5, pH 7.4, the mucosa and submucosa were peeled away and the tissue was pinned serosal side topmost in an organ bath containing Krebs solution at 35 ± 0.5 °C. Bath temperature was maintained using a water jacket built into the wall of the organ bath, and continuous perfusion of the interior chamber with warmed, oxygenated Krebs solution (8 ml min−1). The water jacket was heated by circulating water from a heated reservoir (45 °C) using a PolyScience Model 1112 water circulator (1.2 l min−1). As the bath was narrow (22 mm wide, 120 mm long, volume 10 ml) the temperature differential between the edge and middle of the bath was < 1.0 °C. Bath temperature was not noticeably altered with a microscope lens immersed in the Krebs solution. The tissue was left to equilibrate for ≈1.5 h.
Fluorescent dye loading procedure
After equilibration, the preparation was incubated with 5 μM fluo-4 AM (FluoroPure or cell permeant, special packaging; Molecular Probes, Eugene, OR, USA), 0.02 % dimethyl sulfoxide and 0.01 % non-cytotoxic detergent cremophor EL (Sigma, St Louis, MO, USA), for 16 min at 25 ± 2 °C. As the tissue was pinned taut with circular muscle side down and the dye was only applied to the serosal surface, very little dye penetrated the underside of the preparation, evidenced by lack of loading in the circular muscle (CM). Following incubation, the tissue was perfused with Krebs solution (35 ± 0.5 °C) for 20–30 min to allow for de-esterification.
Drugs used
Atropine, caffeine, nicardipine, ryanodine, tetrodotoxin (TTX) and heptanol were purchased from Sigma. Xestospongin-C (Xe-C) was purchased from Calbiochem (La Jolla, CA, USA). 2-Aminoethyl diphenylborate (2-APB) was purchased from Tocris (Balwin, MO, USA).
Visualization of Ca2+ waves
The preparation was viewed under an Olympus BX50WI (Olympus, Melville, NY, USA) microscope fitted with epi-fluorescence. Light was supplied by a 100 W high pressure mercury burner (Bulb: Osram HBO 103W/2; Power supply: Olympus BH2-RFL-T3; Burner: Olympus U-ULS100HG). A number of water immersion lenses were used depending on the type of Ca2+ wave activity (×2, PlanApo; ×4, UPlanFl; ×10, ×20, ×40, ×60, Olympus UMPlanF). Neutral density filters were used to adjust excitation and emission light intensities (excitation: Olympus U-ND25-2/U-ND6-2/U-DND; emission: Olympus U-AN). A wide interference blue filter cube (U-MWIB) filtered excitation wavelengths to a band of 460–490 nm, and filtered emitted light from the Ca2+ fluorescent dye so only wavelengths greater than 515 nm were visualized, suitable for fluo-4 AM (peaks: excitation 490 nm, emission 515 nm). Ca2+-induced fluorescence was recorded using an iCCD camera (adapter: Olympus U-TV1 X; camera: IC-300B, Photon Technology International, Monmouth Junction, NH, USA) onto digital video deck (DHR-1000: Sony Corporation, Japan). Camera voltage and gain were adjusted to provide the maximum range of fluorescence intensity without over-saturation of the signal.
Tension recordings
To elucidate the possible physiological role of intercellular Ca2+ wave activity on muscle tension, strips of LM from the proximal colon were attached to strain gauges (model TST125C, Biopac Systems Inc., Santa Barbara, CA, USA) and activity recorded using Acqknowledge software (Biopac Systems Inc., Santa Barbara, CA, USA).
Spatial and temporal resolution
Lenses were chosen depending on the type of Ca2+ wave being studied. Intercellular Ca2+ waves were recorded using low power lenses (×2 to ×10) giving a field of view of 4.5 mm × 3.0 mm (×2) to 0.9 mm × 0.6 mm (×10). Intracellular Ca2+ waves were studied using ×40 or ×60 objectives resulting in a field of view of 225 μm × 152 μm or 150 μm × 100 μm respectively. However, at higher magnifications all regions of the tissue could be sampled by moving the microscope stage upon which the organ bath was mounted. All experiments were recorded onto digital video tape which has a resolution of 720 pixels × 480 pixels. This corresponds to a calibration factor of 4.8 pixels μm−1 at ×60 and 0.16 pixels μm−1 at ×2 magnification.
The temporal resolution of the video recordings was initially limited to video-rate (DV-NTSC: 29.97 Hz, 33.3 ms frame−1), however using a de-interlacing method, higher temporal resolution was achieved (DV-NTSC de-interlaced 59.94 Hz, 16.7 ms frame−1). De-interlacing involved extracting odd and even lines from each image, and copying them into two separate images in a new image sequence. This effectively halved the vertical spatial resolution.
Image capturing
Video clips were captured using a DV (IEEE-1394) interface to a Macintosh G4 Computer (Apple Computers, Cupertino, CA, USA). Video frames (720 pixels × 480 pixels) were converted to 8-bit grayscale and stored as an image sequence using a modified version of NIH Image 1.62 (NIH, Bethesda, MD, USA). The conversion of the raw 8-bit intensity values to a ratio (F/Favg) is outlined below. The pattern of Ca2+-induced fluorescence during intracellular Ca2+ wave activity within single cells in the intact muscle syncitium and during intercellular Ca2+ wave activity in the LM layer was assessed using spatio-temporal maps (Hennig et al. 1999).
Non-confocal imaging considerations
The longitudinal muscle (LM) layer of the mouse proximal colon is, on average, only one cell thick and is an ideal preparation to record Ca2+ waves using conventional video microscopy. The ends of LM cells occasionally overlapped near the caecum due to the increasingly non-orthogonal arrangement of the LM layer in this region. However, Ca2+ wave activity was recorded further distally (>15 mm distal to the ileo-caecal junction). The fluorescent signal appeared to arise from a monolayer without significant overlapping of cells, as the intensity of a wave was uniform along each cell and waves travelling towards each other most often collided and annihilated each other. Occasionally Ca2+ waves in interstitial cells of Cajal were observed underneath the LM layer, but were easily discriminated based on the non-orthogonal direction of the propagating Ca2+ wave through the more complex-shaped cell body and processes.
Movement considerations
To accurately measure changes in Ca2+-induced fluorescence in LM cells during intra/intercellular Ca2+ wave activity, it was necessary to ensure that the cells of interest remained in the same spatial position in the image sequence. For most experiments in which there was intracellular Ca2+ wave activity, there was very little movement in either the x-y (plane of tissue) or z (plane of focus) direction. During intercellular Ca2+ wave activity, there was considerable movement in the x-y plane, but less movement in the z plane as the tissue was pinned flat. To reduce the apparent movement in all planes during intercellular Ca2+ wave activity, the lens power was reduced (×2 to ×10 instead of ×60) to allow imaging over a larger spatial area. Intercellular Ca2+ waves were considerably more fluorescent than intracellular Ca2+ waves and remained discernable even though their intensity was reduced at low magnifications. Movement in the plane of focus was partially corrected for by adjusting the focus during recording to follow any upward and downward motion of the tissue. This was achieved by observing a single bright point and adjusting the focus to minimize convolution (halo effect of out of focus light). The pattern of movement usually cycled in a regular fashion, and the focus position could be learned after successive iterations.
Motion tracking
The first step in motion stabilization was to extract indications of the movement of the tissue. This was achieved by using a combination of least difference image comparison techniques and stabilization/de-distortion algorithms. A rectangular region (15-50 pixels wide) was drawn in the first image of an image sequence to outline a region of varied background fluorescence (such as particles of undissolved dye). This reference region was then compared to the same region (test region) in the next image of the image sequence by calculating the difference in intensity of each pixel between the two regions. The sum of the differences was calculated and stored with the position of the test region. The position of the test region was moved in a spiral fashion out from its initial position until a predefined radius was reached (< 40 pixels). The position where the difference between the reference region and the test region was at its minimum was located, and this position was stored. This procedure was repeated for each image in the image sequence and proved to be accurate even during changes in fluorescence associated with the passage of Ca2+ waves or if the preparation moved small distances in the plane of focus.
Motion stabilization
If there was no noticeable distortion of the tissue during periodic movement (i.e. if the tissue moved in the field of view but was not being appreciably expanded or compressed in any direction), a new image sequence was created to encompass the region of tissue which was observable at all images in the image sequence. The movement vectors (difference between the x-y coordinates gathered during the motion tracking routines and the top left of the new image sequence) were reversed and were used to position a copy of the always-observable region from the original image into the new image sequence. However, if there was noticeable distortion of the tissue in the image sequence, a de-distortion algorithm was used to artificially ‘stretch’ the image back to an average shape. This algorithm involved tracking (see above) four points to form a quadrangle. The average x-y position of each point during the entire image sequence was calculated along with the movement vectors (difference of the actual x-y position of each point compared to the average x-y position). De-distortion was achieved by extracting each pixel within the quadrangle and applying an offset based on a vector weighting method. Movement vectors for each point were weighted according to their position in the quadrangle. The weighting applied at any of the four corners of the quadrangle was 100 %, so that reversing the movement vector at that point would align it exactly to the average point position calculated earlier. For all other points, the most commonly used vector weighting method employed a square function emanating from each of the four corners towards the middle of the quadrangle. In the middle of the quadrangle, the distance from each corner was approximately equal, resulting in a movement vector weighting of 25 %, so the movement vector at each point contributed equally to the resulting (reversed) vector. The de-distorted region was copied into a new image sequence, and cubic interpolation was used to fill in any skipped pixels left by the algorithm.
Movement measurements
To better analyse the relationship between contractions and intercellular Ca2+ wave activity, routines were developed to quantify the distortion of a region of tissue. Once 3–4 points that were always within the field of view throughout the image sequence were tracked (see above), the coordinates were stored, and the area of the triangle/quadrangle was calculated over time. Spatio-temporal maps (see below) were then constructed from only the area within the triangle/quadrangle, allowing comparison of movement and Ca2+-induced fluorescence in a defined region.
Z-compression
To visualize the morphology of LM cells, the image sequence was first motion stabilized (see above), then an average image was calculated by summing all images in the image sequence and dividing by the number of images. The time interval between separate images was 33.37 ms (or de-interlaced 16.68 ms) and the number of images in the image sequence ranged from 600–3000 (20-100 s). Statistical procedures other than the average pixel intensity could be performed during this procedure such as minimum, maximum, median, mode, or maximum difference (shows the most dynamically active changes in pixel intensity – i.e. only cells undergoing Ca2+ wave activity). The resulting image(s) (see examples in Fig. 1A and B) was/were used to identify the full morphology of LM cells revealed by background/resting fluorescence and active Ca2+-induced fluorescence.
Figure 1. Construction of spatio-temporal maps of intracellular Ca2+ wave activity in longitudinal muscle cells.
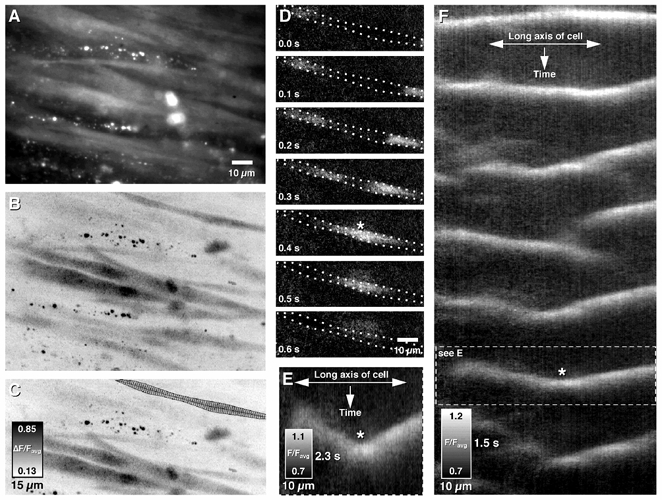
Frames of Ca2+-induced changes in fluorescence intensity were stored as an image sequence. A, the outline of an individual cell was determined by compressing all images in a sequence into a single image, to visualize the average fluorescence or B, the maximum difference of fluorescence and manually encircling it (C, outline). This enabled the morphology of the cell to be ascertained. E, changes in Ca2+-induced fluorescence intensity (see sequence in D) perpendicular to the midline of the cell (see representations within outlines in C) were averaged and stored as single rows in a spatio-temporal map. The spatio-temporal map shows both changes in space (left-right), time (top-bottom) and average intensity (greyscale). In D and E, two separate waves, initiated at either end of the field of view propagate towards each other, and eventually collide (see asterisk). F, the single wave outlined in E is shown using a compressed timescale (dashed box). This method allows visualization of long periods of intracellular Ca2+ wave activity as a single image (F).
Differentiation and background subtraction
To visualize only dynamic changes in Ca2+-induced fluorescence, the image sequence was differentiated with respect to time in the following manner: two images, separated by a known delay (≈200 ms) were extracted from the image sequence and were subtracted from each other. The difference in pixel intensity was added to mid-level grey (128). Any pixels with equal pixel intensity at the same position in both images resulted in a difference of zero and were portrayed as mid-level grey. If a change in intensity occurred between pixels at the same position in both images, this was reflected by a darkening or lightening away from mid-level grey, becoming more pronounced the greater the fluorescence intensity difference between the two pixels. This method only revealed dynamic changes in fluorescence and eliminated resting and background fluorescence, so long as the preparation did not move significantly in the time between the two images.
Background subtraction is similar to differentiation, except a static reference image (Z-compressed average image of entire image sequence) was used instead of a moving reference image.
Fluorescence ratio
The fluorescence ratio (F/F0) could not be accurately achieved by manually choosing a reference image containing only resting fluorescence as, during intracellular Ca2+ wave activity, there was always an active Ca2+ wave somewhere within the field of view. Thus, the fluorescence ratio at the position of the active Ca2+ wave in the reference image would always be inaccurate. Another difficulty in using F/F0 fluorescence ratio was that the offset (8-bit intensity level during resting conditions) changed depending on the quality of loading and gain of the camera. This introduces a large degree of error in the F/F0 ratio, especially during low light conditions; i.e. with the same change in fluorescence of 20 (8-bit scale), the following ratios can be obtained depending on the offset: F0 = 20, F = 40, ratio = 2.0; F0 = 120, F = 140, ratio = 1.67; F0 = 220, F = 240, ratio = 1.09. To standardize the resting fluorescence offset, a background subtraction procedure was performed using the calculated average image of the entire image sequence (Z-compression). This resulted in background/resting levels of fluorescence having an 8-bit intensity value of 128 (mid-grey). By adjusting the average offset to 128, the fluorescence ratio (F/Favg) was clamped from 0.0 (0/128) up to a maximum of 2.0 (256/128), and allowed better comparisons between preparations.
Spatio-temporal maps of intracellular Ca2+ wave activity: averaging across the diameter of LM cells
To reduce line-averaging artifacts in spatio-temporal maps produced when LM cells were not perfectly aligned in the horizontal or vertical axis, the following method was used. A single smooth muscle cell in the LM layer was manually outlined in a Z-compressed image, thereby defining the edge of the cell (Fig. 1A-C). This was possible as there were small non-fluorescent spaces between muscle cells. Any pixels outside the outline were not used in any further calculations during the construction of a spatio-temporal map from that particular cell. The spatial midline along the length of the cell was calculated by locating the coordinates of the midpoints located between the upper and lower boundaries of the cell, demarcated by the manual outline. The spatial midline was smoothed (3 pixel moving average; 3 iterations), resulting in a line that accurately represented the average spatial distortion of the cell in the vertical and horizontal planes. To calculate fluorescence intensity across the diameter of the cell, the tangent (5 point average) and the slope perpendicular to the tangent were calculated at each point along the spatial midpoint line (Fig. 1C). The fluorescence intensities of pixels that fell along the calculated slope (perpendicular to the tangent) were summed until the edges of the outline were reached. The final sum was divided by the number of pixels in the line to give an average Ca2+-induced fluorescence intensity perpendicular to the long axis of the cell at a single point. The average pixel intensities were calculated for each point along the spatial midline of the cell and were stored as a single row in a spatio-temporal map (see Fig. 1D, E and F). This method provided an accurate representation of intracellular Ca2+ waves as the wave front was relatively uniform across the diameter of LM cells (Fig. 1D).
Spatio-temporal maps of intercellular Ca2+ wave activity
In preparations that displayed intercellular Ca2+ wave activity, spatio-temporal maps were created from an entire area by averaging Ca2+-induced fluorescence intensity either along lines parallel to the axis of the LM layer (to view circumferential spread), or perpendicular to the axis of the LM layer (to view longitudinal spread).
Median filtering
In LM cells that displayed both intracellular and intercellular Ca2+ wave activity, it was difficult to determine if both activities were coexistent, or whether one activity annihilated the other. The rapid propagation velocity of intercellular Ca2+ waves in LM cells appeared as mostly horizontal bands of increased fluorescence, whilst slower propagating intracellular Ca2+ waves appeared as more diagonally orientated bands in spatio-temporal maps (see Fig. 5A). Intercellular Ca2+ waves could be selectively filtered out by subtracting every pixel in a row (moment of time) from the overall median of that row. As the fluorescence intensity of fast propagating events was relatively uniform across the entire cell at each moment in time, subtracting the median value filtered out this activity. However, the row median did not approximate the entire fluorescence changes of slower propagating activity at a moment in time, and this activity was preserved (see Fig. 5B).
Figure 5. Occurrence of inter/intracellular Ca2+ waves in a longitudinal muscle cell.
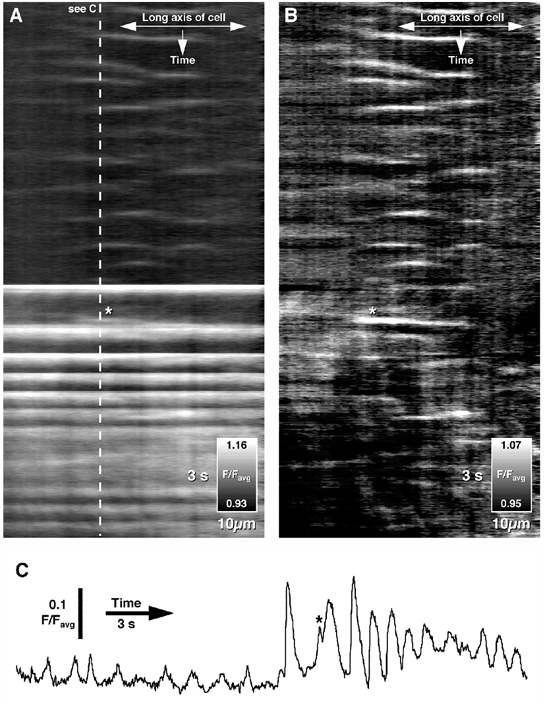
A, between bursts of intercellular Ca2+ wave activity (lower half), intracellular Ca2+ waves were occasionally observed (top half). The onset of intercellular Ca2+ wave activity usually obscured any ongoing intracellular Ca2+ wave activity. B, however, after filtering intercellular Ca2+ wave activity across the entire cell using a median filter (see Methods), intracellular Ca2+ waves were still detected. C, the relative amplitudes of the two types of Ca2+ wave activity in the same cell are shown in the time course. The asterisk (A, B and C) shows an intracellular Ca2+ wave occurring immediately before an intercellular Ca2+ wave.
Correlation of activity in neighbouring cells
A simple, but effective way to determine the correlation of Ca2+ wave activity in neighbouring cells was to create spatio-temporal maps from three adjacent cells and combine them as an RGB image (red = upper cell, green = middle cell, blue = lower cell). Any combination of overlap was visualized as a combination colour (yellow, cyan, magenta) and calculated as a percentage of the overall activity (see Fig. 4).
Figure 4. Visual example of the overlap of Ca2+ waves in three adjacent longitudinal muscle cells (see A and D) during intracellular and intercellular Ca2+ wave activity.
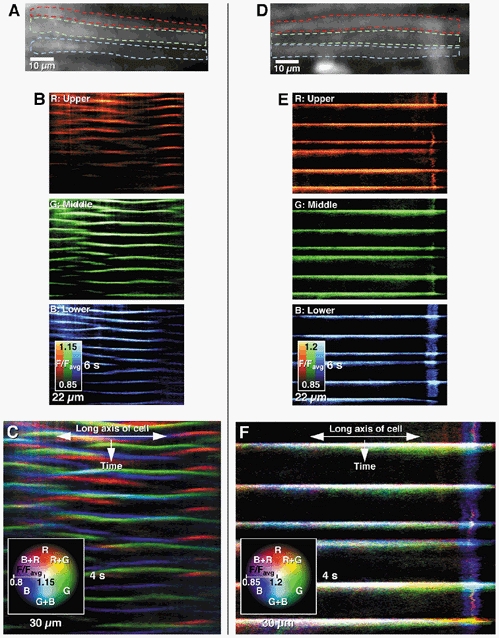
Spatio-temporal maps of intracellular Ca2+ wave activity from 3 cells (B, upper, middle, lower) were combined as separate red, green, and blue channels in the combined colour spatio-temporal map (C). The composite picture shows minimal overlap of activity, demonstrated by the lack of white or other combination colours (yellow, cyan, magenta), indicating that activity between adjacent muscle cells was uncoordinated. During intercellular Ca2+ wave activity, the combination of spatio-temporal maps from 3 cells (E, upper, middle, lower) shows a complete registration of activity (F), indicating that activity in all three cells was synchronized.
Single intracellular Ca2+ wave analysis
To identify a single wave Ca2+ wave for the purpose of measuring initiation/termination points, velocity and amplitude, the following method was used (see Fig. 2). The peak Ca2+-induced fluorescence was located by finding the brightest pixel within a user-defined region. To determine resting Ca2+-induced fluorescence before a wave, the average and variance of pixel intensity values were calculated in a time window starting 300 ms preceding the time at which the brightest pixel was located (-300 ms; note this start time was chosen as it was approximately twice the time needed for a wave to reach peak intensity: 154.6 ± 9.7 ms; n = 7), and finished 600 ms preceding the time at which the brightest point was located (i.e. −300 ms to −600 ms). As the average frequency of intracellular Ca2+ waves was 1.3 ± 0.05 s−1, there was little chance of including values from the previous Ca2+ wave in the resting fluorescence calculations.
Figure 2. Analysis of intracellular Ca2+ waves in single longitudinal muscle cells.
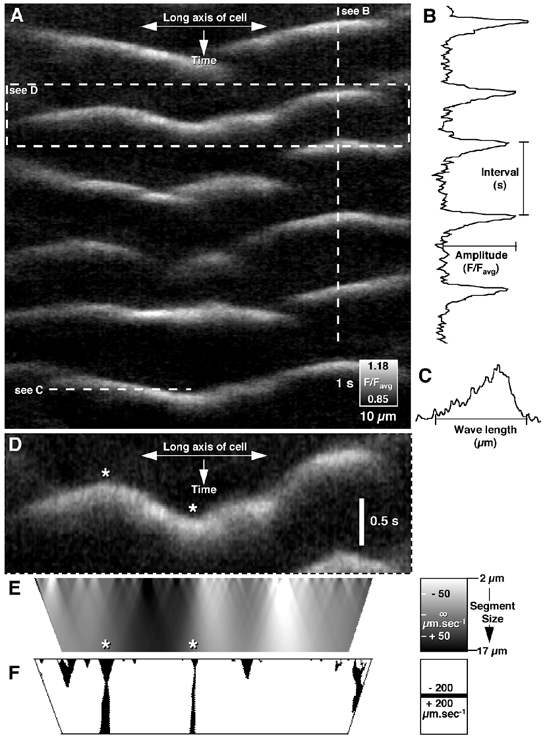
A, spatio-temporal maps of Ca2+-induced changes in fluorescence were used to extract temporal and spatial profiles of fluorescence intensity. B, temporal parameters such as time course and interval/frequency and intensity parameters such as amplitude were calculated by plotting fluorescence intensity against time (example taken from vertical dashed line in A). C, spatial parameters such as wavelength were calculated by plotting fluorescence intensity against the distance along the cell (example taken from horizontal dashed line in A). E, after the wave front was identified (D: see Methods) instantaneous velocities were calculated using different segment lengths (2-17 μm) resulting in a map of instantaneous velocities along the cell. The point at which there was a change in the sign of instantaneous velocities indicated either an initiation point (see left asterisk in D and corresponding asterisk in E) or a collision point (see right asterisk in D and corresponding asterisk in E). F, these inflexion points were located by thresholding the map of instantaneous velocities (see extended black lines).
The amplitude and coordinates at 50 % of peak Ca2+-induced fluorescence intensity were calculated. If the peak Ca2+-induced fluorescence intensity was greater than the resting average + (1.5-2.0) standard deviations, then the time and spatial position of the point at which 50 % peak Ca2+-induced fluorescence intensity was reached was stored and the procedure repeated for every adjacent pixel in the x-axis (along the length of the cell). Once the Ca2+-induced fluorescence intensity fell below the standard deviation cutoff, the procedure was repeated in the opposite x-direction from the start point until both termination points, or edges of the map were reached. The coordinates of the 50 % peak Ca2+-induced fluorescence intensity along the length of the cell were smoothed (3 point average, 3 iterations) to create the wave front. The average time course and amplitude (Fig. 2B and C) of each wave were calculated directly from the spatio-temporal map using the wave front coordinates as a guide. The times at which the beginning and end of the Ca2+wave fell below the average resting fluorescence were considered the start and finish position of the wave respectively from which peak intensity, time to peak and total duration were calculated.
To determine propagation velocity and the position of initiation/collision points the following method was used. Instantaneous velocities were calculated by differentiating the wave front (Fig. 2D) using a linear series of segment sizes from 2 μm-17 μm (increment size = 0.21 μm) and were stored in a separate file (see visualization in Fig. 2E). Inflexion points were found by locating the centre of regions in which instantaneous velocities changed from negative (wave propagating right to left) to positive (wave propagating left to right: see thresholded image in Fig. 2F) or vice versa. During the transition from positive to negative (or vice versa) instantaneous velocities approached infinity as the slope became horizontal (distance/0 = infinity). Inflexion points with positive velocities on the left and negative velocities on the right signified a collision point (see rightmost asterisk in Fig. 2D and E). Inflexion points with negative velocities on the left and positive velocities on the right signified an initiation point (see leftmost asterisk in Fig. 2D and E). The average propagation velocity of a wave could be calculated by averaging instantaneous velocities along the entire distance the wave travelled. Any change in velocity during the propagation of a single wave was determined by calculating the standard deviation of instantaneous velocities (continuity of propagation) along the length of the cell (see Fig. 2E). As larger segment sizes tended to ablate more rapid changes in velocity (see bottom of Fig. 2E), and small segment sizes were more susceptible to noise (see top of Fig. 2E), this parameter was averaged between segment sizes of 2–6 μm. This measure shows the overall acceleration and retardation of the wave as it traversed the cell.
3D visualization of Ca2+ wave activity
To better portray the spatial relationship of Ca2+ waves during intra/intercellular Ca2+ wave activity, we developed a method to portray Ca2+ waves in 3D. A threshold was applied to select, as best as possible, the range of fluorescence intensities in regions undergoing Ca2+ wave activity. Noise reduction techniques were then applied to remove isolated pixels not associated with a Ca2+ wave (erosion 3×; dilation 3×). An edge-finding routine was used to create surface triangles around Ca2+ waves throughout the image sequence. The x-y-z coordinates of the triangles were stored in an object file, and could be manipulated and visualized in a purpose built viewer (OpenGL GLUT-based). Examples are shown in Fig. 3 and Fig. 6.
Figure 3. Intracellular Ca2+ waves in multiple cells within the longitudinal muscle syncitium.
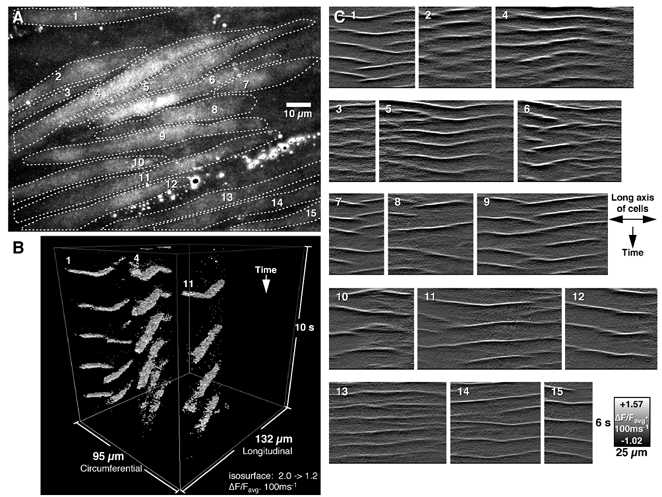
A. a field of view was motion-stabilized and averaged (Z-compression) to identify the morphology of 15 longitudinal muscle cells. B, using a 3D viewer, the spatial and temporal pattern of 3 waves could be appreciated. C, differentiated spatio-temporal maps (200 ms time step) of the 15 cells show considerable variation in frequency, propagation distance, direction and intensity of fluorescence (C1-15), indicating that intracellular Ca2+ waves occur independently in individual muscle cells.
Figure 6. Patterns of intercellular Ca2+ wave activity.
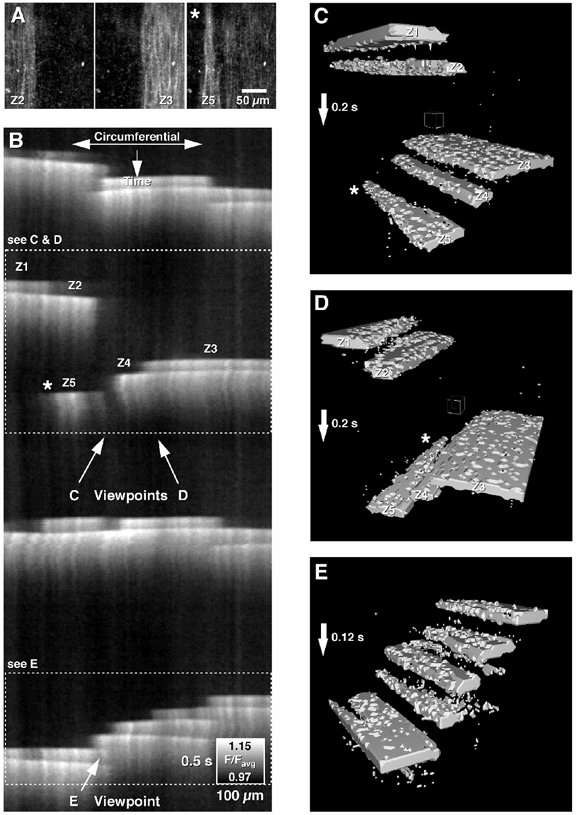
Intercellular Ca2+ waves often propagated in a ‘step-like’ fashion in the circumferential axis, where considerable delays occurred before the next region of longitudinal muscle was activated. This activity has been represented A, as a sequence of images, B, a spatio-temporal map (B) or C, D and E, a spatio-temporal cube (3D visualization). The direction of propagation was highly varied from one wave to the next (B and C compared to E), as was the size of regions activated with each wave (A-E, see zones Z1-Z5). The fast conduction velocity along the length of LM cells and slower conduction velocity perpendicular to the long axis of LM cells resulted in a ‘spear-shaped’ appearance of intercellular Ca2+ waves (A, B, C and D, asterisk).
Statistics
Results are presented as means ± standard errors. n refers to the number of animals used. Statistical comparisons were made with ANOVA and Scheffe post-hoc tests. A P < 0.05 was considered significant.
Results
Characteristics of cells in intact LM syncitia
The size and shape of LM cells in the mouse proximal colon were measured in cells that had high resting fluorescence intensity. These cells were on average 248 ± 17 μm long with a maximum diameter of 8.7 ± 1.5 μm (14 cells, n = 2) at the level of the nucleus. A number of other cell types were observed in the approximate plane of the LM layer including macrophages, interstitial cells of Cajal (ICCs), serosal cells, and neurons in myenteric ganglia. It was rare to observe resting fluorescence intensity in circular muscle cells when the preparation was loaded from the serosal side.
Types of Ca2+ waves observed
In quiescent preparations, slowly propagating Ca2+ waves were observed within individual LM cells (intracellular Ca2+ waves) that did not appear to spread between cells. In preparations undergoing regular contractile activity, more intense (5 times greater) Ca2+ waves that travelled extremely quickly along the long axis of LM cells before spreading more slowly to adjacent LM cells in the circumferential direction were observed (intercellular Ca2+ waves). These waves were likely to be due to propagating muscle action potentials, as they were blocked with nicardipine (2 μM; see Spencer et al. 2002).
Intracellular Ca2+ waves
Intracellular Ca2+ waves were found throughout cells of the LM layer in the proximal colon. The intensity and prevalence of intracellular Ca2+ waves varied between animals, with many preparations showing activity in all cells, while in others, only small bundles of LM cells were active. A similar type of intracellular Ca2+ wave was observed in both myenteric and intramuscular interstitial cells of Cajal, however it was possible to discriminate these cells from LM cells based on their plane of focus, morphology and pattern of Ca2+ wave propagation. Only Ca2+ waves in LM cells were analysed in this study. There was no evidence of intracellular Ca2+ wave activity in the circular muscle (CM) layer when the preparation was pinned and loaded CM side topmost (n = 4), although intercellular Ca2+ waves were often present.
Intracellular Ca2+ waves characteristics
The most notable feature of intracellular Ca2+ waves was that multiple waves could occur simultaneously within a single cell. Independent intracellular Ca2+ waves were initiated approximately every 15–30 μm along the length of the cell and propagated in any direction along the cell from the point of origin (Figs 1, 2 and 3). Collisions between two independent Ca2+ waves annihilated both waves and were a major factor in limiting the average propagation distance to 36.7 ± 2.5 μm (39 cells, n = 5; range 10–100 μm; see Fig. 1D asterisk).
As the temporal resolution of video recordings is limited, we were unable to precisely record the sequence of events involved in the initiation of an intracellular Ca2+ wave. In most experiments the point of origin was distributed across the whole diameter of the cell, although rarely, waves were seen to spread out radially from one side of the cell before propagating along the long axis of the cell.
The propagation velocity of intracellular Ca2+ waves along LM cells was remarkably constant at 65.8 ± 2.8 μm s−1 at 35 °C (70 cells, n = 13; Figs 1, 2 and 3). The velocity appeared to be temperature-dependent, as in some experiments when the bath temperature was held at 37 °C (not included in analysis), the velocity increased to a maximum of approximately 100 μm s−1. The total duration of intracellular Ca2+ waves in LM cells was 448.3 ± 42.1 ms (7 cells, n = 3). Peak intensity was reached in 154.6 ± 9.7 ms, with half maximum intensity reached in 83.2 ± 3.7 ms (7 cells, n = 3). The wavelength of intracellular Ca2+ waves was on average 16.1 ± 0.9 μm (14 cells, n = 5). The frequency of intracellular Ca2+ waves was 45 ± 1.0 c.p.m. (0.75 ± 0.03 Hz) corresponding to an average interval of 1.3 ± 0.05 s (67 cells, n = 13).
Most intracellular Ca2+ waves propagated in a smooth, linear fashion, demonstrated by small changes in acceleration. The average continuity of propagation along the length of an intracellular Ca2+ wave front was 12.36 ± 1.21 μm s−1 (11 cells, n = 4). The largest discontinuities in propagation velocity appeared to correspond to the initiation of new waves that collided with any ongoing propagating activity.
Coordination of intracellular Ca2+ waves between adjacent cells
It is difficult to portray the spatio-temporal complexity of a region of LM undergoing intracellular Ca2+ wave activity, as the visual impression is more akin to swarming insects. An attempt to display this behaviour is shown in Fig. 3 where spatio-temporal maps from 15 LM cells are presented. Each cell had multiple waves that were initiated at different sites, at different frequencies and propagated in either direction before terminating or colliding with other waves within the cell.
To further quantify whether the occurrence of intracellular Ca2+ waves in one cell was correlated to waves in neighbouring cells at the same point along their long axis, spatio-temporal maps from three adjacent cells were combined (see Methods, Fig. 4A and B). The percentage of coordinated intracellular Ca2+ wave activity when only adjacent cells were compared (upper-middle, middle- lower) was consistent at 2.58 ± 0.49 % and 2.65 ± 0.73 % respectively. To establish whether this amount of overlap was due to random chance, non-adjacent cells were compared (upper-lower). The overlap from this comparison (3.32 ± 1.04 %) was not statistically different to the adjacent cell comparisons (P > 0.05, 6 fields of view, n = 6), indicating that there was no spread of activity or synchronization of intracellular Ca2+ waves from one cell to another. The low level of coordination between cells was likely to be due to slight differences in frequency of the intracellular Ca2+ waves that occasionally occurred in phase between cells (Fig. 4C).
Are intracellular Ca2+ waves dependent on nerve activity?
The addition of TTX (1 μM) had no effect on the propagation velocity or frequency of intracellular Ca2+ waves (velocity: control 62.65 ± 2.82 μm s−1; TTX 64.92 ± 3.46 μm s−1 (n.s.); interval: control 1.36 ± 0.07 s; TTX 1.57 ± 0.08 s (n.s.): n.s. indicates P > 0.05; 11 cells, n = 4), indicating that intracellular Ca2+ waves are initiated and propagate without functional neural input. There was no change in resting fluorescence intensity after TTX (Resting F/Favg as % of control: TTX 99.3 ± 8.2, 3 fields of view, n = 3), suggesting that resting levels of Ca2+-induced fluorescence are not regulated by neural activity.
Are intracellular Ca2+ waves dependent on external Ca2+ entry?
To determine whether intracellular Ca2+ waves are dependent on external Ca2+ entry, zero external Ca2+/high Mg2+ solutions, or the L-type Ca2+ channel antagonist nicardipine (2 μM), or the competitive ion for Ca2+, Ni2+ (1 mm) were added.
Zero external Ca2+/high Mg2+ solutions blocked intercellular waves after ≈20 min (n = 3). Acute application of nicardipine or Ni2+ reduced resting fluorescence intensity (resting F/Favg as % of control: nicardipine 74.1 ± 4.0 *†; Ni2+ 76.3 ± 6.5 *†: * P < 0.05 compared to control, † P < 0.05 compared to TTX; 3 fields of view, n = 3), and suppressed intracellular Ca2+ wave activity so that it was undetectable. However, after 15–20 min in the continued presence of nicardipine, intracellular Ca2+ waves were again detectable, although their apparent fluorescence intensity appeared to be decreased and resting fluorescence intensity decreased more rapidly to sustained illumination. The frequency of intracellular Ca2+ waves was decreased by approximately half (interval: control 1.40 ± 0.03 s, 54 cells, n = 11, compared to TTX/nicardipine 2.45 ± 0.07 s, 58 cells, n = 11; P < 0.05). However the propagation velocity was only slightly reduced compared to the control, suggesting that processes independent of external Ca2+ entry through L-type channels were involved in propagation (velocity: control 67.68 ± 2.17 μm s−1, 36 cells, n = 11, compared to TTX/nicardipine 58.85 ± 1.47 μm s−1, 43 cells, n = 11; P > 0.05). Intracellular Ca2+ waves were completely blocked after addition of Ni2+ and did not return after 20 min.
Are intracellular Ca2+ stores involved during intracellular Ca2+ wave activity
To eliminate any influence of neural activity or entry of Ca2+ through L-type Ca2+ channels, both TTX (1 μM) and nicardipine (2 μM) were added before antagonists to intracellular Ca2+ stores were applied. To establish which intracellular Ca2+ stores were involved, antagonists to IP3-gated (Xe-C, 2 μM; Miyamoto et al. 2000; or 2-APB, 25 μM, Ma et al. 2000) and ryanodine-sensitive (ryanodine, 10 μM) intracellular Ca2+ stores were added. The addition of ryanodine (n = 8) completely abolished all intracellular Ca2+ waves. The further addition of ACh (1 μM; n = 4), or ATP (300 μM; n = 3), to promote release from IP3-gated stores (Bolton & Gordienko, 1998; Bayguinov et al. 2000, 2001) did not restore intracellular Ca2+ activity, however a brief sustained contraction was observed with ACh (velocity: control 68.0 ± 2.8 μm s−1; TTX/nicardipine 57.5 ± 1.9 μm s−1 *; ryanodine 0 ± 0 μm s−1; acetylcholine 0 ± 0 μm s−1; interval: control 1.53 ± 0.04 s: TTX/ nicardipine 3.00 ± 0.10 s *; ryanodine 0 ± 0 s; acetylcholine 0 ± 0 s. * P < 0.05 compared to control; n = 5).
Similarly, the addition of Xe-C (2 μM) abolished all intracellular Ca2+ waves. However, after release from IP3-gated stores had been blocked with Xe-C, the further addition of caffeine (5 mm) to promote release from ryanodine-sensitive stores re-initiated intracellular Ca2+ waves. The frequency was substantially decreased after the application of caffeine, however the velocity was similar to controls (velocity: control 66.7 ± 2.7 μm s−1; TTX/ nicardipine 61.5 ± 2.1 μm s−1; Xe-C 0 ± 0 μm s−1; caffeine 59.7 ± 1.5 μm s−1 (n.s.), interval: control 1.11 ± 0.06 s; TTX/nicardipine 1.80 ± 0.06 s *; Xe-C 0± 0 s; caffeine 2.58 ± 0.11 s *†, * P < 0.05 compared to control, † P < 0.05 compared to TTX/nicardipine, n = 4). Another IP3-gated intracellular Ca2+ store antagonist, 2-APB (25 μM) also blocked intracellular Ca2+ waves (velocity: control 53.7 ± 1.8 μm s−1 compared to 0.0 μm s−1; interval: 1.48 ± 0.21 s compared to 0.0 s, n = 3). However, the further addition of caffeine (5 mm) or washout did not restore intracellular Ca2+ waves. The addition of 2-APB was associated with a large increase in resting Ca2+-induced fluorescence and a substantial contraction of the tissue (see Fig. 8). After 60 s resting Ca2+-induced fluorescence was dramatically reduced.
Figure 8. Time courses of intercellular Ca2+ wave activity and movement after the addition of intracellular Ca2+ store blockers.
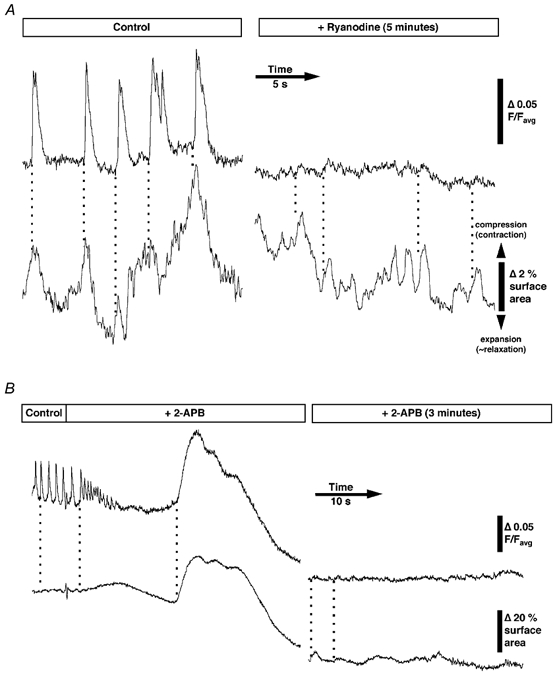
A, ongoing intercellular Ca2+ waves were dramatically reduced after the addition of 10 μM ryanodine (black line), however, tissue distortion was largely unaffected (grey line). Small peaks in Ca2+-induced fluorescence were still associated with some tissue distortions. B, the addition of 2-APB (25 μM) quickly decreased Ca2+ wave amplitude and increased frequency of firing before blocking phasic activity (black line) and caused small tissue distortions (grey line). After 15–20 s a large sustained increase in Ca2+-induced fluorescence was observed associated with a large contraction. With time, Ca2+-induced fluorescence dropped to low levels, although small tissue distortions were still detected.
These results suggest that release of Ca2+ from both ryanodine-sensitive and IP3-gated intracellular stores contributes to the generation and propagation of intracellular Ca2+ waves.
Are intracellular Ca2+ waves involved in modulating tension?
Phasic contractions were prevalent in four of five preparations (frequency: 5.4 ± 0.4 cycles min−1; amplitude: 1.9 ± 0.6 mN, n = 4). The addition of ryanodine (10 μM) had no effect on the amplitude of phasic contractions (P > 0.05; n = 4) or baseline tension after phasic contractions were suppressed with TTX (1 μM) and nicardipine (2 μM) (P > 0.05; n = 5). These results suggest that intracellular Ca2+ waves may not directly interact with the contractile apparatus.
Intercellular and intracellular Ca2+ waves
Normally, large Ca2+ transients associated with intercellular Ca2+ wave activity obscured and/or suppressed any intracellular Ca2+ waves. However, in some preparations both types of Ca2+ wave could be observed in individual LM cells (Fig. 5A: spatio-temporal map taken from a single cell). Using horizontal median filtering to remove the intercellular Ca2+ wave activity, intracellular Ca2+ wave activity was apparent throughout a bout of intercellular Ca2+ wave activity, suggesting that the two processes may be independent (Fig. 5B). The relative difference in the time course and intensity of the two types of activity is shown in Fig. 5C. Peak Ca2+-induced fluorescence intensities of intercellular waves were up to five times more intense than intracellular waves (average: 0.14 ± 0.01 F/Favg compared to 0.04 ± 0.004 F/Favg, n = 3).
Characteristics of intercellular Ca2+ waves
In the proximal colon of the mouse, intercellular Ca2+ waves are likely to be associated with muscle action potentials which propagate rapidly from cell to cell in both the longitudinal and circumferential axes of the LM syncitium (Spencer et al. 2002). The propagation velocity of intercellular Ca2+ waves parallel to the longitudinal axis was considerably faster (≈10 times) than in the circumferential axis (see below).
Large regions of the LM syncitium were activated within one frame (33 ms; see Fig. 6A). The circumferential width of these regions was on average 178 ± 11 μm, approximately 20 LM cells wide (25 fields of view, n = 4;). However, it was difficult to determine the longitudinal length of these regions, as they extended far beyond the field of view. Using low power objectives, an estimate of the average longitudinal length was 1–4 mm. These regions were apparently activated simultaneously, forming a zone of activity (Fig. 6).
At low magnification, it was possible to observe the circumferential spread of the intercellular Ca2+ wave through the LM syncitium. Wave propagation often appeared to be ‘step-like', with considerable delays between activation of adjacent regions (Fig. 6). The average velocity of intercellular waves in the circumferential direction was 4.0 ± 0.4 mm s−1 (10 fields of view, n = 4) at 35 °C.
The velocity of the Ca2+ waves in the longitudinal direction was, on average, 44.1 ± 6.2 mm s−1 (7 fields of view; n = 3). Many waves appeared to propagate across the longitudinal axis of the entire field of view (1-4 mm) in one de-interlaced frame (16.67 ms), and may have exceeded a velocity of 120 mm s−1. The low temporal resolution of the video recording, even with the de-interlacing procedures, prevented more accurate measurements of velocity in the longitudinal direction from being calculated.
The combination of a fast conduction velocity in the longitudinal direction and a slow conduction velocity in the circumferential direction produced a characteristic ‘spear-head'-like appearance as the wave propagated through the tissue (see Fig. 6C asterisk). The size, position and sequence of activation of zones varied considerably from one intercellular Ca2+ wave to the next (Fig. 6). It is unlikely that the edges of the zones were defined by the refractory period of previous intercellular Ca2+ waves, as the delay in propagation between adjacent zones (183 ± 7 ms; n = 3) was considerably longer than the refractive period of successive intercellular Ca2+ waves (≈90 ms, see below). In some preparations, intercellular Ca2+ waves appeared to propagate smoothly.
Ca2+ transients during intercellular Ca2+ wave activity reached peak Ca2+-induced fluorescence intensity in 90.8 ± 3.9 ms, with a time to half maximum of 45.8 ± 2.9 ms (13 fields of view, n = 4). The change in intensity was approximately twice (1.7 times, 1.8 times, respectively) as fast as intracellular Ca2+ waves. However, the total duration of intercellular Ca2+ waves was 596 ± 25 ms (13 fields of view, n = 4), considerably longer (1.3 times) than intracellular Ca2+ waves.
Coordination of intercellular Ca2+ waves
Changes in Ca2+-induced fluorescence in adjacent LM cells were determined by combining spatio-temporal maps of activity. In all preparations analysed, there was complete overlap of activity between adjacent and non-adjacent cells, suggesting almost simultaneous (< 33 ms) activation of muscle cells within a zone (Fig. 4D, E and F).
Patterns of intercellular Ca2+ waves
The main pattern of intercellular Ca2+ waves in the mouse proximal colon/caecum consisted of a burst of intercellular Ca2+ waves (18.1 ± 2.6 waves), lasting, on average, 12.5 ± 1.6 s, followed by a quiescent period lasting, on average, 16.1 ± 1.7 s (n = 6; see Fig. 7A and C). The average frequency of firing during a burst of activity was 1.37 ± 0.11 waves s−1, however, the frequency was consistently higher in the middle of a burst compared to the beginning and end. The apparent circumferential velocity of intercellular Ca2+ waves during a burst seemed to be related to the frequency of firing, with slower velocities being noted when there were longer intervals between waves.
Figure 7. Bursting pattern of intercellular Ca2+ waves in the murine proximal colon.
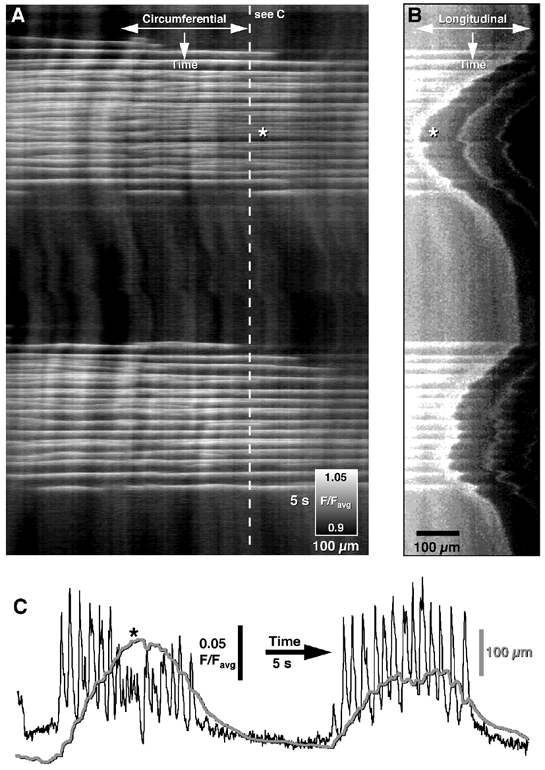
A, clusters of Ca2+ waves occurred at regular intervals and spread circumferentially across the preparation. Higher frequencies of intercellular Ca2+ waves were normally present in the middle of a burst (see asterisk). B, distortion of the edge (end of grey region, A) of the tissue produced by bursting behaviour is shown in a spatio-temporal map averaged in parallel to the longitudinal muscle layer. C, the time course of changes in Ca2+-induced fluorescence intensity (black line) and movement (grey line) shows the relationship between the Ca2+ activity (A, dashed line) and the ensuing movement. Most intercellular Ca2+ waves resulted in phasic contractions (i.e. tissue contraction began to slow or recoil before the arrival of the next wave), although during high frequency bursts of intercellular Ca2+ waves, fused (tetanic) contractions that did not recoil between individual Ca2+ waves were observed (B and C, see asterisk).
Bursts of intercellular Ca2+ waves were often associated with substantial contractions of the preparation, shown by longitudinal shortening (leftward shift in the horizontal axis of Fig. 7B). As there may have been regions outside the field of view that may have contributed to the distortion of the tissue within the field of view, we also performed calculation of distortion within an always-observable region of tissue (Fig. 8). The delay between the onset of a Ca2+ wave and the start of contraction varied depending which method was used. Correlating edge-distortion and intercellular Ca2+ waves (Fig. 7) revealed a ≈60-90 ms delay with the peak of contraction occurring 635 ± 47 ms (n = 3) after the peak of the intercellular Ca2+ wave was reached (Fig. 7 and Fig. 8). Correlating distortion within an always-observable region to the intercellular Ca2+ waves within that region showed simultaneous changes in Ca2+ fluorescence intensity and distortion. The difference between these two methods was probably related to the effect of tissue distortions outside the field of view. Phasic changes in longitudinal tension were also recorded in tubular preparations (data not shown) using traditional organ bath techniques and had a similar frequency and duration to the bursting behavior. It is likely that this ongoing bursting may be involved in some propulsive/mixing movements of the proximal colon.
Depending on the cycle of the bursting behaviour, regular, constant, low frequency occurrence of intercellular Ca2+ waves was also observed. The frequency of waves was slightly different between preparations (one wave every 1.5-2.5 s), however the regularity of waves was consistent (s.d. 0.6 s; n = 4). The contractions produced by this activity were small and entirely phasic, as the frequency of firing was insufficient to produce a tetanic contraction. This pattern of intercellular Ca2+ waves may underlie mixing movements in the proximal colon/caecum.
Dependence of intercellular Ca2+ waves on neural activity and Ca2+ entry through L-type Ca2+ channels
The addition of TTX (1 μM) blocked all intercellular Ca2+ wave activity (n = 3). This indicates that neural release of neurotransmitter (most likely acetylcholine: Stevens et al. 1999, 2000) is important in the generation of these waves. It is unknown if neural activity is involved in the organization of active zones. Similarly addition of nicardipine (2 μM; n = 4) blocked all intercellular Ca2+ wave activity and any associated movements of the tissue. This indicates that external Ca2+ entry is necessary for the generation of intercellular Ca2+ wave activity.
Dependence of intercellular Ca2+ waves on intracellular Ca2+ stores
Intercellular Ca2+ waves were significantly reduced after the addition of ryanodine (10 μM) or 2-APB (25 μM; see Fig. 8; n = 4). Interestingly, small distortions of the tissue produced by muscle contraction were not appreciably affected by either drug (Fig. 8). This suggests that ryanodine-sensitive and IP3-gated intracellular Ca2+ stores may be involved in the amplification of cytoplasmic Ca2+ concentration, however, contractions can still occur, presumably via entry of Ca2+ through L-type Ca2+ channels.
Dependence of Ca2+ waves on gap junctions
Heptanol has been used previously to disrupt gap junctions, thereby electrically isolating colonic smooth muscle cells (Huizinga et al. 1988; 0.2-1 mm) and has been shown to reduce the probability of intracellular Ca2+ waves spreading between cells in rat ventricular trabeculae (Lamont et al. 1998; 3 mm). The addition of the gap junction blocker heptanol (0.5 mm; n = 4) did not alter the pattern or coordination of intracellular Ca2+ waves in any way, corroborating the evidence that this type of Ca2+ wave activity does not spread to adjacent cells through gap junctions (Fig. 9A and B). However, heptanol (0.5 mm) blocked the initiation and propagation of intercellular Ca2+ waves (n = 4), suggesting that the spread of intercellular Ca2+ wave activity between LM cells depends on gap junctions (Fig. 9C and D).
Figure 9. Effect of heptanol (0.5 mm) on intracellular and intercellular Ca2+ wave activity.
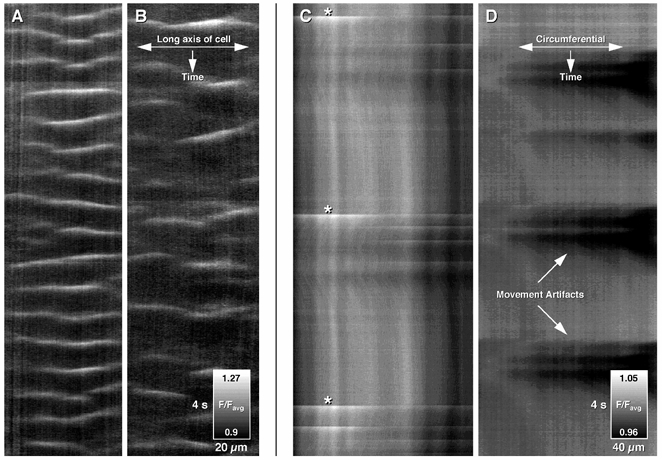
Intracellular Ca2+ wave activity (A) was not blocked by heptanol, although the apparent frequency of waves was reduced (B). In contrast, intercellular Ca2+ wave activity (C: see white streaks marked by asterisks) was abolished by the addition of heptanol (D), although the tissue still moved phasically (see black artifacts caused by movement). This indicates that propagation and/or generation of intercellular Ca2+ waves were dependent on gap junctions.
Discussion
In this study we report patterns of intracellular and intercellular Ca2+ waves in the LM layer of isolated segments of murine caecum and proximal colon. These waves were present at near physiological temperatures suggesting that both types of Ca2+ wave have important functional roles. Intracellular Ca2+ waves were confined within the boundary of each LM cell and propagated slowly for varying distances. This activity was associated with quiescence of the preparation. In contrast, intercellular Ca2+ waves spread rapidly along and across many smooth muscle cells and were associated with contraction. Intracellular Ca2+ waves were independent of nervous activity, whereas, intercellular Ca2+ waves were blocked by TTX. These two types of Ca2+ wave appear to be independent of each other since they were observed to coexist and appear to be driven by different cellular processes.
Intracellular Ca2+ waves
Intracellular Ca2+ waves, similar to those we report here in intact LM, have been observed in freshly dispersed or cultured cells in a variety of tissues including astrocytes (Newman, 2001); cardiac myocytes (Berlin et al. 1989; Takamatsu & Wier, 1990; Cheng et al. 1996); airway and liver epithelial cells (Sneyd et al. 1995a; Frame & de Feijter 1997); intestinal smooth muscle (Bolton & Gordienko, 1998; Gordienko et al. 1998); vascular smooth muscle myocytes (Wier et al. 1991; Iino et al. 1994; Boittin et al. 1998; Lukyanenko et al. 1999; Newman, 2001) and uterine smooth muscle cells (Young & Hession, 1997; Young, 2000). Recently, intracellular Ca2+ waves have been reported in intact segments of vascular smooth muscle (Jaggar & Nelson, 2000b), however, like previous reports of intracellular Ca2+ waves in isolated cells, these experiments were performed at much lower than physiological temperatures. Intracellular Ca2+ wave velocities are conserved across many different cell lines (5-25 μm s−1 at 20 °C; see Jaffe, 1991) and are of a similar order of magnitude to the velocities we found in LM cells (65 μm s−1 at 35 °C and ≈100 at μm s−1 at 37 °C). Our slightly higher conduction velocities may reflect temperature differences, which may affect the diffusion constant for Ca2+ and hence the spread of a wave (see Keizer & Smith, 1998). This study suggests that intracellular Ca2+ waves in the LM may have an important physiological role, since they occurred at physiological temperatures in most smooth muscle cells, were specific to the LM, and were only observed in areas of the gut associated with storage and intestinal accommodation.
Initiation and propagation of intracellular Ca2+ waves
Intracellular Ca2+ waves in this study could be induced with caffeine after blockade of IP3-gated intracellular Ca2+ stores with xestospongin-C (Miyamoto et al. 2000) but not after blockade of ryanodine-sensitive intracellular Ca2+ stores with ryanodine. This suggests that although an IP3-dependent mechanism may be necessary for triggering Ca2+ waves, an independent ryanodine-sensitive mechanism is likely to be responsible for propagation of this activity. Spontaneous and synchronous activation of IP3-gated Ca2+ release sites ('puffs') are likely to trigger Ca2+ ‘sparks’ (ryanodine receptors; see Gordienko et al. 1999). The resultant Ca2+ release (CICR) from adjacent ryanodine-sensitive stores may lead to an explosive release of Ca2+ that creates the Ca2+ wave, which propagates by diffusion and triggers further CICR from mainly ryanodine-sensitive stores. This model of cooperativity between the two intracellular Ca2+ stores is similar to that proposed for intracellular Ca2+ waves in rat portal vein myocytes (Boittin et al. 1998). Boittin et al. (1998) showed immunohistochemically that IP3 receptors are sparser and located close to the more dense ryanodine receptors, which tend to cluster near caveolae. The inability of caffeine to restore Ca2+ waves after 2-APB treatment may be related to non-specific effects. In some cell types, 2-APB has been shown to affect Ca2+ release via non-IP3 receptor mechanisms (Gregory et al. 2001), which may have prevented caffeine-stimulated release.
Although Ca2+ waves in smooth muscle and cardiac myocytes have been reported in a number of studies (Wier et al. 1991; Nelson et al. 1995; Bolton & Gordienko, 1998; Gordienko et al. 1999; Lukyanenko et al. 1999; Bayguinov et al. 2000), unitary Ca2+ events (puffs/sparks) were more commonly observed. In this study it was extremely rare to observe any Ca2+ events that did not propagate as a wave, which suggests that LM cells in the intact muscle syncitium at a physiological temperature may be more excitable than cultured/dispersed myocytes. It is likely that our apparatus could detect unitary Ca2+ events in gastrointestinal smooth muscle, which are approximately 2 μm in diameter. These events have a time course of 200 ms, and are of similar fluorescence intensity to Ca2+ waves (Gordienko et al. 1999). Performing experiments at room temperature would slow Ca2+ diffusion and the subsequent release from intracellular stores via CICR (Backx et al. 1989). Whether a threshold concentration and/or rate of rise of Ca2+ is necessary to stimulate adjacent stores to produce Ca2+ waves remains to be experimentally determined. Intracellular Ca2+ waves were not blocked by TTX or nicardipine, indicating that the predisposition for waves to occur, instead of other more unitary Ca2+ events, is a property intrinsic to the LM cells and is not strictly dependent on external Ca2+ entry through L-type Ca2+ channels or ongoing neural activity. While it is likely that there may be ongoing release of neurotransmitters from enteric motor neurons, revealed by excitatory and inhibitory junction potentials in stretched preparations (Spencer et al. 1998; 2001), any neurotransmitters released onto the LM may only have a modulatory effect on intracellular Ca2+ waves. There is evidence that ATP and ACh can modulate the amplitude and frequency of Ca2+ events ('puffs') in mouse colonic myocytes (Bayguinov et al. 2000, 2001).
Dependence on external Ca2+
Intracellular Ca2+ waves appear to be partially dependent upon external Ca2+ entry since they were blocked by Ni2+ and reduced in frequency and intensity after prolonged exposure to nicardipine. The initial block of intracellular Ca2+ waves by nicardipine as opposed to its chronic effects suggests that entry of Ca2+ through L-type and other voltage-gated Ca2+ channels may be important during physiological conditions. The increased susceptibility to fade under continued illumination after nicardipine and the decreased frequency of intracellular Ca2+ waves suggests that either the release mechanisms or the amount of Ca2+ may be partially reliant on external Ca2+ entry. The role of external Ca2+ in regulating intracellular Ca2+ waves is unclear. Ca2+ spark frequency in intestinal muscle does not appear to be critically dependent upon Ca2+ entry since they occur in the presence of Cd2+ (Gordienko et al. 1998) and Ni2+ (Balnave & Vaughan-Jones, 2000). However, diltiazem, an L-type Ca2+ channel blocker, reduced spark frequency and amplitude in intact cerebral arteries in a concentration-dependent manner (Jaggar et al. 1998). External Ca2+ entry may be necessary to recharge the SR, or activation of L-type channels may gate peripheral ryanodine receptors (see Lesh et al. 1998) as occurs in cardiac and skeletal muscle (see Niggli, 1999).
Communication between smooth muscle cells
In the intact syncitia, it was possible to examine the coordination between individual LM cells during intracellular Ca2+ wave activity. Despite the fact that longitudinal smooth muscle cells appear to form a functional syncitium because they are dye-coupled (Spencer & Smith, 2001), and are connected together via gap junctions and close contacts (Gabella & Blundell, 1981; Baluk & Gabella, 1987; Daniel & Wang, 1999), there was no coordination of Ca2+ waves between adjacent LM cells in any region or preparation during intracellular Ca2+ wave activity.
Indeed, the frequency of waves within regions of the same cell was different, indicating no physiological coupling even within single cells. This is surprising since intracellular Ca2+ waves are dependent upon both IP3-gated and ryanodine-sensitive Ca2+ stores, and both IP3 and Ca2+ have been proposed to act as intercellular messengers. It has been proposed that the diffusion of these molecules through gap junctions into neighbouring cells triggers CICR to synchronize or initiate Ca2+ wave activity, thereby allowing a wave to spread through the network of cells (see Sneyd et al. 1995b; Frame & de Feijter, 1997; Young & Hession, 1997; Hirose et al. 1999; Young, 2000). Clearly, neither IP3 nor Ca2+ (or any other intercellular messengers) are diffusing through gap junctions into neighbouring LM cells in sufficient quantities to entrain intracellular Ca2+ waves. An explanation is that the intracellular Ca2+ waves observed in our study are events occurring in a restricted space, perhaps near the periphery of the cell (Boittin et al. 1998; Lesh et al. 1998), rather than propagating through the cytoplasm that connects directly to gap junctions. This is supported by our observation that intracellular waves appear to coexist with intercellular waves that cause contraction mediated by changes in cytoplasmic Ca2+.
Propagation of intracellular Ca2+ waves
Multiple initiation sites of intracellular Ca2+ waves within single cells have been reported previously (HeLa: Bootman et al. 1997). This may be a function of the number of frequent discharge sites (Gordienko et al. 1998). The propagation of intracellular Ca2+ waves in gastrointestinal smooth muscle has previously been described as non-uniform and ‘ragged', with abrupt changes in velocity as the wave spreads along the cell (Bolton & Gordienko, 1998; Gordienko et al. 1998) due to sequential activation of separate release sites (Cheng et al. 1996). This non-linearity of propagation velocity may be explained by the heterogeneity in the distribution and density of subcellular release sites, thereby varying the time during which CICR activates adjacent stores and the amount of Ca2+ release. Indeed, the spatial distribution of release sites and the diffusion rate of Ca2+ are equally important in determining whether propagation is linear or saltatory (Keizer & Smith, 1998). In our preparation, intracellular wave velocity was linear (or ‘smooth'), indicated by the small variance in instantaneous velocities, and suggests that adjacent release sites were being activated quickly. Changes in velocity appeared to be correlated with initiation of separate waves, which collided with any ongoing propagating waves. The overall velocity of propagation remained remarkably stable in the presence of many different drugs, suggesting that it may be a function of the Ca2+ diffusion. At physiological temperatures, diffusion would be more rapid, providing a greater activation of adjacent stores, thereby ‘smoothing’ out the propagation velocity.
Possible physiological function
The absence of intracellular Ca2+ waves in the circular muscle of the proximal colon indicates that there are intrinsic differences in the patterns of spontaneous release from intracellular Ca2+ stores between these two muscle layers. Intracellular Ca2+ waves appear to be specific to LM in regions of the gastrointestinal tract mainly involved in storage, as intracellular Ca2+ waves were most prevalent in the LM layers of the proximal colon/caecum and stomach, and were not detected in the ileum, jejenum or distal colon (our unpublished observations). The physiological consequence of intracellular Ca2+ wave activity is likely to be similar to what has been reported with unitary sparks/puffs in smooth muscle. Localized release of Ca2+ close to the plasma membrane has been shown to produce a regional high concentration of Ca2+ that, most commonly, activates Ca2+-dependent K+ channels to cause hyperpolarization (Nelson et al. 1995; Bolton & Gordienko, 1998; Gordienko et al. 1998, 1999; Jaggar et al. 2000b; Kong et al. 2000; Bayguinov et al. 2001). This is likely to reduce tissue excitability, making it more difficult to reach muscle action potential threshold, however when ryanodine was added to longitudinal muscle strips no change in phasic or baseline tension was observed. This suggests that the amount of Ca2+ liberated during intracellular wave activity may be insufficient to directly activate contractile proteins. In other tissues (blood vessels), blocking release of Ca2+ from intracellular stores resulted in an increase in tone (Jaggar et al. 2000a). Intracellular Ca2+ waves have also been shown to activate Cl− currents and inward cation currents (Mironneau et al. 1996), which would depolarize the membrane and increase contractile force. It is possible, that a balance between outward and inward currents activated by intracellular Ca2+ waves could help reset the membrane potential following periodic bursts of intercellular Ca2+ wave activity (see below).
Intercellular Ca2+ waves
Spontaneously active preparations predominantly displayed intercellular Ca2+ wave activity, which was associated with contractions. The fluorescent Ca2+ signal associated with this activity is likely to be due to muscle action potentials, as this activity and associated contractile activity was blocked with the L-type Ca2+ channel antagonist nicardipine (see Spencer et al. 2002). 2-APB and ryanodine also blocked these waves, but without appreciably modifying contraction. This suggests that our detection system allows us to only detect Ca2+-induced fluorescence amplified by CICR. Apparently, we are limited by sampling at video rate and/or by the dye kinetics to an extent that we are unable to register the brief transient rise in Ca2+ associated with an action potential, which has a half amplitude duration of ≈18 ms (Spencer et al. 2002). A similar phenomenon appears to occur in myenteric AH neurons where a Fura-2-based video-rate detection system is unlikely to register the calcium influx during an action potential but readily follows CICR (Hillsley et al. 2000). Presumably, the ryanodine-sensitive and/or IP3-gated stores activated by Ca2+ influx with the action potential are different from those responsible for intracellular Ca2+ wave generation since both waves can occur independently of one another or coexist.
Intercellular Ca2+ wave patterns
The pattern of intercellular Ca2+ wave activity in the LM of mouse proximal colon is somewhat similar to the guinea-pig (Stevens et al. 1999, 2000). The initiation site was observed to shift irregularly over time, and the direction of propagation of Ca2+ waves around the circumference of the preparation was variable. In this study we have shown that the propagation of a wave circumferentially often consisted of a ‘step-like’ sequence of activation of different sized regions of LM, followed by a delay. This suggests that LM is functionally arranged into zones, within which cells are well coupled (see Spencer et al. 2002). This intimate coupling between LM cells in a zone is likely to be due to the spread of ions/second messengers between cells through gap junctions, as disrupting these junctions electrically uncouples smooth muscle cells within the syncitia (Huizinga et al. 1988) and reduces the probability of activity spreading between cells (Lamont et al. 1998). The fact that heptanol blocked these waves suggests gap junctions are crucial for the propagation of intercellular Ca2+ waves. The spread of intercellular Ca2+ waves is likely to be largely dependent upon the propagation of action potentials through the smooth muscle syncitium rather than the spread of Ca2+ through gap junctions (see Stevens et al. 1999, 2000; Spencer et al. 2002). Action potential propagation is dependent upon electronic conduction associated with charge movement through gap junctions and the cable properties of the syncitium (see Spencer et al. 2002).
The number of cells in a zone and the delay in activation between adjacent zones allows for a large degree of flexibility. Small zones with small delays in activation between zones would give rise to smoothly propagating waves, as would be advantageous during propulsion. Larger zones, and larger delays in activation between zones would give rise to more disordered activity, as is observed during mixing behaviour. Dynamic, asynchronous zones of activity may also underlie the maintenance of muscle tone, which is often a feature of longitudinal muscle. Previous studies have demonstrated that the activation and coordination of intercellular Ca2+ wave activity is modulated by enteric reflexes (Stevens et al. 1999, 2000). The preparations used in this study were pinned tight, which is likely to have activated stretch sensitive neurons (Kunze et al. 1999). The transitory nature of the initiation site, direction of propagation, size of zone and delay in activation between zones may be determined by changes in coupling between pacing sites (Spencer et al. 2002) and/or the dominance of either excitatory or inhibitory reflex pathways (Stevens et al. 1999; Spencer et al. 2001). Indeed, blocking muscarinic receptors abolished intercellular Ca2+ waves in the guinea-pig ileum (Stevens et al. 2000) and abolished or reduced them in the colon (Stevens et al. 1999), indicating that ACh released from excitatory motor neurons is necessary for the initiation of these waves. In addition, neurally mediated migrating complexes, which are largely dependent upon cholinergic activity and alter muscle excitability periodically have been reported in the mouse proximal colon (Bywater et al. 1989; Spencer et al. 1998, 2001; Bush et al. 2000). In our preparation, TTX completely blocked all waves, suggesting that ongoing reflex activity is important in the generation of intercellular Ca2+ wave activity.
In conclusion, intracellular and intercellular Ca2+ waves are both observed in LM of the murine caecum and proximal colon at physiological temperatures in vitro. Both types of Ca2+ wave appear to be independent events since they can both occur at the same time. Also, the two waves have a different dependence on extracellular Ca2+ sources, different intensities, dissimilar conduction velocities and different functions. They also appear to have different locations within the muscle cell. Intracellular Ca2+ waves, which may reduce the excitability of the muscle, are unchanged by nerve blockade, whereas intercellular Ca2+ waves are dependent upon neural activity. Although, several intracellular Ca2+ waves occur in individual myocytes, this activity is not communicated to neighbouring cells in the syncitium. In contrast, intercellular Ca2+ waves spread across many cells, are initiated by external Ca2+ entry that is probably due to action potential propagation via gap junctions, and initiate a contraction over relatively large areas of muscle. However, Ca2+ influx during intercellular Ca2+ waves may recharge the sarcoplasmic reticulum for intracellular Ca2+ waves, since even intracellular Ca2+ waves are fuelled, to some degree, by external Ca2+ entry through L-type Ca2+ channels. Despite their differences, both intracellular and intercellular waves are spatially limited within cells and over many cells respectively, since they exist in zones of activity. The patterns of intracellular Ca2+ waves appear to be more consistent, compared to the larger repertoire and flexibility of patterns of intercellular Ca2+ waves.
Acknowledgments
This study was supported by a grant from the National Institutes of Health (USA) DK RO1-45713. G.W.H was supported by a C. J. Martin Research Fellowship (007160 NHMRC, Australia).
References
- Arnaudeau S, Boittin FX, MacreZ N, Lavie JL, Mironneau C, Mironneau J. L-type and Ca2+ release channel-dependent hierarchical Ca2+ signalling in rat portal vein myocytes. Cell Calcium. 1997;22:399–411. doi: 10.1016/s0143-4160(97)90024-5. [DOI] [PubMed] [Google Scholar]
- Backx PH, de Tombe PP, van Deen JHK, Mulder BJM, ter Deurs HEDJ. A model of propagating calcium-induced calcium release mediated by calcium diffusion. Journal of General Physiology. 1989;93:963–977. doi: 10.1085/jgp.93.5.963. [DOI] [PMC free article] [PubMed] [Google Scholar]
- Balnave CD, Vaughan-Jones RD. Effect of intracellular pH on spontaneous Ca2+ sparks in rat ventricular myocytes. Journal of Physiology. 2000;528:5–37. doi: 10.1111/j.1469-7793.2000.00025.x. [DOI] [PMC free article] [PubMed] [Google Scholar]
- Baluk P, Gabella G. Scanning electron microscopy of the muscle coat of the guinea-pig small intestine. Cell and Tissue Research. 1987;250:551–561. doi: 10.1007/BF00218946. [DOI] [PubMed] [Google Scholar]
- Bayguinov O, Hagen B, Bonev AD, Nelson MT, Sanders KM. Intracellular calcium events activated by ATP in murine colonic myocytes. American Journal of Physiology – Cell Physiology. 2000;279:C126–135. doi: 10.1152/ajpcell.2000.279.1.C126. [DOI] [PubMed] [Google Scholar]
- Bayguinov O, Hagen B, Sanders KM. Muscarinic stimulation increases basal Ca2+ and inhibits spontaneous Ca2+ transients in murine colonic myocytes. American Journal of Physiology – Cell Physiology. 2001;280:C689–700. doi: 10.1152/ajpcell.2001.280.3.C689. [DOI] [PubMed] [Google Scholar]
- Berlin JR, Cannell MB, Lederer WJ. Cellular origins of the transient inward current in cardiac myocytes. Role of fluctuations and waves of elevated intracellular calcium. Circulation Research. 1989;65:115–126. doi: 10.1161/01.res.65.1.115. [DOI] [PubMed] [Google Scholar]
- Boittin FX, Coussin F, MacreZ N, Mironneau C, Mironneau J. Inositol 1,4,5-triphosphate and ryanodine-sensitive Ca2+ release channel-dependent Ca2+ signalling in rat portal vein myocytes. Cell Calcium. 1998;23:303–311. doi: 10.1016/s0143-4160(98)90026-4. [DOI] [PubMed] [Google Scholar]
- Bolton TB, Gordienko DV. Confocal imaging of calcium release events in single smooth muscle cells. Acta Physiologica Scandinavica. 1998;164:567–575. doi: 10.1046/j.1365-201X.1998.00464.x. [DOI] [PubMed] [Google Scholar]
- Bolton TB, Prestwich SA, Zholos AV, Gordienko DV. Excitation-contraction coupling in gastrointestinal and other smooth muscle. Annual Review of Physiology. 1999;61:85–115. doi: 10.1146/annurev.physiol.61.1.85. [DOI] [PubMed] [Google Scholar]
- Bootman M, Niggli E, Berridge M, Lipp P. Imaging the hierarchical Ca2+ signalling system in HeLa cells. Journal of Physiology. 1997;499:307–314. doi: 10.1113/jphysiol.1997.sp021928. [DOI] [PMC free article] [PubMed] [Google Scholar]
- Bush TG, Spencer N, Watters N, Sanders KM, Smith TK. Spontaneous migrating motor complexes occur in both terminal ileum and colon of the C57BL/6 mouse in vitro. Autonomic Neuroscience. 2000;84:162–168. doi: 10.1016/S1566-0702(00)00201-0. [DOI] [PubMed] [Google Scholar]
- Bywater RA, Small RC, Taylor GS. Neurogenic slow depolarizations and rapid oscillations in the membrane potential of circular muscle of mouse colon. Journal of Physiology. 1989;413:505–519. doi: 10.1113/jphysiol.1989.sp017666. [DOI] [PMC free article] [PubMed] [Google Scholar]
- Cheng H, Lederer MR, Lederer WJ, Cannell MB. Calcium sparks and [Ca2+]i waves in cardiac myocytes. American Journal of Physiology. 1996;270:C148–159. doi: 10.1152/ajpcell.1996.270.1.C148. [DOI] [PubMed] [Google Scholar]
- Daniel EE, Wang YF. Gap junctions in intestinal smooth muscle and interstitial cells of Cajal. Microscopy Research and Technique. 1999;47:309–320. doi: 10.1002/(SICI)1097-0029(19991201)47:5<309::AID-JEMT2>3.0.CO;2-K. [DOI] [PubMed] [Google Scholar]
- Frame MK, de Feijter AW. Propagation of mechanically induced intercellular calcium waves via gap junctions and ATP receptors in rat liver epithelial cells. Experimental Cell Research. 1997;230:197–207. doi: 10.1006/excr.1996.3409. [DOI] [PubMed] [Google Scholar]
- Gabella G, Blundell D. Gap junctions of the muscles of the small and large intestine. Cell and Tissue Research. 1981;219:469–488. doi: 10.1007/BF00209987. [DOI] [PubMed] [Google Scholar]
- Gordienko DV, Bolton TB, Cannell MB. Variability in spontaneous subcellular calcium release in guinea-pig ileum smooth muscle cells. Journal of Physiology. 1998;507:707–720. doi: 10.1111/j.1469-7793.1998.707bs.x. [DOI] [PMC free article] [PubMed] [Google Scholar]
- Gordienko DV, Zholos AV, Bolton TB. Membrane ion channels as physiological targets for local Ca2+ signalling. Journal of Microscopy. 1999;196:305–316. doi: 10.1046/j.1365-2818.1999.00599.x. [DOI] [PubMed] [Google Scholar]
- Gregory RB, Rychkov G, Barritt GJ. Evidence that 2-aminoethyl diphenylborate is a novel inhibitor of store-operated Ca2+ channels in liver cells, and acts through a mechanism which does not involve inositol trisphosphate receptors. Biochemical Journal. 2001;354:285–290. doi: 10.1042/0264-6021:3540285. [DOI] [PMC free article] [PubMed] [Google Scholar]
- Hashitani H, Fukuta H, Takano H, Klemm MF. Origin and propagation of spontaneous excitation in smooth muscle of the guinea-pig urinary bladder. Journal of Physiology. 2001;530:273–286. doi: 10.1111/j.1469-7793.2001.0273l.x. [DOI] [PMC free article] [PubMed] [Google Scholar]
- Hennig GW, Costa M, Chen BN, Brookes SJ. Quantitative analysis of peristalsis in the guinea-pig small intestine using spatio-temporal maps. Journal of Physiology. 1999;517:575–590. doi: 10.1111/j.1469-7793.1999.0575t.x. [DOI] [PMC free article] [PubMed] [Google Scholar]
- Hennig GW, Smith TK. Calcium waves within longitudinal muscle of the ceacum and proximal colon of the mouse in situ: role of ryanodine sensitive stores. Gastroenterology. 2000;118:A2098. [Google Scholar]
- Hillsley K, Kenyon J, Smith TK. Ryanodine sensitive stores regulate the excitability of myenteric AH neurons. Journal of Neurophysiology. 2000;84:2777–2785. doi: 10.1152/jn.2000.84.6.2777. [DOI] [PubMed] [Google Scholar]
- Hirose K, Kadowaki S, Tanabe M, Takeshima H, Iino M. Spatiotemporal dynamics of Inositol 1, 4, 5-Trisphosphate that underlies complex Ca2+ mobilization patterns. Science. 1999;284:1527–1530. doi: 10.1126/science.284.5419.1527. [DOI] [PubMed] [Google Scholar]
- Huizinga JD, Shin A, Chow E. Electrical coupling and pacemaker activity in colonic smooth muscle. American Journal of Physiology. 1988;255:C653–660. doi: 10.1152/ajpcell.1988.255.5.C653. [DOI] [PubMed] [Google Scholar]
- Iino M, Kasai H, Yamazawa T. Visualization of neural control of intracellular Ca2+ concentration in single vascular smooth muscle cells in situ. EMBO Journal. 1994;13:5026–5031. doi: 10.1002/j.1460-2075.1994.tb06831.x. [DOI] [PMC free article] [PubMed] [Google Scholar]
- Jaffe LF. The path of calcium in cytosolic calcium oscillations: a unifying hypothesis. Proceedings of the National Academy of Sciences of the USA. 1991;88:9883–9887. doi: 10.1073/pnas.88.21.9883. [DOI] [PMC free article] [PubMed] [Google Scholar]
- Jaggar JH, Nelson MT. Differential regulation of Ca2+ sparks and Ca2+ waves by UTP in rat cerebral artery smooth muscle cells. American Journal of Physiology – Cell Physiology. 2000b;279:C1528–1539. doi: 10.1152/ajpcell.2000.279.5.C1528. [DOI] [PubMed] [Google Scholar]
- Jaggar JH, Porter VA, Lederer WJ, Nelson MT. Calcium sparks in smooth muscle. American Journal of Physiology – Cell Physiology. 2000a;278:C235–256. doi: 10.1152/ajpcell.2000.278.2.C235. [DOI] [PubMed] [Google Scholar]
- Jaggar JH, Stevenson AS, Nelson MT. Voltage dependence of Ca2+ sparks in intact cerebral arteries. American Journal of Physiology – Cell Physiology. 1998;274:C1755–1761. doi: 10.1152/ajpcell.1998.274.6.C1755. [DOI] [PubMed] [Google Scholar]
- Keizer J, Smith GD. Spark-to-wave transition: saltatory transmission of calcium waves in cardiac myocytes. Biophysical Chemistry. 1998;72:87–100. doi: 10.1016/s0301-4622(98)00125-2. [DOI] [PubMed] [Google Scholar]
- Kohda M, Komori S, Unno T, Ohashi H. Characterization of action potential-triggered [Ca2+]i transients in single smooth muscle cells of guinea-pig ileum. British Journal of Pharmacology. 1997;122:477–486. doi: 10.1038/sj.bjp.0701407. [DOI] [PMC free article] [PubMed] [Google Scholar]
- Kong ID, Koh SD, Bayguinov O, Sanders KM. Small conductance Ca2+-activated K+ channels are regulated by Ca2+-calmodulin-dependent protein kinase II in murine colonic myocytes. Journal of Physiology. 2000;524:331–337. doi: 10.1111/j.1469-7793.2000.t01-1-00331.x. [DOI] [PMC free article] [PubMed] [Google Scholar]
- Kunze WA, Clerc N, Bertrand PP, Furness JB. Contractile activity in intestinal muscle evokes action potential discharge in guinea-pig myenteric neurons. Journal of Physiology. 1999;517:547–561. doi: 10.1111/j.1469-7793.1999.0547t.x. [DOI] [PMC free article] [PubMed] [Google Scholar]
- Lamont C, Luther PW, Balke CW, Wier WG. Intercellular Ca2+ waves in rat heart muscle. Journal of Physiology. 1998;512:669–676. doi: 10.1111/j.1469-7793.1998.669bd.x. [DOI] [PMC free article] [PubMed] [Google Scholar]
- Lesh RE, Nixon GF, Fleischer S, Airey JA, Somlyo AP, Somlyo AV. Localization of ryanodine receptors in smooth muscle. Circulation Research. 1998;82:175–185. doi: 10.1161/01.res.82.2.175. [DOI] [PubMed] [Google Scholar]
- Lukyanenko V, Subramanian S, Gyorke I, Wiesner TF, Gyorke S. The role of luminal Ca2+ in the generation of Ca2+ waves in rat ventricular myocytes. Journal of Physiology. 1999;518:173–186. doi: 10.1111/j.1469-7793.1999.0173r.x. [DOI] [PMC free article] [PubMed] [Google Scholar]
- Ma HT, Patterson RL, van Rossum DB, Birnbaumer L, Mikoshiba K, Gill DL. Requirement of the inositol triphoshate receptor for activation of store-operated Ca2+ channels. Science. 2000;287:1647–1651. doi: 10.1126/science.287.5458.1647. [DOI] [PubMed] [Google Scholar]
- Mironneau J, Arnaudeau S, MacreZ-Lepretre N, Boittin FX. Ca2+ sparks and Ca2+ waves activate different Ca2+-dependent ion channels in single myocytes from rat portal vein. Cell Calcium. 1996;20:153–160. doi: 10.1016/s0143-4160(96)90104-9. [DOI] [PubMed] [Google Scholar]
- Miyamoto S, Izumi M, Hori M, Kobayashi M, Ozaki H, Karaki H. Xestospongin C, a selective and membrane-permeable inhibitor of IP3 receptor, attenuates the positive inotropic effect of alpha-adrenergic stimulation in guinea-pig papillary muscle. British Journal of Pharmacology. 2000;130:650–654. doi: 10.1038/sj.bjp.0703358. [DOI] [PMC free article] [PubMed] [Google Scholar]
- Nelson MT, Cheng H, Rubart M, Santana LF, Bonev AD, Knot HJ, Lederer WJ. Relaxation of arterial smooth muscle by calcium sparks. Science. 1995;270:633–637. doi: 10.1126/science.270.5236.633. [DOI] [PubMed] [Google Scholar]
- Newman EA. Propagation of intercellular calcium waves in retinal astrocytes and Muller cells. Journal of Neuroscience. 2001;21:215–223. doi: 10.1523/JNEUROSCI.21-07-02215.2001. [DOI] [PMC free article] [PubMed] [Google Scholar]
- Niggli E. Localized intracellular calcium signaling in muscle: calcium sparks and calcium quarks. Annual Review of Physiology. 1999;61:311–335. doi: 10.1146/annurev.physiol.61.1.311. [DOI] [PubMed] [Google Scholar]
- Smith TK, Sanders KM. Motility of the large intestine. In: Yamada T, Alpers DH, Owyang C, Powell DW, Silverstein FE, editors. Textbook of Gastroenterology, I. Philadelphia: J. B. Lippincott Co.; 1994. pp. 234–261. chap. 10. [Google Scholar]
- Sneyd J, Wetton BT, Charles AC, Sanderson MJ. Intercellular calcium waves mediated by diffusion of inositol trisphosphate: a two-dimensional model. American Journal of Physiology. 1995b;268:C1537–1545. doi: 10.1152/ajpcell.1995.268.6.C1537. [DOI] [PubMed] [Google Scholar]
- Sneyd J, Wetton BT, Charles AC, Sanderson MJ, Hansen M, Boitano S, Dirksen ER, Sanderson MJ. A role for phospholipase C activity but not ryanodine receptors in the initiation and propagation of intercellular calcium waves. Journal of Cell Science. 1995a;108:2583–2590. doi: 10.1242/jcs.108.7.2583. [DOI] [PubMed] [Google Scholar]
- Spencer NJ, Bywater RA, Taylor GS. Disinhibition during myoelectric complexes in the mouse colon. Journal of the Autonomic Nervous System. 1998;71:37–47. doi: 10.1016/s0165-1838(98)00063-0. [DOI] [PubMed] [Google Scholar]
- Spencer NJ, Hennig GW, Smith TK. Spatial and temporal coordination of junction potentials in circular muscle of guinea-pig distal colon. Journal of Physiology. 2001;535:565–578. doi: 10.1111/j.1469-7793.2001.00565.x. [DOI] [PMC free article] [PubMed] [Google Scholar]
- Spencer NJ, Hennig GW, Smith TK. Electrical rhythmicity and spread of action potentials in longitudinal muscle of guinea-pig distal colon. American Journal of Physiology – Gastrointestinal and Liver Physiology. 2002;282:G904–917. doi: 10.1152/ajpgi.00345.2001. [DOI] [PubMed] [Google Scholar]
- Spencer NJ, Smith TK. Simultaneous intracellular recordings from longitudinal and circular muscle during the peristaltic reflex in guinea-pig distal colon. Journal of Physiology. 2001;533:787–799. doi: 10.1111/j.1469-7793.2001.00787.x. [DOI] [PMC free article] [PubMed] [Google Scholar]
- Stevens RJ, Publicover NG, Smith TK. Induction and regulation of Ca2+ waves by enteric neural reflexes. Nature. 1999;399:62–66. doi: 10.1038/19973. [DOI] [PubMed] [Google Scholar]
- Stevens RJ, Publicover NG, Smith TK. Propagation and neural regulation of calcium waves in longitudinal and circular muscle layers of guinea-pig small intestine. Gastroenterology. 2000;118:892–904. doi: 10.1016/s0016-5085(00)70175-2. [DOI] [PubMed] [Google Scholar]
- Takamatsu T, Wier WG. Calcium waves in mammalian heart: quantification of origin, magnitude, waveform, and velocity. FASEB Journal. 1990;4:1519–1525. doi: 10.1096/fasebj.4.5.2307330. [DOI] [PubMed] [Google Scholar]
- Wier WG, Blatter LA. Ca2+-oscillations and Ca2+-waves in mammalian cardiac and vascular smooth muscle cells. Cell Calcium. 1991;12:241–254. doi: 10.1016/0143-4160(91)90024-9. [DOI] [PubMed] [Google Scholar]
- Young RC. Tissue-level signalling and control of uterine contractility: the action potential-calcium wave hypothesis. Journal of the Society for Gynecological Investigation. 2000;7:146–152. doi: 10.1016/s1071-5576(00)00041-1. [DOI] [PubMed] [Google Scholar]
- Young RC, Hession RO. Paracrine and intracellular signaling mechanisms of calcium waves in cultured human uterine myocytes. Obstetrics and Gynecology. 1997;90:928–932. doi: 10.1016/s0029-7844(97)00498-5. [DOI] [PubMed] [Google Scholar]