

Abstract
Intracellular ionic strength may play an important role in regulating the expression of genes encoding osmolyte-accumulating molecules. To establish whether a strict relation exists between these variables, intracellular ionic strength (sum of Na+, Cl− and K+ concentrations) and the relative abundance of mRNA derived from various tonicity-sensitive genes was examined using electron microprobe analysis and Northern blots on primary cultures of rat papillary collecting duct (PCD) cells following acute or long-term alterations in medium tonicity. Hypertonic medium (450 mosmol kg−1) evoked an initial rise in intracellular ionic strength (269 ± 5 vs. 194 ± 7 mmol (kg wet weight (wt))−1 in isotonic controls; means ± s.e.m.), which subsequently declined gradually, and a significantly higher abundance of bgt1 (Na+- and Cl−-dependent betaine transporter), smit (Na+/myo-inositol cotransporter), ar (aldose reductase) and osp94 (osmotic stress protein 94) mRNAs. Conversely, exposure to hypotonic medium (200 mosmol kg−1) for 12 h was associated with significantly reduced intracellular ionic strength (153 ± 4 mmol (kg wet wt)−1) and significantly reduced the abundance of smit and ar mRNAs. PCD cells preconditioned in hypotonic medium and re-exposed to isotonic medium showed significantly higher abundance of these mRNAs than isotonic controls, although the intracellular ionic strength did not differ. Two further tonicity-sensitive genes responded differently to medium tonicity: while the abundance of hsp70 (heat shock protein 70) mRNA increased significantly following both hypo- and hypertonic stress, inos (inducible nitric oxide synthase) mRNA abundance correlated inversely with medium tonicity. These findings support the view that the effect of intracellular ionic strength on the expression of bgt1, smit, ar and osp94 is modulated by additional factors such as cell volume, and that its effect on the pathways regulating hsp70 and inos is even more complex.
Accumulation of organic osmolytes by the cells of the renal medulla is a vital component of the complex adaptation process allowing their survival during severe hypertonic stress (Law & Burg, 1991; Burg et al. 1997; Beck et al. 1998). When extracellular tonicity rises, transcription of mRNAs encoding the Na+- and Cl−-dependent betaine transporter (BGT1), the Na+/myo-inositol cotransporter (SMIT) and aldose reductase (AR), an enzyme which converts glucose into sorbitol, is stimulated (Burg & Garcia-Perez, 1992). Recently, a transcription factor has been identified, the tonicity-responsive enhancer element (TonE) binding protein (TonEBP), which is involved in the transcriptional activation of several tonicity-sensitive genes (Miyakawa et al. 1999). After translocating from the cytosol to the nucleus, TonEBP interacts with TonEs in the promoter region of the corresponding genes and upregulates their transcription (Miyakawa et al. 1999; Woo et al. 2000). There is evidence indicating that changes in intracellular ionic strength induced by alterations in extracellular tonicity are responsible for the modulation of TonEBP activity (Burg & Garcia-Perez, 1992). On the other hand, in the steady state of antidiuresis, the intracellular ionic strength of renal papillary cells does not differ substantially from that of renal cortical cells, although the expression of osmolyte-accumulating molecules is much higher in the papilla (Beck et al. 1980, 1992; Burger-Kentischer et al. 1999).
The aim of the present study was thus to establish whether the expression of bgt1, smit and ar mRNAs correlates strictly with intracellular ionic strength when extracellular tonicity is altered. The experiments were performed on primary cultures of papillary collecting duct (PCD) cells. This approach offers the possibility of controlling precisely the extracellular solute concentrations of cells that are very similar to PCD cells of the intact tissue with respect to a variety of functional and biochemical properties (Stokes et al. 1987; Konieczkowski & Dunn, 1988; Burger-Kentischer et al. 1999). In addition to ar, bgt1 and smit mRNA expression, we also examined the effect of altered extracellular tonicity, and hence intracellular ionic strength, on the abundance of several mRNAs encoding several other proteins, the expression of which is influenced by tonicity: inducible nitric oxide synthase (iNOS), heat shock protein 70 (HSP70) and osmotic stress protein 94 (OSP94).
Methods
Isolation and culture of papillary collecting duct cells
All experiments were conducted in accordance with German federal laws relating to animal experimentation. PCD cells were isolated as described previously (Burger-Kentischer et al. 1999). In brief, white inner medullae were obtained from Wistar rats of either sex (70-120 g) killed by i.p. injection of chloralhydrate (7 %; Sigma, Deisenhofen Germany). The tissue was minced, transferred into 2 ml modified Ringer solution (mm: 118 NaCl, 16 Hepes, 14 glucose, 3.2 KCl, 2.5 CaCl2, 1.8 MgSO4, 1.8 KH2PO4; pH 7.4) containing 0.2 % collagenase and 0.2 % hyaluronidase (both from Roche Diagnostics, Mannheim, Germany) and incubated at 37 °C for ≈2 h. DNase (0.001 %; Roche) was added after 45 min to prevent clumping. During the incubation, the suspension was passed repeatedly through the tip of a plastic pipette every 15–20 min. Then, two volumes of distilled water were added (Konieczkowski & Dunn, 1988) and the suspension was centrifuged at 4 °C (28 g, 2 min). The pellet was resuspended in modified Ringer solution containing DNase and the separation procedure repeated twice. The PCD cells were cultured either in 94 mm plastic dishes (Greiner Bio-One, Frickenhausen, Germany), or on laminin-coated (Sigma), permeable, 12 mm filter membranes (Millicell-CM; Millipore, Bedford, MA, USA) using Dulbecco's modified Eagle's-Ham's F-12 medium (DMEM : F-12, 1 : 1; Life Technologies, Karlsruhe, Germany) supplemented with 10 % fetal calf serum (FCS; Roche Diagnostics), 50 U ml−1 penicillin (Sigma) and 50 μg ml−1 streptomycin (Sigma). The Na+- and K+-depleted starting medium (custom prepared by Life Technologies) was supplemented with KCl and NaCl to yield the appropriate K+ concentration (5 mm) and osmolality. It was changed daily. Experiments were carried out after 4–5 days when cells were subconfluent (about 80 %). The control medium (300 mosmol kg−1) was replaced by the appropriate experimental (200 or 450 mosmol kg−1) or control medium for defined periods. At the end of the respective incubation period, the cells were processed either for electron microscopy, electron microprobe analysis or for Northern blotting.
Electron microscopy
PCD cells on laminin-coated, permeable 12 mm filter membranes kept either in isotonic control medium or, for 12 h, in hypo- or hypertonic medium, were fixed for 1 h in a solution containing 2.5 % glutaraldehyde and 2 % formaldehyde, freshly prepared from paraformaldehyde, in 0.1 m Na+-cacodylate buffer, pH 7.4. After thorough rinsing in the same buffer, the cells were postfixed in an unbuffered solution of 2 % OsO4, dehydrated in ethanol and embedded in Epon. Thin sections were stained with lead citrate and uranyl acetate and examined in a Philips CM 10 electron microscope operating at 80 kV.
Shock freezing, preparation of freeze-dried cryosections and electron microprobe analysis
The medium was removed rapidly, and the filter was covered with a thin layer of a standard albumin solution applied on both apical and basal sides and frozen rapidly in a mixture of propane and isopentane (3 : 1, v : v; −196 °C). The standard albumin solution was prepared by dissolving 2 g bovine serum albumin (Behringwerke, Marburg, Germany) in 10 ml of the appropriate medium. One micrometre thick cryosections were cut at −80 °C in an ultracryomicrotome (Ultratome V; LKB, Bromma, Sweden), freeze dried, analysed in a scanning transmission electron microscope (S150; Cambridge Instruments, Cambridge, UK) equipped with an energy-dispersive X-ray detector system (LINK, High Wycombe, UK) and the X-ray spectra quantified as described elsewhere (Beck et al. 1984).
Northern blot analysis
After the respective treatments, cells were lysed by the addition of TRI Reagent (1 ml per 94 mm dish; Peq Lab, Erlangen, Germany) and the RNA recovered according to the manufacturer's instructions. Aliquots (20 μg) of total RNA were electrophoresed through 1 % agarose/formaldehyde gels, transferred onto positively charged nylon membranes (Hybond N+, Amersham, Freiburg, Germany) and immobilised by UV cross-linking. The mRNA abundance of the individual genes was monitored using the following cDNAs: smit, canine 2.8 kb Sal I-Not I fragment in pSPORT (Kwon et al. 1992); bgt1, canine 2.8 kb Sal I-Not I fragment in pSPORT (Yamauchi et al. 1992); osp94, mouse 2.8 kb Sal I-Not I fragment in pSPORT (Kojima et al. 1996); hsp70, human 2.3 kb Hind III-Bam HI fragment in pAT153 (ATCC, Manassas, VA, USA) (Wu et al. 1985); inos, rat 1.2 kb Xba I fragment in pcDNA3 (Keinanen et al. 1999); glyceraldehyde 3-phosphate dehydrogenase (gapdh), 1.35 kb rat cDNA (Sigma). To prepare digoxigenin-labelled probes, the respective cDNA fragments were excised from the vector backbone, gel-purified and subjected to random primed extension in the presence of digoxigenin-dUTP (Roche) and dNTP by Klenow fragmentexo- (MBI Fermentas, St Leon-Rot, Germany) as described previously (Neuhofer et al. 2001). ar expression was monitored using a 25mer oligonucleotide complementary to bases 1276–1300 of rat ar (5′-CCC CCA TAG GAC TGG AGT TCT AAG C-3′) (Burger-Kentischer et al. 1999). The probe was digoxigenin-labelled by terminal transferase (MBI Fermentas) in the presence of digoxigenin-dUTP and dNTPs.
Membranes were prehybridised for 2 h in a solution containing 50 % formamide, 5 × SSC, 0.1 % SDS and 10 % blocking reagent (Roche) at 55 °C. Hybridisation was performed overnight in the same solution containing 20 ng ml−1 digoxigenin-labelled probe at 55 °C; for analysis of bgt1 expression, hybridisation was performed at 42 °C. After hybridisation, the membranes were washed twice for 15 min each with 2 × SSC-0.1 % SDS at room temperature and twice for 15 min each with 0.1 × SSC-0.1 % SDS at 55 °C (42 °C for bgt1). Under these conditions, the probes specifically hybridised with mRNAs of the predicted size. After each hybridisation, the blots were stripped and hybridised with the next probe and finally with gapdh. The signals were quantified by laser densitometry (Ultroscan XL, Pharmacia, Freiburg, Germany) and normalised to that of gapdh to correct for differences in RNA loading.
Presentation and analysis of data
Data are presented as means ± s.e.m. Intracellular electrolyte concentrations are given in millimoles per kilogram wet weight. For each group, electron microprobe analyses were performed on at least four filters with five to eight cells analysed per filter. The data were analysed using one-way ANOVA (SPSS/PC software; SPSS, Chicago, IL, USA). Where significant effects were detected, Student's t test was used to determine the significance of differences between individual means, with the significance levels adjusted according to rules described in Sachs (1984). The data obtained by Northern blotting were evaluated in a first step using the Kruskal-Wallis test and, when significant differences were present, these were examined using the Mann-Whitney test with appropriately adjusted significance levels.
Results
Ultrastructural studies
There were no major ultrastructural differences between the cells cultured in the control medium and in either of the two experimental media. The cells formed an almost continuous monolayer of different heights. Many of the cells were squamous, but in some areas cuboidal and cylindrical cells were present (Fig. 1) which resembled PCD cells in situ (Tisher & Madsen, 2000). Their apical surface bulged towards the lumen and was only minimally enlarged by a few short microvilli. Occasionally a single cilium was observed (Fig. 1, upper panel, inset). The inner medullary collecting ducts have a characteristic distribution of cilia. In the initial segment almost every cell has a cilium, whilst the terminal segment is completely devoid of cilia (Tisher & Madsen, 2000).
Figure 1. Transmission electron micrographs of rat PCD cells cultured in hypotonic, isotonic and hypertonic media.
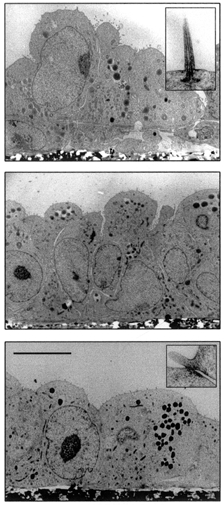
Upper panel, hypotonic medium (200 mosmol kg−1; inset, cilium); middle panel, isotonic medium (300 mosmol kg−1); lower panel, hypertonic medium (450 mosmol kg−1; inset, tight junction). Scale bar in lower panel applies to all panels and represents 10 μm.
At the transition from the apical to the lateral membrane, a shallow tight junction (Fig. 1, lower panel, inset) was regularly, and a desmosome infrequently, encountered. The area of the lateral surface was moderately enlarged by folds. A discontinuous basal membrane was present at the basal surface. The nucleus contained a prominent nucleolus and very little heterochromatin attached to the inner nuclear membrane. Electron-dense bodies, most probably representing lipid droplets, and a few mitochondria were seen in the cytoplasm, as observed previously (Tisher & Madsen, 2000). Bundles of microfilaments (stress fibres) were oriented parallel to the basal surface.
Intracellular electrolyte concentrations
Figure 2 shows the effect of a step increase in medium tonicity from 300 to 450 mosmol kg−1 on K+, Na+ and Cl− concentrations of cultured PCD cells. After 2 min, the sum of intracellular K+, Na+ and Cl− concentrations was elevated significantly: 199.5 ± 5.6, 26.8 ± 1.6 and 42.9 ± 1.6 vs. 144.8 ± 5.7, 19.8 ± 2.3 and 29.4 ± 2.5 mmol (kg wet wt)−1 in isotonic controls. After 12 h, intracellular K+, Na+ and Cl− concentrations were 163.1 ± 4.9, 25.4 ± 1.0 and 45.1 ± 1.4 mmol (kg wet wt)−1, respectively, and 150.9 ± 3.0, 23.5 ± 1.2 and 42.4 ± 3.1 mmol (kg wet wt)−1, respectively, after a 24 h exposure to hypertonic medium. When PCD cells were exposed to hypotonic medium (200 mosmol kg−1) for 12 h, intracellular K+, Na+ and Cl− concentrations (118.3 ± 4.9, 11.3 ± 1.3 and 23.4 ± 1.0 mmol (kg wet wt)−1, respectively) were significantly reduced compared with the isotonic controls (Fig. 3). Changing medium tonicity back to 300 mosmol kg−1 resulted in intracellular K+, Na+ and Cl− concentrations that did not greatly differ from those of isotonic controls at both 2 min (141.2 ± 5.4, 17.5 ± 1.5 and 32.1 ± 4.9 mmol (kg wet wt)−1, respectively) and 12 h (136.8 ± 5.8, 22.8 ± 1.4 and 38.0 ± 2.7 mmol (kg wet wt)−1, respectively) after the change.
Figure 2. Intracellular ionic strength (sum of intracellular Na+, Cl− and K+ concentrations) of rat PCD cells following exposure to hypertonic medium (450 mosmol kg−1).
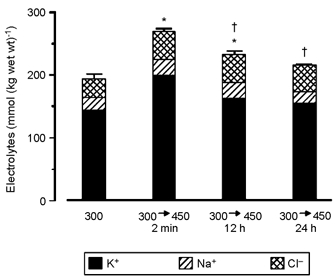
Means ± s.e.m. for four to seven filters (5-8 intracellular analyses per filter). * Significantly different from value obtained in PCD cells kept at 300 mosmol kg−1; † significantly different from value obtained after the 2 min exposure to hypertonic medium.
Figure 3. Intracellular ionic strength of rat PCD cells after preconditioning in hypotonic medium (200 mosmol kg−1) and subsequent re-exposure to isotonic medium (300 mosmol kg−1).

Means ± s.e.m. for four to seven filters (5-8 intracellular analyses per filter). * Significantly different from value obtained in PCD cells kept at 300 mosmol kg−1.
Effect on expression of tonicity-responsive genes
As demonstrated in Fig. 4, the mRNA abundance of genes involved in osmolyte accumulation responded qualitatively similarly to the different experimental protocols; that is, incubation in hypotonic medium (200 mosmol kg−1) for 12 h resulted in significant downregulation of smit and ar mRNAs. bgt1 mRNA also tended to follow this pattern, although the difference did not reach significance. In contrast, the message of the major stress-inducible hsp70 was not reduced, but in fact elevated, during hypotonic stress, as was inos mRNA (by 3- and 7-fold, respectively, compared with control). Interestingly, the latter correlated inversely with medium tonicity. Restoring the osmolality to control (300 mosmol kg−1) enhanced the abundance of all mRNA species investigated significantly compared with control, although intracellular ionic strength was not different from control (Fig. 3). Raising the tonicity to 450 mosmol kg−1 increased the abundance of smit, ar, hsp70 and osp94 mRNAs by 4- to 6-fold, while that of bgt1 mRNA was even more enhanced (22-fold compared with 300 mosmol kg−1).
Figure 4. Effect of hypotonicity and hypertonicity on expression of tonicity-responsive genes.
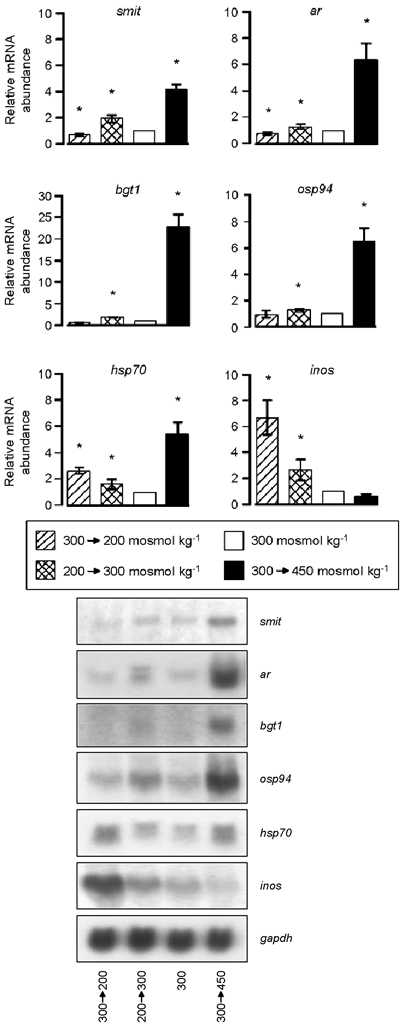
Primary cultures of rat PCD cells were grown at 300 mosmol kg−1. Thereafter, cultures were either continued in this medium (control) or transferred for 12 h to hypertonic (450 mosmol kg−1) or hypotonic (200 mosmol kg−1) medium. Some of the latter cultures were subsequently returned to isotonic (300 mosmol kg−1) medium for 12 h. The mRNA abundance of the indicated genes was determined subsequently by Northern blot analysis and normalised to gapdh. Data are given as the relative mRNA abundance compared with isotonic controls (300 mosmol kg−1 = 1). Means ± s.e.m. for n = 5; * significantly different from value obtained in PCD cells kept at 300 mosmol kg−1. Representative blots are shown on the right.
Discussion
In antidiuresis, the intracellular concentrations of Na+, Cl− and K+ of renal papillary cells do not differ substantially from those of cortical cells, although the interstitial NaCl concentration in the papilla may be severalfold higher than that in the cortex (Beck et al. 1980, 1984). A transient rise in the intracellular concentration of the monovalent inorganic electrolytes K+, Na+ and Cl−, i.e. in intracellular ionic strength (Beck et al. 1985; Motais et al. 1991), is observed when, after long-term diuresis, the renal concentrating mechanism is stimulated and extracellular tonicity rises steeply (Beck et al. 1992; Sone et al. 1993). Similarly, after exposure of rat PCD cells to hypertonic medium, the cells shrink, as indicated by a significant rise in cell dry weight and cell phosphorus concentration (data not shown) and intracellular ionic strength increases. The latter then gradually falls and approaches control values (Fig. 2). The slow decline in intracellular ionic strength is paralleled by a rise in the abundance of bgt1, smit and ar mRNAs (Fig. 4) and in the intracellular content of organic osmolytes (Burger-Kentischer et al. 1999). This sequence of events supports the view that both hypertonicity-induced cell shrinkage and the concomitant rise of intracellular ionic strength are eventually corrected by intracellular accumulation of organic osmolytes. Conversely, exposure to hypotonic medium reduces intracellular Na+, Cl− and K+ concentrations and hence intracellular ionic strength (Fig. 3). However, following re-exposure to isotonic medium, a manoeuvre known to induce cell shrinkage (Hebert & Sun, 1988), the sum of Na+, Cl− and K+ concentrations rises to a value not different from isotonic controls (Fig. 3). This indicates that in this situation regulatory volume increase is achieved primarily by transmembrane movement of inorganic electrolytes accompanied by osmotically obligated water.
Changes in extracellular tonicity strongly influence the expression of various genes (Gilles, 1997). It is now well established that the transcription of a number of tonicity-sensitive genes is stimulated by the binding of TonEBP to its cognate DNA elements, TonEs (Miyakawa et al. 1999). This activation process is thought to depend on intracellular ionic strength. In the present study we examined the relation between intracellular ionic strength and the expression of several tonicity-responsive genes in primary cultures of PCD cells. This approach was chosen because extracellular tonicity can be controlled precisely and, in the intact organ, PCD cells are exposed physiologically to a wide range of extracellular tonicities. Indeed, the present results demonstrate a close relation between the abundance of bgt1, smit, ar, and osp94 mRNAs and intracellular ionic strength. Prolonged exposure to either hypo- or hypertonic medium is associated with the appropriate combination of intracellular ionic strength and abundance of the respective mRNAs. These findings thus support the notion that intracellular ionic strength is a major determinant of the transcriptional regulation of these genes. In contrast, when PCD cells, preconditioned in hypotonic medium, are re-exposed to isotonic medium the intracellular ionic strength is similar to that of isotonic controls, whilst the abundance of bgt1, smit, ar and osp94 mRNAs, however, is clearly higher (Fig. 4). This observation demonstrates that there is no strict relation between intracellular ionic strength and the abundance of bgt1, smit, ar and osp94 mRNAs. Additional influences may modulate this relation. It is conceivable that changes in cell volume contribute. Cells initially kept in isotonic medium will shrink when challenged with hypertonic medium as will cells preconditioned in hypotonic medium and then exposed to isotonic medium (Hebert & Sun, 1988; Sun & Hebert, 1989).
As noted above, changes in osp94 mRNA abundance paralleled those in bgt1, smit and ar mRNA abundance, suggesting similar regulatory mechanisms. OSP94 belongs to the HSP110 family and is induced by hyperthermia, hypertonic stress and ischaemia (Santos et al. 1998; Yagita et al. 2001). Since OSP94 is structurally related to other chaperones (Kojima et al. 1996), it is conceivable that PCD cells require increased chaperoning activity following exposure to hypertonic stress. In support of this notion, the major stress-inducible hsp70 mRNA is strongly increased in PCD cells exposed to hypertonic medium for 12 h (Fig. 4). In contrast to osp94, hsp70 mRNA was not downregulated but was in fact induced by hypotonicity suggesting that hypotonic stress exerts harmful effects on medullary cells that require enhanced expression of cytoprotective genes. Since hypotonicity activates the p38 mitogen-activated protein (MAP) kinase signalling cascade (Tilly et al. 1996) and this pathway is essential for induction of HSP70 by hypertonic stress (Neuhofer et al. 1999), it is likely that p38 MAP kinase also participates in its induction by hypotonicity. In addition, heat shock factor-1 (HSF1) DNA-binding activity was previously demonstrated to increase during hyper- and hypotonic perturbation of HeLa cells (Caruccio et al. 1997) suggesting that HSF1 is one of the upstream effectors of HSP70 induction by hyper- or hypotonicity. Apart from HSF1, TonEBP may participate in upregulating hsp70 transcription in response to hypertonic stress, since four putative TonEs have been detected in the 5′-flanking region of hsp70-2 (Woo et al. 2001).
In contrast to bgt1, smit, ar and osp94 mRNAs, inos mRNA abundance tended to decrease after exposure to hypertonic medium and markedly rose in cells following exposure to hypotonic medium. The induction of transcription of osmolyte accumulating genes by hypertonicity requires the interaction of the TonEBP with specific cis-acting sequences located in the 5′-region of the respective genes (Miyakawa et al. 1999). Since inos mRNA abundance increases when the medium tonicity is lowered, it is conceivable that an as yet unidentified hypotonicity-activated factor drives expression of hypotonicity-responsive genes. Further studies are required to elucidate which other genes are induced by hyposmolality.
In conclusion, the present results support the view that intracellular ionic strength, although important for the induction of a variety of tonicity-responsive genes, is not the exclusive regulatory factor. In the case of iNOS, a different intracellular signalling pathway may be responsible for adjusting inos mRNA abundance in response to changes in extracellular tonicity.
Acknowledgments
This study was supported by a grant from the Deutsche Forschungsgemeinschaft (BE 963/10-1, NE 839/1-1). We are grateful to Dr H. M. Kwon for providing the smit and bgt1 cDNAs, to Drs S. R. Gullans and R. Kojima for providing the osp94 cDNA, to Dr R. Keinänen for providing the rat inos cDNA and to I. Öztürk and U. Fazekas for excellent technical assistance. We gratefully acknowledge the help of Dr R. Grünbein in the initial stages of this study.
References
- Beck F, Bauer R, Bauer U, Mason J, DÖRGE A, Rick R, Thurau K. Electron microprobe analysis of intracellular elements in the rat kidney. Kidney International. 1980;17:756–763. doi: 10.1038/ki.1980.88. [DOI] [PubMed] [Google Scholar]
- Beck F, DÖRGE A, Rick R, Thurau K. Intra- and extracellular element concentrations of rat renal papilla in antidiuresis. Kidney International. 1984;25:397–403. doi: 10.1038/ki.1984.30. [DOI] [PubMed] [Google Scholar]
- Beck F, DÖRGE A, Rick R, Thurau K. Osmoregulation of renal papillary cells. Pflügers Archiv. 1985;405(suppl.):S28–S32. doi: 10.1007/BF00581776. [DOI] [PubMed] [Google Scholar]
- Beck FX, Burger-Kentischer A, MÜLLER E. Cellular response to osmotic stress in the renal medulla. Pflügers Archiv. 1998;436:814–827. doi: 10.1007/s004240050710. [DOI] [PubMed] [Google Scholar]
- Beck FX, Schmolke M, Guder WG, DÖRGE A, Thurau K. Osmolytes in renal medulla during rapid changes in papillary tonicity. American Journal of Physiology. 1992;262:F849–856. doi: 10.1152/ajprenal.1992.262.5.F849. [DOI] [PubMed] [Google Scholar]
- Burg MB, Garcia-PereZ A. How tonicity regulates gene expression. Journal of the American Society of Nephrology. 1992;3:121–127. doi: 10.1681/ASN.V32121. [DOI] [PubMed] [Google Scholar]
- Burg MB, Kwon ED, KÜLTZ D. Regulation of gene expression by hypertonicity. Annual Review of Physiology. 1997;59:437–455. doi: 10.1146/annurev.physiol.59.1.437. [DOI] [PubMed] [Google Scholar]
- Burger-Kentischer A, MÜLLER E, MÄRZ J, Fraek ML, Thurau K, Beck FX. Hypertonicity-induced accumulation of organic osmolytes in papillary interstitial cells. Kidney International. 1999;55:1417–1425. doi: 10.1046/j.1523-1755.1999.00382.x. [DOI] [PubMed] [Google Scholar]
- Burger-Kentischer A, MÜLLER E, Neuhofer W, MÄRZ J, Thurau K, Beck FX. Expression of aldose reductase, sorbitol dehydrogenase and Na+/myo-inositol and Na+/Cl−/betaine transporter mRNAs in individual cells of the kidney during changes in the diuretic state. Pflügers Archiv. 1999;437:248–254. doi: 10.1007/s004240050776. [DOI] [PubMed] [Google Scholar]
- Caruccio L, Bae S, Liu AYC, Chen KY. The heat-shock transcription factor HSF1 is rapidly activated by either hyper- or hypo-osmotic stress in mammalian cells. Biochemical Journal. 1997;327:341–347. doi: 10.1042/bj3270341. [DOI] [PMC free article] [PubMed] [Google Scholar]
- Gilles R. 'Compensatory’ organic osmolytes in high osmolarity and dehydration stresses: history and perspectives. Comparative Biochemistry and Physiology. 1997;A 117:279–290. doi: 10.1016/s0300-9629(96)00265-4. [DOI] [PubMed] [Google Scholar]
- Hebert SC, Sun A. Hypotonic cell volume regulation in mouse medullary thick ascending limb: effects of ADH. American Journal of Physiology. 1988;255:F962–969. doi: 10.1152/ajprenal.1988.255.5.F962. [DOI] [PubMed] [Google Scholar]
- Keinanen R, Vartiainen N, Koistinaho J. Molecular cloning and characterization of the rat inducible nitric oxide synthase (iNOS) gene. Gene. 1999;234:297–305. doi: 10.1016/s0378-1119(99)00196-1. [DOI] [PubMed] [Google Scholar]
- Kojima R, Randall J, Brenner BM, Gullans SR. Osmotic stress protein 94 (Osp94). A new member of the HSP110/SSE gene subfamily. Journal of Biological Chemistry. 1996;271:12327–12332. doi: 10.1074/jbc.271.21.12327. [DOI] [PubMed] [Google Scholar]
- Konieczkowski M, Dunn MJ. Sodium transport in rat renal papillary collecting tubule cells in culture. Journal of Cellular Physiology. 1988;135:235–243. doi: 10.1002/jcp.1041350210. [DOI] [PubMed] [Google Scholar]
- Kwon HM, Yamauchi A, Uchida S, Preston AS, Garcia-PereZ A, Burg MB, Handler JS. Cloning of the cDNA for a Na+/myo-inositol cotransporter, a hypertonicity stress protein. Journal of Biological Chemistry. 1992;267:6297–6301. [PubMed] [Google Scholar]
- Law RO, Burg MB. The role of organic osmolytes in the regulation of mammalian cell volume. Volume and Osmolality Control in Animal Cells. Advances in Comparative and Environmental Physiology. 1991;9:189–225. [Google Scholar]
- Miyakawa H, Woo SK, Dahl SC, Handler JS, Kwon HM. Tonicity-responsive enhancer binding protein, a Rel-like protein that stimulates transcription in response to hypertonicity. Proceedings of the National Academy of Sciences of the USA. 1999;96:2538–2542. doi: 10.1073/pnas.96.5.2538. [DOI] [PMC free article] [PubMed] [Google Scholar]
- Motais R, Guizouarn H, Garcia-Romeu F. Red cell volume regulation: the pivotal role of ionic strength in controlling swelling-dependent transport systems. Biochimica et Biophysica Acta. 1991;1075:169–180. doi: 10.1016/0304-4165(91)90248-f. [DOI] [PubMed] [Google Scholar]
- Neuhofer W, Lugmayr K, Fraek ML, Beck FX. Regulated overexpression of heat shock protein 72 protects Madin-Darby canine kidney cells from the detrimental effects of high urea concentrations. Journal of the American Society of Nephrology. 2001;12:2565–2571. doi: 10.1681/ASN.V12122565. [DOI] [PubMed] [Google Scholar]
- Neuhofer W, MÜLLER E, Burger-Kentischer A, Fraek ML, Thurau K, Beck FX. Inhibition of NaCl-induced heat shock protein 72 expression renders MDCK cells susceptible to high urea concentrations. Pflügers Archiv. 1999;437:611–616. doi: 10.1007/s004240050824. [DOI] [PubMed] [Google Scholar]
- Sachs L. Angewandte Statistik: Anwendung Statistischer Methoden. Berlin, Heidelberg, New York: Springer; 1984. [Google Scholar]
- Santos BC, Chevaile A, Kojima R, Gullans SR. Characterization of the Hsp110/SSE gene family response to hyperosmolality and other stresses. American Journal of Physiology. 1998;274:F1054–1061. doi: 10.1152/ajprenal.1998.274.6.F1054. [DOI] [PubMed] [Google Scholar]
- Sone M, Albrecht GJ, DÖRGE A, Thurau K, Beck FX. Osmotic adaptation of renal medullary cells during transition from chronic diuresis to antidiuresis. American Journal of Physiology. 1993;264:F722–729. doi: 10.1152/ajprenal.1993.264.4.F722. [DOI] [PubMed] [Google Scholar]
- Stokes JB, Grupp C, Kinne KH. Purification of rat papillary collecting duct cells: functional and metabolic assessment. American Journal of Physiology. 1987;253:F251–262. doi: 10.1152/ajprenal.1987.253.2.F251. [DOI] [PubMed] [Google Scholar]
- Sun A, Hebert SC. Rapid hypertonic cell volume regulation in the perfused inner medullary collecting duct. Kidney International. 1989;36:831–842. doi: 10.1038/ki.1989.269. [DOI] [PubMed] [Google Scholar]
- Tilly BC, Gaestel M, Engel K, Edixhoven MJ, De Jonge HR. Hypo-osmotic cell swelling activates p38 MAP kinase signalling cascade. FEBS Letters. 1996;395:133–136. doi: 10.1016/0014-5793(96)01028-9. [DOI] [PubMed] [Google Scholar]
- Tisher CC, Madsen KM. Anatomy of the kidney. In: Brenner BM, editor. The Kidney. Philadelphia: W. B. Saunders; 2000. pp. 3–67. [Google Scholar]
- Woo SK, Handler JS, Kwon HM. Nuclear redistribution of tonicity-responsive enhancer binding protein requires proteasome activity. American Journal of Physiology – Cell Physiology. 2000;278:C323–330. doi: 10.1152/ajpcell.2000.278.2.C323. [DOI] [PubMed] [Google Scholar]
- Woo SK, Handler JS, Kwon HM. TonEBP (tonicity-responsive enhancer binding protein) stimulates transcription of a HSP70 (heat shock protein 70) gene. FASEB Journal. 2001;15:A851. [Google Scholar]
- Wu B, Hunt C, Morimoto R. Structure and expression of the human gene encoding major heat shock protein HSP70. Molecular and Cellular Biology. 1985;5:330–341. doi: 10.1128/mcb.5.2.330. [DOI] [PMC free article] [PubMed] [Google Scholar]
- Yagita Y, Kitagawa K, Ohtsuki T, Tanaka S, Hori M, Matsumoto M. Induction of the HSP110/105 family in the rat hippocampus in cerebral ischemia and ischemic tolerance. Journal of Cerebral Blood Flow and Metabolism. 2001;21:811–819. doi: 10.1097/00004647-200107000-00006. [DOI] [PubMed] [Google Scholar]
- Yamauchi A, Uchida S, Kwon HM, Preston AS, Robey RB, Garcia-PereZ A, Burg MB, Handler JS. Cloning of a Na+- and Cl−-dependent betaine transporter that is regulated by hypertonicity. Journal of Biological Chemistry. 1992;267:649–652. [PubMed] [Google Scholar]