

Abstract
Interleukin-6 (IL-6) was infused intravenously for 2.5 h in seven healthy human volunteers at a dose giving rise to a circulating IL-6 concentration of ≈35 ng l−1. The metabolic effects of this infusion were studied in subcutaneous adipose tissue on the anterior abdominal wall and in the splanchnic tissues by the Fick principle after catheterizations of an artery, a subcutaneous vein draining adipose tissue, and a hepatic vein, and measurements of regional adipose tissue and splanchnic blood flows. In control studies without IL-6 infusion subcutaneous adipose tissue metabolism was studied by the same technique in eight healthy subjects. The net release of glycerol and fatty acids from the subcutaneous abdominal adipose tissue remained constant in the control experiment. IL-6 infusion gave rise to increase in net glycerol release in subcutaneous adipose tissue while the net release of fatty acids did not change significantly. In the splanchnic region IL-6 elicited a pronounced vasodilatation, and the uptake of fatty acids and the gluconeogenic precursors glycerol and lactate increased significantly. The splanchnic net output of glucose and triacylglycerol did not change during the IL-6 infusion. It is concluded that IL-6 elicits lipolytic effects in human adipose tissue in vivo, and that IL-6 also has effects on the splanchnic lipid and carbohydrate metabolism.
Several in vivo studies have revealed that interleukin-6 (IL-6) is secreted from subcutaneous adipose tissue (Mohamed-Ali et al. 1997, 1999; Orban et al. 1999) and we have recently shown that the subcutaneous adipose tissue IL-6 secretion increases ≈10-fold in the post-exercise rest period after 1 h bicycle exercise of moderate intensity (Lyngsø et al. 2002). Concomitantly there is an increased output of glycerol and non-esterified fatty acids (NEFA) from the adipose tissue and adipose tissue blood flow increases (Mulla et al. 2000).
Whether the increased adipose tissue IL-6 production induces or modifies the post-exercise lipolysis is unknown. It has been shown that IL-6 has lipolytic effects in adipocytes in vitro (Mattacks & Pond, 1999), and in vivo experiments with IL-6 infusion in cancer patients (Stouthard et al. 1995) have indirectly shown a lipolytic effect of IL-6. Similar results were found in animal studies (Nonogaki et al. 1995). Other in vitro and animal studies have shown that IL-6 reduces the expression and activity of lipoprotein lipase (LPL) in adipocytes and decreases its production (Greenberg et al. 1992).
The aim of the present study was to examine whether IL-6 in concentrations comparable to the concentration found in the post-exercise recovery period in subcutaneous, abdominal adipose tissue has metabolic effects in this adipose tissue depot as well as in the splanchnic tissues. This was examined by infusion of IL-6 intravenously in healthy subjects at a rate whereby we reached the same concentration as seen 3 h post-exercise in venous blood draining abdominal subcutaneous adipose tissue. Control studies were made studying the effect of fasting alone on the metabolism and IL-6 secretion in subcutaneous adipose tissue.
Methods
Subjects
Seven young, healthy volunteers (5 men, 2 women) participated in the IL-6 infusion study (age, 24.3 ± 0.3 years; height, 179 ± 2 cm; weight, 74.0 ± 2.9 kg; total fat mass 12.6 ± 1.6 kg; means ± s.e.m.). Eight healthy subjects (6 men, 2 women), of whom 2 women and 3 men also participated in the infusion study, participated in the control study (age, 24.1 ± 0.3 years; height, 179 ± 2 cm; weight, 73.2 ± 2.7 kg; total fat mass 13.8 ± 1.6 kg). The fat mass was determined by DEXA scanning (Lunar DPX-IQ, Lunar Cooperation, WI, USA).
The subjects were given a written and oral description of the study according to the Declaration of Helsinki, and their written consent was obtained. The study was approved by The Ethical Committee for Medical Research of Copenhagen (project no. 12-060/01).
Experimental protocols
In the days prior to the experiment the subjects ate their usual diet and performed their usual physical activities. However, 24 h prior to the experiment they refrained from vigorous activity. The subjects came to the laboratory at 08.00 h after an overnight fast from 20.00 h.
IL-6 infusion study
The effects of IL-6 in adipose tissue and the splanchnic tissues were studied in these experiments and the subjects were catheterized as described below. An experiment consisted of a baseline period and an infusion period. The baseline period was of 30 min duration. Then the IL-6 infusion was begun, and it was continued for 2.5 h. IL-6 (Sandoz Pharma AG, Basel Switzerland) was dissolved in isotonic saline with 2 % human albumin added. An IL-6 infusion rate of 1.875 μg h−1 (corresponding to 10 ml h−1) was chosen since in pilot studies we found that this infusion rate gives rise to a systemic IL-6 concentration of ≈30 ng l−1. In the baseline period three blood samples were drawn at 15 min intervals, and in the infusion period samples were drawn every 30 min for 2.5 h.
Control study
In these experiments only the abdominal, subcutaneous adipose tissue was studied. The subjects were examined for 3.5 h without any infusion. Blood samples were drawn every 30 min.
Catheterizations
In each subject a catheter (Artflon, Ohmeda, Swindon, UK) was inserted into the radial artery after injection of 0.5 ml of 1 % lidocaine (lignocaine). The catheter was kept patent by flushing it regularly with isotonic sodium chloride. Catheterization of a subcutaneous, abdominal vein on the anterior abdominal wall was performed as described previously (Simonsen et al. 1994), using ultrasound/colour-Doppler guidance. This technique enables catheterization of a vein deep in the subcutaneous adipose tissue that mainly drains adipose tissue. A 22 G 10 cm long polyurethane catheter (Ohmeda) was inserted using the Seldinger technique. The catheter was kept patent throughout the experiment by continuous infusion of isotonic sodium chloride at a rate of 40 ml h−1. In the IL-6 infusion experiment the right femoral vein was catheterized during local analgesia (1 % lidocaine, 5–10 ml) and a polyethylene catheter (outer diameter, 2.0 mm) was advanced to a right-sided hepatic vein under fluoroscopic control. The catheter was left in situ with the tip positioned 3–4 cm from wedge position throughout the experiment. The catheter was kept patent throughout the experiment by infusion of isotonic sodium chloride at a rate of 40 ml h−1.
Blood flow measurements
Subcutaneous adipose tissue blood flow was measured using the 133Xe-washout technique as previously described (Bülow, 2001). About 1 MBq of 133Xe dissolved in 0.1 ml isotonic sodium chloride was injected into the subcutaneous abdominal adipose tissue contralateral to the catheter. The washout of 133Xe was measured using the Mediscint system (Oakfield Instruments, Oxford, UK). Adipose tissue blood flow was calculated from the washout constant determined in the particular experimental period. A tissue/blood partition coefficient value of 8 ml ml−1 was used (Bülow et al. 1987).
Splanchnic plasma flow (SPF) was measured by a primed/continuous infusion (1 mg/170 μg min−1) of Indocyanine Green (ICG) (Henriksen & Winkler, 1987). After 45–60 min of ICG infusion a steady arterial ICG concentration is normally achieved, and the baseline period was then begun. During the baseline period three blood samples were taken every 15 min. For the rest of the experiment samples were drawn every 30 min. At each time point three samples from the artery and the hepatic vein were drawn within 10 min for determination of ICG concentration and the average splanchnic blood flow was calculated. In case of a non-steady state in arterial ICG concentration a correction was made:
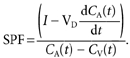 |
I is the infusion rate of ICG, CA and CV are the arterial and venous concentrations of ICG, respectively, t is the time and VD is the volume of distribution, i.e. the plasma volume which is estimated to 5 % of the total body weight (Skak & Keiding, 1987).
Whole-body measurements
Whole-body oxygen uptake, carbon dioxide output and respiratory exchange ratio (RER) were measured using an open circuit ventilated hood system (Oxycon, Jaeger, Wuerzburg, Germany). Heart rate was measured continuously during the experiment via an Athena (S&W, Copenhagen, Denmark).
Blood sampling
Blood samples were preferentially drawn simultaneously from all three catheters. Blood was collected for analysis of IL-6, NEFA, triacylglycerol (TAG), hydroxybutyrate (3-OHB), glycerol, glucose and lactate concentrations and additionally arterial and hepatic vein blood was drawn anaerobically for determination of O2 concentration. The blood was collected in vials at 4 °C, and whole blood was immediately deproteinized or the blood was collected in 4 °C EDTA tubes and plasma was separated by centrifugation at 4 °C. The samples were stored at −20 °C until analysis.
Blood analysis
Glycerol, glucose, lactate and 3-OHB were measured in neutralized, deproteinized extracts of whole blood and NEFA and TAG were measured in plasma as previously described (Bülow et al. 1999). IL-6 was measured in plasma by enzyme immunoassay (Quantikine, R&D systems, Minneapolis, USA). The assay has a limit of detection of 0.7 ng l−1. Oxygen concentration was determined spectrophotometrically using an OSM 3 (Radiometer, Copenhagen, Denmark).
Calculations
Net fluxes of the metabolites across the subcutaneous adipose tissue and the splanchnic region were calculated by multiplication of the a-v concentration difference of the particular metabolite by the appropriate flow value (whole blood or plasma flow). Whole-body lipid and carbohydrate oxidation rates were calculated from the whole-body oxygen uptake and respiratory exchange ratio (RER) values. The equations given by Frayn (1983) were used assuming a constant nitrogen excretion rate of 85 μg kg−1 min−1 as we have determined it previously (Simonsen et al. 1993).
Statistics
All data are given as means ± s.e.m. The baseline values are given as the average of three measurements. The data were analysed by ANOVA (Minitab version 10.0, Minitab Inc, PA, USA). Post hoc testing was performed using Tukey's method. Differences between the control study and the infusion study were analysed using Student's t test. P < 0.05 was considered significant.
Results
Whole-body oxygen uptake, RER, energy expenditure, heart rate, and lipid and carbohydrate oxidation rates are given in Table 1. In the baseline period these parameters were not significantly different between the two studies. During infusion of IL-6 the heart rate, oxygen uptake and energy expenditure increased significantly and the respiratory quotient decreased significantly. The calculated lipid oxidation rate increased significantly while the carbohydrate oxidation rate decreased significantly. In the control study all parameters remained constant.
Table 1.
Whole-body oxygen uptake, RER, heart rate, energy expenditure and lipid and carbohydrate oxidation rates
| Experiment | Baseline | 0.5h | 1 h | 1.5 h | 2 h | 2.5 h | |
|---|---|---|---|---|---|---|---|
| Oxygen uptake (ml min−1) | IL-6 infusion | 241 ± 11 | 241 ± 13 | 247 ± 12 | 253 ± 13 | 255 ± 12* | 266 ± 19* |
| Control | 243 ± 8 | 247 ± 10 | 248 ± 7 | 241 ± 5 | 240 ± 4 | 237 ± 5 | |
| Respiratory exchange ratio | IL-6 infusion | 0.85 ± 0.03 | 0.84 ± 0.02 | 0.84 ± 0.02 | 0.83 ± 0.01 | 0.80 ± 0.02* | 0.81 ± 0.02* |
| Control | 0.81 ± 0.01 | 0.82 ± 0.01 | 0.82 ± 0.01 | 0.82 ± 0.01 | 0.82 ± 0.01 | 0.81 ± 0.01 | |
| Heart rate (min−1) | IL-6 infusion | 51.5 ± 2.4 | 52.4 ± 2.1 | 54.6 ± 2.4* | 57.3 ± 2.3* | 58.1 ± 2.2* | 59.7 ± 2.2* |
| Control | 55.0 ± 2.7 | 55.5 ± 2.8 | 56.6 ± 2.6 | 57.2 ± 2.7 | 56.8 ± 2.9 | 56.7 ± 3.3 | |
| Energy expenditure (kl min−1) | IL-6 infusion | 4.88 ± 0.22 | 4.88 ± 0.27 | 5.02 ± 0.25 | 5.11 ± 0.27 | 5.11 ± 0.24 | 5.33 ± 0.38* |
| Control | 4.87 ± 0.05 | 4.97 ± 0.07 | 4.98 ± 0.05 | 4.84 ± 0.04 | 4.83 ± 0.03 | 4.76 ± 0.04 | |
| Lipid oxidation rate (g min−1) | IL-6 infusion | 0.05 ± 0.01 | 0.05 ± 0.01 | 0.05 ± 0.01 | 0.06 ± 0.01* | 0.07 ± 0.01* | 0.07 ± 0.01* |
| Control | 0.06 ± 0.01 | 0.07 ± 0.01 | 0.06 ± 0.01 | 0.06 ± 0.01 | 0.06 ± 0.01 | 0.06 ± 0.01 | |
| CHO oxidation rate (g min−1) | IL-6 infusion | 0.14 ± 0.03 | 0.13 ± 0.02 | 0.14 ± 0.02 | 0.13 ± 0.01 | 0.09 ± 0.03* | 0.10 ± 0.02* |
| Control | 0.10 ± 0.01 | 0.10 ± 0.01 | 0.11 ± 0.01 | 0.10 ± 0.01 | 0.10 ± 0.01 | 0.09 ± 0.01 |
CHO, carbohydrate.
Significantly different from baseline value (P < 0.05).
Arterial metabolite concentrations are given in Table 2. No significant differences between the two studies could be demonstrated in the baseline period. In the control study the TAG concentration decreased with time. Infusion of IL-6 increased the arterial IL-6 concentration to a level of ≈35 ng l−1 (Fig. 1). The infusion gave rise to significant increases in the NEFA and 3-OHB concentrations, while glucose and lactate concentrations decreased. The arterial concentrations of glycerol, TAG and oxygen remained constant during the experiments.
Table 2.
Arterial concentrations of various metabolites
| Experiment | Baseline | 0.5 h | 1 h | 1.5 h | 2h | 2.5 h | |
|---|---|---|---|---|---|---|---|
| [Glycerol] (μmol l−1) | IL-6 infusion | 44 ± 8 | 39 ± 2 | 42 ± 4 | 38 ± 3 | 37 ± 6 | 50 ± 7 |
| Control | 55 ± 8 | 47 ± 6 | 45 ± 6 | 54 ± 12 | 47 ± 6 | 49 ± 9 | |
| [NEFA] (μmol l−1) | IL-6 infusion | 420 ± 84 | 413 ± 46 | 406 ± 37 | 466 ± 27 | 500 ± 61* | 628 ± 80* |
| Control | 496 ± 73 | 445 ± 84 | 459 ± 67 | 522 ± 94 | 466 ± 72 | 465 ± 82 | |
| [TAG] (μmol l−1) | IL-6 infusion | 1282 ± 319 | 1193 ± 308 | 1195 ± 311 | 1171 ± 305 | 1172 ± 297 | 1189 ± 308 |
| Controly | 896 ± 82 | 841 ± 89 | 856 ± 85 | 876 ± 104 | 814 ± 65 | 835 ± 83 | |
| [Glucose] (mmol l−1) | IL-6 infusion | 5.2 ± 0.2 | 5.2 ± 0.1 | 5.2 ± 0.2 | 4.9 ± 0.1* | 5.1 ± 0.2 | 4.9 ± 0.2* |
| Control | 5.3 ± 0.1 | 5.2 ± 0.2 | 5.3 ± 0.1 | 5.2 ± 0.1 | 5.1 ± 0.2 | 5.1 ± 0.2 | |
| [Lactate] (mmol l−1) | IL-6 infusion | 0.7 ± 0.1 | 0.6 ± 0.1 | 0.6 ± 0.1 | 0.5 ± 0.1* | 0.5 ± 0.1* | 0.5 ± 0.1* |
| Control | 0.5 ± 0.0 | 0.5 ± 0.0 | 0.5 ± 0.0 | 0.5 ± 0.0 | 0.5 ± 0.0 | 0.5 ± 0.0 | |
| [3-OHB](μmol l−1) | IL-6 infusion | 56 ± 21 | 56 ± 24 | 63 ± 31 | 76 ± 37 | 85 ± 41 | 107 ± 44* |
| Control | 85 ± 23 | 71 ± 16 | 114 ± 49 | 108 ± 34 | 104 ± 41 | 118 ± 49 |
Significantly different from baseline value (P < 0.05).
Figure 1.
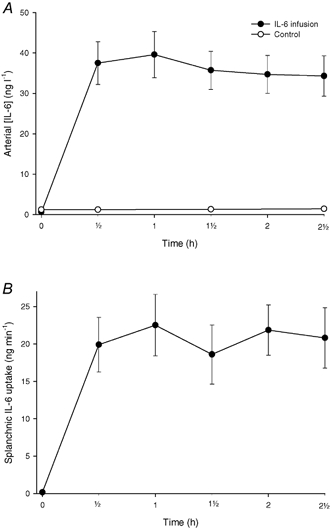
A, arterial concentration of IL-6 in the control (○) and the IL-6 infusion (•) experiments. B, splanchnic uptake of IL-6 in the IL-6 infusion experiment. Values are given as means ± s.e.m.
Subcutaneous abdominal adipose tissue
Figure 2 shows the blood flow in the subcutaneous abdominal adipose tissue. The blood flow in the control study was lower than in the IL-6 infusion study (P < 0.04). In the infusion study there was a trend towards an increase in the subcutaneous abdominal adipose tissue blood flow (P = 0.14).
Figure 2.
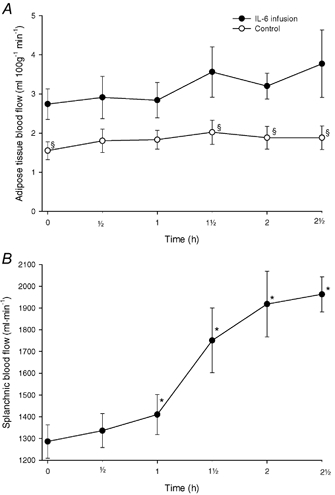
A, subcutaneous, abdominal adipose tissue blood flow in the control (○) and the IL-6 infusion (•) experiments. B, splanchnic blood flow in the IL-6 infusion experiments. Values are given as means ± s.e.m. *P < 0.05 from baseline. §P < 0.05 between control and infusion experiments.
Figure 3 shows the net glycerol and NEFA outputs from subcutaneous adipose tissue. In the control study these parameters remained constant. In the infusion study the glycerol output increased significantly, while there was a trend towards an increase in the NEFA output (P = 0.09). The veno-arterial concentration differences and the net fluxes of IL-6 and the measured metabolites are shown in Table 3. The net IL-6 output increased significantly in the control experiments while it was not possible to show a net IL-6 balance significantly different from zero during the infusion experiments (see Discussion). It was not possible to show significant changes in the net fluxes of glucose, lactate, TAG and 3-OHB in either of the experiments.
Figure 3.
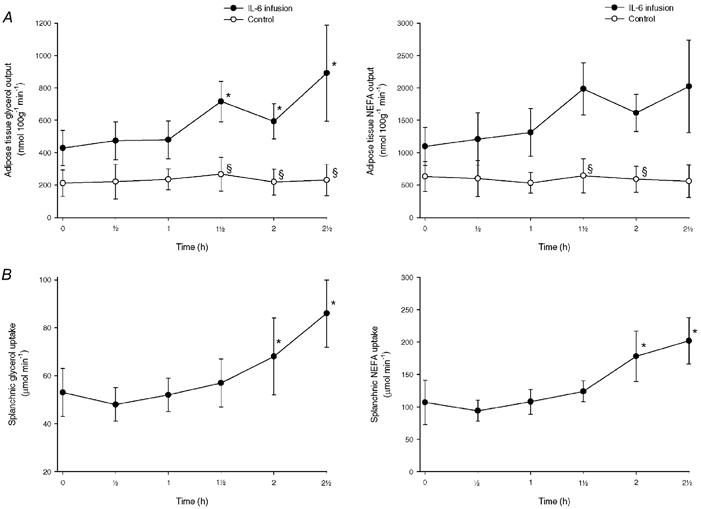
A, net release of glycerol and NEFA from subcutaneous, abdominal adipose tissue in the control (○) and the IL-6 infusion (•) experiments. B, net uptake of glycerol and NEFA in the splanchnic tissues in the IL-6 infusion experiments. Values are given as means ± s.e.m. *P < 0.05 from baseline. §P < 0.05 between control and infusion experiments.
Table 3.
Metabolite veno-arterial concentration differences and fluxes across abdominal, subcutaneous adipose tissue
| Experiment | Baseline | 0.5h | 1 h | 1.5 h | 2 h | 2.5 h | |
|---|---|---|---|---|---|---|---|
| v-a [IL-6] (ng l−1) | IL-6 infusion | 10.5 ± 5.9 | 9.7 ± 9.8 | 17.9 ± 14.3 | 19.7 ± 18.2 | 37.6 ± 25.4 | 35.5 ± 29.9 |
| Control | 0.8 ± 0.2 | 2.4 ± 0.5 | 4.7 ± 1.8* | 2.9 ± 0.5* | 3.4 ± 1.0* | 3.8 ± 1.7* | |
| IL-6 output (pg(100 g)−1 min−1) | IL-6 infusion | 17.2 ± 11.2 | 11.6 ± 15.9 | 25.1 ± 23.1 | 42.2 ± 43.7 | 75.7 ± 54.5 | 59.4 ± 53.6 |
| Control | 0.7 ± 0.2 | 2.8 ± 0.6 | 4.9 ± 2.0* | 3.5 ± 0.8* | 4.7 ± 1.1* | 4.8 ± 1.5* | |
| v-a [glycerol] (μmol l−1) | IL-6 infusion | 153 ± 24 | 156 ± 13 | 163 ± 19 | 196 ± 25 | 167 ± 21 | 203 ± 22 |
| Control | 121 ± 35 | 95 ± 28 | 125 ± 26 | 112 ± 28 | 107 ± 34 | 112 ± 39 | |
| v-a [NEFA] (μmol l−1) | IL-6 infusion | 684 ± 129 | 665 ± 131 | 748 ± 131 | 896 ± 108 | 790 ± 114 | 833 ± 126 |
| Control | 569 ± 118 | 448 ± 124 | 471 ± 102 | 458 ± 113 | 473 ± 140 | 445 ± 155 | |
| v-a [TAG](μmol l−1) | IL-6 infusion | -155 ± 97 | -81 ± 28 | -84 ± 34 | -78 ± 41 | -79 ± 38 | -25 ± 49 |
| Control | -25 ± 19 | -12 ± 14 | -20 ± 26 | -80 ± 52 | 3 ± 31 | -21 ± 22 | |
| TAG uptake (nmol (100 g)−1 min−1) | IL-6 infusion | 135 ± 47 | 150 ± 55 | 141 ± 59 | 210 ± 108 | 168 ± 81 | 26 ± 95 |
| Control | 18 ± 16 | 14 ± 10 | 16 ± 26 | 94 ± 69 | -1 ± 30 | 29 ± 29 | |
| v-a [glucose](mmol l−1) | IL-6 infusion | -0.4 ± 0.1 | -0.5 ± 0.1 | -0.6 ± 0.1 | -0.4 ± 0.1 | -0.6 ± 0.2 | -0.3 ± 0.1 |
| Control | -0.2 ± 0.0 | -0.2 ± 0.1 | -0.2 ± 0.2 | -0.2 ± 0.1 | -0.2 ± 0.1 | -0.2 ± 0.2 | |
| Glucose uptake (μmol (100 g)−1 min−1) | IL-6 infusion | 1.1 ± 0.3 | 1.3 ± 0.3 | 1.2 ± 0.3 | 1.5 ±0.5 | 2.1 ±0.9 | 1.1 ± 0.2 |
| Control | 0.3 ± 0.0 | 0.3 ± 0.2 | 0.2 ± 0.3 | 0.3 ± 0.2 | 0.6 ± 0.2 | 0.1 ± 0.5 | |
| v-a [lactate] (mmol l−1) | IL-6 infusion | 0.1 ± 0.0 | 0.1 ± 0.0 | 0.1 ± 0.0 | 0.0 ± 0.0 | 0.1 ± 0.0 | 0.0 ± 0.0 |
| Control | 0.1 ± 0.0 | 0.1 ± 0.0 | 0.1 ± 0.0 | 0.1 ± 0.0 | 0.1 ± 0.0 | 0.1 ± 0.0 | |
| Lactate output (μmol (100 g)−1 min−1) | IL-6 infusion | 0.1 ± 0.1 | 0.2 ± 0.1 | 0.2 ± 0.1 | 0.1 ± 0.1 | 0.2 ± 0.0 | 0.2 ± 0.0 |
| Control | 0.2 ± 0.0 | 0.2 ± 0.0 | 0.1 ± 0.0 | 0.2 ± 0.1 | 0.2 ± 0.1 | 0.2 ± 0.1 | |
| v-a [3-OHB] (μmol l−1) | IL-6 infusion | -17 ± 6 | -26 ± 9 | -5 ± 4 | -8 ± 4 | -6 ± 4 | -9 ± 3 |
| Control | -13 ± 3 | -3 ± 3 | -4 ± 3 | -9 ± 8 | -3 ± 3 | -4 ± 5 | |
| 3-OHB uptake (nmol (100 g)−1 min−1) | IL-6 infusion | 48 ± 16 | 37 ± 20 | 12 ± 9 | 21 ± 14 | 17 ± 15 | 38 ± 15 |
| Control | 21 ± 6 | -1 ± 8 | 8 ± 8 | 12 ± 11 | 10 ± 6 | 4 ± 10 |
Significantly different from baseline value (P < 0.05).
Splanchnic tissues
Figure 1 shows the splanchnic IL-6 uptake. It increased immediately after the beginning of the infusion and reached a steady-state value of 20 ng min−1, corresponding to 65 % of the infusion rate.
Figure 2 shows the blood flow in the splanchnic region in the infusion study. The blood flow began to increase after 60 min of infusion of IL-6 to reach a plateau after 120 min of infusion.
Figure 3 shows the net glycerol and NEFA uptakes. There was a significant increase in splanchnic glycerol and NEFA uptake beginning after 2 h of infusion of IL-6. Figure 4 shows the net glucose output and the net uptake of oxygen and lactate. The splanchnic glucose output did not change, while there was a trend to increase in the oxygen uptake during the last hour of the study. The lactate uptake increased significantly. The arterio-venous concentration differences and the net fluxes of the metabolites are shown in Table 4. There was a tendency towards an increase in the net 3-OHB output (P = 0.31), while the TAG output remained unchanged during the experiment.
Figure 4.
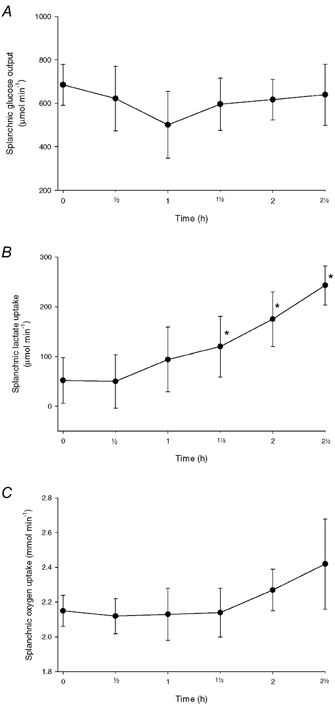
A, splanchnic net glucose release in the IL-6 infusion experiments. B, splanchnic lactate uptake in the IL-6 infusion experiments. C, splanchnic oxygen uptake in the IL-6 infusion experiments. Values are given as means ± s.e.m. *P < 0.05 from baseline.
Table 4.
Metabolite arterio-venous concentration differences and fluxes across the splanchnic tissues during infusion of IL-6
| Baseline | 0.5 h | 1 h | 1.5 h | 2 h | 2.5 h | |
|---|---|---|---|---|---|---|
| a-v [IL-6] (ng l−1) | 0.2 ± 10.2 | 25.8 ± 4.4* | 27.1 ± 4.3* | 18.0 ± 3.6* | 19.2 ± 2.4* | 17.8 ± 3.5* |
| a-v [glycerol] (μmol l−1) | 41 ± 8 | 35 ± 3 | 38 ± 5 | 32 ± 4 | 34 ± 5 | 43 ± 6 |
| a-v [NEFA] (μmol l−1) | 139 ± 42 | 118 ± 14 | 128 ± 20 | 118 ± 7 | 150 ± 19 | 171 ± 29 |
| a-v [TAG] (μmol l−1) | -57 ± 21 | -61 ± 33 | -53 ± 37 | -70 ± 39 | -53 ± 27 | -48 ± 42 |
| TAG output (μmol min−1) | 42 ± 16 | 45 ± 25 | 47 ± 31 | 65 ± 34 | 52 ± 22 | 49 ± 46 |
| a-v [glucose] (mmol l−1) | -0.54 ± 0.08 | -0.46 ± 0.11 | -0.34 ± 0.12 | -0.35 ± 0.06 | -0.34 ± 0.05 | -0.32 ± 0.07 |
| a-v [lactate] (mmol l−1) | 0.04 ± 0.04 | 0.04 ± 0.04 | 0.07 ± 0.05 | 0.07 ± 0.04 | 0.09 ± 0.03 | 0.12 ± 0.02 |
| a-v [3-OHB] (μmol l−1) | -30 ± 10 | -32 ± 19 | -30 ± 10 | -25 ± 8 | -27 ± 10 | -33 ± 7 |
| 3-OHB output (μmol min−1) | 39 ± 15 | 46 ± 29 | 43 ± 15 | 44 ± 15 | 53 ± 19 | 66 ± 15 |
Significantly different from baseline value (P < 0.05).
Discussion
The present experiments are, to our knowledge, the first showing that IL-6 elicits lipolysis in human adipose tissue in vivo. The arterial concentration reached during the IL-6 infusion is comparable to the level we have previously found in venous blood draining abdominal subcutaneous adipose tissue post-exercise (Lyngsø et al. 2002), and to arterial levels found after prolonged two-legged knee extensor exercise (Steensberg et al. 2001). At this concentration IL-6 also had significant metabolic and haemodynamic effects in the splanchnic tissues, and it increased the whole-body energy expenditure and whole-body lipid oxidation. Whether these local tissue and whole-body effects are elicited directly by IL-6 or indirectly via IL-6-induced changes in other substances affecting the lipid metabolism cannot be answered from the present experiments. Catecholamines may be possible mediators of the whole-body and adipose tissue effects. The whole-body effects of IL-6 on lipid metabolism have previously been studied in cancer patients, in which an infusion rate was applied giving rise to IL-6 concentrations 5- to 10-fold higher than those obtained in the present study (Stouthard et al. 1995). In this concentration range, corresponding to the concentrations of IL-6 seen in septic patients, IL-6 gives rise to increased secretion of stress hormones such as catecholamines, cortisol and glucagon, and these hormonal changes were suggested to explain the increase in the plasma NEFA concentration and the rate of appearance of NEFA (RaNEFA) found in that study.
However, in healthy women it has been shown, that subcutaneous injection of 3 μg (kg body weight)−1 of IL-6 did not change the circulating concentrations of adrenaline and noradrenaline significantly (Torpy et al. 2000). In other studies dose-dependent effects of IL-6 given subcutaneously has been examined (Tsigos et al. 1997a,b). In these studies it was demonstrated that circulating concentrations of IL-6 comparable to the level obtained in the present experiment occurred at a dose of 1 μg (kg body weight)−1. This dose did not affect the insulin, growth hormone and cortisol levels either. Thus, it seems unlikely that the effects on the local adipose tissue and global lipid metabolism can be explained by concentration changes of these hormones known to be key regulators of lipid metabolism. The most likely explanation of the findings in adipose tissue in the present experiments is that they are directly elicited via IL-6. This supports the hypothesis that IL-6 has autocrine/paracrine effects in adipose tissue (Mohamed-Ali et al. 1998). Interestingly, the 2-fold increase in lipolysis during IL-6 infusion is about the same as we have previously described in the abdominal subcutaneous adipose tissue post-exercise (Mulla et al. 2000). This suggests that IL-6 release from subcutaneous adipose tissue early post-exercise may be a contributing stimulator of the lipolytic response found in that period. It may be argued that the endothelial membrane may constitute a barrier for exchange of IL-6 between blood and adipose tissue implying that the interstitial concentration of IL-6 during the infusion is lower than the arterial concentration. However, this is not likely since administration of IL-6 subcutaneously gave rise to a rapid increase in the circulating IL-6 concentration which began ≈15 min after the injection (Tsigos et al. 1997a,b). Thus, even though it was impossible to demonstrate an uptake of IL-6 in adipose tissue with the time schedule for blood sampling, it seems likely that the interstitial IL-6 concentration increases rather rapidly to arterial levels. The metabolic clearance rate of IL-6 was ≈0.9 l min−1, and ≈65 % of the infused amount was taken up in the splanchnic region. This leaves 45 % to be taken up in the rest of the body of which adipose tissue seems a likely target.
While there were no significant differences at baseline between the two experimental groups in the whole-body parameters this was not the case for the arterial concentrations of lipid metabolites and the net release of glycerol and fatty acids from adipose tissue. The release of the metabolites was ≈2-fold higher in the IL-6 infusion group than in the control group. There is no obvious explanation for this difference, but a likely reason is that the experimental set-up with catheterizations of both adipose tissue and the liver may be more stressing to the experimental subjects than catheterization of adipose tissue alone giving rise to higher metabolic rates locally that are not detectable on the whole-body level. It may therefore be that the adipose tissue effects of IL-6 are underestimated to a certain extent in the present experiments.
To our knowledge it is also the first time that splanchnic haemodynamics and metabolism have been investigated in normal man during infusion of IL-6. IL-6 mediated a pronounced increase in splanchnic blood flow reaching values comparable to those found after a meal with high protein content. Most of the flow increase is probably taking place in the region drained by the portal vein, since it would be unlikely that the arterial blood flow to the liver should increase ≈3-fold during the IL-6 infusion. The splanchnic oxygen extraction decreased concomitantly with the flow increase implying that the splanchnic oxygen consumption showed only a trend to increase. The increased uptake of the gluconeogenic precursors glycerol and lactate, suggests that the rate of hepatic gluconeogenesis has been increased during the IL-6 infusion. The hypothesis has been proposed that the IL-6 released from adipose tissue could act as an endocrine substance (Coppack, 2001). The increased splanchnic uptake of lipid metabolites could support this hypothesis, but it could also be due to a passive process as a consequence of the pronounced increase in local blood flow. It has clearly been demonstrated that there is a positive correlation between NEFA supply to and uptake in the liver (Wahren et al. 1984). It has also been suggested that IL-6 may be a signalling substance from exercising skeletal muscles to the liver in order to increase the endogenous glucose production (Keller et al. 2001). Based on the present findings such a mechanism cannot be confirmed, since the infusion of IL-6 did not give rise to changes in the splanchnic glucose output. This is in accordance with Tsigos et al. (1997b), who in normal volunteers found that IL-6 concentrations in the circulation lower than 25 ng l−1 did not have any acute effects on the glucose metabolism. However, IL-6 concentrations higher than 100 ng l−1 gave rise to increases in glucagon, and growth hormone levels, that could affect the splanchnic glucose metabolism. In an infusion study on cancer patients (Stouthard et al. 1995), in which the IL-6 concentration was 5- to 10-fold higher than that in the present study, the endogenous glucose production was increased probably due to increased concentrations of adrenaline and glucagon. Another explanation for the absent effect on the splanchnic glucose output is that there may be different isoforms of IL-6, with different effects, and that the isoform produced in skeletal muscle is different from that infused in the present study. The different secretion patterns of IL-6 found in skeletal muscle (Pedersen et al. 2001) and adipose tissue (Lyngsø et al. 2002) in man during and after exercise may indicate such differences. A third, and very likely, explanation is that in spite of IL-6 increases the hepatic gluconeogenesis, this does not give rise to an immediate increase in the net splanchnic glucose output, since the need for endogenous glucose production decreases due to a decrease in the whole-body carbohydrate oxidation during the infusion of IL-6.
In conclusion, the present experiments show that IL-6 in the normal physiological concentration range increases lipolysis in abdominal, subcutaneous adipose tissue. Concomitantly it increases the splanchnic uptake of glycerol, lactate and NEFA, while it does not affect the net splanchnic glucose output.
Acknowledgments
This study was supported by grants from The Novo Nordic Foundation, The John and Birthe Meyer Foundation, and The Danish Heart Foundation (97-1-3-48-22465).
References
- BÜlow J. Measurement of adipose tissue blood flow. Methods in Molecular Biology. 2001;155:281–293. doi: 10.1385/1-59259-231-7:281. [DOI] [PubMed] [Google Scholar]
- BÜlow J, Jelnes R, Astrup A, Madsen J, Vilmann P. Tissue/blood partition coefficients for xenon in various adipose tissue depots in man. Scandinavian Journal of Clinical and Laboratory Investigation. 1987;47:1–3. doi: 10.1080/00365518709168861. [DOI] [PubMed] [Google Scholar]
- BÜlow J, Simonsen L, Wiggins D, Humphreys SM, Frayn KN, Powell D, Gibbons GF. Co-ordination of hepatic and adipose tissue lipid metabolism after oral glucose. Journal of Lipid Research. 1999;40:2034–2043. [PubMed] [Google Scholar]
- Coppack SW. Pro-inflammatory cytokines and adipose tissue. Proceedings of theNutritional Society. 2001;60:349–356. doi: 10.1079/pns2001110. [DOI] [PubMed] [Google Scholar]
- Frayn KN. Calculation of substrate oxidation rates in vivo from gaseous exchange. Journal of Applied Physiology. 1983;55:628–634. doi: 10.1152/jappl.1983.55.2.628. [DOI] [PubMed] [Google Scholar]
- Greenberg AS, Nordan RP, Mcintosh J, Calvo JC, Scow RO, Jablons D. Interleukin 6 reduces lipoprotein lipase activity in adipose tissue of mice in vivo and in 3T3-L1 adipocytes: a possible role for interleukin 6 in cancer cachexia. Cancer Research. 1992;52:4113–4116. [PubMed] [Google Scholar]
- Henriksen JH, Winkler K. Hepatic blood flow determination. A comparison of 99mTc-diethyl-IDA and indocyanine green as hepatic blood flow indicators in man. Journal of Hepatology. 1987;4:66–70. doi: 10.1016/s0168-8278(87)80011-9. [DOI] [PubMed] [Google Scholar]
- Keller C, Steensberg A, Pilegaard H, Osada T, Saltin B, Pedersen BK, Neufer PD. Transcriptional activation of the IL-6 gene in human contracting skeletal muscle: influence of muscle glycogen content. FASEB Journal. 2001;15:2748–2750. doi: 10.1096/fj.01-0507fje. [DOI] [PubMed] [Google Scholar]
- Lyngsø D, Simonsen L, BÜLOW J. Interleukin-6 production in human subcutaneous adipose abdominal tissue. The effect of exercise. Journal of Physiology. 2002;543:373–378. doi: 10.1113/jphysiol.2002.019380. [DOI] [PMC free article] [PubMed] [Google Scholar]
- Mattacks CA, Pond CM. Interactions of noradrenalin and tumour necrosis factor alpha, interleukin 4 and interleukin 6 in the control of lipolysis from adipocytes around lymph nodes. Cytokine. 1999;11:334–346. doi: 10.1006/cyto.1998.0442. [DOI] [PubMed] [Google Scholar]
- Mohamed-Ali V, Goodrick S, Bulmer K, Holly JM, Yudkin JS, Coppack SW. Production of soluble tumor necrosis factor receptors by human subcutaneous adipose tissue in vivo. American Journal of Physiology. 1999;277:E971–975. doi: 10.1152/ajpendo.1999.277.6.E971. [DOI] [PubMed] [Google Scholar]
- Mohamed-Ali V, Goodrick S, Rawesh A, KatZ DR, Miles JM, Yudkin JS, Klein S, Coppack SW. Subcutaneous adipose tissue releases interleukin-6, but not tumor necrosis factor-alpha, in vivo. Journal of Clinical of Endocrinology and Metabolism. 1997;82:4196–4200. doi: 10.1210/jcem.82.12.4450. [DOI] [PubMed] [Google Scholar]
- Mohamed-Ali V, Pinkney JH, Coppack SW. Adipose tissue as an endocrine and paracrine organ. International Journal of Obesity and Related Metabolic Disorders. 1998;22:1145–1158. doi: 10.1038/sj.ijo.0800770. [DOI] [PubMed] [Google Scholar]
- Mulla NA, Simonsen L, BÜLOW J. Post-exercise adipose tissue and skeletal muscle lipid metabolism in humans: the effects of exercise intensity. Journal of Physiology. 2000;524:919–928. doi: 10.1111/j.1469-7793.2000.00919.x. [DOI] [PMC free article] [PubMed] [Google Scholar]
- Nonogaki K, Fuller GM, Fuentes NL, Moser AH, Staprans I, Grunfeld C, Feingold KR. Interleukin-6 stimulates hepatic triglyceride secretion in rats. Endocrinology. 1995;136:2143–2149. doi: 10.1210/endo.136.5.7720663. [DOI] [PubMed] [Google Scholar]
- Orban Z, Remaley AT, Sampson M, Trajanoski Z, Chrousos GP. The differential effect of food intake and beta-adrenergic stimulation on adipose-derived hormones and cytokines in man. Journal of Clinical of Endocrinology and Metabolism. 1999;84:2126–2133. doi: 10.1210/jcem.84.6.5747. [DOI] [PubMed] [Google Scholar]
- Pedersen BK, Steensberg A, Schjerling P. Muscle-derived interleukin-6: possible biological effects. Journal of Physiology. 2001;536:329–337. doi: 10.1111/j.1469-7793.2001.0329c.xd. [DOI] [PMC free article] [PubMed] [Google Scholar]
- Simonsen L, BÜLOW J, Madsen J. Adipose tissue metabolism in humans determined by vein catheterization and microdialysis techniques. American Journal of Physiology. 1994;266:E357–365. doi: 10.1152/ajpendo.1994.266.3.E357. [DOI] [PubMed] [Google Scholar]
- Simonsen L, BÜLOW J, Madsen J, Hermansen F, Astrup A. Local forearm and whole-body respiratory quotient in humans after an oral glucose load: methodological problems. Acta Physiologica Scandinavica. 1993;147:69–75. doi: 10.1111/j.1748-1716.1993.tb09473.x. [DOI] [PubMed] [Google Scholar]
- Skak C, Keiding S. Methodological problems in the use of indocyanine green to estimate hepatic blood flow and ICG clearance in man. Liver. 1987;7:155–162. doi: 10.1111/j.1600-0676.1987.tb00336.x. [DOI] [PubMed] [Google Scholar]
- Steensberg A, Febbraio MA, Osada T, Schjerling P, Van Hall G, Saltin B, Pedersen BK. Interleukin-6 production in contracting human skeletal muscle is influenced by pre-exercise muscle glycogen content. Journal of Physiology. 2001;537:633–639. doi: 10.1111/j.1469-7793.2001.00633.x. [DOI] [PMC free article] [PubMed] [Google Scholar]
- Stouthard JM, Romijn JA, Van Der PT, Endert E, Klein S, Bakker PJ, Veenhof CH, Sauerwein HP. Endocrinologic and metabolic effects of interleukin-6 in humans. American Journal of Physiology. 1995;268:E813–819. doi: 10.1152/ajpendo.1995.268.5.E813. [DOI] [PubMed] [Google Scholar]
- Torpy DJ, Papanicolaou DA, Lotsikas AJ, Wilder RL, Chrousos GP, Pillemer SR. Responses of the sympathetic nervous system and the hypothalamic-pituitary-adrenal axis to interleukin-6: a pilot study in fibromyalgia. Arthritis and Rheumatism. 2000;43:872–880. doi: 10.1002/1529-0131(200004)43:4<872::AID-ANR19>3.0.CO;2-T. [DOI] [PubMed] [Google Scholar]
- Tsigos C, Papanicolaou DA, Defensor R, Mitsiadis CS, Kyrou I, Chrousos GP. Dose effects of recombinant human interleukin-6 on pituitary hormone secretion and energy expenditure. Neuroendocrinology. 1997a;66:54–62. doi: 10.1159/000127219. [DOI] [PubMed] [Google Scholar]
- Tsigos C, Papanicolaou DA, Kyrou I, Defensor R, Mitsiadis CS, Chrousos GP. Dose-dependent effects of recombinant human interleukin-6 on glucose regulation. Journal of Clinical of Endocrinology and Metabolism. 1997b;82:4167–4170. doi: 10.1210/jcem.82.12.4422. [DOI] [PubMed] [Google Scholar]
- Wahren J, Sato Y, Ostman J, Hagenfeldt L, Felig P. Turnover and splanchnic metabolism of free fatty acids and ketones in insulin-dependent diabetics at rest and in response to exercise. Journal of Clinical Investigation. 1984;73:1367–1376. doi: 10.1172/JCI111340. [DOI] [PMC free article] [PubMed] [Google Scholar]