

Abstract
De-epithelialised and de-endothelialised bovine corneal stromas with a hydration of 3.2 equilibrated at 154 mm NaCl and buffered at pH 7.4 had their optical density (400–750 nm) measured. Stromas equilibrated against 10, 20, 30, 50 or 100 mm NaCl made isotonic to 154 mm NaCl by supplementing with sorbitol were progressively more transparent as NaCl increased. Hypertonic equilibration against 300, 600 or 1000 mm NaCl resulted in a progressive loss of transparency compared with 154 mm NaCl. Light scattering as a function of wavelength fitted a λ−3 function well for 10, 30, 50, 100 and 154 mm NaCl preparations between 450 and 650 nm, but not at higher wavelengths. However, hypertonic 300, 600 and 1000 mm NaCl preparations showed a λ−2 dependence in the 450–750 nm range. Experiments with 154 mm NaCl and either 0 or 300 mm sorbitol suggested that the changes in light scattering in hypertonic preparations are unlikely to be caused by osmotic alterations to the stromal keratocytes. Psychophysical studies of the optical transmission function of preparations indicated that corneal stromas dialysed against 154 mm NaCl had usable optical properties, but preparations dialysed against 10 mm NaCl were effectively unable to transmit an image. The results are related to the known increase of fixed negative charge in the corneal matrix when chloride ions are adsorbed onto the matrix. It is suggested that the ordering force between corneal collagen fibrils, generated in part by anion binding, may be crucial to the physiological functioning of the visual system.
Chloride ion binding to the extracellular matrix of the corneal stroma was discovered during a quantitative examination into the nature of the net electric charge density in this tissue (Elliott, 1980; Elliott et al. 1980; Hodson et al. 1992), which had previously been assumed to arise wholly from the sulphonic and carboxylic acid groups of keratan sulphate and dermatan/chondroitin sulphate, the major glycosaminoglycans (GAGs) of the corneal stroma. Chloride anion binding accounts for slightly more than half of the stromal fixed negative charge at physiological values in both ox and human corneas (Hodson et al. 1992; Guggenheim et al. 1995). The net stromal negative charge density is a crucial parameter in assessing quantitatively the swelling characteristic of the corneal stroma, and this is denoted by the term ‘gel pressure’ (Hodson & Earlam, 1993). The gel pressure is, in turn, important because, together with other passive permeability properties of the corneal endothelium, it generates the transendothelial ‘leak’, and an investigation of its magnitude allowed an estimate of the size of the outwardly directed corneal ‘pump’. This pump regulates the dynamic balance of corneal hydration and, therefore, the maintenance of corneal transparency. This analysis was used to show that it was a bicarbonate ion pump in the endothelium that was the primary driving force in maintaining corneal deturgescence and transparency (Hodson & Miller, 1976; Jentsch et al. 1984; Bonanno & Giasson, 1992), and that the biocarbonate ion pump is dependent for its action upon the presence of chloride ions (Winkler et al. 1992; Lane et al. 2000).
During studies of corneas loaded with various concentrations of chloride, it became clear that the transparency of the stroma was affected directly by the presence of chloride ion binding (Elliott & Hodson, 1998), as well as indirectly via the pump-leak mechanism outlined above. Chloride ion binding, therefore, plays a dual role in maintaining corneal transparency. This study reports on the optical density measurements of ox corneal stromas as chloride ion binding is varied. It shows that corneal stromal transparency is apparently tuned to be optimal at physiological concentrations of chloride and, further, shows that corneal stromas at physiological hydration but low in chloride have their optical modulation transfer function degraded to the point beyond that capable of transmitting an image when corneal stromas loaded with low salt are placed in the spectacle position.
Methods
Dissection and preparation of corneas
Bovine eyes were obtained from a local abattoir within a few hours of death and transported to the laboratory on ice. There, the corneal epithelium was removed to the limbus by the use of a rotating bristle brush, and the cornea, with a 5 mm rim of sclera, carefully excised. The single layer of endothelial cells on the cornea's posterior surface was removed with tissue paper.
In order to regulate corneal stromal hydration and anion content, each preparation was placed into a dialysis tube (molecular weight cut-off, 12–14 kDa, Medicell Int. Ltd, UK) and gently rubbed to remove air pockets after the method of Meek et al. (1991). Plastic clips sealed both ends of the tube and preparations were dialysed against various bathing solutions overnight at 4 °C.
Bathing solutions
Bathing solutions were prepared with NaCl concentrations of 10, 30, 50, 100, 154, 300, 600 and 1000 mm, buffered at pH 7.4 by 5 mm Hepes (Sigma). Salt solutions, hypotonic to 154 mm NaCl, were supplemented to isotonicity with sorbitol. However, corneas exposed to solutions of either 300, 600 or 1000 mm NaCl experienced hypertonic conditions. In one series of experiments, the effect of hypertonicity on stromal transparency was studied by a comparison of 154 mm NaCl solution supplemented with sorbitol to be isotonic with 300 mm NaCl. After the method of Meek et al. (1991), polyethylene glycol of nominal molecular weight 20 000 (PEG 20K) was added to the solution in concentrations sufficient to attain a final stromal hydration of 3.2. Hydration (H) is defined as:
| (1) |
and a value of approximately 3.2 is considered to be physiological (Hodson et al. 1991). The concentrations of PEG 20K required to equilibrate the cornea to a final hydration of around 3.2 were calculated for each salt concentration with the aid of a well-known equation for gel pressure (Hodson, 1971) and fine-tuned semiempirically (Table 1). Measurements were taken on 206 corneas.
Table 1.
Hydration (H) of corneal stromas studied at different concentrations of NaCl (n = 6 for each concentration) and corresponding concentration of polyethylene glycol (PEG), which was necessary to achieve a hydration close to the physiological value of 3.2
| [NaCl] (mM) | ||||||||
|---|---|---|---|---|---|---|---|---|
| 10 | 30 | 50 | 100 | 154 | 300 | 600 | 1000 | |
| H | 3.20 | 3.19 | 3.20 | 3.20 | 3.19 | 3.20 | 3.20 | 3.23 |
| s.e.m. | 0.01 | 0.02 | 0.03 | 0.04 | 0.06 | 0.03 | 0.02 | 0.07 |
| [PEG] (%) | 3.96 | 3.52 | 3.68 | 3.28 | 4.45 | 4.08 | 2.71 | 2.20 |
| s.e.m. | 0.04 | 0.05 | 0.06 | 0.08 | 0.14 | 0.15 | 0.09 | 0.12 |
Control over possible extraction of proteins and glycosaminoglycans from corneal stromas into the bathing solutions
To investigate the possible leaching of proteins and GAGs from corneal stromas during preparation, protein concentration and GAG content were measured in three selected bathing solutions of 10, 154 and 600 mm NaCl. Five stromal preparations mounted in dialysis bags had been incubated overnight in 200 ml of each solution at +4 °C. After the stromal preparations in their dialysis bags were removed from the solutions, protein concentration and GAG content in the bathing solutions were measured.
Total protein concentration was determined using the Bradford Protein Assay (Bradford, 1976; Coomassie Protein Assay Reagent (CPAR), Pierce, USA). The system was calibrated using bovine serum albumin (BSA, Fisher BioReagents) with 0.17 μg ml−1 of BSA being a lower limit of detection. Three 1.5 ml aliquots taken from each bathing solution before and after the overnight incubation of the stromal preparations were combined with 1.5 ml CPAR. The optical density of these 3 ml samples was measured at 595 nm and values for the pre-incubation solutions were subtracted from the values for the post-incubation solutions. Maximum extracted protein was found in the aliquots from the 154 mm NaCl bathing solution, with total protein concentration 4.4 ± 0.4 μg ml−1 (average of three aliquots). When total volume of the bathing solution is taken into account this corresponds to 176.0 ± 15.8 μg of total protein leached into the bathing solution from an individual corneal-scleral preparation during the incubation. The size of the total corneal-scleral preparation in our experiments was more than ten times the size of ox corneal stromas used by Doughty (2001), who estimated the total soluble protein extractable from 8 mm × 8 mm tissue samples at 1375 ± 224 μg. Based on this value we estimate that in our experiments only about 1 % of the total soluble protein was extracted.
Total GAG in the incubation solutions was assessed using the 1,9-dimethylmethylene blue (DMB; Aldrich) method, as described by Farndale et al. (1982). DMB (8 mg) was dissolved in 2.5 ml of ethanol, containing 1 g of sodium formate and 1 ml of formic acid, after which the solution was diluted up to 0.5 l with double de-ionised water. Chondroitin sulphate (Sigma) was used for calibration. A 1 ml sample of the studied solution was mixed with 4 ml of DMB solution and sample optical density was measured at 535 nm. No GAGs were detected in any of the solutions tested. Thus, we estimate the upper limit of extraction from our preparations, based on a half-value of the detection limit, as being 0.2 μg ml−1. This indicates that less than 8 μg of GAGs were lost from a corneal-scleral preparation during the incubation, which is negligible compared with 2280 ± 997 μg of total proteoglycans present in a 8 mm × 8 mm bovine corneal preparation, estimated using a dot-blot assay (Doughty, 2001).
Measurement of corneal stromal transparency
In general, light transmittance (T) represents the ratio of the transmitted light intensity (I) through an object of thickness d to the incident light intensity (Io) and is equal to:
| (2) |
and from eqn (2),
| (3) |
where αa is an absorption extinction coefficient and αs is a scattering extinction coefficient. When there is no absorption, scattering alone (defined by αs) determines the amount of light loss.
| (4) |
Optical density (A) recorded on the spectrophotometer (which includes both the scattering and the absorption extinction coefficients) is related to light transmittance by:
| (5) |
Therefore, from eqn (5), light transmittance can be calculated from the measured optical density:
| (6) |
The percentage of non-transmitted light (due to either absorption or scattering) (N) is simply:
| (7) |
We found a small amount of absorption in our preparations that was spectrally characteristic of oxidised/reduced cytochrome c at wavelengths around 413 nm and 510–600 nm. For the light wavelengths, where there was no cytochrome c absorption, scattered light is assumed equal to non-transmitted light.
To measure corneal stromal optical density a preparation was mounted by clamping its scleral rim between specially constructed Perspex half-chambers with optically polished, flat glass ends. Readings were taken at the centre of the corneal stroma, using a 5 mm beam, and the half-collection angle to the photo-detector was 3 deg. Prior to each reading, each half-chamber was filled with silicone fluid (Dow Corning 200/5cS, BDH Laboratory Supplies, Poole, UK) with a refractive index of 1.397 ± 0.001 at 20 °C (measured with an Abbe refractometer). Reflections at the silicone oil/tissue interfaces were calculated by the Fresnel formula, and accounted for less than 0.006 % of transmitted light loss, a negligible amount compared with experimental error.
In these experiments, a stable minimum of optical density through the preparation was found only when a small, positive hydrostatic pressure (greater than 200 Pa, lens side positive) was set across the preparation. On average, the optical density reversibly increased by around 4 % when the pressure was released. Here, we routinely employed a pressure head of 360 Pa (4 cm silicone fluid). Optical density measurements were taken throughout a spectral range of 400–750 nm at intervals of 10 nm using a Pye Unicam SP8-100 UV/VIS spectrophotometer calibrated to an accuracy of 0.002 absorbance units. The baseline was measured as background optical density due to the chamber filled with silicone fluid and in no instance was ever greater than 0.006 absorbance units at any wavelength. Baselines were routinely taken and subtracted from the stromal optical density data. After the optical density data were obtained, the corneo-scleral preparation was taken from the chamber, carefully blotted free of silicone oil, and a 1.7 cm diameter biopsy trephined from the central cornea and weighed. Biopsies were subsequently dried for 24 h at 95 °C, their dry weights determined, and corneal hydrations calculated as described above.
Normalisation of the optical density data to account for varied stromal thickness
Measured optical density data for an individual corneal stroma (Ames,i) were normalised (Anorm,i) in order to take into account variations in the stromal thickness. This normalisation procedure altered the raw data by, on average, 5 %, with a maximum correction within the range ±20 %.
To determine hydration (according to eqn (1)), standard diameter (1.7 cm) biopsies were punched through the central corneal stromas. At constant hydrations and specimen diameter, such as we used, the thickness of the corneal stroma is proportional to its dry weight. Thus, we used the latter to normalise the data to the average thickness of the corneal stroma.
Since the densities and diameters (thus, areas) of all dried stromas were the same, we calculated the thickness of a given dried stroma (di) relative to the average of the thicknesses of all studied dry stromas (dav) from the relative dry weight of the given i th stroma (mi/mav), so that:
| (8) |
where subscript ‘i ‘ indicates a given stroma and subscript ‘av’ indicates the average stroma. Since we maintained stromal hydration the same (see Table 1), the thickness ratio for the fresh stromas is equal to the thickness ratio of the dry stromas.
Then, according to eqns (4) and (6), we calculated the product (αs,idi) from the measured optical density data (Ames,i) for a given i th corneal stroma of thickness di:
| (9) |
To normalise this product to that of the average stroma we multiplied the product by the ratio of the dry weights, so:
| (10) |
The averaged products (αs,idav)av were used for further modelling (data from six corneal stromas for each NaCl concentration were averaged). From the reversed eqns (4) and (5), normalised optical density is:
| (11) |
which, after substituting (αs,idav) from eqn (10) and then (αs,idi) from eqn (9), simplifies into:
| (12) |
The value mav/mi was calculated for each studied stroma, and then all Ames,i were normalised into Anorm,i according to eqn (12). These normalised optical density data were used for further analysis. We utilised the linear relationship between hydration and thickness of ox corneas, originally established by Hedbys & Mishima (1962), and confirmed, in agreement with their published data, that the average thickness of ox corneal stroma at hydration 3.2 when measured with the specular microscope is 752 ± 27 μm (mean ± s.e.m., n = 10). To convert any of our data here from properties of an average cornea to those per millimetre thickness of ox corneal stroma, it is necessary to multiply transmission data by 0.75, or to divide optical density data by 0.75.
Image transmission by corneas loaded with different salt concentrations
In addition to the optical density measurements of the corneal stromal preparations, a psychophysical method was used to compare the optical modulation transfer function (MTF) of bovine corneal stromas prepared in either 154 or 10 mm saline equilibrated to physiological hydration. To do this the prepared corneal stromas were suspended in silicone fluid in front of an observer's eye in the spectacle position. We chose to measure optical modulation transfer function rather than contrast sensitivity in order to obviate stimulus area and retinal illuminance factors, as described by Mustonen et al. (1993). When the effects of stimulus area and retinal illuminance are neutralised across spatial frequencies, the decrease in contrast sensitivity with increasing spatial frequency is due solely to the optical MTF of the ocular optics of the human eye (Banks et al. 1987; Rovamo et al. 1994a,b, 1998). Any additional effects perceived by the observer when bovine corneas are suspended in front of the observer's eyes may be ascribed to the optical MTF of the bovine corneas. Each data set for each cornea was accumulated over about 40 min, as described below.
Visual stimuli were generated on an RGB multiscan computer monitor (Eizo Flexscan 9080i with fast phosphor B22) utilising a VGA graphics board (Orchid's Pro Designer VGA plus), with a frame of 60 Hz and pixel size of 0.46 mm. Intensity was chosen from a palette of 65 536 levels. Mean luminance was 50 cd m−2, and was varied using neutral density filters. Further experimental details are described elsewhere (Rovamo, 1994a). The stimuli were circular cosine gratings with radii of 0.5, 0.72, 1, 2 and 4 cm contained within a circular, sharp-edged aperture. Contrast thresholds were measured for eight spatial frequencies, at 1, 2, 4, 8, 11, 16, 23 and 32 cycles deg−1, after the subject was dark-adapted for 30 min. Viewing distance was 114 cm (1 and 2 cycles deg−1), 228 cm (4, 8 and 11 cycles deg−1) or 458 cm (16, 23 and 32 cycles deg−1). Mean luminance was maintained with neutral density filters. Subjects were two young emmetropes experienced in the task, who viewed the gratings monocularly. Pupillary dilatation was achieved by the topical application of one drop of 2.5 % phenylephrine hydrochloride, followed by a second drop 5 min later. A 5 mm artificial pupil was used to control the level of retinal illuminance. Contrast threshold was determined by a two-alternative, forced choice algorithm (Wetherill & Levitt, 1965). Each trial consisted of two half-second exposures separated by 0.6 s. One exposure contained the grating stimulus; the other had no contrast. There was no fixation protocol other than the request to look at the centre of the screen. A second trial began 0.25 s after the observer's response. Stimulus contrast was reduced/increased by 1.26. Each data point represented the median of three estimates of threshold. Normal MTFs were determined first. Then the subject had the spectacles positioned to include three samples of ox cornea loaded with 154 mm NaCl, followed by three samples of ox cornea loaded with 10 mm NaCl. The spectacles plus silicone oil alone had no detectable effect on the observer's MTF.
The written informed consent of the subjects and local ethical committee approval was obtained prior to the procedures.
Statistical analysis of data and modelling
All data were analysed with mean values and standard errors (s.e.m.) obtained from at least five replicates, using Excel (Microsoft). Modelling exercises were performed by either the ‘trendline’ feature of Excel or the ‘user-defined function’ mode of Statistica (Statsoft, Tulsa, USA).
Results
Chloride distributions in the intra-stromal ox corneas, at hydration 3.2, when exposed to differing external concentrations of chloride at pH 7.4 (taken from Hodson et al. 1992) are given in the form of external chloride, followed by free stromal solution chloride, and thirdly, bound stromal chloride, respectively; concentrations (mm): (10, 2, trace);(30, 21.5, 5); (50, 38, 8); (100, 82, 14); (154, 132, 22); (300, 276, 31); (600, 575, 30); (1000, 975, 36). The estimated errors (s.e.m.s) on each of these sets of data are, respectively, 0, 3 and 15 %. The final figure in each set of three represents the additional fixed negative charge due to the presence of bound chloride which must be added to a basal fixed negative charge of 18 mm arising from the acidic groups of the stromal GAGs in order to estimate total fixed negative charge in the stroma. The intra-stromal sodium is distributed from its electrochemical potential alone and can be reliably calculated from the Donnan ratio. There is no evidence for sodium ion binding in corneal stroma.
Wavelength dependence of the light scattered by corneas loaded with physiological NaCl
Light losses in the visible part of the spectrum were studied for individual bovine corneal stromas within the physiological range of hydrations after they were equilibrated against 154 mm NaCl (Fig. 1). Optical density was the highest at the blue end of the visible spectrum, where it varied between 0.100 and 0.203 absorbance units (a.u.) at 410 nm. It was markedly reduced at the red end of the spectrum, and ranged from 0.004 to 0.020 a.u. at 700 nm. These variations in optical density corresponded to light transmittance variations of 62.7 % to 79.4 % at 410 nm and 95.4 % to 99.0 % at 700 nm, respectively. There was a pronounced absorption peak in the range 400–420 nm, and a less obvious bimodal peak at 520–600 nm, corresponding to cytochrome c absorption (see the absorption spectra of oxidised and reduced cytochrome c (from Stryer, 1981) shown for a comparison in Fig. 1). Regions of the spectra, which contained clear absorption effects, were omitted from our modelling exercises.
Figure 1. Wavelength dependence of the normalised optical density for individual bovine corneal stromas equilibrated at 154 mm NaCl.
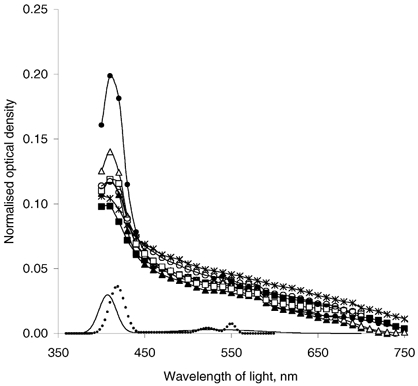
Stromal hydration varied from 3.1 to 3.4, with an average of 3.19 ± 0.06. The absorption spectra of oxidised (straight line) and reduced (dotted line) cytochrome c are shown for a comparison (from Stryer, 1981).
Effect of the altered NaCl concentration upon corneal transparency
Wavelength dependence of the scattered light was studied for bovine corneal stromas after dialysing them against a range of concentrations of NaCl from 10 mm to 1 m. During these experiments the hydrations of the corneal stromas were maintained close to physiological levels by the use of PEG (Table 1). Our normalised data clearly show that altered concentrations of NaCl caused stromas to scatter light more strongly than stromas treated with physiological 154 mm NaCl (Fig. 2). To complete the whole visible spectrum, we interpolated the light-scattering curves (shown by lines only in Fig. 2) for the wavelengths of light where the data had shown the appreciable cytochrome c absorption (i.e. 400 nm < λ < 450 nm, and 510 nm < λ < 600 nm). This was done by modelling the experimental data without cytochrome c absorption (for λ = 450–510 nm and λ = 600–750 nm) with a polynomial function of the 4th degree (which describes experimental data well, R2 > 0.999). We would like to emphasise here that this modelling was undertaken to show the role of NaCl concentration on light scattering by corneal stromas without taking into account the additional light loss due to the cytochrome c absorption, which is beyond the scope of this study.
Figure 2. The wavelength dependence of light scattered by corneal stroma as a function of NaCl concentration.
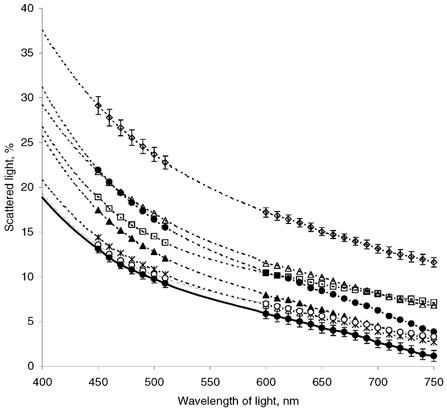
• and dotted line, 10 mm; ▴, 30 mm; ×|, 50 mm; ○, 100 mm; • and continuous line, 154 mm; ▪, 300 mm; ▵, 600 mm; ⋄, 1 m. Data from six corneas are averaged. Bars show s.e.m. for the lowest (154 mm) and the highest (1 m) NaCl concentrations.
All light-scattering curves (Fig. 2) were higher over the whole region of the visible spectrum than the scattering curve from physiological, 154 mm NaCl, both for increased and decreased concentrations of NaCl. A three-dimensional representation of the corresponding corneal stromal light transmittance data versus both wavelength and NaCl concentration discloses a clear optimum in light transmittance for 154 mm NaCl over the whole range of NaCl concentrations and wavelengths studied (Fig. 3). The lowest (10 mm) and highest (1 m) concentrations of NaCl resulted in, respectively, 83.0 ± 1.2 % and 76.7 ± 0.8 % transmission of light at 500 nm, compared with 90.4 ± 0.4 % for corneal stromas dialysed against 154 mm NaCl. This tendency is still evident at 750 nm, where stromal transparency at 154 mm NaCl is equal to 98.9 ± 0.6 %, but only 96.0 ± 0.5 % for 10 mm NaCl and 88.6 ± 0.5 % for 1 m NaCl. It is noteworthy that the averaged products (αs,idav)av at 450 nm are 1.74 times and 2.42 times greater for the stromas dialysed against 10 mm and 1 m NaCl compared with 154 mm NaCl. Moreover, these products are 3.38 times and 10.6 times greater than (αs,idav)av for the stromas dialysed against 154 mm NaCl at 750 nm. Since our data were normalised to the average stromal thickness, these numbers show how much larger were the scattering extinction coefficients for 10 mm and 1 m NaCl compared with the scattering extinction coefficient of the stromas dialysed against 154 mm NaCl.
Figure 3. Three-dimensional representation of the transparency of the corneal stroma as a function of wavelength and concentration of NaCl.
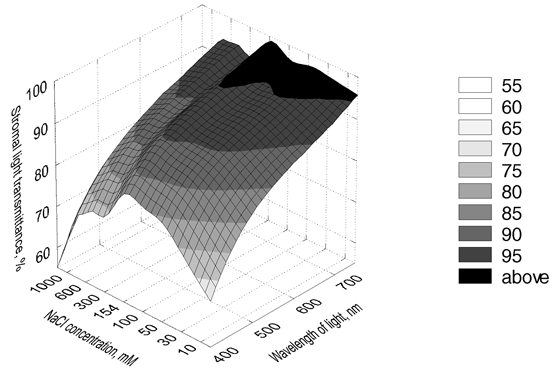
Data represent averaged values from six corneas for each concentration of NaCl.
The presence of NaCl in corneal stroma has two potential effects: one is osmotic and the other one is ionic. Here, we avoided the osmotic effect at 10–100 mm NaCl by supplementation with sorbitol. However, at hypertonic concentrations of NaCl this strategy had to be modified to distinguish increased chloride ion binding effects from increased osmotic effects. We achieved this by comparing preparations exposed either to bathing solutions of 154 mm NaCl only or to 154 mm NaCl supplemented with 300 mm sorbitol, so the total osmolarities were either 300 or 600 mosmol l−1. In doing so, corneal stromas were treated with the same NaCl concentration, but in the latter case osmolarity was doubled. This experiment allowed us to assess a possible contribution from corneal keratocytes towards the observed decrease in the stromal transparency, since one might expect some changes in the cells in hyperosmotic conditions. Data revealed a slight difference in the optical densities between these two treatments, with a statistically insignificant decrease in the optical density for hyperosmotic stromas (Fig. 4). Since the observed effects upon optical density in hypertonic preparations well outweigh the individual variations (see Fig. 2), we suggest that the reported decrease in stromal transparency for hypertonic preparations is mainly caused by the concentration of chloride. These data also indicate that the presence of sorbitol itself throughout the range 0–300 mm has no effect on corneal stromal transparency.
Figure 4. Comparison of the normalised optical density for corneal stromas equilibrated at 154 mm NaCl at different osmolarities.
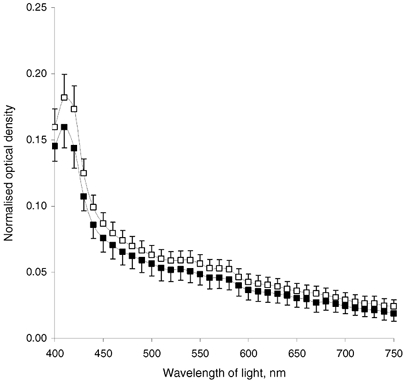
▪, 300 mosmol l−1; ▪, 600 mosmol l−1 (achieved by supplementing with sorbitol). Data represent average for five corneas; averaged hydration was 3.12 for 300 mosmol l−1 and 3.14 for 600 mosmol l−1. Bars show s.e.m.
Modulation transfer functions of bovine corneal stromas loaded with either 10 or 154 mm NaCl demonstrated that whereas the 154 mm-treated corneal stromas were able to transmit images identifiable to the human visual cortex, 10 mm-treated corneal stromas were not (Fig. 5). It should be mentioned that images, perceived through 154 mm equilibrated bovine corneal stromas, were degraded. A contributory factor for this would have been that these bovine corneal stromas were, for technical reasons, not sustaining a hydrostatic pressure. For comparison, we include data on normal human corneas and, in addition, data kindly supplied by T. M. Mubard & S. A. Hodson on human keratoconic corneas, corrected with contact lenses, at the stage where corneal transplantation is indicated.
Figure 5. Modulation transfer functions.
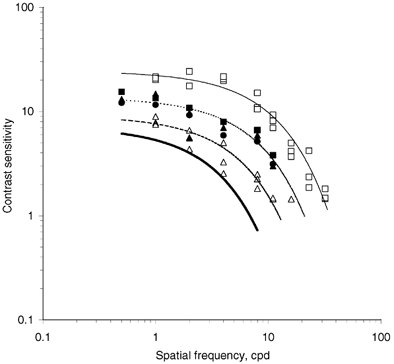
Modulation transfer function of normal human (▪, continuous line), keratoconic human corneas (▵, dashed line) and bovine corneal stromas, equilibrated at 154 mm NaCl, with individual hydration close to 3.2 (▪, ▴, •, dotted line). Bovine corneal stromas equilibrated at 10 mm NaCl had contrast sensitivity below the estimated threshold shown as a continuous bold line. Data on keratoconic corneas were kindly supplied by T. M. Mubard & S. A. Hodson (personal communication) and shown here for a comparison. cpd, cycles per degree.
Discussion
The data report axial light transmission through the centres of bovine corneal stromas in vitro when these are maintained close to physiological hydration. There are three possible sources of light loss during transmission through the corneal stroma: specular reflections at the tissue surfaces, absorption by a pigment or scattering. Specular reflections were practically eliminated by bathing the preparations in silicone fluid with a refractive index close to that of the preparations. Pigment absorption was detected and characterised as arising from oxidised/reduced cytochrome c. Overall our data are broadly compatible with those published earlier (Farrell et al. 1973), but because of our more frequent sampling (every 10 nm compared to every 50 nm) we were able to detect cytochrome c. A slight variation in spectral transmission was identified between nominally identical preparations of bovine corneal stromas, which reflected a standard deviation for light scattered per unit thickness of the cornea of around 8 %. Small variations in hydration (Hodson et al. 1991) and light transmission seem to be physiologically acceptable.
Total scattering cross-section per fibril can be written in an asymptotic series of the form of the product of the isolated fibril cross-section, σt,0, which is proportional to the inverse cube of the light wavelength (1/λ3), times a power series in the variable (1/λ2), the coefficients of which depend on the model (for overview, see Farrell & McCally, 2000):
where a, b, c, d and so on are λ-independent coefficients. It is predicted by the short-range order models that the coefficient at the (1/λ2)0 term is non-zero, thus making the first component of the scattering term proportional to (1/λ3). On the other hand, long-range order models predict a zero coefficient at (1/λ2)0, therefore the first non-zero coefficient is the (1/λ2)1 term, which would result in scattering as a (1/λ5) function (Farrell & McCally, 2000).
In our analysis of the stromal scattering properties, we followed the approach of McCally & Farrell (1988). The scattering cross-section per fibril (σt,0) is directly proportional to the scattering extinction coefficient (αs). Therefore, analysis of the wavelength dependence of the averaged product (αs,idav)av, which we calculated according to eqns (9) and (10), tell us the wavelength dependence of the scattering cross-section (σt,0). Note that dav is a wavelength-independent constant of the average corneal thickness. We plotted products (αs,idav)av averaged for six individual corneal stromas for each concentration of NaCl, multiplied by the cube of the light wavelength (the regions of the spectrum with appreciable cytochrome c absorption were excluded from the analysis; Fig. 6). If the ordering of collagen fibrils was short-range, this multiplication by λ3 would remove the wavelength dependence contained in the scattering cross-section per fibril (σt,0), which is an inverse cubic function of the wavelength in the short-range order models of the corneal stromal light scattering. In this case, the resulting data are expected to be independent of wavelengths (see Fig. 6 in McCally & Farrell, 1988, p. 168). This assumption appears to hold for the range of wavelengths from 450 nm to about 650 nm for 10–154 mm NaCl treatments. However, such a correspondence between the data and the predictions of short-order range theories vanishes for wavelengths greater than 650 nm, where curves deviate from their corresponding plateau values. On the other hand, curves for the hypertonic treatments of 300, 600 and 1000 mm NaCl ascend rather steadily with wavelength, indicating a power law less than cubic. Actual analysis of the data for 154 mm NaCl preparations in the range 450–650 nm produced a good fit (R2 = 0.997) to the inverse cubic dependence on wavelength:
Figure 6. The wavelength dependence of light scattering properties of the bovine corneal stromas (n = 6 for each concentration) as a function of NaCl concentration.
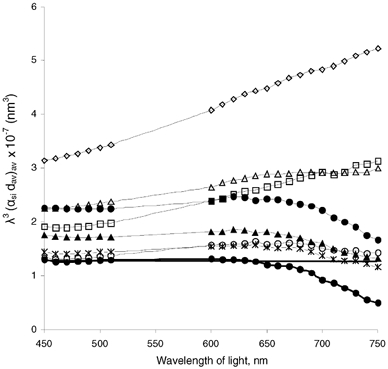
•, thin line, 10 mm; ▴, 30 mm; ×|, 50 mm; ○, 100 mm; •, continuous line, 154 mm; ▪, 300 mm; ▵, 600 mm; ⋄, 1 m. As discussed in the text, the actual quantity plotted is the averaged product (αs,idav)av, which is directly proportional to the total light scattering cross-section, multiplied by the cube of the light wavelength to remove the inverse cubic wavelength dependence predicted by the short-range order models (following McCally & Farrell, 1988).
On the other hand, analysis of the data for 1000 mm NaCl for the whole range of the wavelengths studied (450-750 nm) resulted in a very good fit (R2 = 0.999) to the inverse square function of wavelength:
Thus, it has proved difficult to analyse light-scattering properties of the corneal stroma calculated from our normalised optical density data for the whole visible range as a single power function. The theoretical analysis of stromal scattering properties for the physiological 154 mm NaCl treatment shows a good correspondence to the short-range order theory predictions of an inverse cubic dependence on wavelength up to 650 nm, with a deviation from the predicted behaviour for longer wavelengths. Nevertheless, it is the inverse square dependence that best describes the averaged product (αs,idav)av for the hypertonic equilibrations: the power laws were equal to −1.95, R2 = 0.995, for 300 mm NaCl; −2.31, R2 = 0.999, for 600 mm NaCl; and −1.96, R2 = 0.999, for 1000 mm NaCl. Such a correspondence is predicted by the ‘lake’ theory (Benedek, 1971), and this seems to us to be a possible reason for the decreased transparency of the hypertonic preparations.
It is generally agreed that the difference between the refractive index of each collagen fibril and its surrounding medium, in any first-order calculation, is sufficient for cornea to scatter most of the incident light and, in effect, render the cornea opaque (Maurice, 1957; Worthington, 1984). This does not happen because of the presence of an interference factor, which reduces scattered light (reviewed by Freund et al. 1995), or by an attenuation coefficient (Worthington, 1984). The interference factor arises from the regularity of the arrangement of the collagen fibrils. In Maurice's original theory (1957), the interference factor was high as the fibrils were modelled to a perfect lattice, but the perfect lattice model was later shown to be not true (Goodfellow et al. 1978; Farndale et al. 1982).
Order, of some sort, between neighbouring collagen fibrils is essential to explain corneal stromal transparency (Hart & Farrell, 1969; Feuk, 1970; Worthington, 1984; Freund et al. 1995) and there are excellent theoretical and experimental reasons to support the concept that such order/disorder is promoted by electrostatic repulsions generated by the net negative fixed charges (reviewed by Elliott & Hodson, 1998). Contribution to such electrostatic repulsions is partly by negatively charged sulphate groups on lumican, as recent work with transgenic mice has disclosed (Quantock et al. 2001). A potentially attractive reason for varying chloride is that in so doing it is possible to reversibly alter the fixed charge concentration in the corneal stroma. Our data are consistent with inter-fibrillar electrostatic ordering playing a role in the maintenance of corneal transparency. On the other hand, it is possible that alteration of NaCl in corneal stroma might cause changes in parameters other than the ordering of collagen fibrils, which play a role in the stromal transparency. These are diameters of collagen fibrils, relative refractive indexes of both collagen fibrils and the interfibrilar media and the state of corneal keratocytes in the stroma. As for the latter, the experiments varying the osmolarity at either 300 or 600 mosmol l−1 (see Fig. 4) suggested that the changes in light scattering in hypertonic preparations are unlikely to be caused by osmotic alterations to the cells (keratocytes) in the stroma. Unpublished data from this laboratory indicate that altering the ambient chloride concentration alters fibrillar ordering rather than fibril diameters. This paper reports a strong dependence of the corneal stromal transparency on concentration of the ambient anion with a clear optimum around physiological, 154 mm NaCl, concentration. Other monovalent anions bind to corneal stroma in similar magnitudes (reviewed in Elliott & Hodson, 1998) and so the phenomenon is one of monovalent anion binding. Further structural investigations are needed to elucidate the underlying nature of the observed phenomenon.
Acknowledgments
O.K. was supported by a Wellcome Trust Travelling Fellowship (on leave from Institute of Cell Biology and Genetic Engineering, National Academy of Sciences of Ukraine). The work was supported by grants from the EPSRC and MRC.
References
- Banks M, Geisler W, Bennett P. The physical limits of grating visibility. Vision Research. 1987;27:1915–1924. doi: 10.1016/0042-6989(87)90057-5. [DOI] [PubMed] [Google Scholar]
- Benedek GB. The theory of transparency of the eye. Applied Optics. 1971;10:459–473. doi: 10.1364/AO.10.000459. [DOI] [PubMed] [Google Scholar]
- Bonanno JA, Giasson C. Intracellular pH regulation in fresh and cultured bovine corneal endothelium. II. Na+:HCO3− cotransport and Cl−/HCO3− exchange. Investigative Ophthalmology and Visual Science. 1992;33:3068–3079. [PubMed] [Google Scholar]
- Bradford MM. A rapid and sensitive method for the quantitation of microgram quantities of protein utilizing the principle of protein-dye binding. Analytical Biochemistry. 1976;72:248–254. doi: 10.1016/0003-2697(76)90527-3. [DOI] [PubMed] [Google Scholar]
- Doughty MJ. Changes in hydration, protein and proteoglycan composition of the collagen-keratocyte matrix of the bovine corneal stroma ex vivo in a bicarbonate-mixed salts solution, compared to other solutions. Biochimica et Biophysica Acta. 2001;1525:97–107. doi: 10.1016/s0304-4165(00)00176-8. [DOI] [PubMed] [Google Scholar]
- Elliott GF. Measurements of the electrical charge and ion-binding of the protein filaments in intact muscle and cornea, with implications for filament assembly. Biophysical Journal. 1980;32:95–97. doi: 10.1016/S0006-3495(80)84927-7. [DOI] [PMC free article] [PubMed] [Google Scholar]
- Elliott GF, Goodfellow JM, Woolgar AE. Swelling studies of bovine stroma without bounding membranes. Journal of Physiology. 1980;298:453–470. doi: 10.1113/jphysiol.1980.sp013094. [DOI] [PMC free article] [PubMed] [Google Scholar]
- Elliott GF, Hodson SA. Cornea, and the swelling of polyelectrolyte gels of biological interest. Reports on Progress in Physics. 1998;61:1325–1365. [Google Scholar]
- Farndale RW, Sayers CA, Barrett AJ. A direct spectrophotometric microassay for sulfated glycosaminoglycans in cartilage cultures. Connective Tissue Research. 1982;9:247–248. doi: 10.3109/03008208209160269. [DOI] [PubMed] [Google Scholar]
- Farrell RA, McCally RL. Corneal transparency. In: Albert DM, Jakobiec FA, Azar DT, Gragoudas ES, Power SM, Robinson NL, editors. Principles and Practice of Ophthalmology. W. B. Saunders Company; 2000. pp. 629–646. [Google Scholar]
- Farrell RA, McCally RL, Tatham PER. Wave-length dependencies of light scattering in normal and cold swollen rabbit corneas and their structural implications. Journal of Physiology. 1973;233:589–612. doi: 10.1113/jphysiol.1973.sp010325. [DOI] [PMC free article] [PubMed] [Google Scholar]
- Feuk T. On the transparency of the stroma in the mammalian cornea. IEEE Transactions on Bio-Medical Engineering BME. 1970;17:186–190. doi: 10.1109/tbme.1970.4502732. [DOI] [PubMed] [Google Scholar]
- Freund DE, McCally RL, Farrell RA, Cristol SM, L'Hernault NL, Edelhauser HF. Ultrastructure in anterior and posterior stroma of perfused human and rabbit corneas. Relation to transparency. Investigative Ophthalmology and Visual Science. 1995;36:1508–1523. [PubMed] [Google Scholar]
- Goodfellow JM, Elliott GF, Woolgar AE. X-ray diffraction studies of the corneal stroma. Journal of Molecular Biology. 1978;119:237–252. doi: 10.1016/0022-2836(78)90436-9. [DOI] [PubMed] [Google Scholar]
- Guggenheim JA, Armitage WJ, Evans AD, Davies H, Rebello G, Hodson SA. Chloride binding in the stroma of cultured human corneas. Experimental Eye Research. 1995;61:109–113. doi: 10.1016/s0014-4835(95)80064-6. [DOI] [PubMed] [Google Scholar]
- Hart RW, Farrell RA. Light scattering in the cornea. Journal of the Optical Society of America. 1969;59:766–774. doi: 10.1364/josa.59.000766. [DOI] [PubMed] [Google Scholar]
- Hedbys BO, Mishima S. Flow of water in corneal stroma. Experimental Eye Research. 1962;1:262–275. doi: 10.1016/s0014-4835(62)80010-4. [DOI] [PubMed] [Google Scholar]
- Hodson S, Earlam R. The incorporation of gel pressure into the irreversible thermodynamic equation of fluid flow in order to explain biological tissue swelling. Journal of Theoretical Biology. 1993;163:173–180. doi: 10.1006/jtbi.1993.1115. [DOI] [PubMed] [Google Scholar]
- Hodson S, Kaila D, Hammond S, Rebello G, Al-Omari Y. Transient chloride binding as a contributory factor to corneal stromal swelling in the ox. Journal of Physiology. 1992;450:89–103. doi: 10.1113/jphysiol.1992.sp019117. [DOI] [PMC free article] [PubMed] [Google Scholar]
- Hodson S, O'Leary D, Watkins S. The measurement of ox corneal swelling pressure by osmometry. Journal of Physiology. 1991;434:399–408. doi: 10.1113/jphysiol.1991.sp018476. [DOI] [PMC free article] [PubMed] [Google Scholar]
- Hodson SA. Why the cornea swells. Journal of Theoretical Biology. 1971;33:419–427. doi: 10.1016/0022-5193(71)90090-7. [DOI] [PubMed] [Google Scholar]
- Hodson SA, Miller F. The bicarbonate ion pump in the endothelium which regulates the hydration of rabbit cornea. Journal of Physiology. 1976;263:563–577. doi: 10.1113/jphysiol.1976.sp011645. [DOI] [PMC free article] [PubMed] [Google Scholar]
- Jentsch TJ, Koch M, Bleckmann H, Wiederholt M. Effect of bicarbonate, pH, methazolamide and stilbenes on the intracellular potentials of cultured bovine corneal endothelial cells. Journal of Membrane Biology. 1984;78:103–117. doi: 10.1007/BF01869198. [DOI] [PubMed] [Google Scholar]
- Lane J, Wigham CG, Hodson SA. A chloride-activated Na(+)/HCO3(-)-coupled transport activity in corneal endothelial membranes. Biophysical Journal. 2000;78:2493–2498. doi: 10.1016/S0006-3495(00)76794-4. [DOI] [PMC free article] [PubMed] [Google Scholar]
- McCally RL, Farrell RA. Interaction of light and the cornea: light scattering versus transparency. In: Cavanagh HD, editor. The Cornea: Transactions of the World Congress on the Cornea III. New York: Raven Press Ltd; 1988. pp. 165–171. [Google Scholar]
- Maurice DM. The structure and transparency of the cornea. Journal of Physiology. 1957;136:263–286. doi: 10.1113/jphysiol.1957.sp005758. [DOI] [PMC free article] [PubMed] [Google Scholar]
- Meek KM, Fullwood NJ, Cooke PH, Elliott GF, Maurice DM, Quantock AJ, Wall RS, Worthington CR. Synchrotron X-ray diffraction studies of the cornea, with implications for stromal hydration. Biophysical Journal. 1991;60:467–474. doi: 10.1016/S0006-3495(91)82073-2. [DOI] [PMC free article] [PubMed] [Google Scholar]
- Mustonen J, Rovamo J, Nasanen R. The effects of grating area and spatial frequency on contrast sensitivity as a function of light level. Vision Research. 1993;33:2065–2072. doi: 10.1016/0042-6989(93)90005-h. [DOI] [PubMed] [Google Scholar]
- Quantock AJ, Meek KM, Chakravarti S. An X-ray diffraction investigation of corneal structure in lumican-deficient mice. Investigative Ophthalmology and Visual Sciences. 2001;42:1750–1756. [PubMed] [Google Scholar]
- Rovamo J, Kukkonen H, Mustonen J. Foveal optical modulation transfer function of the human eye at various pupil sizes. Journal of the Optical Society of America A. 1998;15:2504–2513. doi: 10.1364/josaa.15.002504. [DOI] [PubMed] [Google Scholar]
- Rovamo J, Mustonen J, Nasanen R. Two simple psychophysical methods for determining the optical modulation transfer-function of the human eye. Vision Research. 1994a;34:2493–2502. doi: 10.1016/0042-6989(94)90234-8. [DOI] [PubMed] [Google Scholar]
- Rovamo J, Mustonen J, Nasanen R. Modeling contrast sensitivity as a function of retinal illuminance and grating area. Vision Research. 1994b;34:1301–1314. doi: 10.1016/0042-6989(94)90204-6. [DOI] [PubMed] [Google Scholar]
- Stryer L. Biochemistry. 2. San Francisco: W. H. Freeman; 1981. p. 413. [Google Scholar]
- Wetherill G, Levitt H. Sequential estimation of points in a psychometric function. British Journal of Mathematical and Statistical Psychology. 1965;18:1–10. doi: 10.1111/j.2044-8317.1965.tb00689.x. [DOI] [PubMed] [Google Scholar]
- Winkler BS, Riley MV, Peters MI, Williams FJ. Chloride is required for fluid transport by the rabbit corneal endothelium. American Journal of Physiology. 1992;262:C1167–1174. doi: 10.1152/ajpcell.1992.262.5.C1167. [DOI] [PubMed] [Google Scholar]
- Worthington CR. The structure of cornea. Quarterly Reviews of Biophysics. 1984;17:423–451. doi: 10.1017/s003358350000487x. [DOI] [PubMed] [Google Scholar]