

Abstract
In anaesthetised animals, the very negative resting membrane potential of striatal spiny neurones (down state) is interrupted periodically by depolarising plateaux (up states) which are probably driven by excitatory input. In the absence of active synaptic input, as occurs in vitro, potassium currents hold the membrane potential of striatal spiny neurones in the down state. Because striatal spiny neurones fire action potentials only during the up state, these plateau depolarisations have been perceived as enabling events that allow information processing through cerebral cortex-basal ganglia circuits. Recent studies have demonstrated that the robust membrane potential fluctuation of spiny neurones is strongly correlated to the slow electroencephalographic rhythms that are typical of slow wave sleep and anaesthesia. To further understand the impact of cortical activity states on striatal function, we studied the membrane potential of striatal neurones during cortical desynchronised states. Simultaneous in vivo recordings of striatal neurones and the electrocorticogram in urethane-anaesthetised rats revealed that rhythmic alternation between up and down states was disrupted during episodes of spontaneous or induced cortical desynchronisation. Instead of showing robust two-state fluctuations, the membrane potential of striatal neurones displayed a persisting depolarised state with fast, low-amplitude modulations. Spiny neurones remained in this persistent up state until the cortex resumed ∼1 Hz synchronous activity. Most of the recorded neurones exhibited a low firing probability, irrespective of the cortical activity state. Time series analysis failed to reveal significant correlations between the membrane potential of striatal neurones and the desynchronised electrocorticogram. Our results suggest that during cortical desynchronisation continuous uncorrelated excitatory input sustains the membrane potential of striatal neurones in a persisting depolarised state, but that substantial additional input is necessary to impel the neurones to threshold. Our data support that the prevailing cortical activity state determines the duration of the enabling depolarising events that take place in striatal spiny neurones.
Most striatal medium spiny neurones (MSNs) display ‘up states’ in anaesthetised animals. Up states are perceived as temporal gates invoked by afferent input, during which MSNs are in a ‘ready-to-fire’ condition (Wilson, 1993). During up states the membrane potential (Vm) of MSNs displays high-frequency low-amplitude modulations, presumably of synaptic origin, that can eventually provoke action potential firing (Stern et al. 1997, 1998). There is convincing evidence supporting that up states are driven by excitatory input from the cerebral cortex and thalamus. First, decortication forces the Vm of MSN neurones into a continuous down state (Wilson, 1993). Second, MSNs exhibit a persistent down state in acute brain slices, but display two-state transitions in chronic organotypic cortex-striatum cocultures (Plenz & Aertsen, 1996). Third, in anaesthetised rats, corticostriatal neurones exhibit two-state Vm fluctuations that closely resemble those occurring in MSNs (Stern et al. 1997). In the absence of excitatory input, potassium inwardly rectifying currents hold the Vm of MSNs close to the potassium equilibrium potential (reviewed by Wilson, 1993; Nicola et al. 2000).
Recent findings revealing a strong correlation between a slow (≈1 Hz) high-amplitude rhythm in the frontal electroencephalogram (EEG) and Vm fluctuations in striatal MSNs (Mahon et al. 2001; Tseng et al. 2001), further indicate that up states are induced by strongly synchronous afferent input. The EEG waveform, which reflects population activity of cortical neurones, exhibits disparate shapes depending on vigilance states, sensory input and level of anaesthesia (reviewed by Steriade, 2000). The ≈1 Hz EEG oscillation is produced by a widespread synchronisation of the thalamocortical network that is typical of slow wave sleep and anaesthesia. When the activity of cortical neurones becomes temporally and spatially uncorrelated the EEG shows a desynchronised (low-amplitude, high-frequency) pattern (Steriade et al. 2001). If the two-state Vm of MSNs reflects rhythmic variations of activity in large populations of cortical neurones, it seems very likely that it should be disturbed during EEG desynchronisation.
In order to gain insight into how different cortical activity patterns impact on the Vm of MSNs, we performed in vivo intracellular recordings of striatal neurones while disrupting cortical synchronisation by electrical stimulation of the mesopontine tegmentum (MPT; Moruzzi & Magoun, 1949) in urethane-anaesthetised rats. In addition, we examined the Vm of striatal neurones during episodes of cortical desynchronisation that take place spontaneously, or can be induced by sensory stimulation, in urethane-anaesthetised animals (Contreras & Steriade, 1997; Hunter & Milsom, 1998; Magill et al. 2000). Furthermore, we assessed whether the effects of MPT stimulation required the integrity of the nigrostriatal projection, by performing additional experiments in rats bearing chronic lesions of mesencephalic dopamine neurones.
Part of this work has been presented in abstract form (Kasanetz et al. 2001).
Methods
Adult male Sprague-Dawley rats were maintained on a 12:12 h light/dark cycle, with food and tap water available ad libitum, until the time of the experiment. The experimental protocols were approved by the Secretary of Science and Technology, Argentine National Ministry of Health. The day of the experiment the rats were anaesthetised with urethane (1.2 g kg−1, i.p.), treated with a local anaesthetic on the scalp and pressure points, and secured to a stereotaxic frame. Temperature was maintained between 36–37 °C with a servo-controlled heating pad (Fine Science Tools, Vancouver, Canada). Additional urethane was administered throughout the experiment as necessary in order to maintain a constant level of anaesthesia, as determined from electrocorticographic recordings and evaluation of the hindlimb withdrawal reflex (customarily, supplements of 0.4 g kg−1s.c. every 3–4 h).
A concentric bipolar stimulating electrode (SNE-100, Better Hospital Equipment, New York, USA) placed in the MPT (1 mm anterior to lambda, L: 2.0 mm, 7.5 mm below cortical surface, Paxinos & Watson, 1997) allowed the delivery of 200–800 μA, 300 μs pulses in trains lasting 0.3-0.5 s (at 50 Hz) (Nuñez, 1996) (Fig. 1). An additional concentric bipolar electrode was located in the frontal cortex (3 mm anterior to bregma, L: 2.0 mm, 3.0 mm below the cortical surface) to obtain a differential electrocorticographic (ECoG) recording (Tseng et al. 2001) (Fig. 1). The cortical signal was filtered (0.1-300 Hz), amplified (ER-98, NeuroData, Delaware Water Gap, PA, USA; Lab1, AKONIC, Argentina), and sent to an A-D converter (DigiData 1200, Axon Instruments, Union City, CA, USA). Intracellular recordings were obtained as described before (Tseng et al. 2001) from a striatal region located 1.0 mm anterior to bregma, 2.5-3.0 mm lateral to the midline, and 3.0-5.0 mm below the cortical surface (Paxinos & Watson, 1997). This striatal region receives a projection from the cortical area in which the ECoG recording electrode was placed (McGeorge & Faull, 1989). The ECoG electrode was placed in the ipsilateral frontal cortex, while the MPT electrode was placed either in the ipsilateral (6/13 experiments) or contralateral tegmentum (7/13 experiments). During some experiments peripheral sensory stimuli were delivered, either in the form of pressure applied manually to the hindlimb or pinna with a clamp, or as pressure applied to the tail with a custom-made instrument consisting of a clamp driven by an electromagnet.
Figure 1. Electrode placement and neuronal labelling.
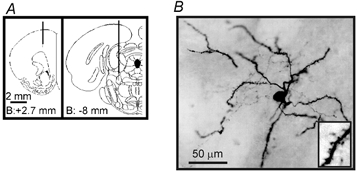
A, diagrams of coronal sections of the rat brain (Paxinos & Watson, 1997) showing the localisation of the ECoG recording electrode (left) and the mesopontine region stimulation electrode (right). B, photomicrograph of one of the recorded neurones, labelled with neurobiotin, displaying the characteristic features of striatal spiny neurones (inset: dendritic spines).
The intracellular microelectrodes were filled with 2 m potassium acetate and 2 % neurobiotin (RBI, Natick, MA, USA), and had a resistance ranging from 60 to 130 MΩ. The recorded signal was sent to a conventional bridge amplifier (IR-283, NeuroData) and an A-D converter. The microelectrode was slowly advanced with a hydraulic micromanipulator through the striatum until a neurone was impaled. The recordings fulfilled previously published quality criteria (Tseng et al. 2001). Input resistance was estimated from the Vm measured 80–90 ms after the onset of small amplitude hyperpolarising or depolarising (subthreshold) current pulses. The signals were acquired with Axoscope 1.1 (Axon Instruments) at a sampling rate of 10 kHz. After completion of the experimental manipulations, we attempted to label the neurones with neurobiotin (Kita & Armstrong, 1991). The rats then received a lethal dose of urethane and were transcardially perfused with cold saline followed by 4 % paraformaldehyde in phosphate buffered saline (PBS). The brain was removed, stored overnight in the same fixative, and then, incubated in 0.1 m PBS containing 15 % sucrose for 24–48 h. The localisation of the extracellular recording and stimulation sites was determined from Nissl-stained sections. Neurobiotin was revealed as described before (Tseng et al., 2001).
In order to assess the role of the nigrostriatal projection on the effects induced by MPT stimulation, we performed experiments in rats with unilateral 6-hydroxydopamine (6-OHDA)-induced lesions. The lesions were made and evaluated as described before (Tseng et al. 2001). Briefly, the rats were anaesthetised with sodium pentobarbital (50 mg kg−1, i.p.), treated with local anaesthetic and fixed into a stereotaxic frame as described above. 6-OHDA hydrobromide (Sigma, St Louis, MO, USA; 8 μg free base in 4 μl of 0.1 % ascorbic acid) was injected at the medial forebrain bundle (stereotaxic coordinates: 4.3 mm posterior to bregma, L: 1.6 mm, 8.3 mm below the cortical surface; Paxinos & Watson, 1997). The animals were monitored during their recovery from anaesthesia. The effectiveness of the lesion was evaluated with the stepping test (Olsson et al. 1995) 2 weeks after the lesion, and confirmed postmortem by means of immunohistochemistry for tyrosine hydroxylase (Tseng et al. 2001). Simultaneous recordings of striatal neurones and the ECoG, which were performed 6–10 weeks after the lesion under urethane anaesthesia, as described above, were obtained from the lesioned hemisphere, with the MPT electrode located either in the ipsilateral (2/5 experiments) or contralateral (3/5 experiments) side.
Signal segments showing spontaneous or evoked ECoG transitions between highly synchronised and desynchronised states were selected for the study. To simplify time series analysis, sampling was reduced to 333 Hz by using the substitute average module of Axoscope. For each neurone studied, four epochs in the synchronised state and four in the desynchronised state were analysed and their results averaged. The duration of the epochs varied from 6 to 30 s depending on the availability of recording periods showing a desynchronised ECoG, which varied among animals. In order to ascertain the typical two-state Vm of striatal neurones, we constructed histograms displaying the amount of time spent at any given Vm (all-points histograms, pCLAMP 6, Axon Instruments; Tseng et al. 2001). For histograms fitting a dual-Gaussian function, the mode inside each Gaussian series of values was considered to represent the steady-state reached during the down and up states. The degree of correlation for each ECoG-intracellular recording pair was evaluated by constructing cross-correlograms, and by means of spectral analysis and coherence estimation (Lopes da Silva et al. 1989). Cross-correlograms were computed for delays of 3 s with a resolution of 3 ms. Peaks exceeding three correlated white noise standard errors were considered significant. The down-sampled signal epochs were further subjected to a fast Fourier transform (FFT). Spectral densities were obtained using a Hamming window (width = 5), and relative power was calculated by normalisation to the total power within the frequency range 0–15 Hz. The ratio between the relative powers in the low (≤ 2 Hz) and high (> 2 Hz) frequency ranges of the ECoG power spectra was considered as an index of the degree of cortical synchronisation. Coherence was calculated from the cross-spectral density between the two signals normalised by the spectral density of each signal. Coherence attains its highest value when the phase shift and ratio between the amplitudes of the two waveforms remains constant. A significant coherence (> 0.66 after averaging the coherence spectra of four disjoined signal segments; Rosenberg et al. 1989; Halliday et al. 1995) at the dominant frequency of the cross-spectrum, was accepted as an indication of a high probability of oscillatory synchronisation, and allowed estimation of the phase relationship between the signals. Phase lags were calculated from portions of the phase spectrum encompassing the frequencies showing a significant coherence and a linear phase relationship between the signals (Lopes da Silva et al. 1989). We also tried to characterise the high frequency components in the signals by time series analysis. With this purpose, cross-correlograms and power spectra were computed from signal epochs 0.5-1 s long (down-sampled to 5000 Hz), in order to gain resolution in the high frequency band and reduce the impact of the powerful low-frequency components of the signals. Cross-correlograms were computed for delays of 200 ms with a resolution of 0.2 ms, and relative power spectra analysed in the frequency range 0–100 Hz. Time series analysis was performed using Statistica 4.2 (Statsoft Inc., Tulsa, OK, USA). Since the ECoG was high-pass filtered at 0.1 Hz, time lags were corrected using a series of coefficients, which were derived from measurements of the phase lag introduced by the filter to digitally generated sinusoidal waveforms (with a 0.1 Hz resolution) (Tseng et al. 2001).
Aiming to estimate the time of transitions between synchronised and desynchronised signal states, we computed the variance of voltage values for 2 s-long time-windows, in 200 ms steps, all along the time series containing the transitions induced by MPT stimulation. We reasoned that the variance of consecutive time-windows would be oscillating around a steady value during ECoG desynchronisation, that it would increase during the transition to a synchronised state, and then it would begin to oscillate around a new steady value when the ECoG was fully synchronised. Window duration was selected as to include at least one cycle of the ≈1 Hz slow oscillation of the ECoG (in order to maximise the variance during synchronised states), and the time-lag used to slide the window, as to provide a convenient temporal resolution. A sigmoid function:
where A1 and A2 are the initial and final values of the time series, P is the power and x0 is the centre of the function, was adjusted to the variance values, and the time of transitions between synchronised and desynchronised states fixed at the inflection point of the function (x0).
Statistical comparisons
For comparisons involving a single continuous variable, Student's t test or an ANOVA was used, depending on the number of data sets to be compared. If the data were not normally distributed, had unequal variances, or the number of observations were small, the Wilcoxon signed-rank test, or a Kruskal-Wallis ANOVA was used instead of the parametric tests.
Results
The basic electrophysiological properties of the recorded striatal neurones were similar to those previously reported by Tseng et al. (2001) (action potential amplitude: 46.8 ± 1.9 mV; action potential duration: 0.91 ± 0.06 ms; threshold: −54.4 ± 1.2 mV; input resistance during the down state: 38.1 ± 2.8 MΩ; duration of the recordings 46 ± 7 min). The neurones that were successfully labelled with neurobiotin displayed the typical features of MSNs (Fig. 1).
The ECoG of urethane-anaesthetised rats was dominated by the low-frequency (≈1 Hz), high-amplitude rhythm (Figs 2, 3 and 5–7), commonly named ‘slow oscillation’ (Steriade, 2000). In good agreement with previous reports (Tseng et al. 2001) the Vm of striatal neurones alternated rhythmically between down and up states, in consonance with the slow oscillation in the frontal ECoG. Time series analysis revealed that the signals were oscillating synchronously (Fig. 2 and Fig. 3; Table 1) (Tseng et al. 2001). In some instances (n = 7 neurones in six rats), episodes of spontaneous cortical desynchronisation occurred during long-lasting simultaneous recordings of the frontal ECoG and the Vm of a striatal neurone. During each of these recordings, the ECoG suffered several episodes of desynchronisation of variable length (Figure 2), lasting from a few seconds to a few minutes. During an episode of ECoG desynchronisation, the amplitude of the ECoG decreased and its frequency increased, yielding a several-fold reduction in the low/high relative power ratio of the ECoG power spectra (Table 1). All instances of spontaneous ECoG desynchronisation resulted in a disruption of the two-state Vm of striatal neurones (Fig. 2). Three of these neurones were successfully injected with neurobiotin and displayed the typical morphology of MSNs, with dendrites covered with spines.
Figure 2. Spontaneous cortical desynchronisation.
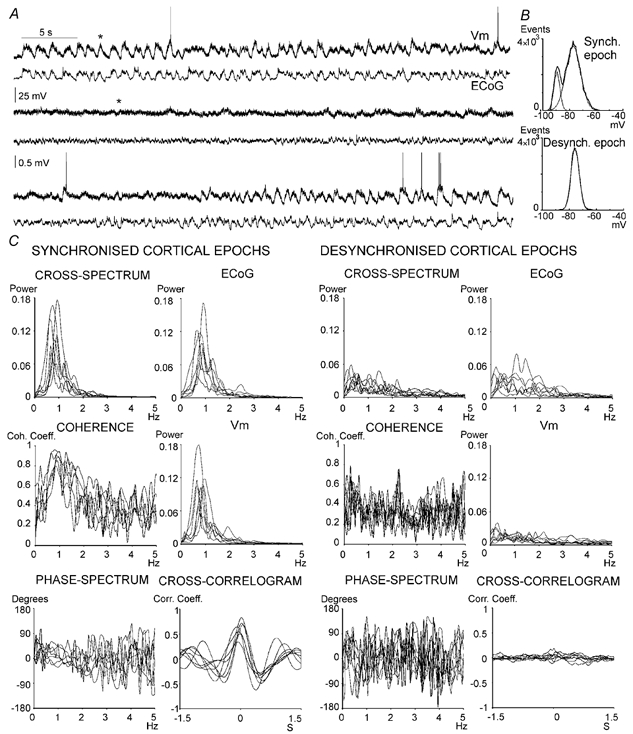
A, representative segment of signal showing spontaneous shifts between synchronised and desynchronised ECoG patterns in a urethane-anaesthetised rat. Note the strong correlation between the high-amplitude Vm fluctuations of striatal neurones and the slow rhythmic activity of the frontal ECoG. The typical two-state membrane potential of striatal neurones was disrupted during periods of ECoG desynchronisation, in some instances for more than 30 s. B, all-points histograms depicting the profile of Vm values during representative synchronised (above) and desynchronised (below) ECoG epochs. The samples used for these plots were taken from epochs marked with an asterisk in A. C, the graphs depict ECoG and Vm power spectra, cross-amplitude and coherence spectra, and cross-correlograms, during different cortical activity states (left: synchronised ECoG; right: desynchronised ECoG). The spectra have been cut at 5 Hz to facilitate scrutiny of the ≈1 Hz components in the signals, which represent the slow oscillation in the ECoG and transitions between up and down states in striatal neurones. In each graph, each data series represents a single ECoG-Vm pair (n = 7 recording pairs), where each data series resulted from averaging information obtained from four signal epochs. Note the elevated coherence of the seven pairs when the ECoG displays the ≈1 Hz rhythm.
Figure 3. Desynchronisation induced by MPT stimulation.
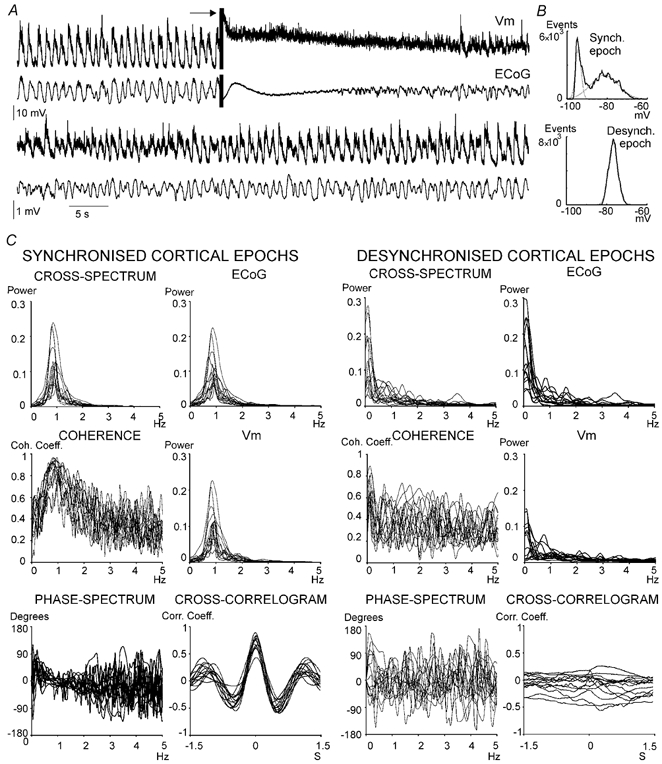
A, disruption of the slow frontal ECoG rhythm by electrical stimulation of the mesopontine tegmentum was accompanied by a change in the shape of the striatal neurone Vm, that shifted from the typical two-state profile to a low-amplitude high-frequency pattern. The arrow points to the stimulus artefact. In this experiment the mesopontine electrode was located in the side contralateral to the recording electrodes. B, all-points histograms depicting the profile of Vm values during representative synchronised (above) and desynchronised (below) ECoG epochs, taken from the signal depicted in A. C, the quantitative changes induced by mesopontine stimulation are evident in the spectra and cross-correlograms displayed below the signals (left: activity under a synchronised ECoG; right: activity under a desynchronised ECoG), which summarise findings from fourteen ECoG-Vm pairs. See Fig. 2 for details. The very low frequency components in the desynchronised ECoG power spectra are related to the stimulus artefact.
Figure 5. Quantitative assessment of the time difference between the recovery of ECoG synchronisation and two-state Vm transitions after MPT stimulation.
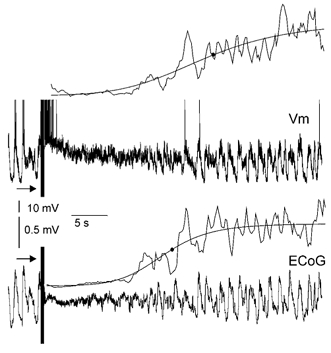
The arrows indicate the artefact produced by MPT stimulation, which is followed by an episode of ECoG desynchronisation and disruption of two-state transitions in the striatal neurone. The action potentials were truncated at −20 mV. A sigmoid function was adjusted to the variance curves depicted above each signal (see Methods for details). The centre of each sigmoid function is indicated with a dot. In the example depicted, the ECoG reached a steady ≈1 Hz rhythm 6 s before the Vm of the striatal neurone resumed a stable two-state behaviour.
Figure 7. Results from 6-OHDA-lesioned rats and ECoG suppressions.
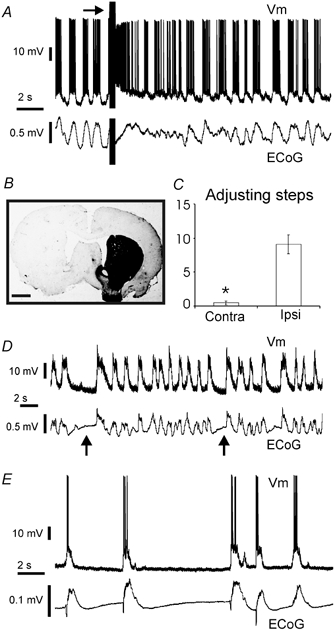
A, mesopontine region stimulation produced ECoG desynchronisation with concomitant disruption of the two-state Vm of a striatal neurone in a 6-hydroxydopamine-lesioned rat. In this experiment the mesopontine region electrode was placed in the same side of the recordings and lesion. B, tyrosine hydroxylase immunohistochemistry revealed a severe destruction of the nigrostriatal projection in 6-hydroxydopamine-lesioned rats. Calibration bar: 1.5 mm. C, the stepping test demonstrated a severe akinesia of the forelimb contralateral (contra) to the 6-hydroxydopamine-induced lesion (* P < 0.05, Wilcoxon signed-rank test). D, a synchronised ECoG displaying short ‘suppressions’ (arrows). Note the correspondence between the duration of suppressions and down states. E, a typical burst-suppression ECoG in a deeply anaesthetised rat. Up states in the striatal neurone occurred concomitantly with outburst of cortical activity.
Table 1.
Summary of the analysis of simultaneous recordings from striatal neurones and the frontal cortex electrocorticogram
| Synchronised ECoG | Desynchronised ECoG | |
|---|---|---|
| Spontaneous desynchronisation | ||
| Ratio between relative powers in the low (≤ 2 Hz) and high frequency ranges of the ECoG spectra | 9.45 ± 2.4 | 1.9 ± 0.3* |
| Coincident oscillatory frequency estimated from the cross-spectrum (Hz) | 0.78 ± 0.05 | |
| Coherence | 0.83 ± 0.05 | |
| Phase lag estimated from the phase spectrum (ms) | −6.30 ± 32.00 | |
| Coincident oscillatory frequency estimated from the cross-correlogram (Hz) | 1.00 ± 0.01 | |
| Correlation coefficient | 0.59 ± 0.06 | |
| Phase lag estimated from the cross-correlogram (ms) | −25 ± 20 | |
| Induced desynchronization | ||
| Ratio between relative powers in the low (≤ 2 Hz) and high frequency ranges of the ECoG spectra | 11.6 ± 1.6 | 3.4 ± 0.9** |
| Coincident oscillatory frequency estimated from the cross-spectrum (Hz) | 0.90 ± 0.02 | |
| Coherence | 0.88 ± 0.02 | |
| Phase lag estimated from the phase spectrum (ms) | −41.49 ± 16.15 | |
| Coincident oscillatory frequency estimated from the cross-correlogram (Hz) | 0.99 ± 0.02 | |
| Correlation coefficient | 0.70 ± 0.03 | |
| Phase lag estimated from the cross-correlogram (ms) | −48 ± 7 | |
Data are mean ± s.e.m. of seven neurones recorded from six rats (spontaneous desynchronisation) or 14 neurones recorded from 13 rats (desynchronisation induced by MPT stimulation).
P < 0.01, Wilcoxon signed-rank test for repeated measures.
P < 0.01, Student's t test for repeated measures. Phase lags were expressed with the same sign for estimations performed from cross-correlograms and phase spectra to facilitate comparisons. Negative implies that the ECoG preceded the intracellular recording.
Electrical stimulation of the MPT provoked episodes of ECoG desynchronisation lasting several seconds, as reported before (Moruzzi & Magoun, 1949; Steriade et al. 1991; Munk et al. 1996; Nuñez, 1996; Steriade et al. 1996; Contreras & Steriade, 1997; Herculano-Houzel et al. 1999). The episodes ended smoothly, as the cortex progressively resumed the ≈1 Hz oscillation (Figs 3, 5 and 6A). During the episodes of desynchronisation (n = 14 cells in 13 rats), striatal neurones exhibited a continuously depolarised Vm, with low-amplitude high-frequency modulations, yielding a nearly symmetric distribution in the all-points histogram (Fig. 3). The distribution of Vm values fitted a single Gaussian function, with a mean voltage that was close to that registered during the up states (Fig. 4). No differences were noticed between the effects of stimulating the ipsi- or contralateral MPT (Figs 3, 5 and 6A). Striatal neurones did not recover a typical two-state Vm until the cortex had resumed the slow oscillatory rhythm. Usually, the slow rhythm regained the frontal cortex some seconds before the reappearance of two-state fluctuations in striatal neurones (Figs 2, 3, 5 and 6). A quantitative estimation of the time difference between the recovery of ECoG synchronisation and two-state Vm transitions indicated that the ECoG recovered 7.5 ± 2.4 s earlier (mean ± s.e.m.; n = 14; Fig. 5). Increasing MPT stimulation current resulted in episodes of ECoG desynchronisation of increasing length, and in concomitantly longer periods of sustained depolarisation in striatal neurones (Fig. 6A). Six of the 14 studied neurones were identified as MSNs by means of neurobiotin labelling.
Figure 6. Special features of desynchronisation induced by MTP or sensory stimulation.
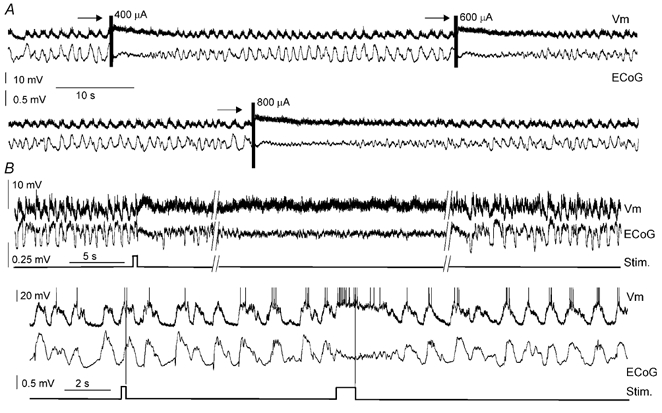
A, episodes of ECoG desynchronisation evoked by electrical stimulation of the MPT (arrows). Increasing stimulation current produced episodes of desynchronisation of increasing length, associated with persistent up states of increasing duration. B, a short duration sensory stimulus (pressure applied to the tail) produced a long lasting episode of ECoG desynchronisation and concomitant disruption of two-state transitions in a striatal neurone (above). In another rat (below), a brief pressure applied to the tail, that failed to desynchronise the ECoG, did not produce noticeable changes in the Vm of the recorded striatal neurone, while a sustained pressure produced a brief episode of ECoG desynchronisation associated to disruption of two-state transitions in the striatal neurone. The vertical lines in the recordings are artefacts introduced by the stimulation device. The action potentials were truncated at −20 mV.
Figure 4. Membrane potential during up states, down states and persistent depolarisations.
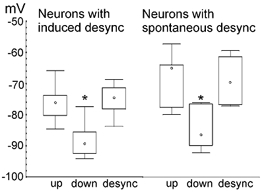
Box plots showing the median Vm (circles), 25th and 75th percentiles (bar limits), and range (error bars), during up states, down states and the sustained depolarisations (desync) observed during spontaneous (right; n = 7) or induced (left; n = 14) ECoG desynchronisation. The Vm during down states differed significantly from values of up states and persistent depolarisations (* P < 0.05, Tukey's test after a significant one-way ANOVA for repeated measures (induced desynchronisation) or Dunn's method after a significant Kruskal-Wallis ANOVA by ranks (spontaneous desynchronisation)). There were no significant differences between the corresponding Vm values of spontaneous and induced desynchronisations (Kruskal-Wallis ANOVA by ranks).
We further explored the effect of sensory stimulation on the relationship between cortical activity states and the Vm of striatal neurones (Fig. 6B). Short-lived episodes of ECoG desynchronisation induced by mechanical stimulation of the pinna, hindlimb or tail, were invariably associated to a disruption of the two-state Vm of the recorded striatal neurone (n = 8 neurones in seven rats). Disruption of the two-state Vm did not occur unless the stimulus was effective for desynchronising the frontal ECoG. When the ECoG was desynchronised by the stimulus, the disruption of the two-state Vm persisted for as long as frontal ECoG desynchronisation lasted. Usually, ECoG desynchronisation and the concomitant change in the Vm of the recorded striatal neurone outlasted the effect of the stimulus. Indeed, when a brief sensory stimulus produced a long-lasting ECoG desynchronisation, the recorded striatal neurone exhibited a long lasting depolarised state (Fig. 6B).
The MPT sends a strong projection to the substantia nigra pars compacta (Oakman et al. 1995, 1999). Hence, the effects of MPT stimulation may be mediated by the nigrostriatal projection. We examined the effects of stimulating the MPT in rats bearing 6-hydroxydopamine-induced lesions, and found that MPT stimulation was still able to evoke ECoG desynchronisation with concomitant disruption of two-state Vm fluctuations in striatal neurones (n = 5 neurones in five rats; Fig. 7A). The lesioned rats displayed a strong contralateral forelimb akinesia, as revealed by the stepping test, and an almost complete absence of tyrosine hydroxylase immunoreactive fibres in the striatum from which the neurones were recorded (Fig. 7B and C). A fortuitous observation provided further evidence against the involvement of the nigrostriatal projection in the effects induced by MPT stimulation. In one non-lesioned rat the MPT electrode was accidentally misplaced (it was located in the substantia nigra contralateral to the recording side) and failed to desynchronise the ECoG. The striatal neurone recorded in this rat continued to display up-down transitions despite strong stimulation of the contralateral substantia nigra, suggesting that current spread to the ventral mesencephalon cannot account for effects induced by MPT stimulation (not shown).
The conclusion that the two-state Vm of striatal neurones is related to the pattern of cortical activity is further supported by recordings obtained under very deep anaesthesia, which is characterised by an EEG pattern named ‘burst-suppression’. The burst-suppression EEG consists of periods of isoelectric recording interrupted by outbursts of high-amplitude slow waves (Niedermeyer et al. 1999). Striatal neurones (n = 4) displayed down states coinciding with the periods of isoelectric ECoG recording, and typical up states accompanying the outbursts of cortical activity (Fig. 7D and E).
Striatal MSNs display a very low firing probability, even during the up states. During periods of ECoG desynchronisation, firing probability remained low in most of the recorded neurones regardless of the sustained depolarisation. Only 4/7 neurones recorded during episodes of spontaneous desynchronisation, and 5/14 neurones recorded during desynchronisation induced by MPT stimulation, fired action potentials spontaneously. Spontaneous firing occurred during episodes of cortical desynchronisation when fast depolarising potentials reached threshold. We tried to quantitatively characterise the high frequency modulations exhibited by the Vm of striatal neurones during periods of ECoG desynchronisation, but their broad frequency range and waxing and waning nature produced unreliable profiles in the power spectra (Fig. 8). Some of the analysed epochs exhibited coincident peaks in the ECoG and Vm power spectra, with a moderate to high coherence, but after averaging four disjoined epochs the spectral peaks were degraded and coherence did not reach statistical significance. Cross-correlograms of the same epochs exhibited weak or no modulations (Fig. 8). Visual analysis of the traces indicated that fast Vm modulations had frequencies ranging from 20 to 80 Hz. Remarkably, fast Vm modulations of similar aspect were observed during the up states, as reported before (Stern et al. 1997).
Figure 8. Correlation between the ECoG and Vm at high frequencies.
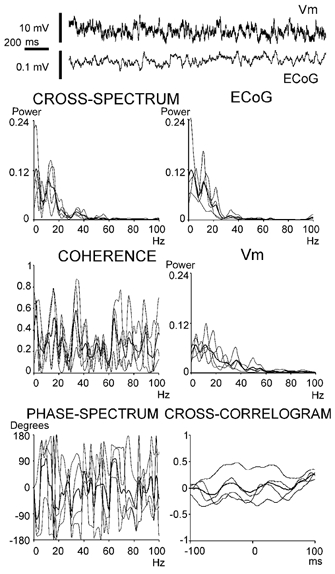
During episodes of ECoG desynchronisation, the Vm of striatal neurones displayed low-amplitude high-frequency modulations that varied in frequency within short time-windows (above). The graphs depict time series analysis of four disjoined 500 ms epochs (thin lines) of a single ECoG-Vm pair (two of the epochs were obtained from the signal segment displayed above). Thick lines are averages of the four epochs. Note that for individual epochs coherence might attain high values (i.e. peaks at 15 and 34 Hz with coherence > 0.8) but the mean coherence did not reach significance (coherence > 0.66; Halliday et al. 1995). The mean cross-correlation displayed a weak modulation at 15 Hz and no evidence of 34 Hz oscillation.
Discussion
The prevailing pattern of cortical activity shapes the Vm of striatal medium spiny neurones
Potassium inwardly rectifying currents hold the Vm of MSNs close to the potassium equilibrium potential during the down state. When opposed by correlated excitatory input, the influence of potassium inwardly rectifying currents decreases, other voltage-dependent cation currents become dominant, and the MSN enters the up state (Wilson, 1993; Nicola et al. 2000). Recent studies (Mahon et al. 2001; Tseng et al. 2001) have demonstrated a strong correlation between two-state fluctuations in MSNs and a ≈1 Hz cortical rhythm that reflects a strong synchronisation of the thalamocortical network (Steriade, 2000), further supporting that up states are driven by synchronous synaptic input (Wilson & Kawaguchi, 1996; Stern et al. 1997). In this manuscript we report the effect of disrupting cortical synchronisation on the Vm of MSNs. In anaesthetised rats, cortical desynchronisation might occur spontaneously, or can be induced by sensory stimulation or electrical stimulation of the MPT (Moruzzi & Magoun, 1949; Steriade et al. 1991; Munk et al. 1996; Hunter & Milsom, 1998; Magill et al. 2000). The episodes of spontaneous and induced cortical desynchronisation that take place in anaesthetised animals have been extensively used as models for the study of cortical activated states (Steriade et al. 1991, 1996; Munk et al. 1996; Nuñez, 1996; Contreras & Steriade, 1997; Herculano-Houzel et al. 1999; Magill et al. 2000).
Rhythmic alternation between up and down states was observed only in animals displaying a strongly synchronised frontal ECoG, and was tightly correlated to the ECoG waveform. When the power of the ECoG low-frequency components decreased spontaneously, the alternating two-state Vm of striatal neurones was substituted by a steadily depolarised Vm, showing fast, low-amplitude modulations, which were not correlated to the ECoG. Sensory stimuli delivered to different body parts did not modify the two-state Vm of MSNs unless the frontal ECoG became desynchronised; provided that the ECoG were desynchronised, the Vm remained depolarised until the ECoG resumed ≈1 Hz synchronous activity. Finally, ECoG desynchronisation induced by MPT stimulation was invariably associated to an abrupt disruption of Vm fluctuations in MSNs. A quantitative assessment of the time elapsed between recovery of the ≈1 Hz ECoG rhythm and two-state Vm transitions revealed that the cortical slow oscillation recovered, on average, several seconds earlier than two-state Vm alternation.
Additional evidence supporting that two-state Vm fluctuations are driven by alternating periods of strong and weak cortical input was obtained from recordings performed under very deep anaesthesia. In rats with a burst-suppression ECoG, typical transitions from down to up states occurred concomitantly with the beginning of outbursts of cortical activity. Recent findings by Mahon et al. (2001) support our conclusion. In rats under neurolept-analgesia, a pharmacologically induced state produced by the combined administration of haloperidol plus fentanyl, the EEG displayed a disorganised pattern, and the Vm of striatal neurones showed low-amplitude modulations that did not correlate with the EEG waveform.
The present results indicate that, in vivo, the shape of the Vm of MSNs is strongly related to the prevailing pattern of cortical activity. When the cerebral cortex is dominated by the ≈1 Hz oscillation, up states are rhythmic and have the archetypal shape that has been widely illustrated in the literature. During EEG desynchronisation, cortical neurones exhibit irregular firing at high rates (Steriade et al. 2001). Continuous impinging of uncorrelated excitatory input might have maintained MSNs in the ‘persistent up state’ observed during ECoG desynchronisation in our experiments. Individual corticostriatal axons provide synaptic contacts to hundreds to thousands of MSNs, while each MSN receives contacts from thousands of corticostriatal neurones (Cowan & Wilson, 1994). Hence, corticostriatal input may provide the kind of sustained synaptic barrage proposed to hold the Vm of MSNs above the down state during ECoG desynchronisation.
Because our data originate from urethane-anaesthetised animals, it remains to be determined to what extent our conclusions can be generalised to other circumstances. It has been reported that the Vm of MSNs exhibits a higher variability in non-anaesthetised than in anaesthetised animals, a fact that is consistent with the idea that changes in the cortical activity state settle the shape of the MSN Vm. Two-state transitions have been observed in locally anaesthetised neuromuscularly blocked rats, in which up states can last several seconds (Wilson & Groves, 1981; Wilson, 1993), and Hull et al. (1970) reported that the resting Vm of caudate nucleus neurones suffer depolarising shifts lasting ‘several seconds to minutes’, during which the cells might spontaneously fire action potentials, in non-anaesthetised neuromuscularly blocked cats. Our present findings suggest that the persistent up states observed in striatal neurones of non-anaesthetised animals might have been driven by episodes of cortical desynchronisation.
On the basis of our results, a contribution of striatal afferents other than the corticostriatal projection to the effect of MPT stimulation cannot be completely ruled out. The MPT projects to the substantia nigra pars compacta and thalamus (Sofroniew et al. 1985; Nakano et al. 1990; Oakman et al. 1995, 1999), structures from which direct projections to the striatum arise. The striatum itself receives a sparse innervation from the MPT (Saper & Loewy, 1982; Nakano et al. 1990). Nevertheless, we favour the view that the effects of MPT stimulation were primarily mediated by activation of the thalamocortical network, because: (i) stimulation of the contralateral MPT was as effective as ipsilateral stimulation in disrupting ECoG synchronisation and two-state transitions in MSNs, while projections from the MPT to the basal ganglia are mainly ipsilateral (Nakano et al. 1990; Oakman et al. 1995); (ii) ECoG desynchronisation and disruption of the two-state fluctuation could be induced by MPT stimulation in rats displaying an almost complete loss of striatal dopaminergic fibres. A recent study by Oakman et al. (1999) revealed that all MPT cholinergic neurones projecting to the substantia nigra also project to the thalamus, suggesting that actions of the MPT on the substantia nigra should not be dissociated from actions on the thalamocortical network.
Do different cortical activity states propitiate information processing through striatal gates having different temporal features?
Because of the technical limitations that make it difficult to obtain intracellular recordings from behaving animals, the physiological significance of two-state alternation in striatal neurones remains largely unknown. Nevertheless, the physiological relevance of our findings can be analysed within two different, not necessarily incompatible, contexts.
On one hand, the slow ≈1 Hz EEG oscillation and the desynchronised EEG have been related to slow wave sleep and alertness respectively (Steraide, 2000; Steriade et al. 2001). In this context, MSNs might be seen as behaving very much like principal cortical neurones during different cortical activity states. Under anaesthesia or natural slow wave sleep, principal cortical neurones display robust high-amplitude low-frequency Vm modulations which are strongly correlated to the prevalent ≈1 Hz EEG rhythm, but they exhibit a sustained depolarisation during EEG desynchronisation, both in anaesthetised and non-anaesthetised non-neuromuscularly blocked animals (Steriade, 2000; Steriade et al. 2001).
On the other hand, up states have been perceived as temporal gates invoked by excitatory input, during which MSNs are enabled to translate afferent activity into the patterns of action potentials that underlie sensorimotor and cognitive operation (O'Donnell & Grace, 1995; Stern et al. 1998; Suri et al., 2001). Stern et al. (1997, 1998; see also O'Donnell & Grace, 1995) proposed that specific cortical input embedded within the ‘enabling’ cortical signal produces the high-frequency Vm modulations in the top of the up states that provoke MSN firing. Hence, our data might be seen as revealing two extreme behaviours of the MSN Vm that reflect different features of the enabling input signal. In this context, the prevailing cortical activity state would define the temporal features of the striatal gate involved in the analysis of specific cortical input. In a striatal region overwhelmed by a cortical desynchronised area, the striatal gate would remain open for as long as the cortex remains desynchronised.
In alert animals some behavioural activities are related to singular patterns of cortical activity. It is well known that the hippocampus displays a slow field potential oscillation during exploratory activity and bar pressing in rats (Feder & Ranck, 1973). Interestingly, up states in nucleus accumbens MSNs are driven by a rhythmic ≈1 Hz hippocampal input in chloral hydrate anaesthetised rats (Goto & O'Donnell, 2001), and pairs of simultaneously recorded accumbens and hippocampal units exhibit synchronous rhythmic firing in behaving rats (Tabuchi et al. 2000), although at higher frequencies (theta band). There is evidence indicating that MSNs can sustain rhythmic alternation between depolarised and hyperpolarised states at frequencies well within the theta band range, as occurs during barbiturate anaesthesia (Calabresi et al. 1990). Indeed, the ≈5 Hz EEG rhythm that distinguishes barbiturate anaesthesia seems to drive the ≈5 Hz Vm modulation in MSNs (Mahon et al. 2001). It is also known that striatal neurones can exhibit sustained firing for several seconds in behaving animals (Apicella et al. 1992; Shultz & Romo, 1992; Boussaoud & Kermadi, 1997). Schultz & Romo (1992) showed that monkey caudate/putamen neurones display sustained activations lasting 30 s or more during a delayed response task. Increasing delays resulted in activations of increasing length. The authors noticed that sustained neuronal activity related to movement preparation progresses in large areas of the frontal cortex and caudate/putamen concurrently, but it begins slightly earlier in the cerebral cortex (Romo & Schultz, 1992; Shultz & Romo, 1992). Even though it will be necessary to perform intracellular recordings in awake animals to determine to what extent our findings can be generalised to natural conditions, it is tempting to speculate that persistent up states underlay the sustained activations of striatal neurones that take place during behavioural tasks requiring unremitting cortical activity.
The excitability of MSNs depends on intrinsic membrane currents that are strongly modulated by dopamine receptors and exhibit elaborate voltage-dependent activation and inactivation kinetics (Nicola et al. 2000). Because of their voltage-dependence, the availability of these currents would be determined by the recent Vm history. Recent studies support that both the MSN response to electrical stimulation of cortical foci (Mahon et al. 2000), and the effect of dopamine agonists on MSN excitability (Hernández-López et al. 1997), vary as function of the recent Vm history, which in vivo is dictated by the prevalent cortical activity state. For instance, in vitro studies showed that firing evoked by a current step was decreased by D1 dopamine receptor agonists when the resting MSN Vm was close to the potassium equilibrium potential, but when the Vm was held at a depolarised value (approximately −55 mV) D1 agonists increased the MSN response to a current step (Hernández-López et al. 1997). These observations suggest that MSNs might process specific cortical input differently depending on the general pattern of cortical activity in which the specific input is embedded.
Further in vivo studies will undoubtedly clarify these important issues.
Acknowledgments
This work was supported by the Ministerio de Salud y Acción Social de la Nación (Beca Carrillo-Oñativia), Fundación Antorchas, Consejo Nacional de Investigaciones Cientificas y Técnicas, y Universidad de Buenos Aires (Argentina). We thank Dr Patricio O'Donnell for helpful comments on an earlier version of this manuscript, Kuei Yuan Tseng for his contribution during preliminary experiments, and Viviana Peskin and Lucila Kargieman for their assistance during some experiments.
References
- Apicella P, Scarnati E, Ljungberg T, SchultZ W. Neuronal activity in monkey striatum related to the expectation of predictable environmental events. Journal of Neurophysiology. 1992;68:945–960. doi: 10.1152/jn.1992.68.3.945. [DOI] [PubMed] [Google Scholar]
- Boussaoud D, Kermadi I. The primate striatum: neuronal activity in relation to spatial attention versus motor preparation. European Journal of Neuroscience. 1997;9:2152–2168. doi: 10.1111/j.1460-9568.1997.tb01382.x. [DOI] [PubMed] [Google Scholar]
- Calabresi P, Mercuri NB, Stefani A, Bernardi G. Synaptic and intrinsic control of membrane excitability of neostriatal neurons. I. An in vivo analysis. Journal of Neurophysiology. 1990;63:651–662. doi: 10.1152/jn.1990.63.4.651. [DOI] [PubMed] [Google Scholar]
- Contreras D, Steriade M. State-dependent fluctuations of low-frequency rhythms in corticothalamic networks. Neuroscience. 1997;76:25–38. doi: 10.1016/s0306-4522(96)00392-2. [DOI] [PubMed] [Google Scholar]
- Cowan RL, Wilson CJ. Spontaneous firing patterns and axonal projections of single corticostriatal neurons in the rat medial agranular cortex. Journal of Neurophysiology. 1994;71:17–32. doi: 10.1152/jn.1994.71.1.17. [DOI] [PubMed] [Google Scholar]
- Feder R, Ranck JB., Jr Studies on single neurons in dorsal hippocampal formation and septum in unrestrained rats. II. Hippocampal slow waves and theta cell firing during bar pressing and other behaviors. Experimental Neurology. 1973;41:532–555. doi: 10.1016/0014-4886(73)90291-4. [DOI] [PubMed] [Google Scholar]
- Goto Y, O'Donnell P. Synchronous activity in the hippocampus and nucleus accumbens in vivo. Journal of Neuroscience. 2001;21:1–5. doi: 10.1523/JNEUROSCI.21-04-j0003.2001. [DOI] [PMC free article] [PubMed] [Google Scholar]
- Halliday DM, Rosenberg JR, Amjad AM, Breeze P, Conway BA, Farmer SF. A framework for the analysis of mixed time series/point process data - Theory and application to the study of physiological tremor, single motor unit discharges and electromyograms. Progress in Biophysics and Molecular Biology. 1995;64:237–278. doi: 10.1016/s0079-6107(96)00009-0. [DOI] [PubMed] [Google Scholar]
- Herculano-Houzel S, Munk MHJ, Neuenschwander S, Singer W. Precisely synchronized oscillatory firing patterns require electroencephalographic activation. Journal of Neuroscience. 1999;19:3992–4010. doi: 10.1523/JNEUROSCI.19-10-03992.1999. [DOI] [PMC free article] [PubMed] [Google Scholar]
- Hernández-LÓpez S, Bargas J, Surmeier DJ, Reyes A, Galarraga E. D1 receptor activation enhances evoked discharge in neostriatal medium spiny neurons by modulating an L-type Ca2+ conductance. Journal of Neuroscience. 1997;17:3334–3342. doi: 10.1523/JNEUROSCI.17-09-03334.1997. [DOI] [PMC free article] [PubMed] [Google Scholar]
- Hull CD, Bernardi G, Buchwald NA. Intracellular responses of caudate neurons to brain stem stimulation. Brain Research. 1970;22:163–179. doi: 10.1016/0006-8993(70)90002-8. [DOI] [PubMed] [Google Scholar]
- Hunter JD, Milsom WK. Cortical activation states in sleep and anesthesia. I: Cardio-respiratory effects. Respiratory Physiology. 1998;112:71–81. doi: 10.1016/s0034-5687(98)00018-8. [DOI] [PubMed] [Google Scholar]
- Kasanetz F, Tseng KY, Murer MG, Riquelme LA. Disruption of the bistable membrane potential of striatal spiny neurons during cortical desynchronization. Society for Neuroscience Abstracts. 2001;27(67):4. [Google Scholar]
- Kita H, Armstrong W. A biotin-containing compound N-(2aminoethyl)biotinamide for intracellular labeling and neuronal tracing studies: comparison with biocytin. Journal of Neuroscience Methods. 1991;37:141–150. doi: 10.1016/0165-0270(91)90124-i. [DOI] [PubMed] [Google Scholar]
- Lopes da Silva F, Pijn JP, Boeijinga P. Interdependence of EEG signals: linear vs. non-linear associations and the significance of time delays and phase shifts. Brain Topography. 1989;2:9–18. doi: 10.1007/BF01128839. [DOI] [PubMed] [Google Scholar]
- Magill PJ, Bolam JP, Bevan MD. Relationship of activity in the subthalamic nucleus - globus pallidus network to cortical electroencephalogram. Journal of Neuroscience. 2000;20:820–833. doi: 10.1523/JNEUROSCI.20-02-00820.2000. [DOI] [PMC free article] [PubMed] [Google Scholar]
- McGeorge AJ, Faull RLM. The organization of the projection from the cerebral cortex to the striatum in the rat. Neuroscience. 1989;29:503–537. doi: 10.1016/0306-4522(89)90128-0. [DOI] [PubMed] [Google Scholar]
- Mahon S, Delord B, Deniau JM, Charpier S. Intrinsic properties of rat striatal output neurones and time-dependent facilitation of cortical inputs in vivo. Journal of Physiology. 2000;527:345–354. doi: 10.1111/j.1469-7793.2000.t01-1-00345.x. [DOI] [PMC free article] [PubMed] [Google Scholar]
- Mahon S, Deniau JM, Charpier S. Relationship between EEG potentials and intracellular activity of striatal and cortico-striatal neurons. An in vivo study under different anesthetics. Cerebral Cortex. 2001;11:360–373. doi: 10.1093/cercor/11.4.360. [DOI] [PubMed] [Google Scholar]
- MoruIZZ G, Magoun HW. Brain stem reticular formation and activation of the EEG. Electroencephalography and Clinical Neurophysiology. 1949;1:455–473. [PubMed] [Google Scholar]
- Munk MH, Roelfsema PR, Konig P, Engel AK, Singer W. Role of reticular activation in the modulation of intracortical synchronization. Science. 1996;272:271–274. doi: 10.1126/science.272.5259.271. [DOI] [PubMed] [Google Scholar]
- Nakano K, Hasegawa Y, Tokushige A, Nakagawa S, Kayahara T, Mizuno N. Topographical projections from the thalamus, subthalamic nucleus and pedunculopontine tegmental nucleus to the striatum in the Japanese monkey, Macaca fuscata. Brain Research. 1990;537:54–68. doi: 10.1016/0006-8993(90)90339-d. [DOI] [PubMed] [Google Scholar]
- Nicola SM, Surmeier J, Malenka RC. Dopaminergic modulation of neuronal excitability in the striatum and nucleus accumbens. Annual Review of Neuroscience. 2000;23:185–215. doi: 10.1146/annurev.neuro.23.1.185. [DOI] [PubMed] [Google Scholar]
- Niedermeyer E, Sherman DL, Geocadin RJ, Hansen HC, Hanley DF. The burst-suppression electroencephalogram. Clinical Electroencephalography. 1999;30:99–105. doi: 10.1177/155005949903000305. [DOI] [PubMed] [Google Scholar]
- Nuñez A. Unit activity of rat basal forebrain neurons: relationship to cortical activity. Neuroscience. 1996;72:757–766. doi: 10.1016/0306-4522(95)00582-x. [DOI] [PubMed] [Google Scholar]
- Oakman SA, Faris PL, CoARIZZ C, Hartman BK. Characterization of the extent of pontomesencephalic cholinergic neurons’ projections to the thalamus: comparison with projections to midbrain dopaminergic groups. Neuroscience. 1999;94:529–547. doi: 10.1016/s0306-4522(99)00307-3. [DOI] [PubMed] [Google Scholar]
- Oakman SA, Faris PL, Kerr PE, CoARIZZ C, Hartman BK. Distribution of pontomesencephalic cholinergic neurons projecting to substantia nigra differs significantly from those projecting to ventral tegmental area. Journal of Neuroscience. 1995;15:5859–5869. doi: 10.1523/JNEUROSCI.15-09-05859.1995. [DOI] [PMC free article] [PubMed] [Google Scholar]
- O'Donnell P, Grace AA. Synaptic interactions among excitatory afferents to nucleus accumbens neurons: hippocampal gating of prefrontal cortical input. Journal of Neuroscience. 1995;15:3622–3639. doi: 10.1523/JNEUROSCI.15-05-03622.1995. [DOI] [PMC free article] [PubMed] [Google Scholar]
- Olsson M, Nikkhah G, Bentlage C, Bjorklund A. Forelimb akinesia in the rat Parkinson model: differential effects of dopamine agonists and nigral transplants as assessed by a new stepping test. Journal of Neuroscience. 1995;15:3863–3875. doi: 10.1523/JNEUROSCI.15-05-03863.1995. [DOI] [PMC free article] [PubMed] [Google Scholar]
- Paxinos G, Watson C. The Rat Brain in Stereotaxic Coordinates. 3. London: Academic Press; 1997. [DOI] [PubMed] [Google Scholar]
- PlenZ D, Aertsen A. Neural dynamics in cortex-striatum co-cultures. II. Spatiotemporal characteristics of neuronal activity. Neuroscience. 1996;70:893–924. doi: 10.1016/0306-4522(95)00405-x. [DOI] [PubMed] [Google Scholar]
- Romo R, SchultZ W. Role of primate basal ganglia and frontal cortex in the internal generation of movements. III. Neuronal activity in the supplementary motor area. Experimental Brain Research. 1992;91:396–407. doi: 10.1007/BF00227836. [DOI] [PubMed] [Google Scholar]
- Rosenberg JR, Amjad AM, Breeze P, Brillinger DR, Halliday DM. The Fourier approach to the identification of functional coupling between neuronal spike trains. Progress in Biophysics and Molecular Biology. 1989;53:1–31. doi: 10.1016/0079-6107(89)90004-7. [DOI] [PubMed] [Google Scholar]
- Saper CB, Loewy AD. Projections of the pedunculopontine tegmental nucleus in the rat: evidence for additional extrapyramidal circuitry. Brain Research. 1982;252:367–372. doi: 10.1016/0006-8993(82)90404-8. [DOI] [PubMed] [Google Scholar]
- SchultZ W, Romo R. Role of primate basal ganglia and frontal cortex in the internal generation of movements. I. Preparatory activity in the anterior striatum. Experimental Brain Research. 1992;91:363–384. doi: 10.1007/BF00227834. [DOI] [PubMed] [Google Scholar]
- Sofroniew MV, Priestley JV, Consolazione A, Eckenstein F, Cuello AC. Cholinergic projections from the midbrain and pons to the thalamus in the rat, identified by combined retrograde tracing and choline acetyltransferase immunohistochemistry. Brain Research. 1985;329:213–223. doi: 10.1016/0006-8993(85)90527-x. [DOI] [PubMed] [Google Scholar]
- Steriade M. Corticothalamic resonance, states of vigilance and mentation. Neuroscience. 2000;101:243–276. doi: 10.1016/s0306-4522(00)00353-5. [DOI] [PubMed] [Google Scholar]
- Steriade M, Amzica F, Contreras D. Synchronization of fast (30–40 Hz). spontaneous cortical rhythms during brain activation. Journal of Neuroscience. 1996;16:392–417. doi: 10.1523/JNEUROSCI.16-01-00392.1996. [DOI] [PMC free article] [PubMed] [Google Scholar]
- Steriade M, Curró Dossi R, Paré D, Oakson G. Fast oscillations (20–40 Hz). in thalamocortical systems and their potentiation by mesopontine cholinergic nuclei in the cat. Proceedings of the National Academy of Sciences of the USA. 1991;88:4396–4400. doi: 10.1073/pnas.88.10.4396. [DOI] [PMC free article] [PubMed] [Google Scholar]
- Steriade M, Timofeev I, Grenier F. Natural waking and sleep states. A view from inside neocortical neurons. Journal of Neurophysiology. 2001;85:1969–1985. doi: 10.1152/jn.2001.85.5.1969. [DOI] [PubMed] [Google Scholar]
- Stern EA, Jaeger D, Wilson CJ. Membrane potential synchrony of simultaneously recorded striatal spiny neurons in vivo. Nature. 1998;394:475–478. doi: 10.1038/28848. [DOI] [PubMed] [Google Scholar]
- Stern EA, Kincaid AE, Wilson CJ. Spontaneous subthreshold membrane potential fluctuations and action potential variability of rat corticostriatal and striatal neurons in vivo. Journal of Neurophysiology. 1997;77:1697–1715. doi: 10.1152/jn.1997.77.4.1697. [DOI] [PubMed] [Google Scholar]
- Suri RE, Bargas J, Arbib MA. Modeling functions of striatal dopamine modulation in learning and planning. Neuroscience. 2001;103:65–85. doi: 10.1016/s0306-4522(00)00554-6. [DOI] [PubMed] [Google Scholar]
- Tabuchi ET, Mulder AB, Wiener SI. Position and behavioral modulation of synchronization of hippocampal and accumbens neuronal discharges in freely moving rats. Hippocampus. 2000;10:717–728. doi: 10.1002/1098-1063(2000)10:6<717::AID-HIPO1009>3.0.CO;2-3. [DOI] [PubMed] [Google Scholar]
- Tseng KY, KasanetZ F, Kargieman L, Riquelme LA, Murer MG. Cortical slow oscillatory activity is reflected in the membrane potential and spike trains of striatal neurons in rats with chronic nigrostriatal lesions. Journal of Neuroscience. 2001;21:6430–6439. doi: 10.1523/JNEUROSCI.21-16-06430.2001. [DOI] [PMC free article] [PubMed] [Google Scholar]
- Wilson CJ. The generation of natural firing patterns in neostriatal neurons. Progress in Brain Research. 1993;99:277–297. doi: 10.1016/s0079-6123(08)61352-7. [DOI] [PubMed] [Google Scholar]
- Wilson CJ, Groves PM. Spontaneous firing patterns of identified spiny neurons in the rat neostriatum. Brain Research. 1981;220:67–80. doi: 10.1016/0006-8993(81)90211-0. [DOI] [PubMed] [Google Scholar]
- Wilson CJ, Kawaguchi Y. The origins of two-state spontaneous membrane potential fluctuations of neostriatal spiny neurons. Journal of Neuroscience. 1996;16:2397–2410. doi: 10.1523/JNEUROSCI.16-07-02397.1996. [DOI] [PMC free article] [PubMed] [Google Scholar]