

Abstract
Postsynaptic [Ca2+]i increases result from Ca2+ entry through ligand-gated channels, entry through voltage-gated channels, or release from intracellular stores. We found that these sources have distinct spatial distributions in hippocampal CA1 pyramidal neurons. Large amplitude regenerative release of Ca2+ from IP3-sensitive stores in the form of Ca2+ waves were found almost exclusively on the thick apical shaft. Smaller release events did not extend more than 15 μm into the oblique dendrites. These synaptically activated regenerative waves initiated at points where the stimulated oblique dendrites branch from the apical shaft. In contrast, NMDA receptor-mediated increases were observed predominantly in oblique dendrites where spines are found at high density. These [Ca2+]i increases were typically more than eight times larger than [Ca2+]i from this source on the main aspiny apical shaft. Ca2+ entry through voltage-gated channels, activated by backpropagating action potentials, was detected at all dendritic locations. These mechanisms were not independent. Ca2+ entry through NMDA receptor channels or voltage-gated channels (as previously demonstrated) synergistically enhanced Ca2+ release generated by mGluR mobilization of IP3.
Most models of neurons do not distinguish separate functions for different parts of the dendritic arborization. Synaptic potentials are generated at different locations and spread passively to the spike initiation zone near the soma. In earlier models the location of the synapse within the dendritic tree was thought to influence its impact on synaptic integration. However, recent experiments in hippocampal pyramidal neurons (Magee, 1999; Magee & Cook, 2000) suggest that all excitatory synapses within the stratum radiatum may be equipotent, a result that minimizes the significance of dendritic geometry. In contrast, there is some indication of variations in signalling mechanisms in different dendritic regions. Ca2+ entry through NMDA receptors evokes increases in [Ca2+]i primarily in spines (e.g. Kovalchuk et al. 2000) which are reported to be more concentrated on oblique dendrites (Bannister & Larkman, 1995; Trommald et al. 1995; Megias et al. 2001). Ca2+ channel types are distributed unevenly in the dendrites (Westenbroek et al. 1990; Magee & Johnston, 1995b) providing a potential mechanism for differentially regulating Ca2+ entry in different regions. In addition, action potentials backpropagate with decrementing amplitude into the distal arborizations (Stuart & Sakmann, 1994; Callaway & Ross, 1995; Spruston et al. 1995) evoking smaller [Ca2+]i increases in distal regions. Both channel conductances (Sandler & Ross, 1999) and spike amplitudes can be modulated by neurotransmitters (Tsubokawa & Ross, 1997; Hoffman & Johnston, 1999) leading to variations in the spatial distribution of postsynaptic [Ca2+]i changes under different conditions. In some cases distal dendrites can generate Ca2+ spikes (Yuste et al. 1994; Golding et al. 1999; Larkum et al. 1999; Williams & Stuart, 2000) producing larger shifts in [Ca2+]i in that part of the cell.
Recently we found that repetitive synaptic activation could evoke increases in [Ca2+]i in the form of Ca2+ waves by releasing Ca2+ from IP3 (inositol 1,4,5-trisphosphate)-sensitive stores in hippocampal CA1 pyramidal neurons (Nakamura et al. 1999). Synaptically activated Ca2+ release has also been detected in cerebellar Purkinje neurons (Finch & Augustine, 1998; Takechi et al. 1998). These large amplitude (several micromolar) all-or-none events, usually lasting more than 0.5 s, may be more effective in causing downstream changes than the smaller and faster ligand- and voltage-dependent [Ca2+]i changes described above. The waves were easier to generate in the proximal apical dendrites than in the distal apical arbors or basal dendrites. However, details about the locations of these waves, including their distribution in thick or oblique dendrites or sites of origin, have not been investigated. Knowledge of these spatial parameters could provide insights into the mechanisms producing these events and the nature and location of the targets of the regenerative [Ca2+]i changes. Therefore, we developed procedures to more precisely determine these locations. In addition, we examined the distributions of other sources of postsynaptic [Ca2+]i increases and their interactions with the mechanisms controlling Ca2+ release from the endoplasmic reticulum (ER). Remarkably, we found that regenerative Ca2+ release was precisely confined to the large apical dendritic shafts and that the waves in this region began at the branch points of oblique dendrites. Furthermore, [Ca2+]i increases due to Ca2+ entry through NMDA receptors were concentrated on the oblique dendrites. While there was little spatial overlap between these two Ca2+ sources, we found functional interactions between them. Ca2+ entry through NMDA receptors, like Ca2+ entry evoked by backpropagating action potentials (Nakamura et al. 1999), interacted with mGluR (metabotropic glutamate receptor) -mobilized IP3 to enhance Ca2+ release.
Methods
Whole-cell recording
Transverse hippocampal slices (300-400 μm thick) from 2- to 4-week-old Sprague-Dawley rats were prepared as previously described (Tsubokawa & Ross, 1997; Nakamura et al. 1999). Animals were anaesthetized with isoflurane and decapitated using procedures approved by the Institutional Animal Care and Use Committee of New York Medical College. Slices were cut in an ice-cold solution consisting of (mm): 120 choline chloride, 3 KCl, 8 MgCl2, 1.25 NaH2PO4, 26 NaHCO3, and 10–20 glucose. They were incubated for at least 1 h in normal artificial cerebrospinal fluid (ACSF) composed of (mm): 124 NaCl, 2.5 KCl, 2 CaCl2, 2 MgCl2, 1.25 NaH2PO4, 26 NaHCO3, and 10 or 20 glucose, bubbled with a mixture of 95 % O2/5 % CO2, making the final pH 7.4. The same solution was used for recording. In some experiments we used 0.1 mm MgCl2 instead of 2 mm. The concentration of all other components of the ACSF remained the same.
Submerged and superfused slices were mounted on a stage rigidly bolted to an air table and were viewed with a 40 × or 60 × water-immersion lens (Olympus, Melville, NY, USA) in an Olympus BX50WI microscope mounted on an X-Y translation stage. Somatic whole-cell recordings were made using patch pipettes pulled from 1.5 mm outer diameter thick-walled glass tubing (1511-M, Friderick and Dimmock, Millville, NJ, USA). Tight seals on CA1 pyramidal cell somata were made with the ‘blow and seal’ technique using video-enhanced differential interference contrast (DIC) optics to visualize the cells (Sakmann & Stuart, 1995). For most experiments the pipette solution contained (mm): 140 potassium gluconate, 4 NaCl, 4 Mg-ATP, 0.3 Na-GTP, and 10 Hepes, pH adjusted to 7.2-7.4 with KOH. This solution was supplemented with 200–300 μM bis-fura-2 or 500 μM fura-4F or furaptra (Molecular Probes, Eugene, OR, USA). In a few experiments we used 200 μM Oregon Green 488 BAPTA-1 (Molecular Probes). There were no significantly different results with this Ca2+ indicator. In some experiments QX-314 (1 mm; lidocaine N-ethyl bromide) was added to the pipette solution to block postsynaptic action potentials. No difference in the Ca2+ signalling mechanisms was noticed in QX-314-containing cells compared to normal cells except for the blockade of the spike-evoked component. Synaptic stimulation was evoked with 100 μs pulses with a bipolar tungsten electrode that had one sharpened tip (WPI, Sarasota, FL, USA; model TM33B01KT) about 1 mm in front of the other. The tip of this electrode was usually placed carefully on the slice about 30–50 μm to the side of the main apical dendritic shaft. Temperature was maintained between 31 and 33 °C. (±)-2-amino-5-phosphonopentanoic acid (APV), 6-cyano-7-nitroquinoxaline-2,3-dione (CNQX), (S)-α-methyl-4-carboxyphenylglycine (MCPG), and trans-1-amino-cyclopentyl-1, 3-dicarboxylate (t-ACPD) were obtained from Research Biochemicals International (Natick, MA, USA). TTX and QX-314 were obtained from Sigma (St Louis, MO, USA). All other chemicals were obtained from Fisher Scientific (Piscataway, NJ, USA).
Dynamic [Ca2+]i measurements
Time-dependent [Ca2+]i measurements from different regions of the pyramidal neuron were made as previously described (Lasser-Ross et al. 1991). Briefly, a Photometrics AT200 (Tucson, AZ, USA) cooled CCD camera, operated in the frame transfer mode, was mounted on the camera port of the microscope. Custom software controlled readout parameters and synchronization with electrical recordings. A second custom program was used to analyse the data. For all experiments in this paper pixels were binned 5 × 5 in the camera. This binning created square superpixels 2.4 × 2.4 μm2 using the 60 × lens that defined the spatial resolution of our measurements. The small boxes in Fig. 3 show examples of these superpixels. Static images in the figures showing the cell structure were taken without binning to achieve higher spatial resolution. Typical readout rates were 30 frames s−1. Fluorescence changes of bis-fura-2, fura-4F, and furaptra were measured with single wavelength excitation (382 ± 10 nm) and emission > 455 nm. [Ca2+]i changes are expressed as -ΔF/F where F is the fluorescence intensity when the cell is at rest and ΔF is the change in fluorescence during activity. Corrections were made for indicator bleaching during trials by subtracting the signal measured under the same conditions when the cell was not stimulated. To accurately measure the resting fluorescence (F) we subtracted the background fluorescence of the slice from the cell image. This background level was estimated by measuring the fluorescence of an equivalent position in the slice that contained no injected neurons. This background subtraction was judged to be accurate because the corrected spike-evoked ΔF/F values measured on the bright dendritic shaft and the dim oblique branches were about the same (see Results).
Figure 3. MCPG blocks [Ca2+]i increases in the dendritic shaft and APV blocks [Ca2+]i increases on branches.
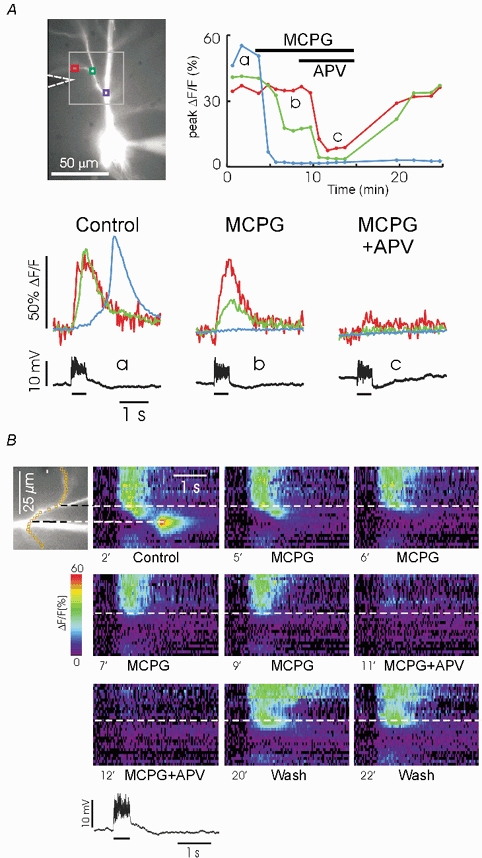
A, data shown for three locations on this pyramidal neuron in response to a stimulation train of 50 pulses at 100 Hz: shaft (blue box), end of intermediate branch (green box), and side branch near the stimulating electrode (red box). The traces under the cell image show that in control conditions (a) early signals were recorded at the two branch locations and a delayed signal was detected on the shaft. Superfusion with 1 mm MCPG blocked the shaft signal, reduced the signal at the end of the intermediate branch and had no effect on the side branch (b). Addition of 50 μM APV completely blocked the signal at the intermediate branch and left only a small residue at the side branch (c). The graph shows the peak signal amplitude at each location for the entire experiment, each trial being indicated by a dot. The three selected trials below are indicated by a, b, and c. B, the same data displayed in a ‘line scan’ plot to enhance spatial resolution. A series of superpixels was selected that follows the side branch (image is rotated 90 deg from the selection in the image in A). Each pseudocolour image shows the intensity profile as a function of time along the superpixel trajectory. The time of the selected trials from the full sequence in A is shown below the images. The time scale matches the scale of the electrical trace below (from the first trial). Note that in control conditions (2 min, ‘2’‘) the large regenerative release was confined to the main shaft but there was a weak wave along the intermediate branch. Addition of MCPG (5-9 min) blocked the signal in the shaft and intermediate branch. There is a sharp transition at the end of this branch where MCPG had no effect. Addition of APV (11-12 min) blocked the signal everywhere. Washout of APV and MCPG (20-22 min) restored the distal branch signal but the shaft signal and wave did not recover.
Axial resolution
Most measurements were made with the 60 × lens. With this lens the images of branches were fuzzy with a change of focus of 2 μm and were grossly distorted with a change of 5 μm. However, the fluorescence changes (ΔF and ΔF/F) detected from these branches degraded much less rapidly. Signals from the main shaft were reduced by less than 50 % with a change in focus of ±20 μm and signals from thin branches were reduced by less than 30 %. In addition, some light from out of focus elements contaminated signals from in focus elements. Therefore, to examine the spatial distribution of postsynaptic [Ca2+]i changes with minimal distortion we selected pyramidal neurons that were in the plane of the slice, close to the surface, and that had significant oblique dendrites approximately in the same plane. Inevitably, many branches came out of this plane. When it was important to examine the locations of these branches we focused up and down and recorded images at different focal depths.
The detection of out of focus branch signals has a positive side. We could faithfully follow signals along the main shaft and side branches even when they were not exactly in the plane of focus. In contrast, confocal measurements would have missed signals from these out of focus elements.
All indicated errors are standard deviations (s.d.).
Results
Spatial heterogeneity of synaptically activated [Ca2+]i increases
Repetitive stimulation (typically 50 pulses at 100 Hz; Nakamura et al. 1999; Zhou & Ross, 2002) evoked [Ca2+]i changes in pyramidal neurons that were qualitatively different in different dendritic regions (Fig. 1). On the oblique dendrites (red and green boxes) the [Ca2+]i changes began at times close to the beginning of the train and peaked close to the end of the train. The amplitude of these changes was graded with stimulus intensity (n = 4). In contrast, the [Ca2+]i changes on the main apical shaft (blue box) were all-or-none, larger, and peaked after the stimulus train. The regenerative increase on the shaft was preceded by a smaller graded signal that usually began near the time of the initiation of the stimulus train. In some cells (e.g. Fig. 3) that had a branch of intermediate thickness, we could distinguish a short region with a delayed peak but with small amplitude. Previous experiments (Nakamura et al. 1999) showed that the delayed regenerative increase was due to Ca2+ release from IP3-sensitive stores and propagated as a wave in the apical dendrites. In most other cells (like that in Fig. 1), where thin branches projected laterally from the shaft, sometimes only a small hump or slowing of the recovery was detected on the falling phase of the branch signal close to the shaft. This signal was always overwhelmed by the earlier signal linked in time to the synaptic potential. In no case, out of more than 100 examined pyramidal neurons, did we find large regenerative [Ca2+]i changes on oblique dendrites. All of these [Ca2+]i increases on both the shaft and branches were postsynaptic responses following the generation of action potentials in presynaptic fibres since they were completely blocked by 1 μM TTX (tetrodotoxin) when the postsynaptic response was below spike threshold (n = 3). They were not due to direct stimulation of the pyramidal neuron since they were completely blocked by a cocktail including 10 μM CNQX, 100 μM APV, 1 mm MCPG, and 3 μM atropine (Nakamura et al. 1999, and data not shown).
Figure 1. Synaptically activated [Ca2+]i increases are graded on dendritic branches and all-or-none on the apical shaft.
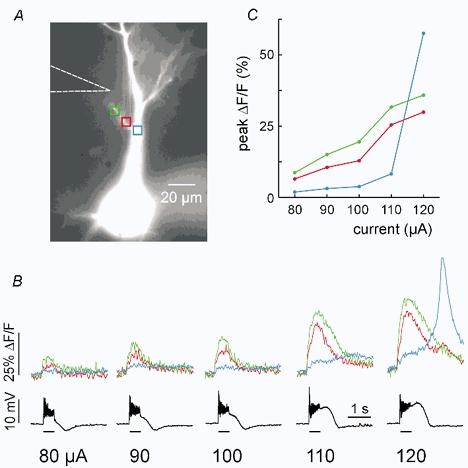
A, the image shows a pyramidal neuron filled with bis-fura-2. A patch electrode is on the soma and the position of the stimulating electrode is indicated with a dotted arrow. Three locations are shown: red and green boxes on the branch and blue box on the shaft. B, the traces show the optical and electrical responses to trains of 50 pulses at 100 Hz with increasing stimulation currents. At low currents (80-100 μA) the [Ca2+]i increase (ΔF/F) at all locations began at the start of the train and increased in amplitude with increasing stimulation intensity. The largest increases were on the branch. When the stimulus intensity was increased to 120 μA, a large, all-or-none signal on the shaft was evoked but the increases on the branch only increased in amplitude. Electrical traces show the somatically recorded membrane potential. The bars under the traces indicate the duration of the stimulus train. C, graph showing the peak ΔF/F responses at each location.
To more carefully assay the spatial extent of synaptically activated regenerative Ca2+ release on the dendritic branches we placed small boxes on the dendrites (like those in Fig. 1 or smaller) and moved them in the computer a micron at a time along the image of the branch. We determined the position where the time to peak no longer occurred later than the end of the stimulus train and where we could no longer detect a hump on the falling phase suggesting a release component to the signal. In 11 cells this distance averaged 14.3 ± 3.6 μm from the shaft. This distance is an overestimate since some of the signal at branch locations included light scattering from the strong release signal from the bright shaft. To estimate this contribution we measured the distance the shaft signal extended to the opposite side of the dendritic field where there was no branch. This distance averaged 6.5 ± 2.2 μm (n = 7). The complexity of the interaction between the true signal and the light scattered signal made it difficult to determine the true spatial extent of the Ca2+ release signal. Nevertheless, these numbers suggest that a significant delayed release component to the synaptically activated [Ca2+]i increase extends less than 10 μm from the shaft.
The amplitude of the optical traces in Fig. 1 suggests that the peak Ca2+ release signal (ΔF/F) on the shaft is larger than the synaptic signal on the nearby branch in normal ACSF. However, these signals were measured using bis-fura-2 as the indicator. Since this high-affinity indicator (KD ≈0.4 μM) is saturated by the large Ca2+ release and buffers the regenerative process, we measured the relative signal amplitudes in the two regions with lower affinity indicators. Using fura-4F (KD ≈0.8 μM) the shaft release signal was 2.6 ± 1.0 (n = 9) times larger than the synaptically evoked signal on the branch about 20 μm from the shaft. Using furaptra (KD ≈40 μM) the ratio was 3.8 ± 1.3 (n = 8). This is also the ratio of the [Ca2+]i changes since the release signal measured with furaptra was far from saturation (ΔF/F ≤ 15 %) and therefore in the linear range. Consequently, the magnitude of the [Ca2+]i increase due to release on the shaft was much larger than the [Ca2+]i increase on the thin oblique branches due to Ca2+ entry through NMDA receptors. The magnitude of the [Ca2+]i increase in spines (below the resolution of our experiments) is likely to be higher than the spatially averaged branch signal we recorded.
The low affinity indicator furaptra not only responds more linearly than bis-fura-2 but it is also a weaker Ca2+ buffer than bis-fura-2. Consequently, other aspects of the Ca2+ waves in addition to the amplitude were affected by the choice of indicator. Using furaptra we found that the Ca2+ waves had a faster velocity, faster rise time, and shorter duration than when these parameters were measured with bis-fura-2 (Table 1).
Table 1.
Effect of Ca2+ indicators on Ca2+ wave parameters
| Indicator | Bis-fura-2 | Furaptra |
|---|---|---|
| Width (ms)* | 772 ± 223 | 521 ± 130 |
| Rise time (ms)† | 98 ± 18 | 63 ± 9 |
| Velocity (μm s−1)‡ | 63 ± 11 | 90 ± 25 |
Wave parameters measured at locations in the proximal apical dendrites, typically 50 μm from the soma.
Full width at half peak amplitude
10% to 90% peak amplitude
measured at half peak amplitude. All errors are s.d.
Spatial heterogeneity of spike-evoked Ca2+ release in t-ACPD
Previously (Nakamura et al. 1999; Nakamura et al. 2000) we found that regenerative Ca2+ waves could be evoked in the proximal dendritic region by a few backpropagating action potentials in the presence of 30 μM t-ACPD. Since bath application of t-ACPD should activate all mGluRs on the cell this protocol should control for the possibility that the spatial heterogeneity of Ca2+ release is due to focal synaptic stimulation. In new experiments we carefully compared the amplitudes of the [Ca2+]i changes generated by Ca2+ release on different branches, selecting cells that were close to the surface and which had extended structures in clear focus. Figure 2 shows that in these cells we could see that regenerative release was much larger on the main dendritic shaft than on the nearby branch. We compared the [Ca2+]i changes at the time of the peak of the release signal (filled arrows) to the [Ca2+]i changes at the earlier time when Ca2+ entry was due to voltage-dependent calcium channels (VDCC) opened by the action potentials (open arrows). Previous measurements (e.g. Nakamura et al. 2000) found that in normal ACSF the amplitude of the sharp spike-evoked [Ca2+]i increase smoothly varied with distance along the main dendrites up to 200 μm from the soma. We tested whether this observation applied to the oblique dendrites by measuring the [Ca2+]i change (ΔF/F) on the shaft and a nearby branch due to a short train of backpropagating spikes. In normal ACSF, after correcting for background autofluorescence, the branch:shaft ΔF/F ratio was 0.95 ± 0.03 (n = 15). Using fura-4F or furaptra the ratio of the spike signals in the two regions was also close to 1.0. This observation is somewhat counterintuitive since the surface-to-volume ratio changes sharply at the oblique branch points. Nevertheless, this near equality of spike signals provided a useful reference signal to compare [Ca2+]i change amplitudes due to release at different locations. A large relative difference in the amplitude of the release signal on the shaft and on the branch was observed in all tested cells (n = 12 cells using three spikes to evoke release, Fig. 2B; n > 50 using 10–20 spikes to evoke release, data not shown). In some cases the release signal on the branch could only be detected as a slowing of the recovery time of the transient in t-ACPD compared to the transient in normal ACSF. In three cells we could follow the signals along a branch for about 70 μm. In each of these cells this small secondary release was observed along the entire length of the visible oblique dendrite, diminishing in amplitude with distance from the shaft. The larger sharp [Ca2+]i increase from spikes in normal ACSF was detected in all cells at branch locations that had measurable indicator fluorescence.
Figure 2. Spike-evoked [Ca2+]i increases in the presence of 30 μM t-ACPD are much larger in the dendritic shaft than in a branch.
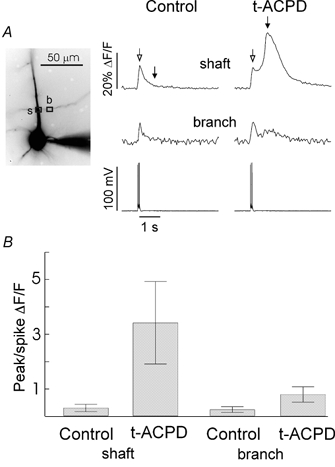
A, [Ca2+]i changes at shaft (s) and branch (b) locations on the cell image at left. In control conditions three spikes evoked a fast transient at both locations. In t-ACPD a secondary release transient was evoked that was bigger than the spike signal on the shaft, but smaller than the spike signal on the branch. B, ratios of fluorescence changes for 12 cells. Each ratio was calculated by dividing the amplitude of the signal at the time of the release peak on the shaft (filled arrow) by the amplitude at the time of the spike signal (open arrow). Error bars are s.d. On average in t-ACPD the shaft ratio was 4.3 times larger than the branch ratio.
The difference in the relative magnitudes of the peak release [Ca2+]i changes in the branch and shaft is likely to be larger than the average of 4.3 reported in Fig. 2B (second bar divided by the fourth bar). When furaptra was used as the Ca2+ indicator instead of bis-fura-2, the ratio of the peak ΔF/F of the release signal to the spike signal on the shaft was much bigger (≈3 times) than when bis-fura-2 was used (Fig. 3 in Nakamura et al. 2000). In general, the signal-to-noise ratio on the branch using furaptra was small, making quantitative measurements of the release signal on the branch with this indicator difficult. Nevertheless, we could clearly determine that on the branch the release signal was no bigger than the spike signal. Therefore, the true ratio of the peak [Ca2+]i increases on the shaft-to-branch due to spike-evoked Ca2+ release is likely to be 10 or higher.
Pharmacological dissection of [Ca2+]i increase components
The qualitative difference between the synaptically evoked [Ca2+]i increases on the branch and on the shaft suggested that they might be due to different mechanisms. To test this idea we measured these signals while superfusing the slice with different glutamate receptor antagonists. Figure 3A shows that superfusion with 1 mm of the broad spectrum mGluR antagonist MCPG had almost no effect on the peak amplitude or time course of the Ca2+ transient measured on the fine branch (red box). At the branch point between the intermediate and fine branches (green box) MCPG reduced the signal more than 50 %. On the main shaft (blue box) MCPG blocked the regenerative signal completely as shown previously (Nakamura et al. 1999). In seven analysed cells, MCPG only reduced the signals on thin oblique branches to 92 ± 9 % of their original amplitude. Even this small reduction may be an overestimate because indicator buffering increased during the course of the experiment as more bis-fura-2 diffused into the branch. In addition, MCPG had no statistically significant effect (n = 5; data not shown) on the time constant of the recovery phase of the branch signal, confirming that there was little synaptically evoked Ca2+ release at this later time to slow the apparent return of the [Ca2+]i to resting levels.
In the cell shown in Fig. 3 there was almost no [Ca2+]i increase on the shaft in MCPG. In other cells there was a small increase in this region following tetanic stimulation. In seven cells the ratio of ΔF/F (with bis-fura-2 as the indicator) on the branch about 20 μm from the shaft to ΔF/F on the shaft was 8.6 ± 4.1 following the application of MCPG. This ratio depended on the location of the stimulating electrode. In some experiments where the stimulating electrode was placed further from the shaft the ratio was higher. We did not examine this configuration systematically.
To more precisely determine the spatial extent of the effect of MCPG we implemented a ‘line scan’ display format (Fig. 3B). We selected a region around the branch point (box on cell image in Fig. 3A) and rotated it 90 deg to orient the branch in a quasi-vertical direction (cell image in Fig. 3B). We selected a set of superpixels along the branch trajectory (small yellow boxes). The pseuodocolour images then showed the [Ca2+]i changes along this trajectory in different trials. Thus, the first image, at the 2 min point (‘2’‘; control) in normal ACSF, shows that at all locations along the fine branch the [Ca2+]i increase began at the same time. On the intermediate branch there was a small Ca2+ wave since the [Ca2+]i increase began at later times at positions closer to the shaft. The large regenerative increase was clearly confined to the main shaft. When MCPG was superfused over the slice the regenerative [Ca2+]i increase on the shaft was blocked first. Then, over the next 5 min the wave on the intermediate branch was completely blocked with no effect on the fine branch. In most examined cells there was no intermediate branch; thin branches came directly out of the main shaft. In these cells MCPG blocked the regenerative increase on the main shaft, but had no effect on signals in thin branches even at locations as close as 10 μm from the shaft (data not shown).
Both the time-dependent traces (Fig. 3A) and the ‘line scans’ (Fig. 3B) show that when 50 μM APV was added to the ACSF the remainder of the [Ca2+]i increase was almost completely blocked at all locations with little effect on the synaptic potential. The ‘line scan’ images at 20 min and 22 min show that the [Ca2+]i increases on the fine branch and some of the increase in the intermediate branch recovered after washing out the APV and MCPG. In this experiment the regenerative signal on the shaft did not recover. This was a common response although in the majority of cells (n = 14/27; see e.g. Fig. 1D in Nakamura et al. 1999) MCPG washout restored the regenerative signal. Failure to recover the regenerative response may be due to incomplete refilling of the stores. In 12 analysed cells, APV reduced the [Ca2+]i increase on oblique branches to 19 ± 7 % of its original level. Addition of 10 μM CNQX further reduced the increase to about 10 % (n = 4) and blocked the depolarizing synaptic potential, indicating that some of the branch increase was due to voltage-gated Ca2+ entry evoked by the synaptic potential. Together these results show that the synaptically activated [Ca2+]i increases on the branch and shaft are pharmacologically distinct as well as distinct in time course.
Initiation point of Ca2+ waves
The ‘line scan’ display was used to determine more carefully the initiation point of the Ca2+ waves (Fig. 4A). We selected a set of superpixels along the main dendritic shaft and through the soma into the basal dendrites. The ‘line scan’ image shows that the earliest Ca2+ release (the initiation point on the main shaft) occurred at a point one superpixel (2.4 μm) away from where the dendritic branch joins the shaft and not at the position directly opposite the point of the electrode. The initiation points were stable for each cell and stimulus configuration. In 13/15 cells that were stimulated for five or more trials the initiation point of the wave did not vary by more than ± 1 superpixel. An analysis of the signals along the branch showed that the wave initiated at or close to the shaft even though there was a small regenerative component along the branch in some cells (e.g. Fig. 3). A survey of 49 pyramidal neurons (Fig. 4B) found that 88 % of the waves on the main shaft initiated at sites within two superpixels (5 μm) from the nearest branch point. The percentage may have been even higher since the branches were difficult to see in some cells either because they were deep in the slice or they projected directly up or down from the image plane. We attempted to reduce this possibility by focusing above and below the main shaft (see Methods) but we may have missed some branches. A random distribution would have had equal numbers at 1, 2, and 3 superpixels with half as many at 0 superpixels. The observed distribution is consistent with the stable distribution for multiple trials on a single cell (see above). Synaptic activation of NMDA receptors on the branches probably was not a contributing factor in determining the initiation site since 10/14 waves stimulated in 100 μM APV initiated within one superpixel of a branch point.
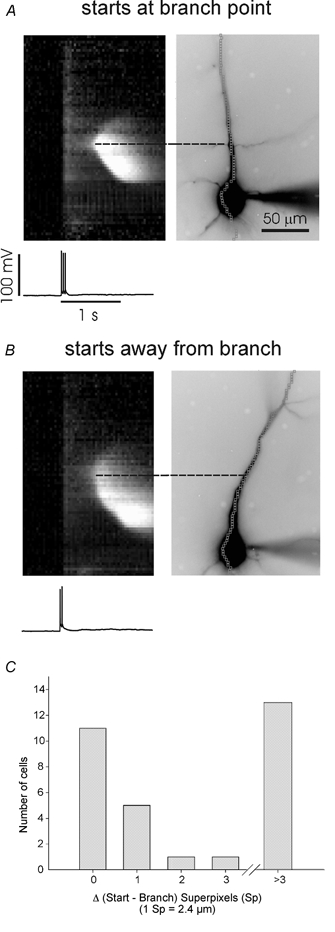
Figure 4. Synaptically activated Ca2+ waves initiate at branch points on the main dendritic shaft.
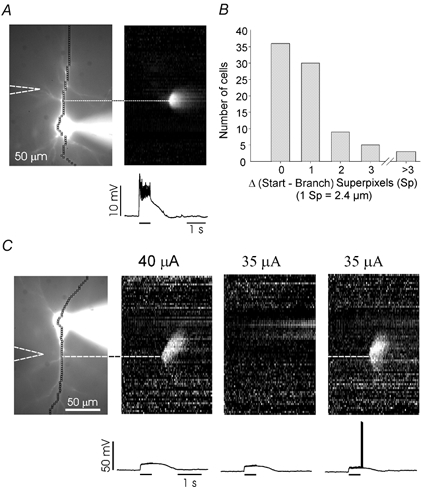
A, ‘line scan’ of wave initiated in a pyramidal neuron containing 300 μM bis-fura-2 and 1 mm QX-314. The grey scale image shows that the earliest detected [Ca2+]i increase occurred at a point at the beginning of a branch that passed near the stimulating electrode. B, histogram showing frequency of waves originating at different distances from a branch point in the apical dendrites. 78 % (38/49) began within 1 superpixel of a branch; only 8 % (4/49) began at points further than 3 superpixels. C, waves begin at branch points when initiated by the synergistic action of synaptic stimulation and spikes. Pyramidal neuron containing 500 μM furaptra. With 40 μA stimulation (50 pulses at 100 Hz) a wave was initiated at a branch point. With 35 μA stimulation no wave occurred. Pairing 35 μA stimulation with three backpropagating action potentials evoked a wave that initiated at the same branch point. With furaptra as the indicator the signal from the spikes could not be seen using this grey scale.
Figure 4C shows that the waves initiate at branch points even when they are generated by pairing repetitive synaptic stimulation with backpropagating action potentials (Nakamura et al. 1999). In this cell (typical of 8/9) the wave initiated at the same branch point both when spikes were required (35 μA stimulation current) and when they were not (40 μA current). Therefore, the spikes, which evoke [Ca2+]i increases at all dendritic locations, do not determine the initiation site.
These experiments showed that the site of wave initiation was invariant from trial to trial in most cells. However, waves could be initiated at more than one location if the site of stimulation was changed. Figure 5A shows an experiment where we placed two stimulating electrodes near different branches in the dendritic arbor. Stimulation near different branches resulted in waves that initiated where those branches connected to the shaft. Furthermore, the fast [Ca2+]i increases on the oblique branches (similar to that shown in Fig. 1) were restricted to the same branches where the waves initiated, and no [Ca2+]i increase was seen in the other branch (data not shown; n = 5). Presumably, most of the activated presynaptic fibres contacted the branch near the stimulating electrode. In about 10 % (n = 12) of the tested cells we found that synaptic stimulation generated Ca2+ waves with two or more initiation sites (Fig. 5B). Both initiation sites were close to branch points. The electrode probably activated fibres that made significant numbers of contacts on two branches. In fact, the fast [Ca2+]i increases were seen on both branches (data not shown). In other cells (Fig. 5C), where the main apical shaft split into two thick daughter shafts close to the soma, waves were initiated independently in the two progeny. In this case, apparently, some of the activated fibres contacted the branch on the ipsilateral side of the dendritic field, initiating a wave at the base of that oblique branch, while some of the fibres passed through to the contralateral field, initiating a wave on that side. These examples illustrate the variety and spatial complexity of the Ca2+ waves that can exist in pyramidal neurons even when a single location is stimulated. Some of this complexity is due to the fact that many fibres are activated and their trajectories and contact points are not known. The constant features of the waves were that they almost all started at branch points and that fast [Ca2+]i increases were observed in the fine dendrites that branched from the initiation site.
Figure 5. Synaptic stimulation evokes waves that can initiate at more than one location in the dendrites.
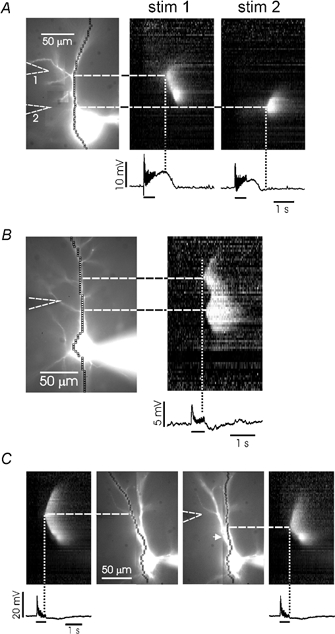
A, pyramidal neuron filled with 200 μM bis-fura-2. Two stimulating electrodes were placed near the cell. Stimulation of electrode 1 produced a wave that initiated at the base of the oblique branch near that electrode. Stimulation of electrode 2 initiated a wave at the base of another branch (not very visible in this image). The waves are illustrated using a ‘line scan’ where intensity is shown on a grey scale. The vertical dotted lines show that the waves initiated after a long delay from the beginning of synaptic stimulation. B, pyramidal neuron filled with 500 μM furaptra. The two waves initiated close to two branch points on the shaft and then came together in the region between them. The vertical dotted line shows that the waves initiated at different times after the start of stimulation. C, two Ca2+ waves on different thick branches initiated by a single synaptic train. The images in the central two panels show the same cell with pixels aligned along different branches. The ‘line scans’ on the side panels show the waves recorded along the two trajectories. They initiated at different times and at different distances along the apical axis. The white arrowhead points to the intersection of the two branches.
There are two likely explanations as to why synaptically activated Ca2+ waves begin at branch points along the main dendritic shaft. In one, the shaft has uniform properties and some message propagates from the synaptic locus on the branch to the shaft and initiates a wave at that point. In the other, the main shaft is heterogeneous, with preferred initiation sites at branch points. To help distinguish between these possibilities we generated Ca2+ waves by stimulating a few spikes intrasomatically while superfusing the slice with 30 μM t-ACPD (Nakamura et al. 2000). Figure 6C shows that this protocol evoked waves that in many cases initiated within two superpixels from branch points (n = 17/31) and others (n = 13/31) that initiated more than three superpixels from branch points. In general, we found that when there were several branches within the first 100 μm from the soma on the apical shaft it was more likely that waves would initiate near one of the branches (e.g. Fig. 6A). However, if there were no branches in this region then waves would still initiate in this proximal apical region (Fig. 6B).
Figure 6. Ca2+ waves initiated by backpropagating action potentials in the presence of 30 μM t-ACPD sometimes begin at branch points and sometimes do not.
A, wave initiating at branch point. The three spikes evoked a [Ca2+]i increase that occurred almost synchronously at all dendritic locations. The wave initiated with a delay. B, similar event in another cell. In this case the wave initiated in the proximal apical region even though there were no branches in that region. C, histogram showing the distribution of waves originating at different distances from branch points in the apical dendrites. Most events (16/31) originated within 1 superpixel from a branch point. However, a substantial number (13/31) originated far from branch points (> 3 superpixels).
To confirm that apparent initiation near a branch point was not just a random occurrence we measured the distance between branch points on the apical shaft. In ten cells selected for clear visibility of branch points we found that the mean separation was 7.2 ± 0.6 (range 1-17) superpixels. Therefore, the observed distribution (Fig. 6C), where 52 % of spike-evoked waves began within one superpixel of a branch point, is unlikely to have been produced by random initiation points along the shaft (P < 0.001; χ2 test for goodness of fit). By the same criterion (P < 0.001) the distribution of synaptically evoked waves (Fig. 4B) is also unlikely to have resulted from initiation at random points.
Although the distribution of spike-evoked and synaptically evoked waves clearly shows that most waves of either type initiate at branch points, there were many more spike-evoked waves than synaptically evoked waves that initiated away from branch points. We did two comparisons to test the significance of this difference. In one, we compared the two distributions shown in Fig. 4C and Fig. 6C. In the other, we divided the waves into two groups, those that initiated within 3 superpixels of a branch and those that initiated further away, and compared the groupings from synaptic activation with the groupings from spike activation. By either test the probability of branch point initiation by spikes in t-ACPD was significantly less (P < 0.01; χ2 test for independence) than when the waves were initiated by synaptic stimulation. Since waves evoked in either kind of experiment have a high probability of initiating at branch points, but have different probabilities of initiating away from branches, the tentative conclusion is that there is something special about branch points but other factors contribute to the initiation of waves at these locations. This analysis assumes that the branching patterns of neurons stimulated synaptically are similar to those stimulated by spikes in the presence of t-ACPD. Since the cells were selected for patching before their structure was known this assumption is likely to be true. This issue is examined further in the Discussion.
Interaction between different [Ca2+]i increase-generating mechanisms
Previously (Nakamura et al. 1999), we showed that backpropagating spikes acted synergistically with repetitive synaptic activation of mGluRs to enhance the generation of Ca2+ release in pyramidal neurons. Further experiments using t-ACPD to activate mGluRs demonstrated that the role of spikes in this process was to cause Ca2+ entry through voltage-gated Ca2+ channels (Nakamura et al. 2000). Since there is significant Ca2+ entry through NMDA receptor channels we tested the hypothesis that Ca2+ entering the dendrites through this pathway could also act synergistically with mGluR activation to activate Ca2+ release. Figure 7A shows that blocking the NMDA receptors affected the threshold for evoking regenerative Ca2+ release. Stimulation at 100 Hz for 0.5 s using 50 μA stimulation evoked a Ca2+ wave. Addition of 50 μM APV blocked regenerative release. However, this blockade could be overcome by increasing the stimulus strength to 70 μA. Therefore, as with the action potentials, activation of NMDA receptors acts synergistically with mGluR activation to enhance release, but this synergism is not required. In contrast, mGluR activation was always required to evoke regenerative release. Similar blockade by APV and its reversal with stronger stimulation was found in nine other cells. In three of these neurons complete reversal of the APV effect on washout was recorded.
Figure 7. Ca2+ entry through NMDA receptor channels synergistically enhances mGluR mediated regenerative Ca2+ release.
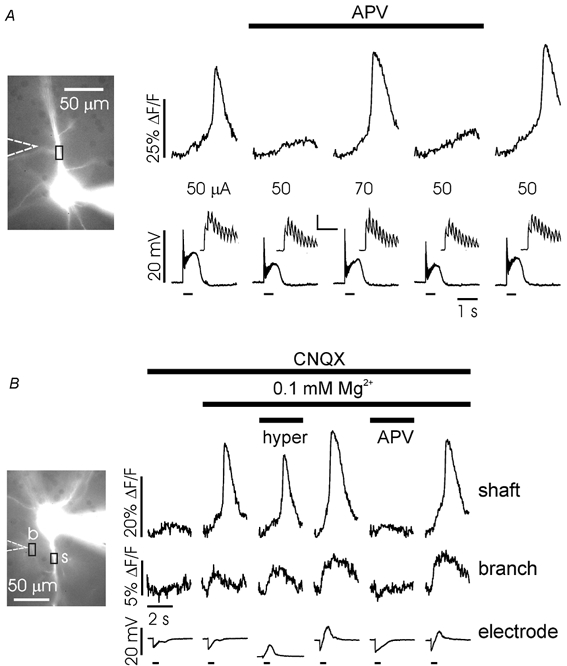
A, APV (50 μM) blocks regenerative release near threshold stimulation intensities. Stimulation at 50 μA (50 pulses at 100 Hz) evoked Ca2+ release in normal ACSF (left panel). Addition of APV blocked release. Increasing the stimulation current to 70 μA evoked release. Return to 50 μA in APV did not evoke release. Washing out APV restored release. The electrical traces show the simultaneously recorded somatic membrane potential. The insets show the first 10 synaptic responses for each trial. Scales for inset: 10 mV, 100 ms. B, Ca2+ entry through the NMDA receptor and not Ca2+ entry through voltage-gated Ca2+ channels enhances Ca2+ release. 10 μM CNQX was present during the entire experiment. In normal ACSF (left panel) synaptic stimulation (50 pulses at 100 Hz) did not evoke regenerative Ca2+ release. Changing to ACSF with 0.1 mm Mg2+ evoked release on the shaft and a [Ca2+]i increase on the branch. These persisted when the membrane was hyperpolarized with the somatic electrode to reverse the IPSP. APV blocked the [Ca2+]i increase at both locations after returning to normal resting potential. Finally, washout of APV restored the initial conditions. The short bars under the electrical traces indicate the duration (0.5 s) of the stimulation trains.
The electrical recordings in this experiment (insets, Fig. 7A) show that APV had a weak effect on the synaptic potential as recorded in the soma. Nevertheless, it is possible that closer to the synapse on the branch the reduction in the synaptic potential was more significant. In this case some of the reduction in Ca2+ entry in APV could be due to fewer Ca2+ channels being opened by the synaptic potential (Miyakawa et al. 1992) instead of direct blockade of the NMDA receptor channels. To show that Ca2+ entry through NMDA receptors by itself could aid mGluR-activated Ca2+ release, we designed a protocol to test the effectiveness of NMDA receptor blockade when voltage-gated Ca2+ entry was minimized (Fig. 7B). For this experiment, 10 μM CNQX was present throughout to block the depolarization due to activation of AMPA receptors. GABAA receptors were not blocked so synaptic activation evoked a prolonged IPSP. The stimulation current was adjusted to be subthreshold for generating a Ca2+ release transient and was maintained at this level for the remainder of the experiment (left panel). When the ACSF was changed to a solution containing 0.1 mm Mg2+ (second panel) the same stimulation evoked Ca2+ release on the shaft and a small [Ca2+]i increase on the branch. To ensure that there was no voltage-gated Ca2+ entry we repeated this stimulation while hyperpolarizing the cell to a potential where the IPSP was reversed (third panel). Release was still observed. When 50 μM APV was added both the release transient and the [Ca2+]i increase on the branch were blocked (fifth panel). Note that, consistent with the results of Fig. 7A, we have previously shown (Nakamura et al. 1999) that Ca2+ release can be evoked in the presence of both CNQX and APV if the stimulus intensity is strong enough. The last panel shows that release was restored following APV washout. Therefore, APV was effective even when there was no voltage-gated Ca2+ entry due to a depolarizing synaptic potential. Components of this sequence were repeated in 11 experiments although the full sequence was completed only twice.
Discussion
Spatial heterogeneity of postsynaptic Ca2+ sources
These experiments clearly show that large amplitude regenerative Ca2+ release from internal stores is confined to the primary apical dendritic shaft of hippocampal CA1 pyramidal neurons and does not extend into the thinner oblique dendrites. This result extends the previous finding (Nakamura et al. 1999, 2000) that regenerative Ca2+ release could not be observed in the distal apical dendrites or in the basal dendrites more than 20 μm from the soma. The common feature of these results is that large amplitude regenerative release is only observed in thick dendrites. There is no obvious reason why dendritic calibre should affect the ability to generate Ca2+ release transients. However, critical molecular components may be differentially distributed among these different size processes (see below). In contrast, NMDA receptor-mediated Ca2+ entry was observed primarily in the oblique dendrites. The third component of postsynaptic [Ca2+]i increase, Ca2+ entry through voltage-gated channels, was detected in all dendritic locations, consistent with results from single channel recordings of Ca2+ channels in dendrites (Magee & Johnston, 1995a) and the detection of backpropagating spikes at all tested points in the arborization (e.g. Spruston et al. 1995). This segregation was not absolute. We found evidence of weak release from stores in the oblique branches (Fig. 2) and small waves in these branches within 10 μm from the main shaft (Fig. 3). These small branch signals may reflect the association near spines of IP3 receptors with mGluRs through the bridging molecule Homer (Tu et al. 1998; Sheng & Lee, 2000). The quantitative distribution of mGluRs on dendrites has not been reported although their perisynaptic distribution on spines is known and their detection on the main shaft has been reported (Lujan et al. 1996).
Anatomical studies (Bannister & Larkman, 1995; Trommald et al. 1995; Megias et al. 2001) suggest that dendritic spines are concentrated on the oblique dendrites with only a few spines on the main apical shaft. The proximal basal dendrites are also devoid of spines. If NMDA receptors are found primarily on spines that would explain why we found the largest NMDA receptor-mediated [Ca2+]i increases on the oblique processes. Consistent with this result, Pettit & Augustine (2000) found that focal release of caged glutamate evoked 6–7 times higher ionotropic current densities on the oblique branches than on the apical shaft. However, the coincidence of the location of spines and the location of NMDA receptor-mediated [Ca2+]i increases does not explain why the regions that are devoid of spines are exactly the regions where we observed regenerative Ca2+ release.
The most likely explanation for the localization of regenerative release to the main shaft is that IP3 receptors are found at the highest density in this region, although the spatial distribution of other critical molecules (e.g. phospholipase C) could also be important. In Xenopus oocytes, Ca2+ waves are found only in a thin region just under the cell membrane where IP3 receptors are concentrated, even when IP3 is produced uniformly within the cell volume (Callamaras & Parker, 1999). The interpretation of the oocyte results, and by extension ours, is that the generation of Ca2+ waves requires that IP3 receptors be at a high enough density so that Ca2+ released from one receptor channel can influence nearby receptors before being buffered or pumped away. The distribution of IP3 receptors in hippocampal pyramidal neurons is not known. In cortical pyramidal neurons there are anecdotal reports that IP3 receptors are concentrated on thicker dendrites (Sharp et al. 1993; Furuichi et al. 1994). The endoplasmic reticulum (ER) itself is thought to extend to all parts of the dendritic arbor, a result that has been clearly established in Purkinje neurons (Martone et al. 1993; Terasaki et al. 1994).
In the absence of evidence about the exact distribution of receptors we can ask whether our results are consistent with a model that has mGluRs restricted to spines on the oblique dendrites and IP3 receptors concentrated on the shaft. For this model to be correct we require a mechanism to communicate mGluR activation and IP3 mobilization on the branch to the IP3 receptors on the shaft. Local release of Ca2+ at the synapse and diffusion to the shaft is unlikely since Ca2+ is highly buffered in the cytoplasm and diffuses slowly. However, local production and diffusion of IP3 to distant targets is more consistent with our experiments, and has been demonstrated in Purkinje cells (Finch & Augustine, 1998; Miyata et al. 2000) and other preparations (Kasai & Augustine, 1990; Kasai & Petersen, 1994). The diffusion constant of IP3 (≈300 μm2 s−1; Allbritton et al. 1992) indicates that this molecule is not significantly buffered. We modelled the diffusion of a bolus of IP3 placed at a synapse using the one dimensional diffusion equation. In this model a significant amount of IP3 travels more than 50 μm within 0.5 s These numbers satisfy our requirements since we placed the stimulating electrode within 50 μm of the main shaft, and regenerative release was usually delayed by more than 0.5 s from the start of synaptic stimulation. If the activated synapses are distributed in a region along the branch and not just at the point opposite the stimulating electrode tip, and if IP3 receptors extend about 10 μm into the branch, then the requirements of this model are even easier to meet. We tried to test this model by placing two stimulating electrodes at different distances along an oblique branch, hoping to find different delays before wave initiation when using the different electrodes (data not shown). However, we could not establish conditions where waves were initiated by the two electrodes with equal facility. More experiments are required to test this hypothesis.
Branch point initiation of Ca2+ waves
A remarkable finding of our experiments was that synaptically activated Ca2+ waves initiated predominantly at branch points on the main apical shaft. This observation is consistent with the above model that assumes IP3 receptors are found in high density only on the main apical shaft. In this case mGluR-mobilized IP3, diffusing along the branch to the shaft, initially would be most concentrated in the shaft at the branch point. This localized high concentration of IP3 would open more IP3 receptors at this location, initiating the regenerative process that produces the Ca2+ wave. Consistent with this idea we found that waves initiated at the base of branches that were closest to the stimulating electrode (Fig. 5A). A variation on this idea, also compatible with our results, is that small waves initiate on the branch within 10 μm of the shaft and then explode into fully regenerative waves when they reach the shaft. The data of Fig. 3 are consistent with this variation. However, in many cells we could not detect any regenerative component on the side branches.
We also found a higher than random number of waves initiating at branch points when backpropagating spikes initiated the waves in the presence of bath-applied t-ACPD (Fig. 6). If the lifetime of IP3 is long compared to the diffusion equilibrium time of this molecule then we would expect the concentration of IP3 to be relatively uniform in the cytoplasm in the steady state. To be consistent with our hypothesis, this uniformity requires a higher concentration of IP3 receptors at branch points for the waves to initiate at those locations. Of course, if IP3 receptors are concentrated at branch points then it will be even easier to initiate waves at those locations when waves are activated synaptically and IP3 diffuses along the branch. Both IP3 receptors (Walton et al. 1991) and ER membranes (Terasaki et al. 1994) are reported to be concentrated at branch points in Purkinje cells, but their distribution in pyramidal neurons is not known. If the lifetime of IP3 is short compared to its diffusion equilibrium time then the steady state distribution may not be uniform. In this case if IP3 is produced predominantly near mGluRs on the oblique branches then the highest concentrations on the main shaft will be at the branch points. In nerve growth factor-differentiated PC12 cells, elementary Ca2+ release events, which may be the initiators of Ca2+ waves (Parker & Yao, 1991), occur more frequently at branch points than at other locations in those cells (Koizumi et al. 1999).
Effect of Ca2+ entry through the NMDA receptor
Previously (Nakamura et al. 1999), we showed that Ca2+ entry through voltage-gated channels opened by backpropagating action potentials, together with mGluR mobilized IP3, could synergistically open IP3 receptors to release Ca2+ from the ER (also shown in Fig. 4C in this paper). In new experiments (Fig. 7) we showed that Ca2+ entry through NMDA receptors similarly could combine with mGluR activation to enhance release. These experiments have to be interpreted more cautiously since most of the NMDA receptor-mediated [Ca2+]i increase is on the oblique branches while Ca2+ release from stores is predominantly on the shaft. There are three possible explanations for the role of NMDA receptors in synergistically evoking Ca2+ release. Firstly, some NMDA receptors are found on the shaft and are activated by synaptic stimulation or focal glutamate activation (Pettit & Augustine, 2000). Consistent with this interpretation, we found a small [Ca2+]i increase on the shaft in the presence of MCPG in many experiments. Since the stimulated Schaffer collaterals cross the shaft even when the electrode is placed close to an oblique dendrite we cannot rule out this possibility. Ca2+ entering through the NMDA receptors on the shaft could activate nearby IP3 receptors. However, it is unlikely that this is the entire explanation since synaptically activated waves initiate at branch points with higher frequency than waves initiated in the presence of t-ACPD, suggesting that stimulation of synapses on branches is important for generating waves.
Secondly, it is possible that the interaction takes place on the branch close to the location of maximum NMDA receptor-mediated [Ca2+]i increase. In this case we must hypothesize that a weak Ca2+ wave is initiated on the branch and does not become clearly observable until it comes close to the shaft. Consistent with this possibility we found weak Ca2+ release on the branches (Fig. 2) and that waves sometimes occurred on branches a few microns from the shaft (Fig. 3).
The third possibility is that the site for the synergistic action of NMDA receptor-mediated Ca2+ entry is not the IP3 receptor but some other molecule. In particular, it is known (Rhee & Choi, 1992) that phospholipase C, the enzyme that generates IP3, requires Ca2+ as a cofactor, or can be activated by Ca2+ alone. Consequently, NMDA receptor-mediated Ca2+ entry could upregulate the production of IP3, enhancing the probability of regenerative Ca2+ release (Hirose et al. 1999; Masgrau et al. 2001; Okubo et al. 2001). None of these possibilities is exclusive; all three mechanisms could contribute to the effectiveness of NMDA receptor activation in evoking Ca2+ release.
Separate from the question of how NMDA receptor-mediated Ca2+ entry enhances Ca2+ release, this result complicates the interpretation of the consequences of NMDA receptor activation. Considered by itself, NMDA receptor-mediated Ca2+ entry produces a local [Ca2+]i increase, usually confined to spines (Yuste & Denk, 1995; Koester & Sakmann, 1998; Kovalchuk et al. 2000). This classic result suggests that the downstream molecules affected by this Ca2+ (including those involved in the induction of long term potentiation (LTP) and long term depression (LTD)) are close to or inside spines. Since regenerative Ca2+ release is not confined to spines and has large amplitude, the ability of NMDA receptor activation to influence this pathway suggests that some of the critical targets of NMDA receptor activation need not be restricted to the spine neighbourhood.
Acknowledgments
We thank John Lisman for comments on an earlier version of the manuscript. This work was supported in part by NIH grant NS16295.
References
- Allbritton NL, Meyer T, Stryer L. Range of messenger action of calcium ion and inositol 1,4,5-trisphosphate. Science. 1992;258:1812–1815. doi: 10.1126/science.1465619. [DOI] [PubMed] [Google Scholar]
- Bannister NJ, Larkman AU. Dendritic morphology of CA1 pyramidal neurones from the rat hippocampus: II. Spine distributions. Journal of Comparative Neurology. 1995;360:161–171. doi: 10.1002/cne.903600112. [DOI] [PubMed] [Google Scholar]
- Callamaras N, Parker I. Radial localization of inositol 1, 4, 5-trisphosphate-sensitive Ca2+ release sites in Xenopus oocytes resolved by axial confocal linescan imaging. Journal of General Physiology. 1999;113:199–213. doi: 10.1085/jgp.113.2.199. [DOI] [PMC free article] [PubMed] [Google Scholar]
- Callaway JC, Ross WN. Frequency-dependent propagation of sodium action potentials in dendrites of hippocampal CA1 pyramidal neurons. Journal of Neurophysiology. 1995;74:1395–1403. doi: 10.1152/jn.1995.74.4.1395. [DOI] [PubMed] [Google Scholar]
- Finch EA, Augustine GJ. Local calcium signaling by inositol-1,4,5-trisphosphate in Purkinje cell dendrites. Nature. 1998;396:753–756. doi: 10.1038/25541. [DOI] [PubMed] [Google Scholar]
- Furuichi T, Kohda K, Miyawaki A, Mikoshiba K. Intracellular channels. Current Opinion in Neurobiology. 1994;4:294–303. doi: 10.1016/0959-4388(94)90089-2. [DOI] [PubMed] [Google Scholar]
- Golding NL, Jung HY, Mickus T, Spruston N. Dendritic calcium spike initiation and repolarization are controlled by distinct potassium channel subtypes in CA1 pyramidal neurons. Journal of Neuroscience. 1999;19:8789–8798. doi: 10.1523/JNEUROSCI.19-20-08789.1999. [DOI] [PMC free article] [PubMed] [Google Scholar]
- Hirose K, Kadowaki S, Tanabe M, Takeshima H, Iino M. Spatiotemporal dynamics of inositol 1,4,5-trisphosphate that underlies complex Ca2+ mobilization patterns. Science. 1999;284:1527–1530. doi: 10.1126/science.284.5419.1527. [DOI] [PubMed] [Google Scholar]
- Hoffman DA, Johnston D. Neuromodulation of dendritic action potentials. Journal of Neurophysiology. 1999;81:408–411. doi: 10.1152/jn.1999.81.1.408. [DOI] [PubMed] [Google Scholar]
- Kasai H, Augustine GJ. Cytosolic Ca2+ gradients triggering unidirectional fluid secretion from exocrine pancreas. Nature. 1990;348:735–738. doi: 10.1038/348735a0. [DOI] [PubMed] [Google Scholar]
- Kasai H, Petersen OH. Spatial dynamics of second messengers: IP3 and cAMP as long-range and associative messengers. Trends in Neurosciences. 1994;17:95–101. doi: 10.1016/0166-2236(94)90112-0. [DOI] [PubMed] [Google Scholar]
- Koester HJ, Sakmann B. Calcium dynamics in single spines during coincident pre- and postsynaptic activity depend on relative timing of back-propagating action potentials and subthreshold excitatory postsynaptic potentials. Proceedings of the National Academy of Sciences of the USA. 1998;95:9596–9601. doi: 10.1073/pnas.95.16.9596. [DOI] [PMC free article] [PubMed] [Google Scholar]
- Koizumi S, Bootman MD, Bobanovic LK, Schell MJ, Berridge MJ, Lipp P. Characterization of elementary Ca2+ release signals in NGF-differentiated PC12 cells and hippocampal neurons. Neuron. 1999;22:125–137. doi: 10.1016/s0896-6273(00)80684-4. [DOI] [PubMed] [Google Scholar]
- Kovalchuk Y, Eilers J, Lisman J, Konnerth A. NMDA receptor-mediated subthreshold Ca2+ signals in spines of hippocampal neurons. Journal of Neuroscience. 2000;20:1791–1799. doi: 10.1523/JNEUROSCI.20-05-01791.2000. [DOI] [PMC free article] [PubMed] [Google Scholar]
- Larkum ME, Kaiser KM, Sakmann B. Calcium electrogenesis in distal apical dendrites of layer 5 pyramidal cells at a critical frequency of back-propagating action potentials. Proceedings of the National Academy of Sciences of the USA. 1999;96:14600–14604. doi: 10.1073/pnas.96.25.14600. [DOI] [PMC free article] [PubMed] [Google Scholar]
- Lasser-Ross N, Miyakawa H, Lev-Ram V, Young SR, Ross WN. High time resolution fluorescence imaging with a CCD camera. Journal of Neuroscience Methods. 1991;36:253–261. doi: 10.1016/0165-0270(91)90051-z. [DOI] [PubMed] [Google Scholar]
- Lujan R, Nusser Z, Roberts JD, Shigemoto R, Somogyi P. Perisynaptic location of metabotropic glutamate receptors mGluR1 and mGluR5 on dendrites and dendritic spines in the rat hippocampus. European Journal of Neuroscience. 1996;8:1488–1500. doi: 10.1111/j.1460-9568.1996.tb01611.x. [DOI] [PubMed] [Google Scholar]
- Magee JC. Dendritic Ih normalizes temporal summation in hippocampal CA1 neurons. Nature Neuroscience. 1999;2:508–514. doi: 10.1038/12229. [DOI] [PubMed] [Google Scholar]
- Magee JC, Cook EP. Somatic EPSP amplitude is independent of synapse location in hippocampal pyramidal neurons. Nature Neuroscience. 2000;3:895–903. doi: 10.1038/78800. [DOI] [PubMed] [Google Scholar]
- Magee JC, Johnston D. Characterization of single voltage-gated Na+ and Ca2+ channels in apical dendrites of rat CA1 pyramidal neurons. Journal of Physiology. 1995a;487:67–90. doi: 10.1113/jphysiol.1995.sp020862. [DOI] [PMC free article] [PubMed] [Google Scholar]
- Magee JC, Johnston D. Synaptic activation of voltage-gated channels in the dendrites of hippocampal pyramidal neurons. Science. 1995b;268:301–304. doi: 10.1126/science.7716525. [DOI] [PubMed] [Google Scholar]
- Martone ME, Zhang Y, Simpliciano VM, Carragher BO, Ellisman MH. Three-dimensional visualization of the smooth endoplasmic reticulum in Purkinje cell dendrites. Journal of Neuroscience. 1993;13:4636–4646. doi: 10.1523/JNEUROSCI.13-11-04636.1993. [DOI] [PMC free article] [PubMed] [Google Scholar]
- Masgrau R, Servitja JM, Young KW, Pardo R, Sarri E, Nahorski SR, Picatoste F. Characterization of the metabotropic glutamate receptors mediating phospholipase C activation and calcium release in cerebellar granule cells: calcium-dependence of the phospholipase C response. European Journal of Neuroscience. 2001;13:248–256. doi: 10.1046/j.0953-816x.2000.01384.x. [DOI] [PubMed] [Google Scholar]
- Megias M, Emri Z, Freund TF, Gulyas AI. Total number and distribution of inhibitory and excitatory synapses on hippocampal CA1 pyramidal cells. Neuroscience. 2001;102:527–540. doi: 10.1016/s0306-4522(00)00496-6. [DOI] [PubMed] [Google Scholar]
- Miyakawa H, Lev-Ram V, Lasser-Ross N, Ross WN. Calcium transients evoked by climbing fiber and parallel fiber synaptic inputs in guinea pig cerebellar Purkinje neurons. Journal of Neurophysiology. 1992;68:1178–1189. doi: 10.1152/jn.1992.68.4.1178. [DOI] [PubMed] [Google Scholar]
- Miyata M, Finch EA, Khiroug L, Hashimoto K, Hayasaka S, Oda S-I, Inouye M, Takagishi Y, Augustine GJ, Kano M. Local calcium release in dendritic spines required for long-term synaptic depression. Neuron. 2000;28:233–244. doi: 10.1016/s0896-6273(00)00099-4. [DOI] [PubMed] [Google Scholar]
- Nakamura T, Barbara JG, Nakamura K, Ross WN. Synergistic release of Ca2+ from IP3-sensitive stores evoked by synaptic activation of mGluRs paired with backpropagating action potentials. Neuron. 1999;24:727–737. doi: 10.1016/s0896-6273(00)81125-3. [DOI] [PubMed] [Google Scholar]
- Nakamura T, Nakamura K, Lasser-Ross N, Barbara JG, Sandler VM, Ross WN. Inositol 1,4,5-trisphosphate (IP3)-mediated Ca2+ release evoked by metabotropic agonists and backpropagating action potentials in hippocampal CA1 pyramidal neurons. Journal of Neuroscience. 2000;20:8365–8376. doi: 10.1523/JNEUROSCI.20-22-08365.2000. [DOI] [PMC free article] [PubMed] [Google Scholar]
- Okubo Y, Kakizawa S, Hirose K, Iino M. Visualization of IP3 dynamics reveals a novel AMPA receptor-triggered IP3 production pathway mediated by voltage-dependent Ca2+ influx in Purkinje cells. Neuron. 2001;32:113–122. doi: 10.1016/s0896-6273(01)00464-0. [DOI] [PubMed] [Google Scholar]
- Parker I, Yao Y. Regenerative release of calcium from functionally discrete subcellular stores by inositol trisphosphate. Proceedings of the Royal Society of London B. 1991;246:269–274. doi: 10.1098/rspb.1991.0154. [DOI] [PubMed] [Google Scholar]
- Pettit DL, Augustine GJ. Distribution of functional glutamate and GABA receptors on hippocampal pyramidal cells and interneurons. Journal of Neurophysiology. 2000;84:28–38. doi: 10.1152/jn.2000.84.1.28. [DOI] [PubMed] [Google Scholar]
- Rhee SG, Choi KD. Regulation of inositol phospholipid-specific phospholipase C isozymes. Journal of Biological Chemistry. 1992;267:12393–12396. [PubMed] [Google Scholar]
- Sakmann B, Stuart G. Patch-pipette recordings from the soma, dendrites, and axon of neurons in brain slices. In: Sakmann B, Neher E, editors. Single Channel Recording. New York: Plenum; 1995. pp. 199–211. [Google Scholar]
- Sandler VM, Ross WN. Serotonin modulates spike backpropagation and associated [Ca2+]i changes in the apical dendrites of hippocampal CA1 pyramidal neurons. Journal of Neurophysiology. 1999;81:216–224. doi: 10.1152/jn.1999.81.1.216. [DOI] [PubMed] [Google Scholar]
- Sharp AH, McPherson PS, Dawson TM, Aoki C, Campbell KP, Snyder SH. Differential immunohistochemical localization of inositol 1,4,5-trisphosphate- and ryanodine-sensitive Ca2+ release channels in rat brain. Journal of Neuroscience. 1993;13:3051–3063. doi: 10.1523/JNEUROSCI.13-07-03051.1993. [DOI] [PMC free article] [PubMed] [Google Scholar]
- Sheng M, Lee SH. Growth of the NMDA receptor industrial complex. Nature Neuroscience. 2000;3:633–635. doi: 10.1038/76576. [DOI] [PubMed] [Google Scholar]
- Spruston N, Schiller Y, Stuart G, Sakmann B. Activity-dependent action potential invasion and calcium influx into hippocampal CA1 dendrites. Science. 1995;268:297–300. doi: 10.1126/science.7716524. [DOI] [PubMed] [Google Scholar]
- Stuart GJ, Sakmann B. Active propagation of somatic action potentials into neocortical pyramidal cell dendrites. Nature. 1994;367:69–72. doi: 10.1038/367069a0. [DOI] [PubMed] [Google Scholar]
- Takechi H, Eilers J, Konnerth A. A new class of synaptic response involving calcium release in dendritic spines. Nature. 1998;396:757–760. doi: 10.1038/25547. [DOI] [PubMed] [Google Scholar]
- Terasaki M, Slater NT, Fein A, Schmidek A, Reese TS. Continuous network of endoplasmic reticulum in cerebellar Purkinje neurons. Proceedings of the National Academy of Sciences of the USA. 1994;91:7510–7514. doi: 10.1073/pnas.91.16.7510. [DOI] [PMC free article] [PubMed] [Google Scholar]
- Trommald M, Jensen V, Andersen P. Analysis of dendritic spines in rat CA1 pyramidal cells intracellularly filled with a fluorescent dye. Journal of Comparative Neurology. 1995;353:260–274. doi: 10.1002/cne.903530208. [DOI] [PubMed] [Google Scholar]
- Tsubokawa H, Ross WN. Muscarinic modulation of spike backpropagation in the apical dendrites of hippocampal CA1 pyramidal neurons. Journal of Neuroscience. 1997;17:5782–5791. doi: 10.1523/JNEUROSCI.17-15-05782.1997. [DOI] [PMC free article] [PubMed] [Google Scholar]
- Tu JC, Xiao B, Yuan JP, Lanahan AA, Leoffert K, Li M, Linden DJ, Worley PF. Homer binds a novel proline-rich motif and links group 1 metabotropic glutamate receptors with IP3 receptors. Neuron. 1998;21:717–726. doi: 10.1016/s0896-6273(00)80589-9. [DOI] [PubMed] [Google Scholar]
- Walton PD, Airey JA, Sutko JL, Beck CF, Mignery GA, Sudhof TC, Deerinck TJ, Ellisman MH. Ryanodine and inositol trisphosphate receptors coexist in avian cerebellar Purkinje neurons. Journal of Cell Biology. 1991;113:1145–1157. doi: 10.1083/jcb.113.5.1145. [DOI] [PMC free article] [PubMed] [Google Scholar]
- Westenbroek RE, Ahlijanian MK, Catterall WA. Clustering of L-type Ca2+ channels at the base of major dendrites in hippocampal pyramidal neurons. Nature. 1990;347:281–284. doi: 10.1038/347281a0. [DOI] [PubMed] [Google Scholar]
- Williams SR, Stuart GJ. Backpropagation of physiological spike trains in neocortical pyramidal neurons: implications for temporal coding in dendrites. Journal of Neuroscience. 2000;20:8238–8246. doi: 10.1523/JNEUROSCI.20-22-08238.2000. [DOI] [PMC free article] [PubMed] [Google Scholar]
- Yuste R, Denk W. Dendritic spines as basic functional units of neuronal integration. Nature. 1995;375:682–684. doi: 10.1038/375682a0. [DOI] [PubMed] [Google Scholar]
- Yuste R, Gutnick MJ, Saar D, Delaney KR, Tank DW. Ca2+ accumulations in dendrites of neocortical pyramidal neurons: an apical band and evidence for two functional compartments. Neuron. 1994;13:23–43. doi: 10.1016/0896-6273(94)90457-x. [DOI] [PubMed] [Google Scholar]
- Zhou S, Ross WN. Threshold conditions for synaptically evoking Ca2+ waves in hippocampal pyramidal neurons. Journal of Neurophysiology. 2002;87:1799–1804. doi: 10.1152/jn.00601.2001. [DOI] [PubMed] [Google Scholar]