

Abstract
In atrial myocytes immunocytochemistry has shown two groups of ryanodine receptors (RyRs): those at the periphery colocalized with dihydropyridine receptors (DHPRs) and those at the cell interior not associated with DHPRs. The extent to which the two sets of RyRs are controlled by Ca2+ current (ICa) or Ca2+ diffusion remains to be determined. Here, using rapid (240 Hz) two-dimensional confocal Ca2+ imaging in rat atrial myocytes, we examine directly the role of ICa on the two-dimensional patterns of local and focal Ca2+ releases. ICa evoked peripheral Ca2+ release within 1–4 ms, causing a rapid monophasic local rise of Ca2+, which then propagated into the cell interior along sarcomeric lines (∼2 μm) with a velocity of ∼230 μm s−1, even though we found no evidence for organized t-tubules using di-8-ANEPPS staining. ICa-triggered Ca2+ release in the cell centre, on the other hand, had both a rapid (≤12 ms) and slower delayed components (12–50 ms). The voltage dependence of peripheral Ca2+ release and the two components of central release was bell shaped, and the magnitude of each release component was linearly related to ICa. Premature termination (2–10 ms) of ICa was equally effective in abbreviating both the peripheral and slow central Ca2+ release. High concentration of Ca2+ buffers (2–5 mm EGTA plus 1 mm fluo-3) completely abolished the ICa-gated propagation wave and the slow delayed component of Ca2+ release, but had little or no effect on the rapid component of central release. The efficacy of ICa to trigger Ca2+ release in periphery of the myocyte was ∼5 times higher than in the centre, consistent with the smaller measured central Ca2+ release. The quantification of central Ca2+ release as a function of peripheral release suggests a cooperative gating mechanism(s) for central release. These findings indicate that both ICa and diffusion of Ca2+ from the peripheral sites contribute to the gating of Ca2+ release from central SR. How in fact the ICa-dependent fast component of central release is activated remains to be determined.
Contraction of mammalian cardiac myocytes is controlled by a sequence of events (E-C coupling) that include ICa-gated opening of Ca2+ release channels (RyRs) in the sarcoplasmic reticulum (SR) (Beukelmann & Wier, 1988; Näbauer et al. 1989; Niggli & Lederer, 1990; Cleemann & Morad, 1991; for review see Morad, 2001). In specialized junctions (dyads and peripheral couplings), the RyRs are found in close proximity (< 20 nm, Sun et al. 1995) to dihydropyridine (DHP)-sensitive Ca2+ channels, providing for privileged cross-signalling between the DHP receptors (DHPRs) and RyRs (Sham et al. 1995; Adachi-Akahane et al. 1996). In cell types lacking t-tubules (atrial cells, Purkinje cells, avian ventricular cells) RyRs are also found in non-junctional or corbular SR throughout the central regions of the cell with no associated DHP receptors. The mode of gating and the contribution of this set of RyRs to cytosolic rise of Ca2+ remains uncertain. It has been suggested that non-junctional RyRs might be activated by diffusion of Ca2+ from neighbouring Ca2+ release sites. Such a mechanism is likely to be regenerative (for review see Berridge, 1997) as it would lack the features that are associated with peripheral or dyadic junctions to provide the negative feedback control over the Ca2+-induced Ca2+ release process (Sham et al. 1995; Soldatov et al. 1998; Morad, 2001).
Confocal Ca2+ imaging in field stimulated atrial cells suggests that Ca2+ release initiated at the periphery propagates into the interior of the myocyte (Berlin, 1995; Hüser et al. 1996; Mackenzie et al. 2001; Kockskämper et al. 2001). What remains uncertain, however, is the extent to which junctional and non-junctional Ca2+ release sites are controlled by ICa. Earlier measurements, in this regard, demonstrate discrepancy between the voltage-dependence of global Ca2+ transients and ICa in human and rabbit atrial myocytes (Hatem et al. 1997; Mitcheson et al. 1997). In the absence of detailed confocal Ca2+ imaging in voltage-clamped myocytes, however, it is difficult to quantify the extent to which the peripheral or central Ca2+ release sites are controlled by ICa. In this respect, in cultured guinea-pig atrial myocytes, the delayed component of Ca2+ release was effectively de-coupled from ICa-gated release with a large concentration of Ca2+ buffer (≈65 mm citrate) (Lipp et al. 1990, 1996). Since these experiments were carried out using a weak and mobile Ca2+ buffer (citrate) and a slow (8 Hz) Ca2+ imaging approach (Lipp et al. 1996), neither the temporal resolution nor the effectiveness of cytosolic Ca2+ buffering were sufficient to determine whether the peripheral junctional sites in atrial cells are as immune to Ca2+ buffers as have been reported for the ventricular dyadic junctions (Sham et al. 1995; Adachi-Akahane et al. 1996; Cleemann et al. 1998).
To address these issues we used rapid (240 Hz) 2-D confocal microscopy in voltage-clamped atrial myocytes dialysed with different concentrations of Ca2+ buffer (fluo-3, EGTA) to monitor simultaneously the Ca2+ release process near the periphery and at the interior during ICa. Our results suggest that the peripheral Ca2+ release was mediated by focal Ca2+ release which like ventricular dyadic Ca2+ release was directly gated by ICa (Shacklock et al. 1995; Cleemann et al. 1998). Unexpectedly, however, we found that both the slow and fast components of central Ca2+ release of atrial myocytes were also under continuous control of ICa.
Methods
Single cell isolation
Rat atrial myocytes were enzymatically isolated from male Wistar rats (200-300 g) as described by Mitra & Morad (1985). Briefly, rats were deeply anaesthetized with sodium pentobarbital (150 mg kg−1i.p.), the chest cavity was opened and hearts were excised. This surgical procedure was carried out in accordance with institutional ethical guidelines. The excised hearts were retrogradely perfused at 7 ml min−1 through the aorta, first for 5 min with Ca2+-free Tyrode solution composed of (mm): 137 NaCl, 5.4 KCl, 10 Hepes, 1 MgCl2, 10 glucose, pH 7.3, at 37 °C and then with Ca2+-free Tyrode solution containing collagenase (1.4 mg ml−1) and protease (0.16 mg ml−1) for 12 min, and finally with Tyrode solution containing 0.2 mm CaCl2 for 6 min. The atria of the digested heart were then cut into several sections and subjected to gentle agitation to dissociate the cells. The freshly dissociated cells were stored at room temperature in Tyrode solution containing 0.2 mm CaCl2.
Measurement of membrane currents
Myocytes were whole-cell clamped (Hamill et al. 1981) with patch pipettes (tip resistance, 2.5-3.5 MΩ) and dialysed with a Cs+-rich solution (see below) containing 0.4-1 mm fluo-3 and 2–5 mm EGTA. cAMP (200 μM) was added to the pipette solution to enhance ICa and prevent rundown during long (30-40 min) experimental times. Membrane currents were measured with a Dagan (model 8900, Dagan Co., Minneapolis, MN, USA) patch-clamp amplifier. Generation of the voltage-clamp protocol and acquisition of data were carried out using pCLAMP software (version 5.5-1; Axon Instruments, Inc., Foster City, CA, USA). The current signals were filtered at 10 kHz before digitization and storage. Currents were neither leak nor capacitance subtracted (to obtain high quality data and to control for myocyte viability), but series resistance (1.5-3 times the pipette resistance) compensated. Since two-dimensional imaging of the myocytes required 6–7 min of dye dialysis, only cells with little leak current and clear edges were included in the final analysis of the results.
Two-dimensional confocal Ca2+ imaging
Cells were loaded with the Ca2+ indicator dye fluo-3 via the patch pipette (see above) and were imaged using a Noran Odyssey XL rapid 2-D laser scanning confocal microscopy system (Noran Instruments, Madison, WI, USA) attached to a Zeiss Axiovert TV135 inverted microscope fitted with a × 40 water-immersion objective lens (Zeiss, 440052 C-A pochromat, NA 1.2). The excitation wavelength of the argon ion laser was set to 488 nm (Omnichrome), and fluorescence emission (wavelengths greater than 510 nm) was detected by a high-efficiency photomultiplier tube (Hamamatsu, Middlesex, NJ, USA). The y direction (vertical direction in the figures) was scanned at 240 Hz to produce frames with 225 × 90 pixels sampled on a square, 0.207 μm grid. The confocal slit, stretching in the x direction, was set to values corresponding to a width of 0.6 μm in the confocal plane of the objective. The data were acquired using Intervision software on a workstation computer (IRIX operating system, Indy, Silicon Graphics) and were analysed using both the Intervision software and a custom-written PC computer program in Visual Basic 6.0 (Microsoft).
Fluorescence measurements were carried out 6–7 min after rupture of the membrane with the patch pipette except in those cells where the effects of dialysing the cells with Ca2+ buffers were examined (Fig. 7). After this period of dialysis, the intracellular fluo-3 concentration was typically at equilibrium throughout the atrial cells (data not shown). Approximately 3 min after rupture of membrane ten conditioning voltage pulses from −90 to −10 mV were applied at 0.1 Hz to maintain the Ca2+ load of the SR. To reduce photobleaching of the dyes and possible phototoxic effects to the cells, the laser was electronically shuttered and triggered to open by the command of patch-clamp program (pCLAMP) only during the data acquisition period (< 200 ms per one acquisition). The average resting fluorescence intensity (Fo) was calculated from several frames measured immediately before ICa-gated Ca2+ releases. Ca2+ signals were quantitatively illustrated by the sequences of frames showing the change in fluorescence (ΔF) relative to the resting average fluorescence (Fo). This method of normalization was used to show focal and local Ca2+ changes as clearly as possible without resorting to the use of contrast enhancement. We also relied, in part, on a colour scale that presents total fluorescence (F) with a large dynamic range. Tracings of local Ca2+ transients were shown as the average fluorescence of each frame normalized relative to the average resting fluorescence (F /Fo). This type of normalization was used to permit comparison of results from different cells. To measure local Ca2+ transients confocal images were arbitrarily divided into four domains from cell periphery to centre (Fig. 1B). The area 1.5 μm immediately underneath the cell membrane was denoted as the peripheral region. In some records (Fig. 2A, right panel) we identified patterns of focal Ca2+ releases following strategies previously described (Cleemann et al. 1998). Briefly, records were screened based on their signal-to-noise ratio, and the contrast was enhanced using a centre-minus-surround kernel (consisting of pixels approximating a positively weighted central disk of radius ≈0.65 μm surrounded by a concentric negatively weighted ring of radius 1-1.5 μm). This produced records with local maxima that were identified as focal Ca2+ releases if they (a) could be followed from frame to frame (often increasing in intensity, then spreading and fading), (b) occurred at repeatable locations from one voltage clamp depolarization to the next, and (c) at rest (-60 mV) occurred only in small numbers (spontaneous Ca2+ sparks). The noise in the records produced much smaller random fluorescence maxima that were de-emphasized in illustrations by adjusting the colour scale. Frames were sometimes averaged for illustration purposes to improve the signal-to-noise ratio while sacrificing temporal resolution. This strategy was useful to show the overall features of Ca2+ release patterns (Fig. 2C).
Figure 7. Effect of Ca2+ buffers on ICa-triggered local Ca2+ release.
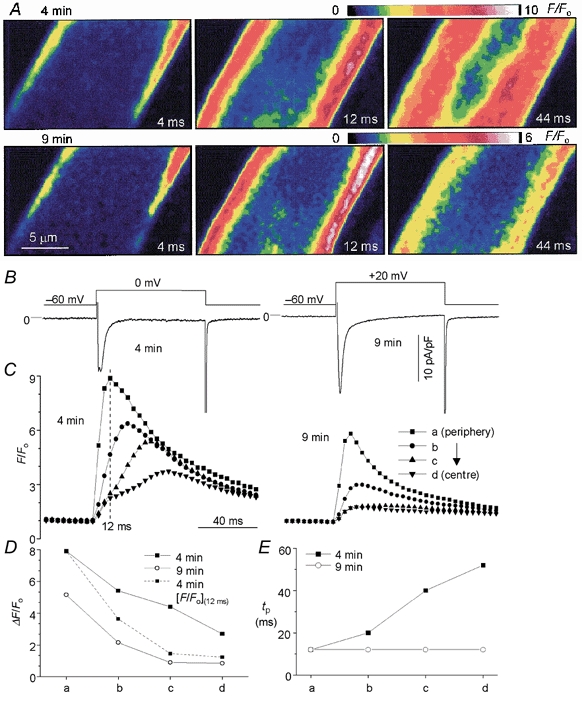
A, ICa-induced confocal Ca2+ images measured at 4 min (upper panel) and 9 min (lower panel) following the onset of dialysis with 1 mm fluo-3 and 2 mm EGTA. The values in the bottom right corner of each image indicate the times when the images were recorded following the onset (0 ms) of depolarization. B, voltage clamp protocols and ICa measured at 4 min (left panel) and 9 min (right panel) following dialysis. C, four local Ca2+ transients measured from subcellular regions from the periphery (a) to the centre (d) at 4 min (left panel) and 9 min (right panel) following dialysis with the Ca2+ buffers. D, comparison of the magnitude of local Ca2+ transients measured at 4 and 9 min of dialysis. Dashed line in D shows values of ΔF/Fo measured at 12 ms following the onset of Ca2+ rise measured at 4 min of dialysis. Times to peak (tp) of four local transients recorded at 4 and 9 min are compared in E. The internal solution contained 1 mm K5fluo-3, 2 mm EGTA and 5 mm Na+.
Figure 1. ICa-triggered local Ca2+ releases from mid-section of a rat atrial myocyte.
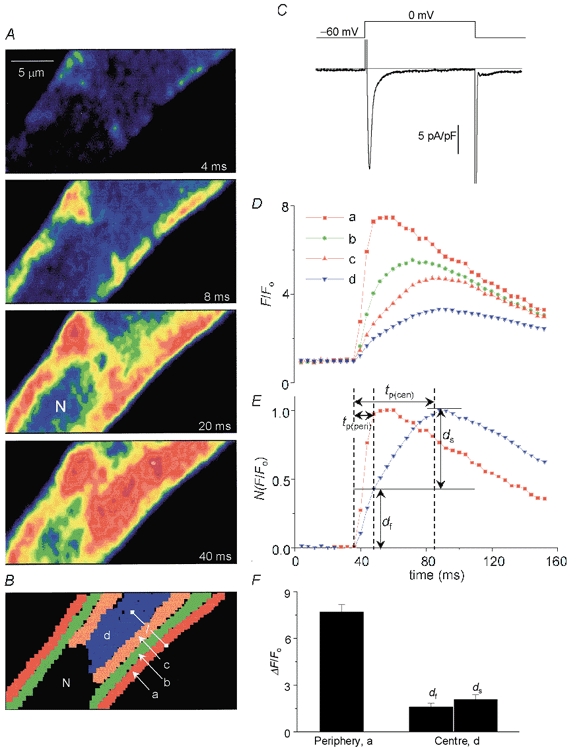
A, two-dimensional Ca2+ release pattern when ICa was activated by depolarization from −60 to 0 mV. Numbered sample frames of total fluorescence (F) recorded at 240 Hz at times indicated following depolarization. Colour scale is same as that shown in Fig. 2A. B, the imaged area of four local Ca2+ domains (a-d) indicated by different colours, using pixels of the analysis program. N represents the nucleus. C, the voltage clamp protocol and the time course of ICa. D, ICa-triggered local Ca2+ transients (F/Fo) averaged in each coloured mask (B). E, comparison of superimposed traces of normalized peripheral (a, red) and central Ca2+ transient (d, blue). Local Ca2+ transients were characterized by their times to peak (tp(peri), periphery; tp(cen), centre). Central Ca2+ transients could be best described by a fast phase lasting ≈12 ms and slower rising phase lasting about 12–50 ms following the onset of Ca2+ rise. F, mean amplitude of peripheral Ca2+ releases, and the fast (df) and slow (ds) components of central releases measured in five cells. The pipette solution contained 0.4 mm K5fluo-3 and zero Na+.
Figure 2. Sarcomeric pattern of ICa-gated focal Ca2+ release sites.
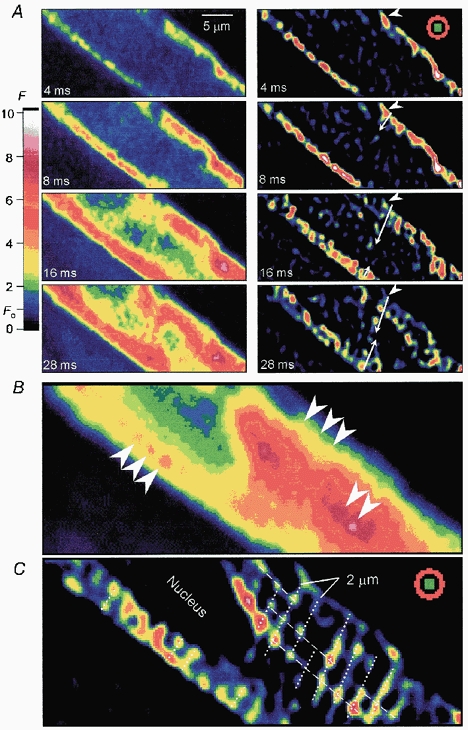
Left panel in A shows series of raw confocal Ca2+ images measured immediately following depolarization from −60 to 0 mV. The colour scale provides a calibration of the fluorescence intensity (F) relative to the resting fluorescence (Fo = 1). Measured frames (left panel, A) were filtered with a centre-minus-surround kernel (inset, 4 ms image in right panel) to enhance focal Ca2+ release sites (right panel, A). Then, the enhanced images were scaled and offset to emphasize the local maxima. The sequential activation of focal release sites from cell periphery (arrowhead) to the centre is indicated by the white arrow. B, confocal Ca2+ image averaged from the four frames recorded at 44–56 ms following the onset of depolarization, when the delayed central Ca2+ release was substantial. C, enhanced image obtained by averaging four filtered frames (44-56 ms) with centre-minus-surround kernel and by offsetting to remove noisy signals. Focal Ca2+ release sites in the centre and periphery were regularly aligned with 2 μm sarcomeric spacing (B, arrowheads; C, dotted lines). Dashed lines indicate longitudinal arrangement of focal release sites. The internal solution contained 0.4 mm K5fluo-3 and zero Na+.
Solutions and data analysis
The solution used for cellular equilibration and formation of the gigaseal contained (mm): 137 NaCl, 5.4 KCl, 2 CaCl2, 10 Hepes, 1 MgCl2, 10 glucose, buffered to pH 7. 4 with NaOH. Patch pipettes were filled with solutions containing (mm): 110 CsOH, 110 aspartic acid, 0–10 NaCl, 20 TEA-Cl, 20 Hepes, 5 Mg-ATP, 0.2 cAMP, 0.4 or 1 K5fluo-3 (Molecular Probes Inc.), 2 EGTA, with the pH adjusted to 7.2 with CsOH. At 2 min following rupture of the membrane, myocytes were superfused with K+-free Tyrode solution containing 10–30 μM tetrodotoxin and 5 mm Ca2+ to eliminate K+ and Na+ current, and to load SR. In some experiments 2 mm Ca2+-containing extracellular solution was used (Fig. 5 and Fig. 6). Drugs were dissolved in the external experimental solutions, and applied rapidly using a concentration-clamp device (Cleemann & Morad, 1991). All experiments were carried out at room temperature (22-24 °C). Numerical results are presented as means ± s.e.m. (n = number of cells), where s.e.m. is the standard error of the mean. One-way analysis of variance (ANOVA) was used to verify statistical significance with P < 0.05 taken as the level of significance.
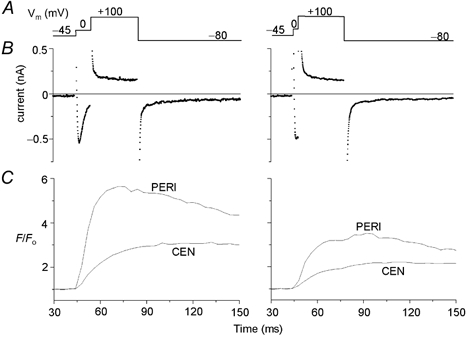
Figure 5. Interruption of the development of local Ca2+ release by intervention of ICa.
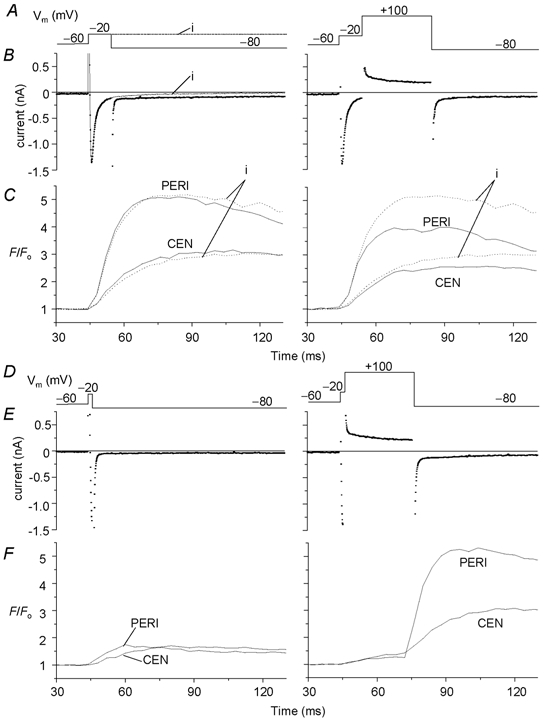
A and D, schematic diagram of the voltage clamp protocol (Vm). B and E, membrane currents. The current denoted ‘i’ was measured on depolarization to −20 mV for 85 ms. C and F, peripheral (PERI) and central (CEN) Ca2+ transients measured from 2-D confocal images simultaneously measured with the corresponding membrane current shown in B and E, respectively. Dotted trace in C indicates local Ca2+ transients activated by an 85 ms depolarizing pulse to −20 mV. The tail current activated on repolarization from +100 to −80 mV induced a further Ca2+ release, resulting in a little hump of Ca2+ transient (right panels). The cell was dialysed with internal solution containing 0.4 mm K5fluo-3 and zero Na+. [Ca2+]o = 2 mm.
Figure 6. Effect of ICa duration on peripheral and central Ca2+ release.
A, schematic of the voltage clamp protocol (Vm). B, membrane currents recorded during the corresponding clamp pulses. C, peripheral (PERI) and central (CEN) Ca2+ transients measured from 2-D confocal images simultaneously with the corresponding membrane currents shown in B. The amplitudes of the peripheral and central Ca2+ transients were reduced as the duration of a depolarizing clamp pulse to 0 mV was reduced from 10 (left panels) to 5 ms (right panels). The cell was dialysed with internal solution containing 0.4 mm K5fluo-3 and zero Na+. [Ca2+]o = 2 mm.
Results
Two-dimensional confocal imaging of ICa-gated local Ca2+ release
Figure 1A shows sequential two-dimensional (2-D) rapid (240 Hz) confocal images of Ca2+ release triggered by the activation of L-type Ca2+ current, obtained from the mid-section of a rat atrial myocyte dialysed with 0.4 mm fluo-3. Before a confocal plane was fixed for measurements, whole-cell images were routinely monitored in a vertical (z-) direction from top to bottom of a myocyte (average thickness: 11.1 ± 0.72 μm, n = 13) to determine the middle of the cell (defined as the image with sharp edges and most prominent nucleus). Each confocal frame was scanned from the bottom up in 3 ms, such that the released Ca2+ first appeared at sites in the upper segment of the 4 ms image. ICa activated at 0 mV induced focal Ca2+ releases first underneath the surface membrane with significant spatiotemporal non-uniformity (Fig. 1A, 4 and 8 ms images). Within the next 40 ms, however, the ICa-triggered peripheral Ca2+ release also invaded the centre of the myocyte (Fig. 1A, 20 and 40 ms images). The spatiotemporal non-uniformity associated with Ca2+ signalling in the atrial myocyte was most apparent when measuring the average Ca2+ rise in four local Ca2+ domains (areas a-d, Fig. 1B). Figure 1C and D shows simultaneous measurements of whole-cell ICa and the local Ca2+ transient, quantified from the confocal images illustrated partly in Fig. 1A. Peripheral Ca2+ increased with a single rapid rising phase during the first 12 ms as ICa was fully activated and mostly inactivated (Fig. 1D, trace a). The increase of Ca2+ in the centre (trace d) was characterized by two rising phases: a fast phase lasting 12 ms (df, Fig. 1E) followed by a slower phase lasting 12–50 ms (ds, Fig. 1E). In the minimally Ca2+-buffered cells the peripheral and central Ca2+ releases appeared to reach their maximal value in 16.9 ± 2.3 and 51.6 ± 2.5 ms (n = 5) following the depolarizing pulse from −60 to 0 mV, suggesting significant delay of the central Ca2+ release. This type of analysis shows that the peripheral local Ca2+ transients decay before the local Ca2+ transients at the centre reach their maxima. This finding is consistent with the idea that the increase in local Ca2+ caused by Ca2+-induced Ca2+ release at the periphery propagates dynamically via a regenerative Ca2+ release process into the centre of myocyte. The propagation velocity (Vp) of the released Ca2+, triggered by ICa, into the centre of the cell was measured using the equation:
where l is a distance (expressed in μm, Fig. 1B) between cell periphery (area a) and the centre (area d), and Δt is the delay (expressed in ms) of central release, calculated as the difference between the time-to-peak of the Ca2+ transients measured from periphery (tp(peri)) and centre (tp(cen)) (Fig. 1E). Vp was 230 ± 24 μm s−1 (n = 5), which may reflect the slow phase of Ca2+ rise at the centre. In a total of five atrial myocytes dialysed with 0.4 mm fluo-3 the amplitude of Ca2+ transients (ΔF/Fo) was higher in the periphery (7.7 ± 0.47) than that of either the slow (ds, 2.1 ± 0.31) or the fast component (df, 1.6 ± 0.25) of the central Ca2+ release (Fig. 1F). The magnitude of slow central release (ds) could be underestimated because it was estimated as the difference between peak and the signal level corresponding to df.
Figure 4. Voltage and ICa dependence of peripheral and central Ca2+ releases.
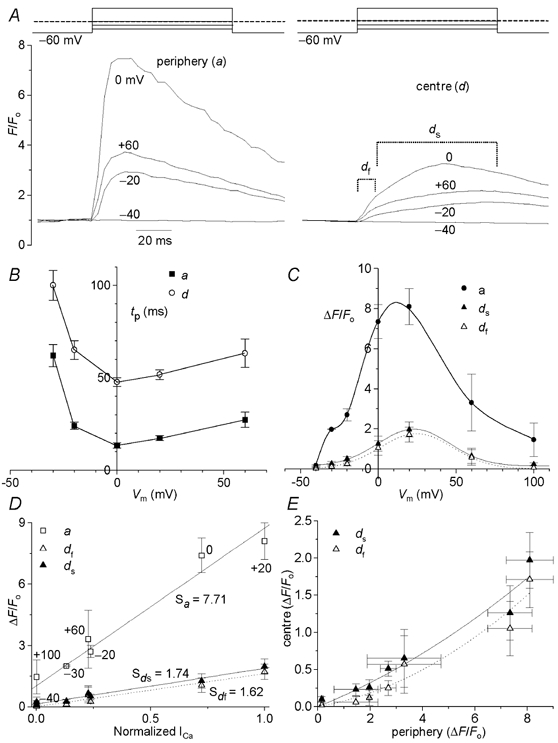
A, voltage clamp protocols, and peripheral (left tracings) and central Ca2+ transients (right tracings) measured from the confocal images illustrated in Fig. 3C–F. The peripheral (a) and central (d) Ca2+ domains were dissected as indicated in Fig. 1B. Dashed line indicates 0 mV. B, voltage dependence of the mean time-to-peak (tp) of peripheral and central Ca2+ transients (n = 7). C, voltage dependence of the mean peripheral Ca2+ transients (ΔF/Fo), and that of the rapid (df) and slow (ds) components of the central Ca2+ transients (n = 4). The mean local Ca2+ releases (ΔF/Fo) measured in the periphery (a) and centre (df, fast component; ds, slow component) were plotted against normalized ICa (D, n = 4). S indicates the slope of the relation. E, relation between peripheral and central Ca2+ release (n = 4).
Sarcomeric pattern of ICa-gated focal Ca2+ release
To determine the location of focal Ca2+ release sites activated by ICa in the minimally Ca2+-buffered myocytes, the local maxima in the Ca2+ distribution of each individual frame imaged sequentially during the activation of ICa (Fig. 2A, left panel), were amplified by filtering with centre-minus-surround kernel (Fig. 2A, right panel, 4 ms image, inset), thus enhancing the clarity of focal release sites (Fig. 2A, right panel). At the onset of depolarization, focal Ca2+ release sites first appear as bright spots at the periphery (the 4 ms image), but within 16 ms of depolarization some of the peripheral sites start to fade, as more centrally located release sites start activating sequentially. In some regions sequential activation of the release sites from cell periphery to the centre could be followed (Fig. 2A, white arrows). Both central and peripheral release sites were aligned with an ≈2 μm sarcomeric pattern (Fig. 2C, dotted lines). Note that even in the unenhanced image of Fig. 2B a weak striped pattern is detectable (arrowheads). Interestingly, release sites on the y-axis of the cell image also appear to have longitudinal alignments (Fig. 2C, dashed lines). The onset of central focal Ca2+ release varied from cell to cell, such that in some of the minimally Ca2+-buffered myocytes the activation of central release sites occurred simultaneous with that of the peripheral sites (data not shown).
Voltage dependence of local Ca2+ release
To gain insight into the mechanisms that regulate Ca2+ release sites in the periphery and centre of the cell, we examined their voltage and ICa dependence. Atrial cells were depolarized approximately every 2 min by a sequence of 80 ms voltage clamp pulses from −60 mV. These test pulses were preceded by a train of ten 100 ms conditioning pulses applied from −90 to −10 mV at 0.1 Hz to maintain the intracellular Ca2+ stores at a steady state level. This procedure produced ICa-gated Ca2+ transients of similar magnitude and kinetics, indicating stable Ca2+ loading of the SR. We confirmed that this approach maintained the Ca2+ load of the SR by using 10 mm caffeine to rapidly release the intracellular stores (data not shown). Figure 3C–F displays four series of 2-D confocal Ca2+ images simultaneously measured with ICa activated at −40, −20, 0 and +60 mV in Fig. 3A. The first confocal image in each set, representing resting Ca2+ recorded at −60 mV, had low fluorescence. Except at −40 mV where no significant Ca2+ releases were detected, Ca2+ release started to occur in the cell periphery, propagating then into the interior of the cell. Both ICa and Ca2+ signals increased as the myocyte was depolarized sequentially to −20 and 0 mV. Clamp pulses to more positive potentials (+60 mV) reversed this trend such that both ICa and the Ca2+ release reached relatively low levels at potentials approaching the Ca2+ reversal potential.
Figure 3. ICa-dependent two-dimensional Ca2+ release signal.
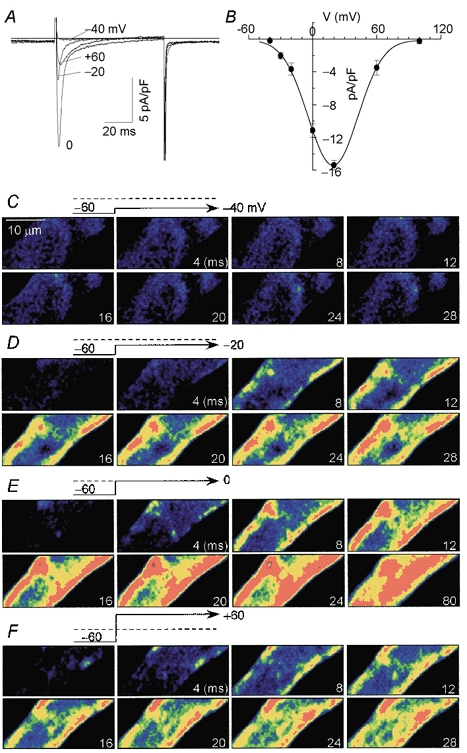
ICa (A) and series of two-dimensional confocal Ca2+ images simultaneously measured during depolarizations to −40 (C), −20 (D), 0 (E) and +60 mV (F) from a holding potential of −60 mV. B, voltage dependence of the amplitude of peak ICa (n = 4). Each image was recorded at every 4 ms interval. First frames in C-F show resting images (Fo) measured immediately prior to depolarizations. The numbers marked in each image indicate depolarizing duration following the onset of depolarization. Dashed lines in the voltage protocol indicate 0 mV. Colour scale is the same as that shown in Fig. 2A. Cell was dialysed with internal solution containing 0.4 mm K5fluo-3 and zero Na+.
Figure 4A compares the time courses of Ca2+ transients at different potentials measured at the peripheral (a) and central domain (d) of the cell as schematically indicated in Fig. 1B. Whereas the peripheral local Ca2+ transients increase rapidly with depolarizations (-20 to +60 mV), local Ca2+ transients measured at the centre consistently showed fast (df) and slow delayed (ds) components. Figure 4B quantifies the time-to-peak (tp) of the Ca2+ transients measured at different potentials in cell periphery and centre. Time-to-peak of Ca2+ transients had clear voltage dependence between −30 and +20 mV, with a minimal value around 0 mV. Quantification of tp of local Ca2+ transients in different cells (n = 7) showed that although the kinetics of Ca2+ release was slower in the central region of the cell, their voltage dependence was similar, suggesting a similar gating mechanism for the release sites in both regions. However, the delay times (tp(cen) - tp(peri)) had no voltage dependence and were constant at ≈40 ms, suggesting that the propagation velocity was independent of the magnitude of ICa. The voltage dependence of local Ca2+ releases in the periphery and the centre were both bell shaped (Fig. 4C, n = 4) and qualitatively similar to that of simultaneously measured ICa (Fig. 3B). Surprisingly, both the fast and the delayed rising phase of central Ca2+ transients had bell-shaped voltage dependence. As expected, the sum of the two central release components had also bell-shaped voltage dependence (data not shown), qualitatively similar to that of ds points in Fig. 4C.
Figure 4D and E examines the relation between the magnitudes (mean ΔF/Fo) of peripheral and central Ca2+ release, and their dependence on ICa. The relationship between ICa and local rises of Ca2+ was linear for both peripheral and central releases (Fig. 4D). The slope of the relation reflecting the efficacy of ICa to trigger Ca2+ release, on the other hand, appeared to depend on subcellular regions of myocyte, such that the slope of the relationship in the periphery was about 4.5 times larger than that of the centre (Fig. 4D). The dependence of slow and fast components of the central Ca2+ release on the peripheral releases was best approximated by a second-order function (parabola function, Fig. 4E), suggesting involvement of a cooperative gating mechanism for the central releases. Taken together, these results suggest that although ICa may be the primary triggering mechanism of Ca2+ release in both periphery and the centre of the myocytes, the peripheral release sites are more effectively regulated by sarcolemmal Ca2+ channels than the slowly activating central release sites.
Effect of duration of ICa on local Ca2+ release
If the release of Ca2+ from both peripheral and central SR is initiated by the influx of Ca2+ through the Ca2+ channel, then it is likely that premature termination of the Ca2+ current might also terminate the release process. To test whether the duration of ICa also regulates peripheral and central Ca2+ release in a manner similar to that obtained for the voltage dependence of ICa, we carried out a series of experiments where Ca2+ influx was terminated either by deactivation of the channel or by reducing the driving force for the influx of Ca2+ through the channel. Figure 5A–C compares the effects of these two interventions applied 10 ms after the activation of ICa at −20 mV on peripheral and central Ca2+ transients. Superimposed tracing of peripheral and central release suggests little difference in Ca2+ transient activated by a 10 or 85 ms (trace i) pulse as long as ICa was allowed to almost fully activate and inactivate (Fig. 5A–C, left panels, n = 5). Note that the initial Ca2+ rise for 10 ms following a depolarizing pulse to −20 mV and terminated by clamping to +100 mV was similar to that accompanying the 85 ms pulse to −20 mV (dotted traces), but local Ca2+ transients were significantly smaller if ICa was terminated by depolarizing to +100 mV (Fig. 5A–C, right panels, n = 5). This finding suggests that ICa deactivation ‘tail’ (Fig. 5B, left panel) induced by repolarization to −80 mV triggers additional Ca2+ release in the periphery and centre of the myocyte (Fig. 5C) that contributes to the measured local Ca2+ transients. In Fig. 5D–F the 85 ms clamp pulse was shortened to 2 ms by repolarization either to −80 mV or by clamping to +100 mV (near equilibrium potential for Ca2+, ECa). Both procedures resulted in significant decrease in Ca2+ release in the cell periphery and centre (Fig. 5D–F, n = 3). Somewhat smaller Ca2+ release was noted even with 2 ms depolarization when ICa was terminated by depolarizing to +100 mV (Fig. 5F, n = 3), suggesting that tail Ca2+ current induced release on repolarization from −20 to −80 mV was in part responsible for the larger release at −80 mV. Figure 5D–F also shows that strong tail Ca2+ current triggered Ca2+ release could be induced on repolarization from +100 to −80 mV.
In another set of experiments ICa-triggered Ca2+ release in peripheral and central domains was compared using 5 and 10 ms ICa pulses, prematurely terminated by depolarization to +100 mV (Fig. 6). This procedure prevented triggered release of Ca2+ by tail current on repolarization of membrane. Shortening the duration of ICa from 10 to 5 ms caused about 50 % reduction in Ca2+ release in both peripheral and central regions of the cell (n = 3). Taken together these results suggest that not only the peripheral but also the central Ca2+ release is regulated primarily by the influx of Ca2+ through the Ca2+ channel.
Effect of Ca2+ buffers on local Ca2+ transients
To examine the possibility that the local diffusion of Ca2+ from the cell periphery to the centre activates the centrally located release sites, myocytes were dialysed with 2 mm EGTA and 1 mm fluo-3 to limit the Ca2+ diffusion distance (Adachi-Akahane et al. 1996). Figure 7 compares the profiles of ICa-triggered Ca2+ releases measured, in the same atrial myocyte, following 4 and 9 min of dialysis with Ca2+ buffers. With the activation of ICa, Ca2+ release was triggered at the cell periphery in both the 4 (Fig. 7A, upper panel, 4 ms image) and 9 min dialysis periods (Fig. 7A, lower panel, 4 ms image). Following 9 min of dialysis, however, the propagation of Ca2+ from periphery to the centre was fully suppressed (Fig. 7A, lower panel, 12 and 44 ms images) even with maximal activation of ICa (Fig. 7B, right panel).
To quantify the effect of Ca2+ buffers on the kinetics of propagation of Ca2+ into the centre of myocyte, local Ca2+ transients were measured in four different domains (as schematically indicated in Fig. 1B). Figure 7C compares the properties of four such local Ca2+ transients measured at two different dialysis periods (4 and 9 min). The peak magnitudes and time to peak of local transients shown in Fig. 7C were plotted vs. the relative distance from the cell periphery in Fig. 7D and E, respectively. Local Ca2+ transients of more central regions developed slower than in the periphery and had two distinct rising components at the end of 4 min dialysis (Fig. 7C, left tracings). In sharp contrast, following 9 min of dialysis with Ca2+ buffers, all local Ca2+ transients peaked at the same time (12 ms) and had a single rising phase (in Fig. 7C and E, right tracings). In addition, the magnitudes of four local Ca2+ transients were significantly smaller than those measured at 4 min dialysis (Fig. 7C and D).
The effects of Ca2+ buffers on ICa-induced Ca2+ release from cell periphery and centre are summarized in Table 1. The results suggest that the delayed central releases are completely suppressed by the presence of Ca2+ buffers such that the delay (2.70 ± 0.18 ms) of central release was almost negligible (within the temporal resolution ≈2 ms of confocal imaging). Interestingly, the rise in peripheral Ca2+ appeared to be a little faster (≈4 ms) under high Ca2+-buffering conditions. Comparing the effect of high concentrations of Ca2+ buffers on the fast components of peripheral and central Ca2+ release suggests that the amplitude of the local Ca2+ transient in the periphery was suppressed by 44 %, compared with 18 % inhibition of the fast central component (df).
Table 1.
Effect of Ca2+ buffers on ICa-induced Ca2+ transients from cell periphery and centre
| 0 EGTA, 0.4 fluo-3 | 2 EGTA, 1 fluo-3 | |
|---|---|---|
| tp (ms) | ||
| Periphery (tp(peri)) | 16.9 ± 2.3 (5) | 12.8 ± 0.48 (15) |
| Centre (tp(cen)) | 51.6 ± 2.5 (5) | 15.5 ± 0.36 (15) |
| Δ[Ca2+]i | ||
| Periphery | 8.10 ± 0.47 (5) | 4.51 ± 0.20 (15) |
| Centre, df | 1.71 ± 0.35 (5) | 1.41 ± 0.15 (15) |
| Centre, ds | 1.97 ± 0.37 (5) | — (15) |
| Central delay (tp(cen) - tp(peri)) | 34.7 ± 3.53 (5) | 2.70 ± 0.18 (15) |
The ICa-dependent Ca2+ release was elicited by 80 ms depolarizing pulses to +20 mV. The holding potential was −60 mV. The time to peak, tp, measured in the centre (tp(cen)) and periphery (tp(peri)) indicates the time from the beginning of depolarization to the peak of Ca2+ release. The Ca2+ transients were measured as ΔF/Fo. The df and ds indicate fast component and delayed slow component of central releases, respectively. Data are means ± s.e.m. with the number of cells in parentheses (n).
Table 2 compares the effects of introducing different concentrations of Ca2+ buffers on the time-to-peak and amplitude of the global Ca2+ transients. The results suggest that the tp of global Ca2+ transients become shorter as the concentrations of EGTA and fluo-3 are increased. The decrease of tp might be, in part, related to suppression of delayed phase of Ca2+ release. Note also, that there was little difference in tp between 2 and 5 mm EGTA. These findings are consistent with the notion that EGTA acts as a slow buffer, and does not significantly alter the Ca2+ release kinetics (Blatter & Wier, 1990; Adachi-Akahane et al. 1996). On the other hand, the amplitude of Ca2+ transients was strongly suppressed by higher concentrations of Ca2+ buffers. Table 2 also shows the results of another set of experiments where we compared the effect of intracellular Na+ concentrations on the Ca2+ release parameters. Changing the intracellular Na+ from 0 to 5 or 10 mm failed to significantly change tp. The magnitude of global Ca2+ transients, however, was slightly higher in Na+-containing myocytes.
Table 2.
Effects of intracellular Ca2+ buffers and Na+ on ICa-triggered global Ca2+ releases in rat atrial myocytes
| [EGTA]i | [fluo-3]i | [Na+]i | tp (ms) | Ca2+ transient,Δ[Ca2+]i (ΔF/Fo) |
|---|---|---|---|---|
| 0 | 0.4 | 0 | 47.0 ± 3.4 (5) | 5.07 ± 0.84 (5) |
| 5 | 1 | 0 | 11.4 ± 1.0 (6) | 1.10 ± 0.090 (6) |
| 2 | 1 | 0 | 11.0 ± 1.9 (4) | 1.40 ± 0.11 (4) |
| 2 | 1 | 5 | 12.5 ± 0.48 (22) 1.90 ± 0.12 (22) | 1.90 ± 0.12 (22)* |
| 2 | 1 | 10 | 10.0 ± 1.1 (4) | 1.89 ± 0.090 (4)* |
Times to peak, and Ca2+ transients (Δ[Ca2+]i) were measured on depolarization from −60 to 0 mV for 80 ms. The time to peak, tp, was the time from the beginning of depolarization to the peak of Ca2+ release. Data are means ± s.e.m. with the number of cells in parentheses.
P < 0.05, for the control at 2 mM EGTA, 1 mM fluo-3 and 0 mM Na+.
Probing for possible development of t-tubules
To determine whether t-tubules were present in rat atrial cells used in this study, we attempted to image their organization using membrane-staining voltage-sensitive dyes. A series of z-directional confocal images were recorded by changing the focal plane in 0.72 μm steps from top to bottom in rat atrial myocytes incubated for 5 min in 5 μM di-8-ANEPPS (Hüser et al. 1996). Except for the surface membranes visualized at the top or bottom, there were no clear indications of t-tubules penetrating into the interior of the cell (data not shown, 7 cells, 3 rats). At the confocal plane near the centre, only peripheral membrane staining was clearly visible. In sharp contrast, the same staining and imaging procedures applied to ventricular myocytes from the same hearts, readily showed t-tubules with regular 2 μm sarcomeric spacing (n = 5).
Discussion
We used rapid 2-D confocal imaging in rat atrial myocytes dialysed with different concentrations of Ca2+ buffers to probe the cascade of Ca2+ signalling events that are triggered by membrane depolarization. We found that local Ca2+ transients in the centre of atrial myocytes exhibited both the buffer-sensitive slow delayed Ca2+ release component and rapid buffer-resistant component. Quantitative data on the profiles of local release showed that Ca2+ transients in the periphery and centre of atrial myocytes are controlled by the amplitude and duration of ICa. However, ICa gating of Ca2+ release appears to be ≈5 times more efficient in the periphery than in the centre, yet the dependence of central release on the peripheral release suggests a cooperative gating mechanism for the central Ca2+ release. Our data suggest that activation of ICa first gates Ca2+ release both in the periphery and the centre of the atrial myocyte, resulting in rapid rise of Ca2+, which is fairly resistant to large concentrations of Ca2+ buffers. Shortly thereafter, however, the larger Ca2+ released in the periphery appears to diffuse into the centre of the myocyte, inducing delayed slow Ca2+ release in a saltatory manner along the sarcomeric lines. We propose that the ICa-gated rapid release component of Ca2+ could provide a possible explanation for previously observed faster activation of contraction in atrial myocyte.
Peripheral vs. central Ca2+ release in atrial myocytes
It is generally observed that Ca2+ release transients in mammalian atrial myocytes have a fast release component triggered by ICa at peripheral junctions and a delayed central component activated by diffusion of Ca2+ to the RyRs located in non-junctional SR (Lipp et al. 1990, 1996; Berlin, 1995; Hüser et al. 1996; Mackenzie et al. 2001; Kockskämper et al. 2001). Ultrastructural studies in support of this idea show a well developed non-junctional SR studded with electron-dense feet structures (RyRs) but complete absence (guinea-pig, Forbes et al. 1988; cat, Hüser et al. 1996) or poor development (rat, Ayettey & Navaratnam, 1978; rabbit, Mitcheson et al. 1997) of t-tubular system. Immunolabelled imaging of RyRs (Lewis Carl et al. 1995; Lipp et al. 2000; Mackenzie et al. 2001; Kockskämper et al. 2001) and triadin (Lewis Carl et al. 1995) showed ordered sarcomeric distribution throughout atrial cells, while immunolabelled dihydropyridine receptors were seen to be colocalized only with RyRs at the cell surface but not in the interior of the cell (Lewis Carl et al. 1995). Functional evidence for two distinct Ca2+ release pools was obtained earlier using citrate as a weak Ca2+ buffer to partially uncouple a major fraction of cytosolic Ca2+ release from the peripheral Ca2+ influx in cultured guinea-pig atrial myocytes. Confirming this scheme, confocal Ca2+ imaging showed that Ca2+ release occurs first adjacent to the sarcolemma, propagating then, with significant delay, into the centre of myocyte (Berlin, 1995; Hüser et al. 1996; Mackenzie et al. 2001; Kockskämper et al. 2001).
Based on these findings, we were surprised to find a fast component of Ca2+ release at the cell centre that develops rapidly and with little or no delay following the peripheral release of Ca2+ (Figs 1C, 1D, 4 and 7). Although we were careful to focus the imaging plane at the mid-section of the ≈10 μm thick atrial myocytes, it might still be argued that our vertical resolution was insufficient to exclude the fast Ca2+ signalling that occurs at the cell surface, ≈5 μm above and below the confocal plane. Such contamination, we believe, is unlikely because of the measured point-spread-function very small fast components seen in some cells and at some potentials (< 5 %, Fig. 4E). The rapid rising component of the central Ca2+ release was smaller than the peripheral Ca2+ release in minimally (20 %, Fig. 1F) and highly Ca2+-buffered (30 % on average, Table 1) myocytes. The presence of the fast central Ca2+ release component might suggest the presence of t-tubules, especially since some studies have shown two types of rat atrial myocytes: those lacking t-tubules, and a smaller fraction of cells with well-developed t-tubular systems (Forssmann & Girardier, 1970; Ayettey & Navaratnam, 1978). To test this possibility we also tested for the existence of t-tubules using voltage sensitive membrane dyes, but were unable to detect their presence in the mid-sections of rat atrial myocytes or in cells where ICa-triggered central Ca2+ sparks were simultaneously measured (data not shown; Woo et al. 2002).
Control of local Ca2+ release by ICa
In previous studies on rabbit (Mitcheson et al. 1997) and human (Hatem et al. 1997) atrial myocytes only the voltage dependence of global Ca2+ transients was measured. The bell-shaped relation obtained in those studies was broader than that of ICa, either because Ca2+ release may have been triggered (slowly) by the Na+-Ca2+ exchanger operating in its Ca2+ influx mode (Mitcheson et al. 1997), or because only the peripheral SR was directly gated by ICa (Hatem et al. 1997). We found the voltage dependence of global Ca2+ transients to be bell shaped and closely resembling that of ICa in cells dialysed with the internal solutions containing 0–5 mm Na+ and buffered either with 0.4 mm fluo-3 or 1 mm fluo-3 plus 2 mm EGTA (data not shown). In Ca2+-buffered myocytes dialysed with 5 or 10 mm Na+-containing solutions the magnitude of Ca2+ transients was only slightly larger than those dialysed with no Na+ (Table 2), suggesting a small enhancement of SR Ca2+ content by Ca2+ influx mode of Na+-Ca2+ exchanger. It is unlikely that such a mechanism is responsible for the delayed central release of Ca2+ in our studies, as experiments in the minimally buffered myocytes were carried out with zero Na+ dialysates. Thus our studies show that the peripheral, the fast central, and the delayed central Ca2+ transients were all dependent on the magnitude of ICa (Figs 3B, 4C and 4D), suggesting that ICa, directly or indirectly, controls all components of the Ca2+ release in atrial myocytes.
It is likely that the peripheral Ca2+ release is triggered by ICa at peripheral junctions in much the same manner as the dyadic junctions in ventricular myocytes (Adachi-Akahane et al. 1996). On the other hand, the finding that the slow central Ca2+ release is also controlled by ICa is more intriguing. The linear relation between the magnitude of ICa and the delayed Ca2+ release (Fig. 4D), and abbreviation of Ca2+ release by premature termination of the duration of ICa (Fig. 5 and Fig. 6), strongly suggest continuous control of the central release by Ca2+ influx through the Ca2+ channel. Nevertheless, the finding that the delayed component of the central Ca2+ release is fully suppressed by limiting diffusion of Ca2+ with high concentrations of Ca2+ buffers (Fig. 7, Table 1), indicates that the delayed central release is governed partly by local Ca2+ diffusing from peripheral release sites as previously suggested (Lipp et al. 1990; Berlin, 1995; Hüser et al. 1996; Kockskämper et al. 2001). As others, we have measured this process to represent a propagating wave (Figs 1A, 2A, 3C-F and 7A), with a velocity of 230 μm s−1 but with no indication of all-or-none behaviour. Figure 4E shows a slightly curved second-order function between the peripheral Ca2+ release and the fast and slow components of the central Ca2+ release. It is unlikely that this finding reflects saturation of fluo-3 (0.4 mm) at large fluorescence values (ΔF/Fo > 5) since the bell-shaped voltage dependence of the peripheral Ca2+ release (Fig. 4C) is not significantly broader than that of ICa (Fig. 3B). Rather, the curved relationship between the peripheral and delayed central Ca2+ release suggests a measure of cooperativity in the Ca2+ release process.
Focal release sites of peripheral and central SR
The present experimental and analytical approach allowed us to identify focal release sites of both the peripheral and central SR during activation of ICa. More critically, the location of the identified release sites showed consistantly a 2 μm sarcomeric alignment throughout the entire cell volume (Fig. 2). While the peripheral sites were resistant to the Ca2+ buffering, the delayed central release sites were strongly suppressed by high concentrations of Ca2+ buffers (Fig. 7) that limit the diffusion distance of free Ca2+ (Adachi-Akahane et al. 1996). This finding suggests that the peripheral release sites are functionally coupled to the sarcolemmal Ca2+ channels. The observed pattern of focal Ca2+ release is consistent with the reported immunocytochemical and ultrastructural data characterizing the clustering of RyRs, either co-localized with DHP-receptors in peripheral junctions, or dissociated from them in corbular SR (McNutt & Fawcett, 1969; Sommer & Jennings, 1992; Lewis Carl et al. 1995).
The observed sequential and ordered activation of release sites from periphery to the centre are consistent with a scheme where ICa first (within 4 ms) activates most of the release sites of the peripheral SR. At 8 ms following depolarization, those sparks become brighter (time to peak of each spark: ≈8 ms, data not shown) as more peripheral sites are activated, while most central release sites remain still quiescent (Fig. 1A and Fig. 2A). When the central sites close to the peripheral sites start to activate at around 10–15 ms (at 0 mV, Fig. 2), some of the focal releases from the peripheral sites are already fading. Since the longitudinal and transverse distances between individual release sites were both ≈2 μm, the diffusional distance for Ca2+ in the cell interior would be similar in both longitudinal and transverse directions. However, we could only distinguish saltatory propagation in the transverse direction during ICa-gated Ca2+ release process. Direction-dependent preferred propagation may result from the highly ordered structure of the myocytes, resulting from the anisotropic arrangement of possible diffusion limiting structures such as myofilaments and mitochondria (Engel et al. 1994).
Atrial E-C coupling
The present findings suggest that atrial E-C coupling differs considerably from the ventricle with respect to the timing and magnitude of local Ca2+ release. As compared to physiological Ca2+ transients of atrial cells, which reach a peak within 30 ms (Bals et al. 1990), the signals measured in the present study are slower (tp = 47 ms, Table 2). Low temperature and certain concentrations of Ca2+ buffer (0.4 mm fluo-3), which restrict Ca2+ diffusion, may have slowed Ca2+ propagation (Engel et al. 1995), exaggerating the difference between the two components of central release. The fast component of central Ca2+ release is likely to be responsible for the faster activation of contraction (phasic contraction) of atrial myocytes compared with ventricular myocytes (Lüss et al. 1999). Like the peripheral and slow central Ca2+ releases, this component also is controlled by ICa, but in cells lacking both centrally located DHP receptors and extensive t-tubules, the molecular determinants of this regulatory mechanism remain to be explored. In fact, the same can be said for the gating of the delayed slow central Ca2+ release sites, which in our studies did not exhibit all-or-none behaviour and appear to be governed by ICa. The propagation velocity of the slow central Ca2+ release appears to be independent of voltage and ICa (Fig. 4B). Simple diffusion of Ca2+ from the peripheral junctional sites is unlikely to account fully for the Ca2+ propagation wave. Thus the specific mechanism(s) for the regulation of the ICa-triggered propagation of Ca2+ in atrial myocytes remains to be determined.
Acknowledgments
This work was supported by grants from the National Institutes of Health (HL-16152).
References
- Adachi-Akahane S, Cleemann L, Morad M. Cross-signaling between L-type Ca2+ channels and ryanodine receptors in rat ventricular myocytes. Journal of General Physiology. 1996;108:435–454. doi: 10.1085/jgp.108.5.435. [DOI] [PMC free article] [PubMed] [Google Scholar]
- Ayettey AS, Navaratnam V. The T-tubule system in the specialized and general myocardium of the rat. Journal of Anatomy. 1978;127:125–140. [PMC free article] [PubMed] [Google Scholar]
- Bals S, Bechem M, Paffhausen W, Pott L. Spontaneous and experimentally evoked [Ca2+]i-transients in cardiac myocytes measured by means of fast Fura-2 technique. Cell Calcium. 1990;11:385–396. doi: 10.1016/0143-4160(90)90050-5. [DOI] [PubMed] [Google Scholar]
- Berlin JR. Spatiotemporal changes of Ca2+ during electrically evoked contractions in atrial and ventricular cells. American Journal of Physiology. 1995;267:H1165–1170. doi: 10.1152/ajpheart.1995.269.3.H1165. [DOI] [PubMed] [Google Scholar]
- Berridge MJ. Elementary and global aspects of calcium signalling. Journal of Physiology. 1997;499:291–306. doi: 10.1113/jphysiol.1997.sp021927. [DOI] [PMC free article] [PubMed] [Google Scholar]
- Beuckelmann DJ, Wier WG. Mechanism of release of calcium from sarcoplasmic reticulum of guinea-pig cardiac cell. Journal of Physiology. 1988;405:233–255. doi: 10.1113/jphysiol.1988.sp017331. [DOI] [PMC free article] [PubMed] [Google Scholar]
- Blatter L, Wier WG. Intracellular diffusion, binding, and compartmentalization of the fluorescent calcium indicators indo-1 and fura-2. Biophysical Journal. 1990;58:1491–1499. doi: 10.1016/S0006-3495(90)82494-2. [DOI] [PMC free article] [PubMed] [Google Scholar]
- Cleemann L, Morad M. Role of Ca2+ channel in cardiac excitation-contraction coupling in the rat: evidence from Ca2+ transients and contraction. Journal of Physiology. 1991;432:283–312. doi: 10.1113/jphysiol.1991.sp018385. [DOI] [PMC free article] [PubMed] [Google Scholar]
- Cleemann L, Wang W, Morad M. Two-dimensional confocal images of organization, density, and gating of focal Ca2+ release sites in rat cardiac myocytes. Proceedings of the National Academy of Sciences of the USA. 1998;95:10984–10989. doi: 10.1073/pnas.95.18.10984. [DOI] [PMC free article] [PubMed] [Google Scholar]
- Engel J, Fechner M, Sowerby AJ, Finch SA, Stier A. Anisotropic propagation of Ca2+ waves in isolated cardiomyocytes. Biophysical Journal. 1994;66:1756–1762. doi: 10.1016/S0006-3495(94)80997-X. [DOI] [PMC free article] [PubMed] [Google Scholar]
- Engel J, Sowerby AJ, Finch SAE, Fechner M, Stier A. Temperature dependence of Ca2+ wave properties in cardiomyocytes: implications for the mechanism of autocatalytic Ca2+ release in wave propagation. Biophysical Journal. 1995;68:40–45. doi: 10.1016/S0006-3495(95)80196-7. [DOI] [PMC free article] [PubMed] [Google Scholar]
- Forbes MS, Van Neil EF. Membrane systems of guinea-pig myocardium: ultrastructure and morphometric studies. Anatomical Record. 1988;222:362–379. doi: 10.1002/ar.1092220409. [DOI] [PubMed] [Google Scholar]
- Forssmann WG, Girardier L. A study of the T system in rat heart. Journal of Cell Biology. 1970;44:1–19. doi: 10.1083/jcb.44.1.1. [DOI] [PMC free article] [PubMed] [Google Scholar]
- Hamill OP, Marty A, Neher E, Sakmann B, Sigworth FJ. Improved patch-clamp techniques for high-resolution current recording from cells and cell-free membrane patches. Pflügers Archiv. 1981;391:85–100. doi: 10.1007/BF00656997. [DOI] [PubMed] [Google Scholar]
- Hatem SN, BÉNARDEAU A, Rucker-Martin C, Marty I, Chamisso P, VillaZ M, Mercardier J-J. Different compartments of sarcoplasmic reticulum participate in the excitation-contraction coupling process in human atrial myocytes. Circulation Research. 1997;80:345–353. doi: 10.1161/01.res.80.3.345. [DOI] [PubMed] [Google Scholar]
- HÜser J, Lipsius SL, Blatter LA. Calcium gradients during excitation-contraction coupling in cat atrial myocytes. Journal of Physiology. 1996;494:641–651. doi: 10.1113/jphysiol.1996.sp021521. [DOI] [PMC free article] [PubMed] [Google Scholar]
- Kockskämper J, Sheehan KA, Bare DJ, Lipisius SL, Mignery GA, Blatter LA. Activation and propagation of Ca2+ release during excitation-contraction coupling in atrial myocytes. Biophysical Journal. 2001;81:2590–2605. doi: 10.1016/S0006-3495(01)75903-6. [DOI] [PMC free article] [PubMed] [Google Scholar]
- Lewis Carl S, Felix K, Caswell AH, Brandt NR, Ball WJ, Vaghy PL, Meissner G, Ferguson DG. Immunolocalization of sarcolemmal dihydropyridine receptor and sarcoplasmic reticular triadin and ryanodine receptor in rabbit ventricle and atrium. Journal of Cell Biology. 1995;129:673–682. doi: 10.1083/jcb.129.3.673. [DOI] [PMC free article] [PubMed] [Google Scholar]
- Lipp P, HÜser J, Pott L, Niggli E. Subcellular properties of triggered Ca2+ waves in isolated citrate-loaded guinea-pig atrial myocytes characterized by ratiometric confocal microscopy. Journal of Physiology. 1996;497:599–610. doi: 10.1113/jphysiol.1996.sp021793. [DOI] [PMC free article] [PubMed] [Google Scholar]
- Lipp P, Laine M, Tovey SC, Burrell KM, Berridge MJ, Li W, Bootman MD. Functional InsP3 receptors that may modulate excitation-contraction coupling in the heart. Current Biology. 2000;10:939–942. doi: 10.1016/s0960-9822(00)00624-2. [DOI] [PubMed] [Google Scholar]
- Lipp P, Pott L, Callewaert G, Carmeliet E. Simultaneous recording of Indo-1 fluorescence and Na+/Ca2+ exchanger current reveals two components of Ca2+-release from sarcoplasmic reticulum of cardiac atrial myocytes. FEBS Letters. 1990;275:181–184. doi: 10.1016/0014-5793(90)81467-3. [DOI] [PubMed] [Google Scholar]
- LÜss I, Boknik P, Jones LR, Kirchhefer U, Knapp J, Linck B, LÜss H, Meissner N, MÜller FU, Schmitz W, Vahlensieck U, Neumann J. Expression of cardiac calcium regulatory proteins in atrium v ventricle in different species. Journal of Molecular and Cellular Cardiology. 1999;31:1299–1314. doi: 10.1006/jmcc.1999.0962. [DOI] [PubMed] [Google Scholar]
- Mackenzie L, Bootman MD, Berridge MJ, Lipp P. Predetermined recruitment of calcium release sites underlies excitation-contraction coupling in rat atrial myocytes. Journal of Physiology. 2001;530:417–429. doi: 10.1111/j.1469-7793.2001.0417k.x. [DOI] [PMC free article] [PubMed] [Google Scholar]
- McNutt NS, Fawcett DW. The ultrastructure of the cat myocardium. II. Atrial muscle. Journal of Cell Biology. 1969;42:46–67. doi: 10.1083/jcb.42.1.46. [DOI] [PMC free article] [PubMed] [Google Scholar]
- Mitcheson JS, Hancox JC, Levi AJ. Voltage dependence of the fura-2 transient in rabbit left atrial myocytes at 37 °C. Pflügers Archiv. 1997;433:817–826. doi: 10.1007/s004240050350. [DOI] [PubMed] [Google Scholar]
- Mitra R, Morad M. A uniform enzymatic method for dissociation of myocytes from hearts and stomachs of vertebrates. American Journal of Physiology. 1985;249:H1056–1060. doi: 10.1152/ajpheart.1985.249.5.H1056. [DOI] [PubMed] [Google Scholar]
- Morad M. Cardiac Ca2+ signaling. In: Morad M, Kostyuk P, editors. Calcium Signaling: NATO Science Series I. Vol. 331. Washington, DC: IOS press; 2001. pp. 3–13. [Google Scholar]
- NÄbauer M, Callewaert G, Cleemann L, Morad M. Regulation of calcium release is gated by calcium current, not gating charge, in cardiac myocytes. Science. 1989;244:800–803. doi: 10.1126/science.2543067. [DOI] [PubMed] [Google Scholar]
- Niggli E, Lederer WJ. Voltage-independent calcium release in heart muscle. Science. 1990;250:565–568. doi: 10.1126/science.2173135. [DOI] [PubMed] [Google Scholar]
- Shacklock PS, Wier WG, Balke CW. Local Ca2+ transients (Ca2+ sparks) originate at transverse tubules in rat heart cells. Journal of Physiology. 1995;487:601–608. doi: 10.1113/jphysiol.1995.sp020903. [DOI] [PMC free article] [PubMed] [Google Scholar]
- Sham JSK, Cleemann L, Morad M. Functional coupling of Ca2+ channels and ryanodine receptors in cardiac myocytes. Proceedings of the National Academy of Sciences of the USA. 1995;92:121–125. doi: 10.1073/pnas.92.1.121. [DOI] [PMC free article] [PubMed] [Google Scholar]
- Soldatov MN, Oz M, O'Brien KA, Abernethy DR, Morad M. Molecular determinants of L-type Ca2+ channel inactivation. Journal of Biological Chemistry. 1998;273:957–963. doi: 10.1074/jbc.273.2.957. [DOI] [PubMed] [Google Scholar]
- Sommer JR, Jennings RB. Ultrastructure of cardiac muscle. In: Fozzard HA, Harbor E, Jennings RB, Katz AM, Morgan HE, editors. The Heart and Cardiovascular System. New York: Raven Press; 1992. pp. 3–50. [Google Scholar]
- Sun XH, Protasi F, Takahashi M, Takeshima H, Fregusson DG, Franzini-Amstrong C. Molecular architecture of membrane involved in excitation-contraction coupling of cardiac muscle. Journal of Cell Biology. 1995;129:659–671. doi: 10.1083/jcb.129.3.659. [DOI] [PMC free article] [PubMed] [Google Scholar]
- Wang W, Cleemann L, Jones LR, Morad M. Modulation of focal and global Ca2+ release in calsequestrin-overexpressing mouse cardiomyocytes. Journal of Physiology. 2000;524:399–414. doi: 10.1111/j.1469-7793.2000.00399.x. [DOI] [PMC free article] [PubMed] [Google Scholar]
- Woo S-H, Cleemann L, Morad M. Comparison of central and peripheral Ca2+ releases in voltage-clamped atrial myocytes. Biophysical Journal. 2002;82:282a. [Google Scholar]