Abstract
The dorsal lateral geniculate nucleus (dLGN) transmits visual signals from the retina to the cortex. In the dLGN the antagonism between the centre and the surround of the receptive fields is increased through intrageniculate inhibitory mechanisms. Furthermore, the transmission of signals through the dLGN is modulated in a state-dependent manner by input from various brainstem nuclei including an area in the parabrachial region (PBR) containing cholinergic cells involved in the regulation of arousal and sleep. Here, we studied the effects of increased PBR input on the spatial receptive field properties of cells in the dLGN. We made simultaneous single-unit recordings of the input to the cells from the retina (S-potentials) and the output of the cells to the cortex (action potentials) to determine spatial receptive field modifications generated in the dLGN. State-dependent modulation of the spatial receptive field properties was studied by electrical stimulation of the PBR. The results showed that PBR stimulation had only a minor effect on the modifications of the spatial receptive field properties generated in the dLGN. The PBR-evoked effects could be described mainly as increased response gain. This suggested that the spatial modifications of the receptive field occurred at an earlier stage of processing in the dLGN than the PBR-controlled gain regulation, such that the PBR input modulates the gain of the spatially modified signals. We propose that the spatial receptive field modifications occur at the input to relay cells through the synaptic triades between retinal afferents, inhibitory interneurone dendrites, and relay cell dendrites and that the gain regulation is related to postsynaptic cholinergic effects on the relay cells.
The dorsal lateral geniculate nucleus (dLGN) relays signals from the retina to the visual cortex. The receptive field of the thalamocortical relay cells has the same antagonistic centre-surround organization as retinal ganglion cells, but the antagonism between centre and surround is stronger than in the retinal cells (Hubel & Wiesel, 1961) due to inhibitory input to the relay cells (Sillito & Kemp, 1983; Eysel et al. 1986; Norton et al. 1989; Ruksenas et al. 2000). The inhibitory input consists of feedforward inhibition from intrinsic, intralaminar GABAergic cells and feedback inhibition from GABAergic cells in the perigeniculate nucleus (PGN). The feedforward inhibition is mediated through dendritic as well as axonal output from the interneurones (reviewed in McCormick et al. 1997). The reinforced surround inhibition is presumably mediated by the intrinsic interneurones (Ahlsén et al. 1985; Eysel et al. 1986; Funke & Eysel, 2000; Ruksenas et al. 2000).
The transmission of signals to the cerebral cortex is modulated by state-related ascending input from various regions in the brainstem and the hypothalamus (reviewed in Steriade et al. 1997). The most prominent modulatory input comes from cholinergic cells in the parabrachial region (PBR) of the mesencephalic brainstem (De Lima & Singer, 1987; Fitzpatrick et al. 1989) that show increased firing rates during arousal. Terminals from these cells contact all elements in the dLGN circuit (Montero, 1991). On relay cells PBR stimulation or local application of acetylcholine (ACh) have an excitatory effect (Sillito et al. 1983; Eysel et al. 1986; Francesconi et al. 1988; Hartveit & Heggelund, 1993a, b; 1995; Hartveit et al. 1993; Uhlrich et al. 1995). In vitro studies (reviewed by McCormick et al. 1997) have shown that this excitation is due to a slow, long-lasting depolarization mediated by muscarinic receptors that reduce a potassium current (IK,leak), often preceded by a fast and short-lasting excitation through nicotinic receptors. The depolarization can shift the firing mode of relay cells from rhythmic burst firing, occurring at hyperpolarized membrane potentials during drowsiness and slow-wave sleep, to tonic firing of single action potentials occurring during arousal and REM sleep (reviewed in Steriade et al. 1997). PGN cells are inhibited by ACh through a muscarinic receptor-mediated hyperpolarization (McCormick & Prince, 1987) which may be preceded by a fast, short-lasting nicotinic receptor-mediated excitation (Lee & McCormick, 1995). In vivo studies have shown that the inhibitory effect is related to spontaneous and tonic firing, while visually driven activity may be enhanced (Funke & Eysel, 1993, 2000; Murphy et al. 1994). Effects of ACh on intralaminar interneurones are more complex. ACh and PBR stimulation seem to have an inhibitory effect on the firing rate of interneurones (Ahlsén et al. 1984; Francesconi et al. 1988; McCormick & Pape, 1988; Pape & McCormick, 1995), suggesting an inhibitory effect on the spontaneous axonal output of these cells. There may be an inhibitory effect on evoked firing, too (Francesconi et al. 1988). Little is known about cholinergic effects on the dendritic output of the interneurones. Zhu & Heggelund (2001) demonstrated that a muscarinic receptor agonist changed the inhibitory effects of interneurones on a relay cell from wide-range inhibition to a spatially more restricted inhibition. The change was related to activation of one hyperpolarizing and two depolarizing currents that lowered the input resistance in the interneurones. Lowered input resistance reduces the impact an excitatory dendritic input has on the axonal output of the cell, as well as the range of summation across the dendritic tree for the output from a given dendritic synapse.
The effects of cholinergic modulation on the spatial receptive field organization of relay cells are not well understood. The results referred to above, which demonstrated cholinergic attenuation of output from interneurones, suggest reduced surround inhibition and centre-surround antagonism in relay cells by increased cholinergic input to the dLGN. Although the effect of increased cholinergic input on the degree of surround inhibition has not previously been measured directly, results from several in vivo experiments have been interpreted as evidence for increased, rather than, decreased surround inhibition during PBR stimulation (Uhlrich et al. 1995), local application of ACh (Sillito et al. 1983; Eysel et al. 1986), or arousal from sleep (Livingstone & Hubel, 1981). Furthermore, increased rather than decreased centre-surround antagonism has been suggested (Eysel et al. 1986).
The purpose of the present study was to study directly the effects of PBR stimulation on the spatial receptive field organization and centre-surround antagonism in dLGN cells. We recently showed that centre-surround antagonism is increased on average by ≈50 % at the retino-geniculate relay (Ruksenas et al. 2000). Here we demonstrate that this increased antagonism is almost unchanged during PBR stimulation and that the effect of PBR stimulation is mainly an increase of response gain. The results suggested that the mechanism responsible for the increased centre-surround antagonism and the regulation of gain occur at successive stages of processing in the dLGN such that PBR input modulates the gain of the spatially modified signals.
Methods
Adult cats (2.0-3.5 kg) were prepared (arterial and venous cannulation, tracheotomy and craniotomies) under anaesthesia in accordance with governmental guidelines regarding the care and welfare of experimental animals and as described in detail previously (Hartveit & Heggelund, 1993b). Anaesthesia was induced by xylazine (1 mg kg−1i.m.) and ketamine hydrochloride (10 mg kg−1i.m.), and maintained during surgery by halothane (0.5-1.5 %) in N2O/O2 (75 /25 %-70 /30 %). After surgery the animals were immobilized (gallamine triethiodide, initial dose 40 mg, maintenance dose 10 mg kg−1 h−1), and anaesthesia was maintained throughout the experiment by halothane (0.2-1.2 %) in N2O/O2 (75 /25 %-70 /30 %). Epidural EEG was recorded through differential amplification of signals from a pair of silver wires implanted in the left cortical Area 17 at Horsley-Clarke (H-C) stereotaxic co-ordinates: posterior 3.5 mm, lateral 2.0 and 10.0 mm. We continuously monitored arterial blood pressure, heart rate, electroencephalogram (EEG) and end tidal CO2 (4 %) to ensure adequate and stable anaesthesia. The rectal temperature was kept at 38 °C by a temperature-controlled heating blanket. Bilateral cervical sympathectomy was performed to increase the stability of the eyes (Rodieck et al. 1967). Atropine and phenylephrine were applied to both eyes in order to dilate the pupils and retract the nictitating membranes. Contact lenses focused the eyes on a video monitor 1.14 m in front of the eyes of the cat.
A bipolar stimulation electrode (0.2 mm stainless steel or tungsten), varnish insulated except for the tips (exposure 0.3-0.75 mm), was implanted stereotaxically into the optic chiasm (OX) at H-C co-ordinates anterior 14.0 mm with each wire located 1.75 mm from the midline. The electrode was advanced until the threshold for a cortical-evoked potential was minimal (Francesconi et al. 1988; Hartveit & Heggelund, 1993). The stimuli were 50 μs square-wave pulses. For PBR stimulation another bipolar electrode was used, similar to the first except that the separation between the wires was 2 mm. This electrode was implanted at the midbrain-pontine junction (H-C anterior-posterior 0, 2.0-4.0 mm from the midline, horizontal about +8 mm; Ahlsén et al. 1984; Francesconi et al. 1988; Hu et al. 1989; Hartveit & Heggelund, 1993a) ipsilateral to a recording electrode in the dLGN (cf. Fig. 1 in Hartveit & Heggelund, 1993a). For optimal positioning of the PBR electrode, OX stimuli were given together with a pulse-train stimulus (five 50 μs square-wave pulses at 70 Hz, intensity 300–750 μA) through the PBR electrode that started 100 ms before the OX stimulus. The PBR electrode was then advanced until maximal facilitation of the cortical potential was evoked by the OX stimulus (Francesconi et al. 1988). No consistent changes in the EEG pattern were observed following PBR stimulation.
Recordings of action potentials, or combined recordings of action potentials and S-potentials, from single units in the A-laminae of the dLGN were made extracellularly with glass-insulated tungsten electrodes (Levick, 1972; exposed tip 6–8 mm), or with glass pipettes filled with 0.9 % NaCl (15-25 MΩ in vivo). The recording electrode was inserted through a craniotomy over the left hemisphere at H-C co-ordinates anterior 6.0 mm, lateral 15.0 mm, and with an angle of 32 deg from the vertical in a coronal plane. With this electrode angle the location of the receptive field was about the same for all cells recorded in an electrode penetration.
After isolation of action potentials from a single cell, its receptive field centre was plotted with hand-held stationary or moving light and dark spots, as well as grating stimuli. The cells were classified as X or Y, and lagged or non-lagged as described previously (Hartveit & Heggelund, 1993a). We attempted to obtain S-potentials from the same cell in addition to the action potentials by slowly moving the electrode forward such that the amplitude of the action potentials increased. In successful cases the amplitude of the S-potentials gradually increased, too. The electrode was advanced until the S-potentials could be clearly separated from the background noise. S-potentials were easily distinguishable from action potentials by their characteristic slower waveform, and smaller amplitude (Bishop et al. 1958; Freygang, 1958; Hubel & Wiesel, 1961; Cleland et al. 1971; Coenen & Vendrik, 1972; Kaplan & Shapley, 1984; Hartveit & Heggelund, 1990; Norton & Godwin, 1992; Hamamoto et al. 1994; Cheng et al. 1995) as illustrated by Fig. 1A. The time of occurrence of an action potential was detected by a Schmidt-trigger with the level set well above background noise and S-potentials. To record retinal input we used a second Schmidt-trigger with the level adjusted above the background noise such that all S-potentials as well as action potentials were detected, thus assuming, as in previous studies, that each action potential was elicited by an S-potential (notice initial shoulder in the action potentials in Fig. 1A, cf. also Coenen & Vendrik, 1972; Fukuda & Stone, 1976; So & Shapley, 1979, 1981; Fourment et al. 1984; Norton & Godwin, 1992; Hartveit & Heggelund, 1995). During recordings the electrode signals and output from Schmidt triggers were continuously monitored on an oscilloscope, and over separate audio-monitors for the various response components.
Figure 1. Recordings and PSTH illustrating visual response.
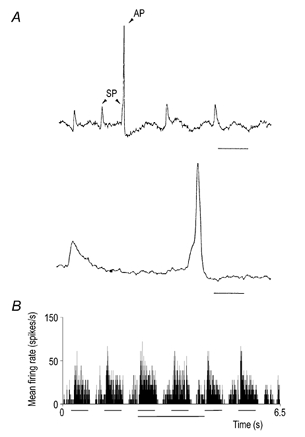
A, original recording trace showing differences between S-potentials (SP) and action potentials (AP). The lower trace shows the action potential and the preceding S-potential on a larger time scale. Notice the initial shoulder on the action potential indicating that the action potential takes off from an S-potential. Scale bar in upper trace, 25 ms, in lower trace 5 ms. B, a PSTH showing the response to the sequence of the 14 stimulus conditions for one spot size. This histogram was compiled from 20 repetitions; bin width 5 ms. The six horizontal lines under the histogram mark the periods (500 ms) when the visual stimulus was on (light spot for on-centre cells, dark spot for off-centre cells). The lowermost horizontal line marks the period during which the train-stimulation of PBR was applied.
For each cell we made quantitative studies of the spatial receptive field properties. Visual stimuli were presented on a computer-controlled video monitor in front of the cat's eyes. The stimuli were series of stationary light or dark circular spots (light spots for on-centre cells, dark spots for off-centre cells) concentric to the receptive field. The spot diameter was stepwise varied from a spot that covered only a small part of the receptive field centre to spots that covered the whole receptive field. The contrast and background luminance were fixed for each series of spot sizes. Contrast and background luminance were selected such that there was a clear response to the spots, and such that the maximum response was well below response saturation for the cell, also during PBR stimulation. Contrast was defined as:
where Lspot is the luminance of the spot and Lbkg is the luminance of the background. The contrast range for on-centre cells was from 0.04 to 0.43. For off-centre cells the range was from −0.11 to −0.5 except for 3 cells (-0.67, −0.8 and −0.9). The range of background luminance was 10–65 cd m−2 except for recordings from one of the cells (95 cd m−2).
For each spot diameter the response to a sequence of fourteen stimulus conditions was recorded as illustrated by the peri-stimulus-time histogram (PSTH) in Fig. 1B. In the first condition (duration 250 ms) spontaneous activity was recorded. Then the spot was switched on (500 ms) and off (500 ms) six times, the first two times as a control before PBR stimulation, then twice during PBR stimulation, and finally twice after PBR stimulation to verify the decay of the PBR effect. At the end there was an extension (250 ms) of the period without stimulation to check recovery of the control level of spontaneous activity. The response to each spot size was recorded in this way once. Then the whole series of recordings was repeated, and PSTHs for each spot size were compiled from 10–30 repetitive presentations of the series of spots. The bin width of the histograms was 5 ms. Response was measured as average firing rate during the time window of the appropriate stimulus condition.
The position of the receptive field was plotted before and after the recordings to check for possible drift in eye position. In a few cases a drift was detected. The data were then discarded and recordings repeated after proper adjustment of spot position. To reduce the risk of error of measurement due to undetected eye movements, we preferentially sampled cells with receptive fields outside the area centralis. During recordings the non-dominant eye was always covered.
The PSTHs were used to plot response versus spot diameter curves (Fig. 2). In such curves the width of the receptive field centre is indicated by the diameter of the spot that gives maximum response and the width of the receptive field surround by the smallest spot stimulating both centre and surround that gives minimum response (Ruksenas et al. 2000). The latter spot diameter was in several cases difficult to read directly from a response versus spot diameter curve. We therefore fitted two linear regression lines to each curve (illustrated in Fig. 1 of Ruksenas et al. 2000). The first line was fitted to data points in the falling part of the curve starting from the point of maximum response. The second line was fitted to the data points for the large spots where the curve was flat or had a rising slope. The width of the surround was defined by the intersection point between the two lines.
Figure 2. Effect of PBR stimulation on spatial summation and receptive field organization.
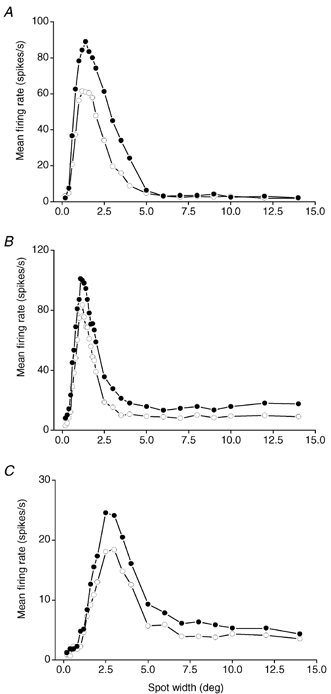
Response versus spot width curves before (○) and during (•) PBR stimulation. The response was measured as mean firing rate during the first spot presentation in the control condition (2nd condition in the PSTH, cf. Fig. 1B) and the first spot presentation during PBR stimulation (6th condition in the PSTH). A, on-centre X cell. B, off-centre X cell. C, off-centre Y cell. Each data point was based on 10 stimulus repetitions in A, 10 in B, and 23 in C. The contrast was 0.33 in A, −0.67 in B, and −0.21 in C.
At the end of the experiment the animal was deeply anaesthetised with pentobarbitone sodium (50 mg kg−1i.v.) and perfused transcardially with saline followed by 4 % formaldehyde in saline. In some of the experiments (≈50 %) brain blocks were cut at 25 μm sections on a freezing microtome and Nissl stained with cresyl violet, and the positions of the recording and stimulation electrodes were verified histologically.
Results
The effect of PBR stimulation on spatial summation and centre-surround antagonism in the receptive field was studied for 60 cells in the A-laminae. The cells had their receptive field centred within 30 deg from the area centralis. Forty-one cells were classified as X cells (24 on-centre, 17 off-centre cells), and 19 as Y cells (9 on-centre, 10 off-centre cells). For 14 of the cells (13X, 1Y), S-potentials were recorded in addition to action potentials such that the spatial summation characteristics of the cell response (with and without PBR stimulation) could be compared with the characteristics of the retinal input to the cell. Three of the X cells were lagged. The spatial receptive field properties of lagged and non-lagged cells seem to be quite similar (Mastronarde, 1987; Humphrey & Weller, 1988; Heggelund & Hartveit, 1990; Hartveit & Heggelund, 1992; Hartveit et al. 1993). The lagged and non-lagged X cells were therefore treated together in a single sample of X cells as described below.
Effects of PBR stimulation on spatial summation and centre-surround antagonism
For each cell we determined the response to a series of stationary spots (light spots for on-centre cells and dark spots for off-centre cells) where the spot width varied while contrast was constant (Fig. 2). For each spot width we recorded the response to a sequence of different stimulus conditions (cf. histogram in Fig. 1B). The sequence included two spot presentations before PBR stimulation as controls, two during continuous pulse-train stimulation of PBR, and two control presentations after PBR stimulation to verify the decay of the PBR effect. The response to the first of the two spot presentations during PBR stimulation was stronger than the response to the second (Fig. 1B), in most cases. However, the general conclusions from our study concerning the effects of PBR stimulation were the same whether calculations were based on the first or the second spot presentation. We used data from the first spot presentation in the findings presented below because this gave the most salient expression of the PBR-evoked changes.
The PBR stimulation had a clear enhancement effect on the response of almost all cells, but the degree of effect varied from cell to cell as shown by the bar plots in Fig. 3. The mean (m) increase of response, measured at the spot width that gave the strongest response in the condition without PBR stimulation (control condition), was 28.5 % (s.d. = 22.5). This is about the same degree of enhancement as Uhlrich et al. (1995) found with similar conditions of PBR stimulation. There was no significant difference in the average degree of enhancement between X (m = 30.2 %, s.d. = 24.2) and Y cells (m = 27.1 %, s.d. = 17.8).
Figure 3. Degree of PBR-evoked enhancement of the dLGN cell response.
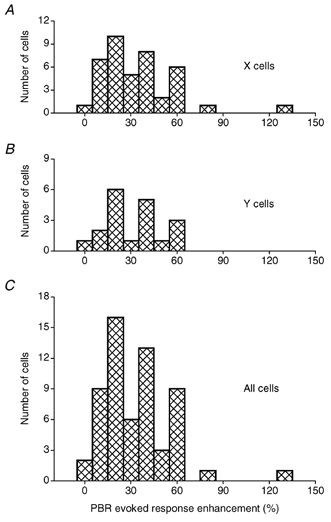
A, X cells. B, Y cells. C, all cells.
Parabrachial region stimulation typically increased the response to the whole series of spots, as illustrated by the response versus spot width curves in Fig. 2A–C. The shape of the curve during PBR stimulation (filled circles) was, however, quite similar to the shape of the control curve (open circles), and the effect of the PBR stimulation seemed to be a general increase in the gain of the dLGN cell response rather than a differential effect on centre and surround mechanisms.
This hypothesis was supported by studies of PBR effects on the centre-surround antagonism. The centre-surround antagonism was defined as:
| (1) |
Here rc is the response to the spot width that gave maximum response (putatively corresponding to the diameter of the receptive field centre), and rcs is the response to the spot width that gave minimum response (putatively corresponding to the diameter of the antagonistic surround). Thus, the difference rc - rcs expresses how much the surround reduced the centre response.
Parabrachial region stimulation had little effect on the centre-surround antagonism in most cells (Fig. 4), but there was, however, a slight tendency toward reduced centre-surround antagonism. The average antagonism was reduced from 78.8 % in the control condition to 74.4 % during PBR stimulation, a reduction that was statistically significant (P < 0.001, paired t test). A reduction was found for both X cells (control: m = 81.0 %, s.d. = 16; PBR: m = 78.0 %, s.d. = 19) and Y cells (control: m = 77.0 %, s.d. = 14; PBR: m = 68.0 %, s.d. = 15). Y cells tended to have weaker centre-surround antagonism than X cells (Fukuda & Stone, 1976; Bullier & Norton, 1979; Ruksenas et al. 2000). This was also the case with the present material, but the difference in the control condition was not statistically significant, whereas the difference in the PBR condition was (P < 0.05).
Figure 4. Scatter plots showing the centre-surround antagonism during PBR stimulation versus antagonism in the control condition.
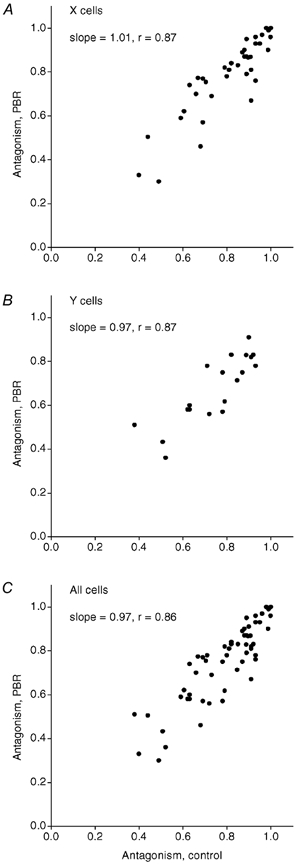
A, X cells. B, Y cells. C, all cells.
Receptive field centre and surround diameter during PBR stimulation
The width of the receptive field centre was defined by the spot diameter that gave maximal response (the peak in the response versus spot diameter curve). The diameter of the antagonistic surround was defined by the minimum response in the receptive field periphery, beyond which there was often an increased response with increasing spot diameter. For some cells, however, there was no clearly defined minimum point and the response versus spot diameter curve was more or less flat over the range of the largest spot sizes (cf. Fig. 2). For this reason, the width of the receptive field surround was defined for all cells by the intersection point between two linear regression lines fitted to each curve (cf. Methods).
The average diameter of the receptive field centre and surround for the whole sample of cells in the control condition was 1.30 deg (s.d. = 0.72) and 5.43 deg (s.d. = 2.61), respectively. During PBR stimulation the average values were 1.34 deg (s.d. = 0.70) and 5.69 deg (s.d. = 2.58), respectively. Thus, there was a tendency toward a slight widening of the receptive field centre during PBR stimulation (Fig. 5), consistent with previous findings (Hartveit et al. 1993). The widening was statistically significant for the X cells (m = 0.06 deg, s.d. = 0.19, P < 0.05, paired t test) but not for the Y cells. There was also a slight widening of the receptive field surround during PBR stimulation. This widening was statistically significant (P < 0.05, paired t test) for both X (m = 0.11 deg, s.d. = 0.34) and Y cells (m = 0.11 deg, s.d. = 0.32).
Figure 5. Effects of PBR stimulation on receptive field dimensions.
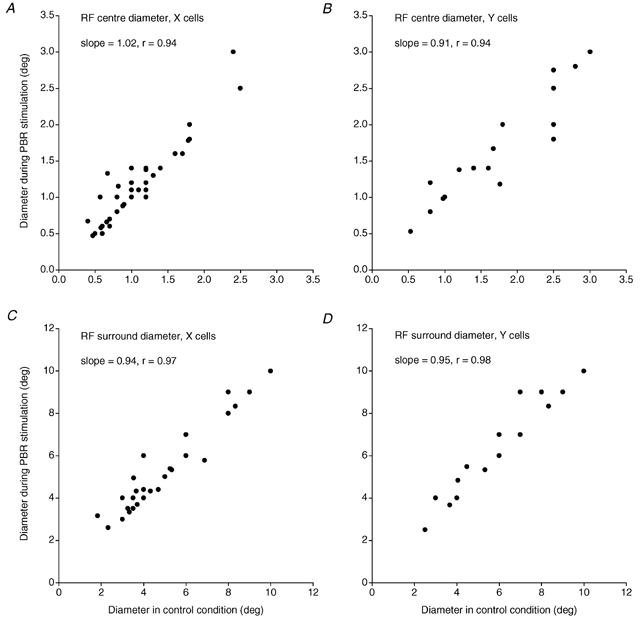
Scatter plots of the diameter of the RF-centre for A, X cells and B, Y cells, RF-surround for C, X cells and D, Y cells during PBR stimulation versus the control condition.
The very small changes of centre and surround diameter gave further support to the conclusion that increased PBR input has little effect on the spatial characteristics of the receptive field.
Linear relationship between control response and response during PBR stimulation
A simple explanation of the results presented above is that the PBR effect consists of a linear gain increase of the dLGN cell response. Thus, there should be a linear relationship between the response in the control condition and the response in the condition with PBR stimulation. To test this hypothesis, the response to each spot during PBR stimulation was plotted against the response to the same spot in the control condition, as illustrated for six X cells and three Y cells in Fig. 6. The open symbols in the scatter plots indicate the response to spots that were smaller than the receptive field centre, the filled symbols indicate spots that were wider than the receptive field centre.
Figure 6. Linear relationship between response during PBR stimulation and response in the control condition.
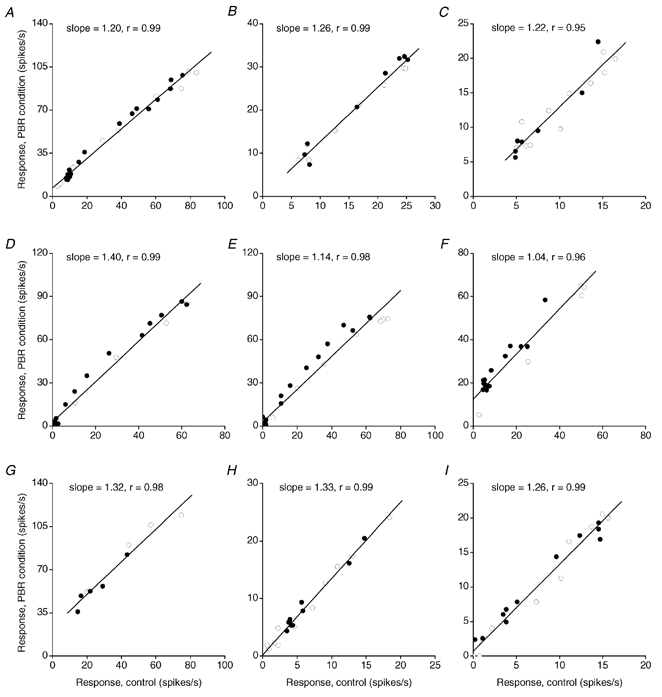
Plots for 6 X cells (A-F) and 3 Y cells (G-I). ○s, response to stimuli smaller than or equal to the receptive field centre for the dLGN cell. •s, response to stimuli larger than the receptive field centre. Straight lines are linear regression lines fitted by method of least squares. Coefficient of correlation (r), and the slope of the regression line are indicated in each plot.
For the large majority of cells there was a close to linear relationship between these pairs of values. The coefficient of correlation varied between cells from 0.8 to 1.0 (Fig. 7). The average value was 0.94 (s.d. = 0.05) and there was no significant difference between X and Y cells (P > 0.05).
Figure 7. Response to the various spot sizes during PBR stimulation showed high correlation with the response in the control condition.
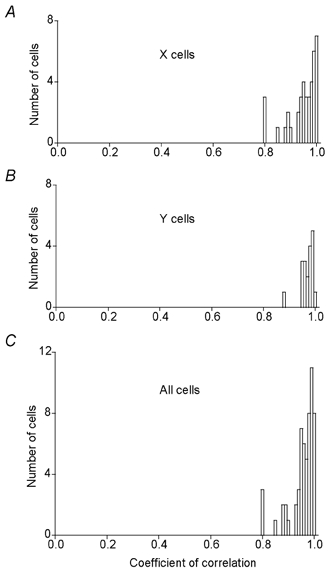
Frequency distribution of the coefficient of correlation for A, X cells; B, Y cells and C, all cells. Bin width 0.01.
In the plots for several of the cells (n = 21) the responses to spots wider than the receptive field centre during PBR stimulation tended to lie above a linear regression line (cf. Fig 6D-F). This tendency further supported the conclusion that PBR stimulation, in addition to the major effect on gain, elicited a weak reduction in centre- surround antagonism.
Effects of PBR stimulation on intrageniculate inhibition
Intrageniculate inhibition reinforces centre-surround antagonism from an average of 55 % for the retinal input to 77 % for the dLGN X cells (Ruksenas et al. 2000). This change is manifested in response versus spot width curves by a much sharper drop across the proximal surround in the curves for dLGN cells than in the curves for the retinal input to the cells. In the present study we found average values of antagonism in the dLGN cells that corresponded to the values from the previous study and the antagonism was about the same during PBR stimulation as in the control condition. This suggested that PBR stimulation had little effect on the intrageniculate inhibition that generates the modifications of the spatial receptive field properties.
To check directly for potential PBR-evoked changes of the spatial receptive field structure at the retinogeniculate relay, we compared the response versus spot width curves during PBR stimulation and in the control condition with the curves for the retinal input to the cell. This was done for 14 cells (13X and 1 Y). The general results were the same for all cells. An example is illustrated in Fig. 8A. Notice the pronounced reduction of the response in the dLGN cell in the proximal part of the antagonistic surround compared with the retinal input (cf. also the difference curve in Fig. 8B). During PBR stimulation there was no marked shift in the curve for the dLGN cell response (filled circles) towards the curve for the retinal input (open squares). The changes that did occur could be mainly accounted for by a gain increase. This is illustrated in Fig. 8A by the continuous curve, which shows the values for the control condition multiplied by a constant to match the maximum response during PBR stimulation, and the dashed curve which shows the control responses scaled up to 1:1 transmission in the receptive-field centre of the dLGN cell. Notice again the pronounced difference across the proximal-receptive field surround between these curves and the curve for retinal input. Nevertheless, there was a slight broadening of the response curve in the proximal surround for most cells (cf. Fig. 8A) indicating a minor PBR-evoked reduction of intrageniculate inhibition.
Figure 8. Changes in spatial receptive field properties at the retinogeniculate relay are only weakly influenced by PBR stimulation.
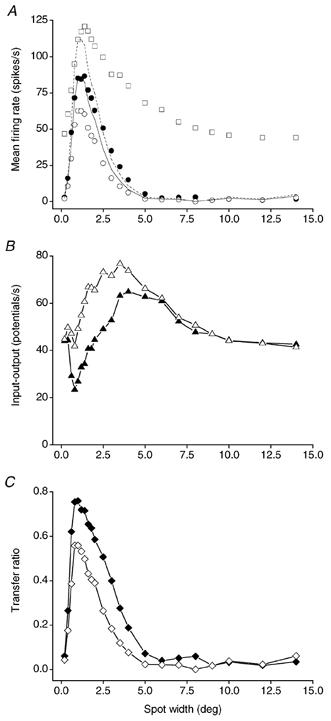
A, response versus spot width curves for an on-centre X cell. ▪s, retinal input measured by average rate of S-potentials during the 500 ms time window with spot on. Data points were based on 12 repetitions. The contrast was 0.33. ○s, response of the dLGN cell in the control condition measured by average firing rate of action potentials. •s, response of the dLGN cell during PBR stimulation. The effect of a pure gain increase is illustrated by the continuous and dotted curves which are the control response to the various spot diameters scaled by a constant to the response during PBR stimulation (continuous line, c = 1.4)or to the retinal input (dashed line, c = 1.8). B, difference between retinal input and dLGN cell response for each spot diameter. ▵s, retinal input minus response in control condition. ▴s, retinal input minus response during PBR stimulation. C, transfer ratio calculated for each spot diameter. ⋄s, transfer ratio versus spot width in the control condition. ♦s, transfer ratio versus spot width during PBR stimulation.
The average degree of antagonism in the retinal input to the 13 X cells was 56 % (s.d. = 15), which is consistent with the previous findings (53 %; Ruksenas et al. 2000). The antagonism for the dLGN cell response was 78 % (s.d. = 17) in the control condition and 75 % (s.d. = 21) during PBR stimulation confirming that this subsample of cells was representative in terms of antagonism for the whole sample of cells in the present study. The similar antagonism values for both PBR stimulation and control conditions demonstrate that the intrageniculate inhibition that caused the spatial receptive field changes was almost unaffected by the PBR stimulation. A very important implication of this result is that the inhibition that transforms the spatial receptive field properties in the dLGN must act at an earlier stage of geniculate processing than the stage where the PBR-controlled gain regulation operates.
Parabrachial region effects on the output versus input response rate
To study directly the effect of PBR stimulation on the relationship between output and input firing rate at the retinogeniculate relay, the data from the response versus spot width curve for the dLGN cell during PBR stimulation were combined with the data from the corresponding curve for the retinal input to the cell. This is illustrated in Fig. 9 with results from the same cell as illustrated in Fig. 8. Here the response of the dLGN cell to a given spot width is plotted against the response to the same spot in the retinal input. The open symbols refer to spots that were smaller than the receptive field centre and the filled symbols refer to spots that were wider than the receptive field centre. The series of open symbols show how the response of the cell increased with the increasing retinal input evoked by the stepwise wider spots. As the spots were stepwise widened beyond the receptive field centre, the series of the filled symbols show how the response of the cell decreased with the decreasing retinal input as more of the antagonistic surround was covered by the spot. Contrary to the relationship between response in the PBR condition versus response in the control condition, which was approximately linear (Fig. 6), the relationship to the retinal input (Fig. 9) was clearly non-linear (or only linear in parts; Ruksenas et al. 2000). The plots show that the response of the dLGN cell to a given input firing rate was considerably lower when this input was evoked by a spot wider than the receptive field centre than by a spot smaller than the receptive field centre. This demonstrates the presence of strong intrageniculate inhibition during the PBR stimulation (Ruksenas et al. 2000).
Figure 9. Effect of PBR stimulation on the output versus input relationship at the retinogeniculate relay.
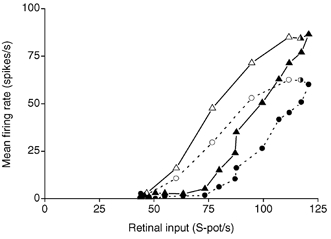
Replot of data in Fig. 8A. Circles and dashed line, response in the control condition of the dLGN cell to each spot diameter plotted against the retinal input for the same spot diameter. Triangles and continuous line, the response of the dLGN cell during PBR stimulation. Open symbols, response to stimuli smaller than or equal to the receptive field centre for the dLGN cell. Filled symbols, response to stimuli larger than the receptive field centre.
Comparison of the output-input relationship in the control condition (Fig. 9, dashed line) and the PBR condition (Fig. 9, continuous line) shows that the PBR stimulation increased the gain of the output-input relationship, both for spots smaller and larger than the receptive field centre. However, the difference between the response of the cell to pairs of spots, one narrower and one wider than the receptive field centre, which evoked the same firing rate in the retinal input, was about the same in the control condition as in the PBR condition. This again demonstrates that the PBR stimulation has little effect on the intrageniculate inhibition that generates the modification of the spatial receptive field properties and the centre-surround antagonism, and that these modifications must occur earlier in the processing than the stage where the PBR controlled gain regulation is acting.
Effects of PBR stimulation on retinogeniculate transfer ratio
The transfer ratio, defined by the dLGN cell response divided by the response in the retinal input, showed a pronounced increase during PBR stimulation, confirming previous findings (Hartveit et al. 1993: Cheng et al. 1995; Hartveit & Heggelund, 1995). Figure 8C shows how the transfer ratio increased during PBR stimulation for the various spot stimuli. The increase was most pronounced for the spots that gave a strong response in the control condition suggesting that the transfer ratio increased with increasing response level in the dLGN cell (Cheng et al. 1995; Hartveit & Heggelund, 1995; Ruksenas et al. 2000).
To get further insights into the location of the site where PBR stimulation generates the increased transfer ratio we replotted the transfer ratio against input firing rate. If the transfer ratio had simply been determined by the firing rate of the retinal input, a small spot in the receptive field centre should have the same transfer ratio as a large spot covering both centre and surround of the receptive field, provided that the response in the retinal input were the same in both cases. This was not the case. The small centre spot had a higher transfer ratio than the large spot, demonstrating the involvement of intrageniculate inhibition. This is illustrated in Fig. 10 (cf. also Ruksenas et al. 2000) where the data for both the control condition (circles and dashed line) and the condition with PBR stimulation (triangles and continuous line) are shown. The open symbols show the transfer ratios for the series of spots that were smaller than the width of the receptive field centre of the dLGN cell. The filled spots show data for the series of spots that were wider than the receptive field centre of the dLGN cell. The transfer ratio increased with the increasing retinal input generated by the stepwise widening of the spots, and the curve approached a maximum close to the input generated by a spot that filled the receptive field centre (half-filled symbol). The transfer ratio decreased again for even wider spots when the response was reduced due to the surround inhibition. Notice that the transfer ratios caused by these larger spots were consistently below the transfer ratios caused by the small spots in the receptive field centre at the same input firing rates. As illustrated by Fig. 10, the difference between the transfer ratio for the small and the larger spot at a given input firing rate was maximal when the larger spot was about the same size as the spot that gave the strongest response reduction at the retinogeniculate relay (maximum point in Fig. 8B). This spot width presumably generated the maximal intrageniculate inhibition (centre width of the centre-surround organized intrageniculate inhibitory field; Ruksenas et al. 2000). For even wider spot sizes, the difference of transfer ratio was reduced. This is consistent with our previous suggestion (Ruksenas et al. 2000) that the intrageniculate inhibitory field has a centre-surround organization, and a centre size that is wider than the receptive field centre of the relay dLGN cell.
Figure 10. Effect of PBR stimulation on the transfer ratio at the retinogeniculate relay.
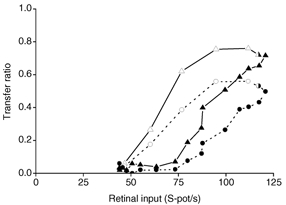
Replot of data in Fig. 8. Circles and dashed line, transfer ratio in the control condition for each spot diameter plotted against the retinal input for the same spot diameter. Triangles and continuous line, transfer ratio during PBR stimulation. Open symbols, transfer ratios for stimuli smaller than or equal to the receptive field centre for the dLGN cell. Filled symbols, transfer ratios for stimuli larger than the receptive field centre.
During PBR stimulation a similar pattern was seen as in the control condition, except that there was a general increase in transfer ratio for all input firing rates (Fig. 10, triangular symbols and continuous line). However, the difference between transfer ratios generated by the small and the large spots, at a given input firing rate, was about the same during PBR stimulation as in the control condition. This is demonstrated by the fact that the vertical separation between the curves was about the same in the two conditions (Fig. 10). This suggests that the PBR-evoked increase in transfer ratio occurred at a stage following the modification of the spatial structure of the receptive field.
Discussion
PBR stimulation evoked increased responses in the dLGN cells to all spot sizes, but without giving any marked changes in the spatial receptive field properties of the cells. The effect of PBR stimulation was therefore mainly increased response gain. At the retinogeniculate relay there is a spatial reorganization of the receptive field with increased inhibition, particularly in the proximal part of the receptive field surround, which reinforces the centre-surround antagonism. The fact that PBR stimulation evoked no pronounced changes in the spatial receptive field properties suggests that the spatial reorganization of the receptive field and the gain regulation occur at different stages of neural processing in the dLGN. The spatial reorganization must occur at an earlier stage and the PBR-controlled regulation of gain at a later stage. Therefore, the PBR input regulates the amplification of the spatially filtered response.
Several lines of evidence suggested that the PBR stimulation mainly changed the gain of the dLGN cell response. Firstly, the response to almost all spot stimuli increased without any pronounced change in shape of the response versus spot width curves during PBR stimulation. Secondly, there was no marked change of antagonism during PBR stimulation. Thirdly, there was no marked change in the dimensions of the receptive field centre and surround. Fourthly, there was a near linear relationship between the response during PBR stimulation and the response in the control condition. The conclusion that the PBR effect on the response gain must be induced at a later stage of processing than the stage where the modification of the spatial receptive field properties occurs was also suggested by several findings. Firstly, the centre-surround antagonism was increased by about 50 % at the retinogeniculate relay, and the antagonism during PBR stimulation remained at the same elevated level. Secondly, the shape of the response versus spot width curves for the dLGN cell in both control and PBR conditions was distinctly different from the curve for the retinal input to the cell. This difference was mainly due to the strong reduction of response in the proximal surround, which is an effect that must be caused by intrageniculate inhibition. Apart from a minor reduction of this inhibition in some of the cells, this spatial intrageniculate inhibition remained almost unchanged during PBR stimulation. Thirdly, the slope of the output versus input curves increased during PBR stimulation, reflecting the increase of gain, but the distance between the curves for spots smaller than the receptive field centre and curves for spots larger than the receptive field centre, reflecting the spatial intrageniculate inhibition, was almost unchanged. Fourthly, the transfer ratio increased during PBR stimulation. When the transfer ratio was plotted against input firing rate, the transfer ratio increased during PBR stimulation to all spots, reflecting the increased gain. However, the difference between the transfer ratio for small and large spots with the same input firing rate remained about the same during PBR stimulation.
Increased gain of retinogeniculate transmission during PBR stimulation could be caused by the muscarinic receptor-mediated depolarization of the relay cells that brings the membrane potential closer to firing threshold (McCormick et al. 1997). As a consequence more of the incoming action potentials in the retinal afferents would generate action potentials in the relay cell (Uhlrich et al. 1995). This would have been a simple and plausible explanation if the centre-surround antagonism of the relay cell had been the same as for the retinal input, instead of the markedly increased antagonism observed in the relay cell. A stronger weight of the retinal input due to depolarization of relay cells without any marked adjustments of the intrageniculate inhibition would imply that the spatial structure of the relay cell during PBR stimulation should become more similar to the field of the retinal input, and that the centre-surround antagonism should decrease. This was not the case. The centre-surround antagonism showed no marked change during the PBR-evoked increase of gain.
The increased centre-surround antagonism at the retinogeniculate relay is probably due to inhibitory input to the relay cells from intralaminar interneurones (Eysel et al. 1986; Ruksenas et al. 2000). These interneurones have receptive fields of the antagonistic centre-surround type, similar to the retinal input to the dLGN cells (Dubin & Cleland, 1977; Mastronarde, 1992). Their fields are of the on- or off-centre type, and the receptive field centre is wider than the fields of retinal ganglion cells at a given eccentricity, presumably due to input from several retinal afferents with slightly displaced receptive fields (Mastronarde, 1992). If the field of the interneurone is about concentric to the field of the retinal input to a relay cell, the interneurone could provide inhibition over an area extending beyond the receptive field centre of the direct retinal input and give particularly strong inhibition in the proximal surround of the relay cell (Ruksenas et al. 2000). Mathematical modelling of this arrangement has demonstrated that it can accurately account for the spatial receptive field of the relay cell and for the increased centre-surround antagonism at the retinogeniculate relay (Einevoll & Heggelund, 2000).
The interneurones can inhibit relay cells through both the dendritic and the axonal route. The fact that PBR stimulation had little effect on the degree of intrageniculate inhibition suggests that the spatial receptive field changes in the dLGN are mainly caused by the dendritic output from the interneurones. The axonal route is probably of less importance because the axonal output seems to be attenuated by cholinergic input (Francesconi et al. 1988; McCormick & Pape, 1988; Pape & McCormick, 1995; Zhu & Heggelund, 2001). The dendritic output passes through dendro-dendritic synapses that are part of a triadic synaptic arrangement. In the triads, a retinal afferent terminal has an excitatory synapse with a relay cell dendrite and an interneurone dendrite and the interneurone dendrite in turn has an inhibitory synapse with the relay cell dendrite (Sherman & Guillery, 1996). Consequently, the triads are strategically well positioned to perform a spatial filtering of the excitatory retinal input to the relay cell. If the dendritic branches of the interneurone, which have synapses with a given relay cell, have input from a few retinal afferents in addition to those that excite the relay cell, the summation of these inputs across the dendritic branches would have the necessary spatial properties to perform the spatial filtering of the retinal input to the relay cell. It should, however, be noted that cholinergic inputs may also contact dendritic terminals of interneurones (F2 terminals; Erişir et al. 1997). The function of this input is unknown, so at present it is unclear whether or not this input could influence the spatial filtering by the feedforward inhibition.
Results from several previous in vivo studies have been interpreted as evidence for increased intrageniculate inhibition by local ACh application in the dLGN (Sillito et al. 1983; Eysel et al. 1986) or arousal from sleep (Livingstone & Hubel, 1981). The interpretation has been based on two main findings. Firstly, the suppression of response by light off in the receptive field centre of an on-centre cell, or light on in the centre of an off-centre cell seemed to be stronger in the experimental condition (Ach application or arousal from sleep) than in the control condition. However, in both conditions almost all response was abolished such that it is difficult to estimate the degree of suppression in the two conditions. Furthermore, these findings are probably related to reciprocal inhibition (opposite sign input) rather than to the lateral inhibition (same sign input) that is considered in the present paper. Secondly, there was sometimes a weak spontaneous activity in the control condition that was abolished in the experimental condition. This activity seems to have been due to burst activity generated by calcium spikes, which were unknown at the time of the initial study (Livinstone & Hubel, 1981). Thus, this activity was probably abolished in the experimental condition due to a state shift from burst mode to tonic mode, rather than due to increased intrageniculate inhibition. Using a linear system approach Uhlrich et al. (1995) found that PBR stimulation had an enhancement effect on the first harmonic response component to a drifting sinusoidal grating. Theoretical estimations suggested that the strength of both the centre and surround mechanisms in the receptive field was enhanced by the PBR stimulation. The reason for the apparent enhanced intrageniculate inhibition evoked by ACh, PBR stimulation or arousal in these studies could be the increased gain of the dLGN cell response. The increased gain would enhance the response modulation and thereby deepen the troughs in addition to raising the peaks in the reponse pattern.
We found a weak reduction of centre-surround antagonism and a slight widening of receptive field centre and surround in several cells. This could be a reflection of reduced long-range inhibition beyond the classical receptive field because such inhibition has been shown to diminish during ACh application (Eysel et al. 1986). Another possibility is that these changes reflect reduced axonal output from interneurones to relay cells (McCormick & Pape, 1988; Pape & McCormick, 1995; Zhu & Heggelund, 2001).
There are two postulated mechanisms for the PBR-controlled gain regulation, the muscarinic receptor-mediated depolarization of the relay cells (McCormick & Prince, 1987), and the cholinergic regulation of the feedback inhibition via the PGN (Ahlsén et al. 1984, 1985). Through the first mechanism, increased cholinergic input to the relay cells would shift the membrane potential of the cell closer to threshold for action potential generation. Thereby also weaker spatially filtered signals from the triads could reach threshold for action potential generation in the relay cell and contribute to a stronger output to the cortex. Through the second mechanism, cholinergic inhibition of the PGN cells could reduce the feedback inhibition of the relay cell and thereby increase the gain of the transmission to the cortex as suggested by Ahlsén et al. (1985). Most probably both mechanisms contribute to the gain regulation.
The stepwise signal processing in the dLGN with an early spatial filtering that enhances edge contrasts and a subsequent gain regulation, is probably a functionally important arrangement. In this way the PBR input can regulate the strength of the spatially enhanced signals to the cortex in a state-dependent manner.
Acknowledgments
We wish to thank Drs Aleksandr Bulatov, Gaute Einevoll and Hans E. Plesser for valuable comments on the manuscript, and Dr Bulatov, Mr Audun Tornes and Mr Øyvind Omang who wrote the computer programs for the project. Gallamine triethiodide (Flaxedil) was kindly provided by Cyanamid Nordiska, and halothane (Fluothane) by ICI-Pharma. This research project was supported financially by The Norwegian Research Council (NFR), and the Nansen Foundation.
References
- Ahlsén G, Lindström S, Lo F-S. Inhibition from the brain stem of inhibitory interneurones of the cat's dorsal lateral geniculate nucleus. Journal of Physiology. 1984;347:593–609. doi: 10.1113/jphysiol.1984.sp015085. [DOI] [PMC free article] [PubMed] [Google Scholar]
- Ahlsén G, Lindström S, Lo F-S. Interaction between inhibitory pathways to principal cells in the lateral geniculate nucleus of the cat. Experimental Brain Research. 1985;58:134–143. doi: 10.1007/BF00238961. [DOI] [PubMed] [Google Scholar]
- Bishop PO, Burke W, Davis R. Synapse discharge by single fibre in mammalian visual system. Nature. 1958;182:728–730. doi: 10.1038/182728b0. [DOI] [PubMed] [Google Scholar]
- Bullier J, Norton TT. X and Y relay cells in cat lateral geniculate nucleus: Quantitative analysis of receptive-field properties and classification. Journal of Neurophysiology. 1979;42:244–273. doi: 10.1152/jn.1979.42.1.244. [DOI] [PubMed] [Google Scholar]
- Cheng H, Chino YM, Smith I EL, II, Hamamoto J, Yoshida K. Transfer characteristics of lateral geniculate nucleus X neurons in the cat: Effects of spatial frequency and contrast. Journal of Neurophysiology. 1995;74:2548–2557. doi: 10.1152/jn.1995.74.6.2548. [DOI] [PubMed] [Google Scholar]
- Cleland BG, Dubin MW, Levick WR. Sustained and transient neurones in the cat’ s retina and lateral geniculate nucleus. Journal of Physiology. 1971;217:473–496. doi: 10.1113/jphysiol.1971.sp009581. [DOI] [PMC free article] [PubMed] [Google Scholar]
- Coenen AML, Vendrik AJH. Determination of the transfer ratio of cat's geniculate neurons through quasi-intracellular recordings and the relation with level of alertness. Experimental Brain Research. 1972;14:227–242. doi: 10.1007/BF00816160. [DOI] [PubMed] [Google Scholar]
- De Lima AD, Singer W. The brainstem projection to the lateral geniculate nucleus in the cat: identification of cholinergic and monaminergic elements. Journal of Comparative Neurology. 1987;259:92–121. doi: 10.1002/cne.902590107. [DOI] [PubMed] [Google Scholar]
- Dubin MW, Cleland BG. Organization of visual inputs to interneurones of lateral geniculate nucleus of the cat. Journal of Neurophysiology. 1977;40:410–427. doi: 10.1152/jn.1977.40.2.410. [DOI] [PubMed] [Google Scholar]
- Einevoll GT, Heggelund P. Mathematical models for the spatial receptive-field organization of nonlagged X-cells in the dorsal lateral geniculate nucleus of cat. Visual Neuroscience. 2000;17:871–885. doi: 10.1017/s0952523800176060. [DOI] [PubMed] [Google Scholar]
- EriŞir A, Van Horn SC, Bickford ME, Sherman SM. Immunocytochemistry and distribution of parabrachial terminals in the lateral geniculate nucleus of the cat: A comparison with corticogeniculate terminals. Journal of Comparative Neurology. 1997;377:535–549. [PubMed] [Google Scholar]
- Eysel UT, Pape H C & Van Schayck R. Excitatory and differential disinhibitory actions of acetylcholine in the lateral geniculate nucleus of the cat. Journal of Physiology. 1986;370:233–254. doi: 10.1113/jphysiol.1986.sp015932. [DOI] [PMC free article] [PubMed] [Google Scholar]
- Fitzpatrick D, Diamond IT, Raczkowski D. Cholinergic and monaminergic innervation of the cat's thalamus: comparison of the lateral geniculate nucleus with other principal sensory nuclei. Journal of Comparative Neurology. 1989;288:647–675. doi: 10.1002/cne.902880411. [DOI] [PubMed] [Google Scholar]
- Fourment A, Hirsch JC, Marc ME, Guidet C. Modulation of postsynaptic activities of thalamic lateral geniculate neurons by spontaneous changes in number of retinal inputs in chronic cats. 1. Input-output relations. Neuroscience. 1984;12:453–464. doi: 10.1016/0306-4522(84)90065-4. [DOI] [PubMed] [Google Scholar]
- Francesconi W, MÜLLER CM, Singer W. Cholinergic mechanisms in the reticular control of transmission in the cat lateral geniculate nucleus. Journal of Neurophysiology. 1988;59:1690–1718. doi: 10.1152/jn.1988.59.6.1690. [DOI] [PubMed] [Google Scholar]
- Freygang WH., Jr An analysis of extracellular potentials from single neurons in lateral geniculate nucleus of the cat. Journal of General Physiology. 1958;41:543–562. doi: 10.1085/jgp.41.3.543. [DOI] [PMC free article] [PubMed] [Google Scholar]
- Funke K, Eysel UT. Modulatory effects of acetylcholine, serotonin and noradrenaline on the activity of cat perigeniculate neurons. Experimental Brain Research. 1993;95:409–420. doi: 10.1007/BF00227133. [DOI] [PubMed] [Google Scholar]
- Funke K, Eysel UT. Change in response modulation of cat perigeniculate neurons related to EEG state and application of neuromodulators. Neuroreport. 2000;12:815–820. doi: 10.1097/00001756-200103260-00039. [DOI] [PubMed] [Google Scholar]
- Fukuda Y, Stone J. Evidence of differential inhibitory influences on X- and Y-type relay cells in the cat's lateral geniculate nucleus. Brain Research. 1976;113:188–196. doi: 10.1016/0006-8993(76)90018-4. [DOI] [PubMed] [Google Scholar]
- Hamamoto J, Cheng H, Yoshida K, Smith EL, III, Chino YM. Transfer characteristics of lateral geniculate nucleus X-neurons in the cat, effects of temporal frequency. Experimental Brain Research. 1994;98:191–199. doi: 10.1007/BF00228408. [DOI] [PubMed] [Google Scholar]
- Hartveit E, Heggelund P. Neurotransmitter receptors mediating excitatory input to cells in the cat lateral geniculate nucleus. II. Nonlagged cells. Journal of Neurophysiology. 1990;63:1361–1372. doi: 10.1152/jn.1990.63.6.1361. [DOI] [PubMed] [Google Scholar]
- Hartveit E, Heggelund P. The effect of contrast on on the visual response of lagged and nonlagged cells in the cat lateral geniculate nucleus. Visual Neuroscience. 1992;9:515–525. doi: 10.1017/s0952523800011317. [DOI] [PubMed] [Google Scholar]
- Hartveit E, Heggelund P. Brain-stem influence on visual response of lagged and nonlagged cells in the cat lateral geniculate nucleus. Visual Neuroscience. 1993a;10:325–339. doi: 10.1017/s0952523800003722. [DOI] [PubMed] [Google Scholar]
- Hartveit E, Heggelund P. The effect of acetycholine on the visual response of lagged cells in the cat dorsal lateral geniculate nucleus. Experimental Brain Research. 1993b;95:443–449. doi: 10.1007/BF00227137. [DOI] [PubMed] [Google Scholar]
- Hartveit E, Heggelund P. Brainstem modulation of signal transmission through the cat dorsal lateral geniculate nucleus. Experimental Brain Research. 1995;103:372–384. doi: 10.1007/BF00241496. [DOI] [PubMed] [Google Scholar]
- Hartveit E, Ramberg SI, Heggelund P. Brain stem modulation of spatial receptive field properties of single cells in the dorsal lateral geniculate nucleus of the cat. Journal of Neurophysiology. 1993;70:1644–1655. doi: 10.1152/jn.1993.70.4.1644. [DOI] [PubMed] [Google Scholar]
- Heggelund P, Hartveit E. Neurotransmitter receptors mediating excitatory input to cells in the cat lateral geniculate nucleus. I. Lagged cells. Journal of Neurophysiology. 1990;63:1347–1360. doi: 10.1152/jn.1990.63.6.1347. [DOI] [PubMed] [Google Scholar]
- Hu B, Steriade M, Deschênes M. The effects of brainstem peribrachial stimulation on neurons of the lateral geniculate nucleus. Neuroscience. 1989;31:13–24. doi: 10.1016/0306-4522(89)90027-4. [DOI] [PubMed] [Google Scholar]
- Hubel DH, Wiesel TN. Integrative action in the cat's lateral geniculate body. Journal of Physiology. 1961;155:385–398. doi: 10.1113/jphysiol.1961.sp006635. [DOI] [PMC free article] [PubMed] [Google Scholar]
- Humphrey AL, Weller RE. Functional distinct groups of X-cells in the lateral geniculate nucleus of the cat. Journal of Comparative Neurology. 1988;268:429–447. doi: 10.1002/cne.902680311. [DOI] [PubMed] [Google Scholar]
- Kaplan E, Shapley RM. The origin of the S (slow). potential in the mammalian lateral geniculate nucleus. Experimental Brain Research. 1984;55:111–116. doi: 10.1007/BF00240504. [DOI] [PubMed] [Google Scholar]
- Lee K, McCormick DA. Acetylcholine excites GABAergic neurons of the ferret perigeniculate nucleus through nicotinic receptors. Journal of Neurophysiology. 1995;73:2123–2128. doi: 10.1152/jn.1995.73.5.2123. [DOI] [PubMed] [Google Scholar]
- Levick WR. Another tungsten microelectrode. Medical and Biological Enginering. 1972;10:510–515. doi: 10.1007/BF02474199. [DOI] [PubMed] [Google Scholar]
- Livingstone MS, Hubel DH. Effects of sleep and arousal on the processing of visual information in the cat. Nature. 1981;291:554–561. doi: 10.1038/291554a0. [DOI] [PubMed] [Google Scholar]
- Mastronarde DN. Two classes of single-input X-cells in cat lateral geniculate nucleus. I. Receptive field properties and classification of cells. Journal of Neurophysiology. 1987;57:357–380. doi: 10.1152/jn.1987.57.2.357. [DOI] [PubMed] [Google Scholar]
- Mastronarde DN. Nonlagged relay cells and interneurones in the cat lateral geniculate nucleus: Receptive-field properties and retinal inputs. Visual Neuroscience. 1992;8:407–441. doi: 10.1017/s0952523800004934. [DOI] [PubMed] [Google Scholar]
- McCormick DA, Huguenard JR, Bal T, Pape HC. Electrophysiological and pharmacological properties of thalamic GABAergic neurons. In: Steriade M, Jones EG, McCormick DA, editors. Thalamus, Experimental and Clinical Aspects. II. Amsterdam: Elsevier Science Ltd.; 1997. [Google Scholar]
- McCormick DA, Pape HC. Acetylcholine inhibits identified interneurones in the cat lateral geniculate nucleus. Nature. 1988;334:246–248. doi: 10.1038/334246a0. [DOI] [PubMed] [Google Scholar]
- McCormick DA, Prince DA. Actions of acetylcholine in the guinea pig and cat medial and lateral geniculate nuclei in vitro. Journal of Physiology. 1987;392:147–165. doi: 10.1113/jphysiol.1987.sp016774. [DOI] [PMC free article] [PubMed] [Google Scholar]
- Montero VM. A quantitative study of synaptic contacts on interneurons and relay cells of the cat lateral geniculate nucleus. Experimental Brain Research. 1991;86:257–270. doi: 10.1007/BF00228950. [DOI] [PubMed] [Google Scholar]
- Murphy PC, Uhlrich DJ, Tamamaki N, Sherman SM. Brain-stem modulation of the response properties of cells in the cat's perigeniculate nucleus. Visual Neuroscience. 1994;11:781–791. doi: 10.1017/s0952523800003084. [DOI] [PubMed] [Google Scholar]
- Norton TT, Holdefer RN, Godwin DW. Effects of bicuculline on receptive field center sensitivity of relay cells in lateral geniculate nucleus. Brain Research. 1989;488:348–352. doi: 10.1016/0006-8993(89)90728-2. [DOI] [PubMed] [Google Scholar]
- Norton TT, Godwin DW. Inhibitory GABAergic control of visual signals at the lateral geniculate nucleus. Progress in Brain Research. 1992;90:193–217. doi: 10.1016/s0079-6123(08)63615-8. [DOI] [PubMed] [Google Scholar]
- Pape HC, McCormick DA. Electrophysiological and pharmacological properties of interneurons in the cat dorsal lateral geniculate nucleus. Neuroscience. 1995;68:1105–1125. doi: 10.1016/0306-4522(95)00205-w. [DOI] [PubMed] [Google Scholar]
- Rodieck RW, Pettigrew JD, Bishop PO, Nikara T. Residual eye movements in receptive field studies of paralysed cats. Vision Research. 1967;7:107–110. doi: 10.1016/0042-6989(67)90031-4. [DOI] [PubMed] [Google Scholar]
- Ruksenas O, Fjeld IT, Heggelund P. Spatial summation and center-surround antagonism in the receptive field of single units in the dorsal lateral geniculate nucleus of cat: Comparison with retinal input. Visual Neuroscience. 2000;17:855–870. doi: 10.1017/s0952523800176059. [DOI] [PubMed] [Google Scholar]
- Sherman SM, Guillery RW. Functional organization of thalamocortical relays. Journal of Neurophysiology. 1996;76:1367–1395. doi: 10.1152/jn.1996.76.3.1367. [DOI] [PubMed] [Google Scholar]
- Sillito AM, Kemp JA. The influence of GABAergic inhibitory processes on the receptive field structure of X and Y cells in cat dorsal lateral geniculate nucleus (dLGN) Brain Research. 1983;277:63–77. doi: 10.1016/0006-8993(83)90908-3. [DOI] [PubMed] [Google Scholar]
- Sillito AM, Kemp JA, Beradi N. The cholinergic influence on the function of the cat dorsal lateral geniculate nucleus (dLGN) Brain Research. 1983;280:299–307. doi: 10.1016/0006-8993(83)90059-8. [DOI] [PubMed] [Google Scholar]
- So YT, Shapley R. Spatial properties of X and Y cells in the lateral geniculate nucleus of the cat and conduction velocities of their inputs. Experimental Brain Research. 1979;36:533–550. doi: 10.1007/BF00238521. [DOI] [PubMed] [Google Scholar]
- So YT, Shapley R. Spatial tuning of cells in and around lateral geniculate nucleus of the cat: X and Y relay cells and perigeniculate interneurons. Journal of Neurophysiology. 1981;45:107–120. doi: 10.1152/jn.1981.45.1.107. [DOI] [PubMed] [Google Scholar]
- Steriade M, Jones EG, McCormick DA. Thalamus. Organization and Function. I. Amsterdam: Elsevier Science Ltd; 1997. [Google Scholar]
- Uhlrich DJ, Tamamaki N, Murphy PC, Sherman SM. Effects of brain stem peribrachial activation on receptive field properties of cells in the lateral geniculate nucleus. Journal of Neurophysiology. 1995;73:2428–2447. doi: 10.1152/jn.1995.73.6.2428. [DOI] [PubMed] [Google Scholar]
- Zhu JJ, Heggelund P. Muscarinic regulation of dendritic and axonal outputs of rat thalamic interneurons: A new cellular mechanism for uncoupling distal dendrites. Journal of Neuroscience. 2001;21:1148–1159. doi: 10.1523/JNEUROSCI.21-04-01148.2001. [DOI] [PMC free article] [PubMed] [Google Scholar]


