

Abstract
The permeability, PS, to sodium fluorescein (Stokes-Einstein radius = 0.45 nm) has been measured in single mesenteric capillaries of pithed frogs and anaesthetised rats as perfusion velocity, U, was varied over a range from 400 up to 2000–10 000 μm s−1. PS increased linearly with U. In 20 frog capillaries, mean (± S.E.M.) PS (in μm s−1) = 9.35 (± 1.55)U × 10−5 + 0.244 (± 0.0291). Similarly, in nine rat venules, mean PS = 1.62 (± 0.385)U × 10−4 + 0.375 (± 0.025). The flow-dependent component of permeability could be reversibly abolished in frog capillaries by superfusing with 100 μM noradrenaline and by superfusing rat venules with the nitric oxide synthase inhibitor, NG-nitro-L-arginine (20 μM). It was shown that changes in microvascular pressure accompanying changes in U during free perfusion could account for only 15 % of the changes in PS, i.e. 85 % of the changes in PS were changes in the permeability coefficient itself. A comparison between the changes in PS with U and the previously described changes in microvascular permeability to K+ with U, suggest that if the flow-dependent component of permeability is modelled as a population of pores of constant size, these have radii of 0.8 nm. Such a pathway would limit flow-dependent permeability to small hydrophilic molecules and have minimal effect on net fluid exchange.
The experiments described in this paper were designed to determine whether the permeability of single mesenteric capillaries and venules to small hydrophilic solutes varied directly with the velocity of perfusion through them. Until recently it was assumed that microvascular permeability was quite independent of the rate at which blood flowed through the vessels. The enhancement of microvascular transport by increased microvascular flow has been accounted for entirely in terms of the increased gradients of solute concentration (since increased flow brings the mean microvascular concentration closer to the arterial concentration) and ‘capillary recruitment’ as more microvessels in the tissue are perfused and the area through which exchange can occur is increased.
Recent experiments in our laboratory on single perfused microvessels have shown that permeability itself may increase rapidly and reversibly as flow through the vessels is increased (Kajimura et al. 1998; Kajimura & Michel, 1999a,b). In these experiments the permeability to K+ (PK) was shown to be linearly related to perfusion velocity (U). The outstanding question was whether this was a phenomenon that was restricted to the permeability of ions or whether it was more general, with the permeability to all hydrophilic solutes having a flow-dependent component. Two reports in the literature suggest that the permeability to larger hydrophilic solutes may be increased with increasing flow. The earliest suggestion of flow-dependent permeability came in a report by Yuan et al. (1992). Working on isolated perfused venules from pig heart, these authors found that permeability to fluorescein isothiocyanate-labelled albumin increased with perfusion rate. This effect of perfusion rate on permeability was lost when the NO synthase inhibitor NG-monomethyl-l-arginine was added to the perfusate. A few years later, Turner & Pallone (1997) reported that in isolated descending vasa recta from the rat, the permeability to raffinose was increased by increasing the rate of perfusion of the vessel.
In the experiments described in the present paper, we have measured the microvascular permeability to sodium fluorescein in single frog and rat mesenteric microvessels which have been perfused in situ. Sodium fluorescein has been used as a test solute not only because a method for estimating its permeability value was available for these vessels (Huxley et al. 1987) but also because it has an effective molecular radius which is comparable with that of sucrose. We argued that if the permeability to sodium fluorescein (PS) could be shown to be influenced by perfusion velocity, it would suggest that the permeability to similar and smaller molecules is also influenced by perfusion rate. Since some of these molecules are of considerable physiological importance (e.g. glucose, lactate and the smaller amino acids) it would suggest that flow-dependent permeability might contribute to their transport between blood and tissues.
Preliminary reports of our results have been presented to the European Society for Microcirculation (Montermini et al. 2000).
METHODS
General preparation
The experiments were carried out under Home Office Regulations on male frogs, Rana temporaria (6–7.5 cm in length, supplied by Blades, Edenbridge, UK), and on young Sprague-Dawley rats (100 g, supplied by Harlan, Bicester, UK). The frogs were stunned by a blow on the head before the brain and upper parts of the spinal cord were pithed, in accordance with Schedule 1 of the UK Animals (Scientific Procedures) Act 1986. The intestine was then floated out of the abdominal cavity through a small incision and the mesentery spread over the flat polished upper surface of a Perspex pillar so that it could be transilluminated. The mesentery was superfused with cooled frog Ringer solution and the tissue temperature, which was monitored continuously by a thermistor on the upper surface of the pillar, was maintained at 16 °C. The rats were anaesthetised with an intramuscular injection of 0.08–0.12 ml of a mixture of Hypnorm (0.315 mg ml−1 fentanyl citrate and 10 mg ml−1 fluanisone; Janssen Pharmaceuticals Ltd, High Wycombe, UK), Hypnovel (5 mg ml−1 midozalam hydrochloride; Roche Products Ltd, Welwyn Garden City, UK) and water, made up in the proportions 1:1:2 by volume. Further intramuscular injections of this mixture were given before opening the abdominal cavity and during the experiment when the rat's reflex response to pinching the hind paws (which was tested between each measurement) suggested that it was necessary. A small incision to the left of rectus abdominis allowed a loop of intestine to be exteriorised. The mesentery could be arranged over a polished Perspex pillar and superfused with Ringer-Locke solution at 36 °C. The flow of the superfusate over the tissue was maintained between 3.5 and 4 ml min−1, providing a layer of fluid of constant depth over the mesentery.
The vessels chosen for study were mostly venous capillaries (diameter 18–35 μm) in frogs and postcapillary venules (diameter 18–35 μm) in rats. The tissue was observed through a stereomicroscope (Wild Heerbrugg M10) with a fluorescence attachment and a CCD camera (TK-C1360B, JVC). The polished Perspex pillar allowed the mesentery to be transilluminated with white light (150H, Volpi) for general observation, while a Mercury Lamp (Hg 100 W, Leica) and an appropriate set of filters (HQ480/40, GFP Plus, Leica) allowed excitation and observation of the emission of fluorescence. The images from the camera were displayed on video monitors, stored on videotape (AG-7350, Panasonic) and subsequently digitised and analysed off-line. The automatic gain control of the CCD camera was inactivated and the camera was oriented so that the images acquired were of a rectangular portion of mesentery in which the vessel was aligned with the horizontal axis. The magnification was chosen so that the height of the image field was about 7–8 times the vessel diameter. At the end of the experiment, rats were killed with an overdose of anaesthetic.
Solutions and reagents
The composition of the frog Ringer solution was (mm): 111 NaCl, 2.1 KCl, 1.0 MgCl2, 1.1 CaCl2, 0.195 NaHCO3 and 5.5 glucose, buffered with 2.3 Hepes and 2.7 Hepes sodium salt (Sigma). The pH was adjusted to 7.2 by the ratio of Hepes acid to base.
The composition of the Ringer-Locke solution was (mm): 130 NaCl, 4.6 KCl, 1.2 MgCl2, 2.5 CaCl2, 0.195 NaHCO3 and 5.5 glucose. It was buffered with 1.79 Na2HPO4, 0.21 NaH2PO4, 2.3 Hepes and 2.7 Hepes sodium salt. The pH was adjusted to 7.4.
The nonfluorescent perfusate was a similar Ringer solution to the superfusate to which bovine serum albumin (BSA; A-7638, Fraction V, Sigma) had been added at a concentration of 10 mg ml−1. The fluorescent perfusate contained in addition sodium fluorescein (F6377, Sigma; MW 376, Stokes-Einstein radius 0.45 nm) at the concentrations of 0.1 or 0.4 mg ml−1. The solution was made fresh on the day of use to avoid binding to the serum albumin (Adamson et al. 1994; Fu et al. 1998).
Noradrenaline (l-(-)-norepinephrine-(+)-bitartarate) and NG-nitro-l-arginine (l-NNA) were obtained from Calbiochem and Ringer solutions were used as vehicles for these reagents.
Double-barrelled perfusion pipette
Double-barrelled perfusion pipettes (Davis & Gore, 1987; McKay & Huxley, 1995) were made from θ tubing (external diameter 1.5 mm, length 100 mm; Clark Electromedical Instruments, Reading, UK). Two small holes were made on one side of the barrel with a diamond disc (Rx Honing Machine, Mishawaka, IN, USA) at distances of 6 and 14 mm from one of the extremities of the glass tube. After being ground, the glass tubes were cleaned with detergent (5 % Decon90, Decon Laboratories Ltd, Hove, Sussex, UK) and rinsed in distilled water, methanol and acetone. The hole closest to the extremity of the tube was filled with a plug of melted wax, occluding the lumen of that barrel so that it could only communicate with the outside through the hole ground at 14 mm from the extremity of the tube. The pipettes were pulled using a standard microelectrode puller (model PB-7, Narishige) and then bevelled with a microgrinder (model EG-4, Narishige) to produce a tip diameter of 15–25 μm. The double-barrelled microperfusion pipette was housed in a holder, which had been manufactured so that the open end of one barrel was separated from the opening in the side of the second by a silicon ring which acted as a water-tight seal between the two interior compartments. Since pressure could be applied to each of these compartments independently, the ejection or retention of the solution in each barrel could be controlled separately.
General protocol
Each vessel was cannulated with a bevelled double-barrelled micropipette. One barrel of the pipette was filled with the fluorescent and the other barrel with the nonfluorescent perfusate (Fig. 1). The micropipette holder connected each barrel of the micropipette separately through a two-way electric rotary valve (Omnifit Ltd, Cambridge, UK) to two water manometers. By appropriate adjustment of the pressures in the two manometers, the vessel could be perfused alternately with control (nonfluorescent) and fluorescent perfusate (Kajimura et al.1998). By carefully monitoring the interface of the two solutions at the tip of the micropipette, the pressure applied to the barrel of the pipette which was not perfusing the vessel was adjusted so that solution neither entered nor left it and so was equal to the hydrostatic pressure within the vessel at the tip of the pipette. This pressure was referred to as the balancing pressure (Pbal). If the vessel was initially perfused with the nonfluorescent perfusate (Pbal being applied to the barrel containing the fluorescent solution and perfusion pressure to the nonfluorescent solution), switching the electric rotary valve applied the higher perfusion pressure to the fluorescent solution, which immediately started to perfuse the vessel while Pbal, which was now applied to the other barrel, halted the flow of the nonfluorescent solution. Perfusion with sodium fluorescein solution was usually continued for only 10–15 s and then the perfusion was switched back to the nonfluorescent solution. The perfusion velocity in the vessel, U, was related to the pressures set in the manometers. U was increased by raising the pressure applied to the perfusing barrel of the pipette and by raising Pbal by a smaller increment so as to prevent flow into the nonperfusing barrel (see Fig. 2). The vessel was perfused by nonfluorescent solution and the fluorescent excitation light shut off for approximately 1 min after a new flow velocity was set and before each perfusion with fluorescent solution.
Figure 1. Schematic diagram of the experimental layout.
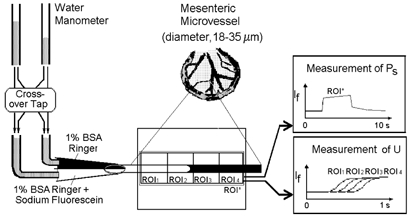
A single mesenteric microvessel (18–35 μm in diameter) was cannulated and perfused by a double-barrelled micropipette. One barrel was filled with the appropriate Ringer or Ringer-Locke solution while the other barrel contained the same solution to which sodium fluorescein had been added. Each barrel of the micropipette was connected through an electrically controlled cross-over tap to the water manometers. Pressures were set so that the vessel was perfused with solution from only one barrel of the pipette (nonfluorescent solution in the control state). When the cross-over tap was switched, the solution perfusing the vessel was immediately changed with minimal change in flow velocity. Images of the vessel and surrounding tissue were observed through a stereomicroscope and acquired by CCD camera to be analysed off-line. The time course profile of the fluorescent light intensity, If, for a region of interest (ROI*) was used to evaluate both PS and U.
Figure 2. Relation between pressure applied in the micropipette and perfusion velocity, U.
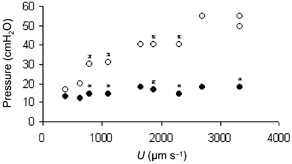
Data from an experiment on a rat mesenteric venule (25 μm diameter). Open circles (○) represent pressure applied to the perfusing barrel of the micropipette; closed circles (•) represent pressure applied to the nonperfusing barrel, i.e. the balancing pressure, Pbal. Since Pbal equals the pressure inside the vessel at the micropipette tip, it is seen that most of the pressure necessary for perfusion is dissipated within the pipette. The small increase in Pbal represents the largest increase in pressure in the vessel during perfusion. Asterisks indicate that the point represents more than one value.
Image analysis and measurement of permeability to sodium fluorescein (PS)
Images stored on videotape were digitised with a frame grabber (ATI Software MPEG 3.0) and analysed by dedicated software (Scion Image) off-line using a PC (Pentium Pro). The light intensity for each pixel could be measured and a mean value could be calculated for specific regions of interest (ROI).
In order to measure the permeability to sodium fluorescein, PS, the mean fluorescent light intensity, If, was evaluated for a rectangular ROI which initially extended along the length of the vessel for approximately 320 μm and on either side of the vessel by approximately 30–60 μm. PS was calculated from the relation:
| (1) |
where ΔIf0 is the step increase in fluorescent light intensity as the fluorescent perfusate fills the vessel lumen, (dIf /dt)0 is the initial rate of increase in fluorescent light intensity after solute fills the lumen and begins to accumulate in the tissue and r is the radius of the vessel (Huxley et al. 1987). In all later experiments, If was estimated separately over adjacent ROIs each extending only approximately 80 μm along the length of the vessel, in addition to the estimate made over the larger ROI.
While there was rarely any difficulty in estimating (dIf /dt)0 from the records, the precise value of If0 was not always so clear, particularly when flow velocity was low. To obtain an objective estimate of If0, the regression describing the accumulation of fluorescent solute in the tissue (the slope of which defined (dIf /dt)0) was extrapolated back to the time at which If first started to increase. The difference between the values of If at this time and the baseline If was taken as If0 (see Fig. 4).
Figure 4. PS in a single frog capillary (radius 15 μm) for two different flow velocities (U).
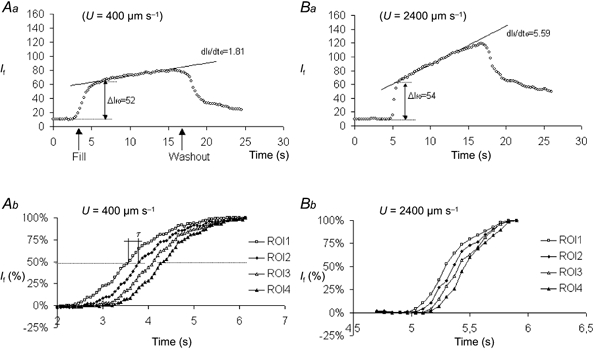
Aa and Ba show the fluorescent light intensity (If, nondimensional units 0–160) measured from a ROI covering a frog venular capillary and surrounding tissue before, during and after perfusion with sodium fluorescein. Changes in If with time are shown during perfusion at low (Aa) and high (Ba) values of U. Both records show that If increases rapidly from a low background to a similar level as the fluorescent perfusate fills the vessel. Then, a less rapid increase in If accompanies the diffusional flux of fluorescent molecules through the vessel wall. Note the greater rate of increase of If when U was high during this phase. When perfusate is switched back to the nonfluorescent solution (washout), a sharp decrease in If is seen and approximately 1 min later If is restored to the initial low background. PS calculated from data in Aa was 0.26 μm s−1 and from data in Ba it was 0.77 μm s−1. Ab and Bb show data used to determine U in these perfusions. If was measured over four ROIs (each one was 83 μm long and 160 μm wide) as the vessel filled with sodium fluorescein. The ROIs were set adjacent to each other along the vessel. The transit time for the perfusate to reach 50 % of If0 between consecutive ROIs was estimated. U was calculated from the distance between the centres of adjacent ROIs (83 μm) divided by the transit time. The average value for the perfusion shown in Ab was U = 400 μm s−1 and for that in Bb it was 2400 μm s−1.
PS is a clearance rather than a true permeability coefficient. It represents the sum of the diffusional permeability coefficient and the contribution of convection to the clearance of the solute. For small solutes such as sodium fluorescein the convective component of microvascular transport is expected to be small but we have evaluated the magnitude of this convective component in experiments which we report in this paper.
Measurement of flow velocity (U)
In order to measure the flow velocity, U, the mean fluorescent light intensity, If, was evaluated in adjacent rectangular ROIs along the length of the vessel. All four ROIs had the same dimensions, extending along the vessel for approximately 80 μm and to each side of the vessel by 40–50 μm. As the vessel filled with the fluorescent perfusate, the If in the ROI closest to the tip of the micropipette started to increase before the more distant ROIs. Thus the arrival of the fluorescent perfusate in the vessel led to four records of rising If, each record being separated from that in the neighbouring ROI by the mean transit time of the perfusate between them. The flow velocity, U, is the ratio of the distance between the ROI and the transit time. In practice, variations in cross-sectional area of the vessel and the transparency of the trans-illuminated tissues of the different ROIs introduce errors in the estimation of transit times from the ‘raw’ values of If. To minimise these errors, dIf /dt and If0 were estimated for each ROI as for the calculation of PS. The values of If during the initial rapidly rising phase, which lasted for no more than 2–3 s even at the lowest flows, were expressed as percentages of If0. The transit time, τ, was then defined as the time interval between If reaching 50 % of If0 in adjacent ROIs. U was then calculated from the distance (in μm) between the centres of adjacent ROIs and τ. The four ROIs along the length of the vessel allowed three estimates of U to be made for each perfusion and the mean of these three values was taken as the final value of U.
At high flow velocities estimates of τ from ROIs 80 μm apart would become less certain as τ approached (or even became less than) the interval between successive video frames (20 ms). To avoid such errors, when U was suspected to be greater than 3000 μm s−1, estimates of its value were made using a lower magnification and thus longer distances (and transit times) between adjacent ROIs. When values of U were plotted against the values of the pressures applied to perfusing and nonperfusing barrels of the micropipette, the relations were linear (Fig. 2). These relations are quantitatively similar to those reported by Kajimura & Michel (1999b), who estimated U by a different technique.
Calibration experiments
The estimates of PS are based on the assumption that there is a linear relation between If and the number of molecules of fluorescent solute in the ROI in which If is measured. This assumption was tested for our microscope and image analysis system both in vitro and in vivo. A haemocytometer was used for the in vitro experiments. This had a chamber 0.1 mm deep and estimates of If were made with it filled with Ringer solutions containing sodium fluorescein at concentrations of 0.0125, 0.025, 0.05 and 0.1 mg ml−1. The solutions were protected from light until a few seconds before each measurement. The in vivo experiments were carried out by measuring the fluorescence intensity from a mesenteric vessel perfused with solutions of known concentrations (0.05, 0.1, 0.2 and 0.4 mg ml−1 of sodium fluorescein in BSA-Ringer solution). The vessel was cannulated with a double-barrelled pipette, one barrel of which was filled with Ringer solution and the other with sodium fluorescein solution. Perfusion of the vessel for periods of several minutes with Ringer solution was alternated with perfusion for 10–20 s with the fluorescent solution. If was measured from a square ROI over the image of the vessel; the side of the ROI was about one-third of the vessel diameter and its centre was close to the vessel axis. A new pipette was then prepared, filled with Ringer solution on one side and fluorescent solution at a new concentration on the other side. The vessel was then recannulated at the same site with the new pipette and If was remeasured using the same ROI for analysis. The procedure was then repeated for another concentration of sodium fluorescein.
Statistical analysis
For convenience, average values are reported as means ± 1 s.e.m. Linear regression analysis was used to fit lines to the data for PS and U. The significance of a correlation in a single experiment was assessed from the correlation coefficient. The linearity of the relation between PS and U was tested by comparing the ‘goodness of fit’ of second and third order polynomials with a linear relation using GraphPad Prism software (San Diego, CA, USA). (This program calculates the significance of the variance ratio for linear and nonlinear regression curves for the different degrees of freedom.) Analysis of covariance (Weatherburn, 1946) was used to assess the correlation between PS and U in a group of experiments, e.g. under control conditions, in the presence of l-NNA and noradrenaline. To compare the differences in the values of slopes and intercepts within an experiment on a single capillary, a modified Student's t test was used (Bailey, 1959). To compare the average values of slopes and intercepts between two groups, both analysis of covariance and the Mann-Whitney U test (for unpaired data) were used. The level of significance was set at P < 0.05.
RESULTS
The relations between measured fluorescence intensity and sodium fluorescein concentration
There was a linear relation between the fluorescence intensity measured from a standard area over a trans-illuminated haemocytometer and the sodium fluorescein concentration of the solution within the chamber (Fig. 3, •). Estimates of If over single perfused rat and frog microvessels were also linearly related to the concentration of sodium fluorescein in the perfusate. This is shown in Fig. 3, where the data were derived from measurements on a vessel 28 μm in diameter, which was perfused with three solutions containing different concentrations of sodium fluorescein (○).
Figure 3. In vitro and in vivo calibrations of the fluorescent light detection system.
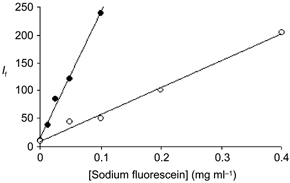
Fluorescent light intensity, If (arbitrary units 0–250), for a series of concentrations of sodium fluorescein in BSA-Ringer perfusates. In vitro measurements (•) were determined with varying concentrations of fluorescent solution in a haemocytometer (100 μm pathlength). In vivo measurements (○) were made from video recordings of perfusions of a single capillary with 4 different sodium fluorescein solutions and with a fifth solution in which there was no sodium fluorescein. The vessel was assumed to be circular in cross-section and estimates of If were made from a small area over the centre of the vessel, vessel diameter 28 μm.
Effects of varying flow on PS
Figure 4Aa and Ba shows the time course of mean fluorescent light intensity in specific ROIs surrounding a single frog mesenteric venule (30 μm in diameter) at two different perfusion rates. Figure 4Aa and Ba shows the fluorescence intensity (If) as measured over a ROI extending 332 μm along the length of the vessel and 60 μm to each side of it during the alternate cycles of perfusion with nonfluorescent and fluorescent solutions.
A similar low background level of If is seen in both Fig. 4Aa and Ba during the initial perfusion with nonfluorescent solution and also there is a similar step rise in If (If0) as the vessel is filled with fluorescent solution. As perfusion with fluorescent solution continues, If increases linearly with time as sodium fluorescein accumulates in the tissues. The gradient of this secondary increase in If is dIf /dt and it is seen to be considerably steeper in Fig. 4Ba when flow was 2400 μm s−1 than in Fig. 4Aa when U was only 400 μm s−1. When PS was calculated from the records shown in Fig. 4Aa and Ba, it was found to be 0.26 μm s−1 for Fig. 4Aa and 0.77 μm s−1 for Fig. 4Ba. Figure 4Ab and Bb shows the data from which U was calculated in these two experiments. In each panel, there are four records of the normalised If (If(%)) based on measurements in four adjacent ROIs as the vessel filled with the sodium fluorescein perfusate. The distance between the centres of two adjacent ROIs was 83 μm, ROI1 being the closest to the cannulation site and ROI4 the most distant. The time between If(%) reaching 50 % in adjacent ROIs is 0.2 s in Fig. 4Ab but only 0.033 s in Fig. 4Bb. This corresponds to U being 400 μm s−1 in Fig. 4Aa and 2400 μm s−1 in Fig. 4Ba.
When a series of estimates of PS was made at different values of U on the same vessel a clear positive correlation was seen. This was found to be true in both frog and rat microvessels and is illustrated in Fig. 5A, which shows the results of an experiment on a rat mesenteric venule. In this and similar experiments, U was varied in a random fashion in order to eliminate any effects of the sequence in which changes of U might influence PS. As shown from the data in Fig. 5B, the effects of U upon PS were independent of the order in which the measurements were made. A strong correlation (P < 0.01) between PS and U was observed in all nine rat vessels that were investigated. The individual experiments are shown in Fig. 6, where considerable variation in the slopes and intercepts of the regression lines is seen. The average changes of PS with U based on the regression through the data from all nine rat vessels is:
| (2) |
where slopes (nondimensional) and intercepts (μm s−1) are expressed as means ± s.e.m. and where PS and U are in micrometres per second. Analysis of covariance revealed that the correlation between PS and U was highly significant in individual experiments (P < 0.001) and that there was significant variation in regression coefficients between experiments. When the assumption of linearity was tested, it was found that for all experiments the data were better described by a linear relation than a third order polynomial and for only two of the experiments (those shown in Fig. 6F and I) did a second order polynomial fit the data better than a straight line. On this evidence it seemed reasonable to treat the relation between PS and U as linear over the range of values of U that we investigated.
Figure 5. The relation between PS and flow velocity: a single experiment on a venous microvessel.
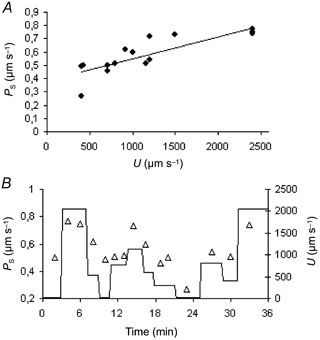
A, values of PS plotted against the corresponding value of flow velocity (U) in a single rat mesenteric venule. The line is the regression (n = 15, r = 0.828, P < 0.01). B, PS (▵) and the corresponding U (continuous line) plotted against the time of measurement after the start of the same experiment as in A. The vessel was initially perfused at low U for about 45 s before any measurements of PS were made.
Figure 6. The relation between PS and U in 9 rat venules.
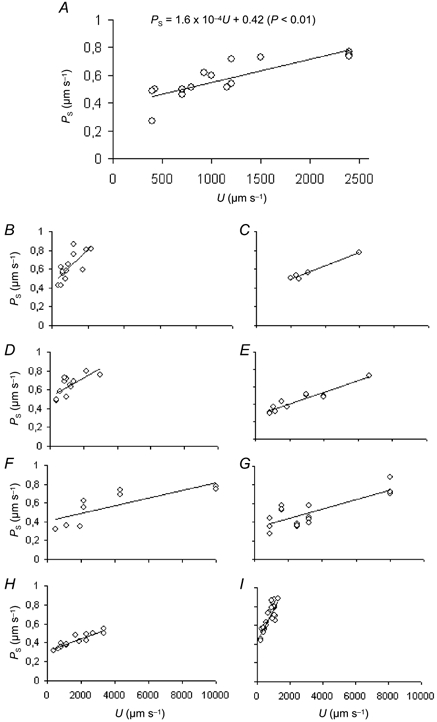
Each diagram shows the relation between PS and U for a single rat venule. Each vessel was taken from a different animal. In all the experiments there was a significant positive correlation between PS and U (P ≤ 0.01). The number of measurements (n) and the correlation coefficients (r) were: n = 15, r = 0.846 (A); n = 13, r = 0.741 (B); n = 5, r = 0.9866 (C); n = 12, r = 0.7184 (D); n = 11, r = 0.95 (E); n = 9, r = 0.8006 (F); n = 17, r = 0.79 (G); n = 14, r = 0.8432 (H); and n = 23, r = 0.8484 (I).
A similar correlation was found between PS and U in frog vessels. The results of the individual experiments on all 20 vessels that were investigated are shown in Fig. 7. In 16 out of these 20 experiments, the correlation was significant at the 5 % level or better and in 13 of these experiments it was better than 1 %. In the experiments shown in Fig. 7A, E and G, only a small number of measurements were possible and while here there was a trend of PS increasing with U, the small number of points meant that the P values for the correlation coefficients were less than 10 % but greater than 5 %. In the experiment shown in Fig. 7M, however, no correlation between PS and U could be demonstrated. Analysis of covariance indicated that, overall, the correlation between PS and U in individual experiments was highly significant (P < 0.001). The pooled data from all 20 frog vessels can be summarised by the equation:
| (3) |
Figure 7. The relation between PS and U in 20 frog capillaries.
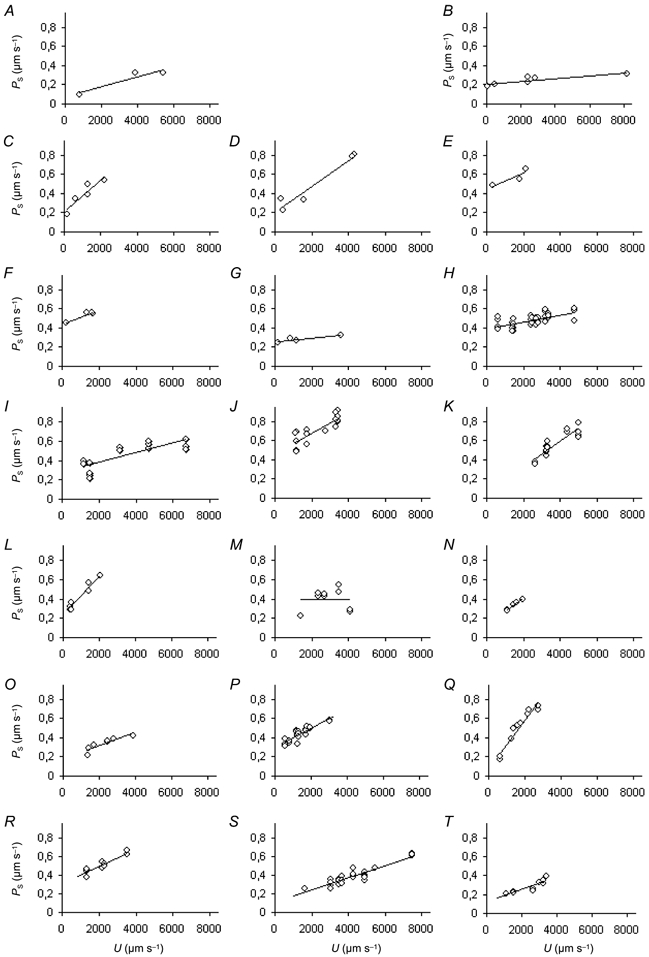
Each diagram shows the relation between PS and U for a single frog capillary. Each vessel was taken from a different animal. In most of the experiments there was a significant positive correlation between PS and U. The number of measurements (n), the correlation coefficients (r) and the level of significance (P) were: n = 3, r = 0.95, P < 0.1 (A); n = 6, r = 0.859, P < 0.05 (B); n = 5, r = 0.915, P < 0.05 (C); n = 5, r = 0.967, P < 0.01 (D); n = 3, r = 0.883, P < 0.1 (E); n = 4, r = 0.96, P < 0.05 (F); n = 4, r = 0.9129, P < 0.1 (G); n = 38, r = 0.64, P < 0.001 (H); n = 17, r = 0.83, P < 0.001 (I); n = 16, r = 0.847, P < 0.001 (J); n = 17, r = 0.909, P < 0.001 (K); n = 9, r = 0.956, P < 0.001 (L); n = 9, r = 0.003, P > 0.1 (M); n = 5, r = 0.973, P < 0.01 (N); n = 7, r = 0.897, P < 0.01 (O); n = 24, r = 0.883, P < 0.001 (P); n = 10, r = 0.964, P < 0.001 (Q); n = 13, r = 0.934, P < 0.001 (R); n = 27, r = 0.929, P < 0.001 (S); and n = 15, r = 0.919, P < 0.001 (T).
Repeated measurements of PS after a change in flow velocity (U) showed that the changes of PS were complete within 30 s of changing U.
Comparing the results for the two species, the values of the slopes were not significantly different from each other, (nrat = 9, nfrog = 20, unpaired Mann-Whitney U test, P < 0.05). The intercepts were significantly higher in rats than in frogs.
Effects of l-NNA on the relation between PS and U in rat venules
Kajimura & Michel (1999b) found that inhibitors of nitric oxide synthase inhibited the effects of flow velocity upon the microvascular permeability to K+ in rat mesenteric venules. To determine whether there was a similar effect upon the permeability to sodium fluorescein, we carried out seven experiments on anaesthetised rats where the mesenteries were superfused with a Ringer solution containing l-NNA at a concentration of 20 μM for 20 min before measurements of PS were made. The subsequent measurement of PS at various values of U is shown for the individual experiments in Fig. 8. In contrast with the controls, the correlation between PS and U in these experiments was rarely both significant and positive, though a negative correlation was observed in some experiments. This lack of a significant correlation between PS and U was confirmed by analysis of covariance. When the results were pooled, they were described by the equation:
| (4) |
Figure 8. The relation between PS and U in 7 rat venules in the presence of l-NNA.
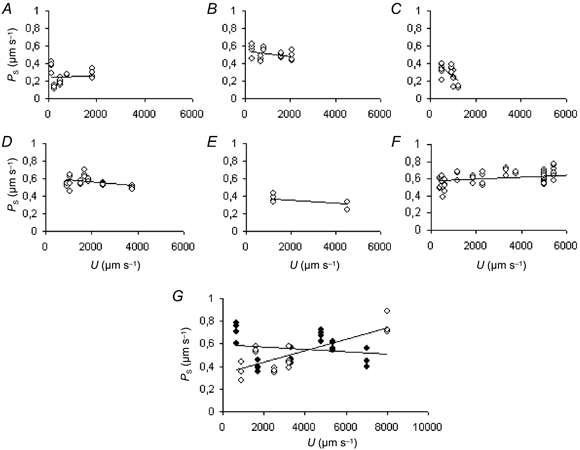
A-F show the relation between PS and U for single rat venules when 20 μM l-NNA was present in the superfusate. Each vessel was taken from a different animal. No significant positive correlation was found for any of the vessels. The number of measurements (n) and the correlation coefficients (r) were: n = 24, r = 0.033 (A); n = 20, r = -0.3685 (B); n = 17, r = -0.6105 (C); n = 26, r = -0.3814 (D); n = 8, r = -0.6095 (E); and n = 60, r = 0.3269 (F). In the experiment shown in G, no correlation was found between PS and U (n = 24, r = 0.168) in the presence of l-NNA (♦). Twenty minutes after the l-NNA had been replaced by l-NNA-free Ringer-Locke solution (⋄) there was a significant positive correlation between PS and U (n = 17, r = 0.7976, P < 0.01).
The values of the slopes were significantly different from the control (nl-NNA = 7, ncontrol = 9, unpaired Mann-Whitney U test, P < 0.05). Interestingly, the intercepts were significantly higher when l-NNA was present in the superfusate than under control conditions (P < 0.05).
In one experiment (shown in Fig. 8G), measurement of PS at varying values of U was followed by a period of 20 min in which the mesentery was superfused with Ringer-Locke solution which contained no l-NNA. The relations between PS and U were then redetermined and now a significant correlation between PS and U was found. It would appear that the flow dependency of PS upon U is reversibly inhibited by l-NNA in rat venules.
Effects of noradrenaline on the relation between PS and U in frog capillaries
In frog microvessels, flow-dependent permeability to K+ was not obviously influenced by inhibitors of NO synthase. It was, however, abolished by agents that raise cellular levels of cAMP (Kajimura & Michel, 1999a). To determine if there were similar effects of these compounds on the flow-dependent component of microvascular permeability to sodium fluorescein, we examined the relations between PS and U in single frog mesenteric capillaries and venules after the mesenteries had been superfused with frog Ringer solutions containing 100 μM noradrenaline.
Six experiments were carried out and the results of these are shown in Fig. 9. In one of these experiments the correlation coefficient was significant at the 5 % level. Analysis of covariance of the group indicated a small positive correlation within individual experiments but the regression coefficients in the presence of noradrenaline were smaller to a very significant degree (P < 0.01) than those obtained under control conditions, a conclusion which was also arrived at using the unpaired Mann-Whitney U test, P < 0.05, nnoradrenaline = 6, ncontrol = 9). The intercepts of the relation between PS and U were not significantly higher when noradrenaline was present in the superfusate than in control conditions.
Figure 9. The relation between PS and U in 6 frog capillaries in the presence of noradrenaline.

Each diagram shows the relation between PS and U for a single frog capillary when noradrenaline (100 μM) was added to the superfusate. Each vessel was taken from a different animal. No significant correlation was found for any of the vessels. The number of measurements (n) and the correlation coefficients (r) were: n = 32, r = 0.1456 (A); n = 25, r = 0.2095 (B); n = 17, r = 0.077 (C); n = 30, r = 0.0969 (D); n = 20, r = 0.4309 (E); and n = 30, r = 0.0435 (F).
‘Partial occlusion’ experiment: separation of the effects of microvascular pressure and flow velocity on PS
PS is really a measure of sodium fluorescein clearance from the perfusate into the tissue rather a measure of diffusional permeability. Its value represents the sum of diffusional permeability and clearance by convection through the microvascular wall. While it is usually assumed that the convective component of clearance is 10 % or less of PS (Adamson et al. 1994), it was important to check its contribution to flow-dependent permeability. To do this we followed the protocol of Kajimura et al. (1998).
The experiments were carried out on frog mesenteric venules. In each experiment PS was estimated over a range of values of U under conditions of free flow. The lumen of the vessel downstream from the region where permeability was being measured was then partially occluded by compressing the vessel with a fine glass rod. This procedure greatly reduced the flow and to achieve flow velocities in the vessel comparable with those under free-flow conditions it was necessary to raise the perfusion and balance pressures by 10 cmH2O or more. Estimates of PS were then repeated at these high pressures, attempting to achieve the same range of flows as had been used for the earlier estimates of PS in the same vessel under free-flow conditions. In this way it was possible to compare estimates of PS at similar values of U but with very different values of microvascular pressure and hence different filtration rates. Pbal is the pressure in the vessel at the site of cannulation and was used as a measure of microvascular pressure.
The results from one of these experiments are shown in Fig. 10. In Fig. 10B, Pbal is plotted against U under conditions of free flow and partial occlusion. It is evident that, in partially occluded vessels, Pbal had to be increased to 16 cmH2O above its value under free-flow conditions in order to maintain the velocity at 1300 μm s−1. From Fig. 10A it can be seen that the corresponding change in PS was about 0.137 μm s−1, suggesting a variation of about 0.0085 μm s−1 for 1 cmH2O change in Pbal. Under free-flow conditions, U rose from 1300 to 3500 μm s−1 and PS increased by about 0.20 μm s−1 as shown in Fig. 10A. The increase in U was accompanied by an increase in Pbal of 3.5 cmH2O. If this increase in Pbal increased PS to the same extent as under conditions of constant U, its contribution to the measured increase of 0.20–0.25 μm s−1 would be 0.0298 μm s−1, i.e. less than 15 % of the total increase in PS. Similar results were found in the four other experiments, where the pressure-associated contributions to the increase in PS were 17.2, 10.9, 14.5 and 18.6 %.
Figure 10. Separation of the effects of microvascular pressure and flow velocity on PS.

A shows measurements of PS plotted against U in a single frog capillary before (⋄) and after (♦) partial occlusion of the vessel outflow. The corresponding balancing pressures (Pbal) applied to the micropipette are plotted against U in B. The vertical arrow in B indicates that after partial occlusion, Pbal had to be raised 16 cmH2O to maintain a perfusion velocity of 1300 μm s−1. This rise in Pbal was accompanied by an increase in PS of 0.137 μm s−1 corresponding to an increment in PS of 0.0085 μm s−1 for each increment of 1 cmH2O in Pbal. Thus, under conditions of free flow, where an increase in U from 1300 to 3300 μm s−1 is accompanied by an increase in Pbal of 3.5 cmH2O, the associated increase in PS should be 0.0298 μm s−1. The measured increase in PS is seen to be 0.20–0.25 μm s−1.
Discussion
The principal finding reported in this paper is that in single mesenteric microvessels of both the frog and the rat, the permeability coefficient to sodium fluorescein increases with increasing rates of perfusion. This flow-dependent component of permeability was lost in the presence of l-NNA (in rat vessels) and in the presence of noradrenaline (in frog vessels). The findings complement and extend the earlier experiments of Kajimura et al. (1998) and Kajimura & Michel (1999a,b), who reported that the permeability of these microvessels to K+ increased reversibly and rapidly with increases in perfusion velocity.
Before considering possible physiological implications of these results, we must first consider how potential errors of the method we have used for measuring microvascular permeability to sodium fluorescein might give the appearance of a dependence of PS on U.
Possible measurement errors contributing to an apparent dependence of PS on U
(a) Contribution of convective transport
We have noted previously that PS is not the diffusional permeability coefficient to sodium fluorescein but the unidirectional clearance of sodium fluorescein from microvessels into the tissues, i.e. it is the sum of the diffusional permeability coefficient and the convective term for sodium fluorescein transport through the microvascular wall. Convective transport of sodium fluorescein should increase as the mean microvascular pressure increases. Since microvascular pressure was raised by a few centimetres of water to increase U, PS might be expected to increase with U as a consequence of increases in convective transport of the solute. This source of potential error was assessed in the partial occlusion experiments. Here, the relations between PS and U were compared over two very different ranges of pressure in the same vessel, allowing the effects of microvascular pressure on PS to be assessed at constant U. From the known changes in microvascular pressure that accompany changes in U under conditions of free perfusion, the pressure-sensitive (convective) component was found to contribute 15 % to the flow dependency of PS. Thus, approximately 85 % of the unidirectional clearance that is influenced by flow is the consequence of an increase in the diffusional permeability coefficient of the vessel wall.
It may be noted that our experimental estimate of 15 % for the contribution of convection to PS of sodium fluorescein is what might be expected from theoretical considerations of microvascular permeability to small hydrophilic molecules. In their studies of the permeability of frog mesenteric capillaries to sodium fluorescein, Adamson et al. (1994) and Fu et al. (1998) estimated that about 10 % of PS might be attributed to a convective component.
(b) Uncertainties in the estimation of PS
We have noted that estimates of If0 are more uncertain than (dIf /dt)0 and that this is particularly true when perfusion velocity is low. To reduce subjectivity in our estimates of If0, we determined its value by a standard procedure of backward extrapolation. If this procedure had consistently led to overestimates of If0 at low values of U with no consistent error in If0 at high values of U, PS would be underestimated at low values of U and would appear to increase as U was increased. While it is likely that we have underestimated PS both at low and at high values of U (see below), three lines of evidence indicate that this cannot account for the flow dependency of PS.
First, since the same criteria for estimating If0 were used in the absence and presence of either l-NNA in rat microvessels and in the absence and presence of noradrenaline in frog vessels, there is no clear reason why we failed to see flow dependency in the presence of these agents.
The second and third lines of evidence concern the principle of the fluorescence technique for measuring PS. The technique assumes that, during the first few seconds of perfusion, the flux of fluorescent solute through unit area of the vessel wall is driven by a concentration gradient which is equal to the luminal concentration of the solute, CL, since the concentration in the tissue fluid immediately outside the vessel, CO, is zero. Like Huxley et al. (1987), Adamson et al. (1994) and Fu et al. (1998), we have used the near constant flux of sodium fluorescein into the tissues over the first 10 s of perfusion to estimate PS. The assumption that CO remained close to zero over this period is obviously a very rough approximation indeed. Using confocal microscopy, Adamson et al. (1994) found that CO rose to 25–30 % of CL during the first 11 s of perfusion but increased more slowly thereafter. It might be argued that the assumption that (CL - CO) = CL is even less reasonable when U is low than when U is high. At low flows, the vessel fills more slowly with sodium fluorescein so that (CL - CO) is considerably less than CL not only because CO is greater than zero but initially CL is also well below its final value. If this were the case, PS would be underestimated to a greater extent at low flow than at high flow; hence the apparent dependence of PS upon U. There are two arguments against this hypothesis accounting for our observations.
First, it has been pointed out to us that if this were the case, PS would be expected to rise asymptotically to a maximum and the relation between PS and U would be nonlinear. Although the data from a minority of vessels might be fitted better by a curve than by a straight line, statistical analysis provides little support for nonlinearity.
Second, the criticism is not supported by a quantitative analysis of the changes in CL and CO during the first 10–20 s of perfusion with labelled solute. The estimates of CO made by Adamson et al. (1994) were shown to be consistent with a mathematical model developed by Fu et al. (1995) to describe tracer flux through the walls of mesenteric microvessels. We have used this model of Fu et al. (1995) to simulate our experiments (see Appendix 1). First we were able to confirm that the relation between If and t is approximately linear over the first 10 s of perfusion, even though CO does rise to 30 % of CL during this time. This means that even with instantaneous filling of the vessel with sodium fluorescein solution, PS is underestimated by 20–30 %. Second, by considering that CL rises exponentially to its final value, we have examined the effects of U upon the apparent PS by assuming that the time constant of the exponential is inversely proportional to U. Our results suggest that if the real PS remains constant, there would be no detectable difference between (dIf /dt)0 at high and low values of U. At very low values of U, If0 is lower than at high values of U and since (dIf /dt)0 is the same this should give rise to a higher estimate of PS. These findings contrast with the data in Fig. 4A and B, where values of If0 are similar at low and high values of U and (dIf /dt)0 is greater at high U than at low U. These findings indicate that errors and assumptions of the technique are not responsible for the strong positive correlation between PS and U that we have determined. They do indicate that at all values of U, estimates of PS by this method are only 75 % of their true value.
Thus the present study demonstrates that the permeability of mesenteric microvessels to sodium fluorescein, PS, like their permeability to K+ (Kajimura & Michel, 1999a, b), is linearly related to the rate at which the vessels are perfused. The changes in both PS and potassium permeability with U occur within seconds rather than minutes of changing U. Also like the permeability to K+, the flow-dependent component of PS can be inhibited by noradrenaline in frog microvessels and l-NNA in rat venules. Although we might have demonstrated further examples of pharmacological inhibition of the flow-dependent component of PS (cf. Kajimura & Michel, 1999a, b), we believe that the evidence presented already for qualitative similarities between the flow dependencies of potassium permeability and PS is strong enough for us to conclude that a common mechanism is involved. This conclusion fulfils one of the principal aims of the project.
In the next section we consider how quantitative differences between the changes in PS and K+ permeability with U may throw light on the mechanism of the flow-dependent component of permeability.
Restricted diffusion in the flow-dependent permeability pathway: evidence for a system of pores with radii of approximately 1 nm
It is instructive to consider the flow-dependent component of permeability as a population of pores of constant radii. Thus increase in U (or wall shear stress) would increase the number of open pores per unit area of microvascular wall. If these pores were the small pore system of Pappenheimer et al. (1951) their radii would lie between 4 and 5 nm (e.g. Rippe & Haraldsson, 1986, 1994; Wolf, 1994; Watson, 1995) and the increase in PS for a given increase in U should be related to the increase in permeability to K+ (PK) for the same increase in U through the equation for restricted diffusion through pores of this size (Renkin, 1954; Curry, 1984). Largely because the diffusion coefficient of K+ is almost 3 times greater than that of sodium fluorescein in free solution, PK would be expected to increase 4 to 5 times more than PS for a given increase in U if 4–5 nm pores were responsible for the flow-dependent component of permeability. When we compare the increases in PK and PS for an increase in U of 1000 μm s−1 we find that the increase in PK is 25 times greater than the increase in PS. This indicates that the pores responsible for the flow-dependent component of permeability have radii that are much less than 4 nm. In Appendix 2, we show that the relative changes of PK and PS are consistent with a diffusion pathway through pores with radii of 0.8 nm.
PK and PS were measured using very different techniques and because of the very high rate of diffusion of K+, account was taken of the rapidly rising pericapillary concentration of K+ in calculating PK. No account has been taken of the rise in pericapillary concentration of sodium fluorescein in the calculation of PS. We noted earlier that our estimates of PS are likely to be between 33 and 50 % below their true values. If the true values of PS were as much as twice those that we have estimated for rat mesenteric vessels, the relation between PS and U becomes:
If we compare values of PS based on this relation with the values of Kajimura & Michel (1999b) for PK in rat mesenteric venules at either U = 0 or U = 1000 μm s−1, the Renkin equation (Renkin, 1954) suggests the pore radius lies between 0.95 and 1.15 nm (see Appendix 2). Thus, even if we double our estimates of PS, the flow-dependent component of the permeability to K+ and sodium fluorescein still appears to involve a highly restrictive pathway with an equivalent pore radius of approximately 1.0 nm.
Adamson et al. (1994) pointed out that PS was lower than might be expected from the permeabilities of mesenteric capillaries to sucrose, Na+ and K+. From mathematical models for the diffusion of hydrophilic solutes through the intercellular clefts of mesenteric capillaries, Fu et al. (1994, 1995) argued that, in addition to the 150 nm breaks in the junctional strands, through which most fluid movements would occur (Adamson & Michel, 1993), it was necessary to postulate a population of small pores, 1.0–1.5 nm in radius, which penetrated the strands, to account for the high transport capacity for small solutes. It was argued that these pores would contribute little to the hydraulic permeability.
Fu et al. (1998) sought experimental evidence to support the predicted 1 nm pores by comparing the permeabilities to sodium fluorescein and α-lactalbumin in 26 frog mesenteric capillaries. The mean ratio of these permeabilities did not support the hypothesis of a population of 1 nm radius pores that would be available only to sodium fluorescein. While concluding that they could find no evidence for the 1 nm pores, they recognised the limitation of their experimental design, in which sodium fluorescein was the smallest solute whose permeability was investigated. When the PS data of Fu et al. (1998) are re-examined in the light of the findings in the present paper, there are consistencies with a variable population of small pores. The range of PS values which Fu et al. (1998) report from 26 frog capillaries is from 0.12 × 10⁻⁴ to 0.6 × 10⁻⁴ cm s−1. This is similar to the range of values for PS in the 20 frog capillaries shown in Fig. 7. In Fig. 7, however, a large component of the variation of PS was found to correlate with variations in U. It is reasonable to suggest that variations in U (or wall shear stress) were responsible for much of the variation in the PS values reported by Fu et al. (1998). On this hypothesis, one would expect the high values of PS to be associated with high values of U when more flow-dependent pores would be open. Since the flow-dependent pores would not be available for the permeation of α-lactalbumin (molecular radius 2.01 nm), we would predict that ratio of PS to lactalbumin permeability (Pα-l) to be greater when PS was high than when PS was low. The data appear to be consistent with this prediction. Although there is considerable scatter, when the ratio of PS:Pα-l is plotted against PS, there is a highly significant positive correlation (r = 0.535, n =26, P < 0.01). Furthermore, the values of PS reported by Fu et al. (1998) divide neatly into two populations. Where PS is greater than 0.35 × 10⁻⁴ cm s−1, the ratio of PS:Pα-l is 13.95 (s.e.m.± 1.3, n =13). For values of PS of less than 0.3 × 10⁻⁴ cm s−1, the ratio of PS:Pα-l is 7.58 (s.e.m.± 1.66, n = 13). Thus, if the variation in PS which was present in the data of Fu et al. (1998) was largely due to variations in the rate of perfusion of the vessels at the time of measurement, then this variation would be consistent with the presence of a population of 1 nm radius pores more of which were open when U was high since they were available for permeation of sodium fluorescein but unavailable for α-lactalbumin.
Predictions concerning changes in permeability to other solutes and in the hydraulic permeability of the vessel wall (Lp) with changes in U
If flow-dependent permeability is a consequence of the opening and closing of 1.0 nm radius pores, then changes in U may be expected to have little or no effect on the permeability to hydrophilic solutes with molecular radii much greater than 0.6 nm. Thus permeability to raffinose (Turner & Pallone, 1997) might be detected in mesenteric microvessels but flow-dependent permeability to serum albumin would not be seen. This second prediction is at variance with the report of Yuan et al. (1992), who described a flow-dependent component of permeability to serum albumin in isolated perfused venules from pig heart. While this evidence is contrary to the hypothesis of 1 nm pores being responsible for flow-dependent permeability, it is possible that the inconsistency arises from differences in the vessel type, species and experimental preparation. Unpublished experiments from our own laboratory have failed to find changes in the permeability coefficients to serum albumin in mesenteric microvessels with increasing U.
A second prediction of the hypothesis, that the flow-dependent component of permeability involves the opening of pores 1 nm in radius, concerns the hydraulic permeability of the vessel wall, Lp. As Pappenheimer (1953) first pointed out, pores of these dimensions make a relatively small contribution to Lp compared with their contribution to diffusional permeability. This is confirmed in the calculation given in Appendix 2. It is predicted that the relatively large changes in PK with changes in U are accompanied by changes in Lp of only a few per cent.
This conclusion is relevant to the interpretation of conflicting reports concerning the effects of shear on Lp of endothelium. While Sill et al. (1995) reported that shear increased the Lp of monolayers of cultured endothelial cells, Head et al. (1996) were unable to demonstrate significant differences in the Lp of single frog mesenteric capillaries when measured immediately after perfusion at high flows and at low flows using the red cell micro-occlusion technique (Michel et al. 1974). This was in spite of being able to demonstrate large differences in PK during the perfusions. Williams (1999), however, using the same technique for measuring Lp, reported a correlation between an initial estimate of Lp in single frog mesenteric capillaries and estimates of the wall shear stress that had existed during perfusion with the animal's own circulation before cannulation of the vessel. Once the vessel had been perfused, she was not able to demonstrate changes in Lp with changes in perfusion velocity.
There are, however, two major problems in investigating the effects of shear on Lp in single vessels. The first is that in order to estimate fluid filtration and hence Lp with the micro-occlusion technique, flow through the vessel has to be stopped. The second is the finding of Kajimura et al. (1998), confirmed in this paper, that the changes in permeability with U occur very rapidly. Nevertheless, it seemed likely that measurements of fluid filtration made with 2–4 s of occlusion after perfusion at high U would differ from those made at a similar time after perfusion at low U. Our prediction that the changes in Lp are very small offers an explanation of the negative observations. The substantial differences in PK when vessels are perfused at high and low U are accompanied by minimal changes in Lp. The basis of the correlation reported by Williams (1999) remains to be explained.
The prediction that changes in wall shear stress are accompanied by only small changes in Lp is now open to experimental investigation. In this issue of The Journal of Physiology, Neal & Bates (2002) report a development of the microperfusion technique for measuring Lp in single microvessels and this allows Lp to be measured under conditions where the wall shear stress in a vessel can be controlled. In a preliminary set of experiments, they failed to demonstrate significant changes in Lp with changes in wall shear stress, observations that are consistent with our hypothesis.
Possible physiological significance of flow-dependent permeability
The physiological relevance of the flow-dependent component of microvascular permeability depends upon the range of flow or shear stress in vivo being comparable with the range over which we have been able to demonstrate changes in PS and PK with U under experimental conditions. We have investigated the changes in PS over the range of 230–10 000 μm s−1. In the majority of vessels, significant changes in PS were seen when U was raised between 500 and 3000 μm s−1. This narrower range is comparable with basal values of red cell velocity in 30 μm diameter venules of both rat and cat mesenteries. Pries et al. (1995) reported mean velocities in rat venules as 1070 μm s−1 with a coefficient of variation of 650 μm s−1. In individual vessels, velocity was as high as 5000 μm s−1. A similar mean red cell velocity was found in rat mesenteric capillaries. These results are remarkably like those reported some 20 years earlier by Lipowsky & Zweifach (1974) for red cell velocities in the microcirculation of cat mesentery.
The endothelium presumably detects changes in perfusion velocity by changes in the wall shear stress or shear rate. If shear stress is the signal, then the changes in perfusion velocity necessary to produce a given change in wall shear stress will be considerably less (one-third to one-fifth) in a vessel perfused with blood than in the same vessel perfused with a cell-free solution. Assuming Poiseuille flow in our experiments, wall shear stress ranged from 0.03 (U ≈ 300 μm s−1) to 1.0 N m−2 (U ≈ 10 000 μm s−1). Pries et al. (2001) report that in the rat mesentery, wall shear stress in venules may range from 0.1 to over 2 N m−2 under basal conditions. In capillaries the range is even greater, with wall shear stress in some vessels rising to 10 N m−2. Whether the signal to the endothelium is detected from changes in shear stress or changes in shear rate, it would seem that in the intact circulation where the microcirculation is perfused with blood, changes of permeability to small hydrophilic solutes should occur with physiological variations in U.
If increases in U have minimal effects on Lp and no effects on the permeability to macromolecules, increased perfusion velocity should enhance exchange of the smallest solutes without compromising fluid balance between the circulating blood and the tissues. Because the changes in permeability occur within seconds of the changes in perfusion velocity, the increased permeability should have an almost immediate effect upon microvascular exchange. The rapid exchange of some of the small solutes, such as K+, glucose and lactic acid, is of considerable importance in many microvascular beds. An obvious example is in skeletal muscle capillaries in exercise. If flow-dependent permeability is a property of these vessels, the phenomenon could contribute in a major way to the efficiency of microvascular exchange. Indirect evidence that this might be so is present in data of Watson (1995), who found that the apparent permeability of perfused cat muscle capillaries to Na+ and urea continued to rise with increasing flow rates up to 100 ml min−1 (100 g tissue)−1. These are the highest rates of perfusion under which microvascular permeability to hydrophilic solutes has been measured. Flow-dependent permeability of the muscle capillaries to Na+ and urea offers a possible explanation of Watson's observation.
Because clear predictions can be made from the hypothesis that the opening and closing of a population of 1 nm radius pores is responsible for the flow-dependent component of permeability, it is important that these should be tested experimentally before addressing the more fundamental questions of the ultrastructural basis of the small pores and the nature of the endothelial cell's flow sensing mechanism.
Conclusion
The permeability of mesenteric microvessels to sodium fluorescein, PS, increases with the velocity with which the vessel is perfused. Like the flow-dependent component of permeability to K+ in these vessels, PK, the flow dependence of PS can be reversibly inhibited by l-NNA in the rat and by noradrenaline in the frog. The relative magnitude of the increases in PS and PK induced by changes in flow are consistent with pores, of 1 nm radius, opening as flow increases and closing as flow is reduced.
Acknowledgments
D. M. was supported on an EU programme for the training and mobility of research workers (EU-FMRX-CT98-0219) and the experimental work in C. C. M.‘s laboratory was supported by a programme grant from the Wellcome Trust (038904/Z/93/1.27).
Appendix 1
Use of the model of Fu et al. (1995) to investigate possible errors in estimation of PS
Fu et al. (1995) used their diffusion wake model to simulate the changes in pericapillary concentration (CO) observed by Adamson et al. (1994) when a single mesenteric capillary was perfused with this tracer. The model predicted that CO was related to the luminal concentration (CL) through the relation:
| (A1) |
where t is time, ω is a function of the dimensions of the intercellular clefts in the capillary wall and the diffusion coefficients of sodium fluorescein in these clefts and in the interstitial space and erfc is the complementary error function. Fu et al. (1995) were able to show that when the ratio of the diffusion coefficients for sodium fluorescein in the interstitium and in the clefts was 0.3, ω had a value of 1.2 and eqn (A1) predicted the changes in CO observed by Adamson et al. (1994) over the first 60 s of perfusion.
Fu et al. (1995) assumed that CL rose instantaneously to its final value as the vessel was perfused. We have used eqn (A1) to examine the changes in CO when CL rises exponentially to its final value, CL∞, i.e.
| (A2) |
The time constant, τ, was assumed to be proportional to the transit time of the sodium fluorescein solution through the ROI that was used to estimate PS. By setting the amount of solute within the vessel proportional to CL and the amount accumulating in the tissues proportional to ∫t0(CL - CO)dt, curves similar to those of If against time were constructed using Mathcad 2000 software. Figure A1 shows the results of simulations where τ was taken as 0.133 and 1.3 s, equivalent to U = 246 and 2400 μm s−1 if the ROI extended 320 μm along the length of the vessel. It is seen that there is no difference in the rates of increase in I(t) between 3 and 10 s after the initial rise in CL. If these were records from a vessel perfused at high and at low U, we would calculate approximately the same value for PS. As τ is increased further, IO starts to fall and a higher value of PS would be estimated.
Figure A1. Simulations of the increase in fluorescence over and around a capillary with rapid and slow filling of the vessel.
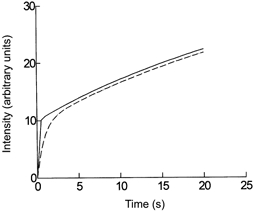
The concentration of fluorescein within the capillary was assumed to rise exponentially to a constant value at a rate proportional to the perfusion velocity. The accumulation of fluorescein in the surrounding tissue was simulated using the model of Fu et al. (1995) assuming a constant permeability. It is seen that after the first 2–3 s, there is little difference in the rate of accumulation in the tissue between the records where the rate of filling is rapid (U = 2400 μms−1, continuous curve) and where the rate of filling is slow (U =240 μm s−1, dashed curve).
This simulation contrasts with data shown in Fig. 4, where IO is similar at high and low U and dIf /dt is greater at high U than at low U.
Appendix 2
Estimates of the radii of pores that are opened and closed by changes in U
Since both PK and PS increase linearly with U, it is proposed that increasing U increases shear stress at the microvascular wall and increases the number of open pores which are pathways for K+ and sodium fluorescein through the wall. If the pores are of equal size, the increase in PK (ΔPK) for a given increase in U should be linearly related to the increase in PS (ΔPS) for the same increment in U. If the pore radius, R, is very large compared with the Stokes- Einstein radii of K+ (aK) and sodium fluorescein (aS), ΔPK and ΔPS are related to each other through their free diffusion coefficients (DK and DS) so that the ratio of ΔPK/DK to ΔPS/DS should be close to unity. If, however, R is comparable with aK and aS, then the ratio of ΔPK/DK to ΔPS/DS is greater than one, indicating restricted diffusion of the solutes in the pores. The degree of restriction can be calculated from R, aK and aS through the Renkin equation (Renkin, 1954):
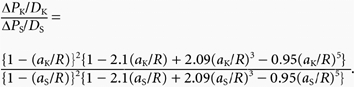 |
(A3) |
Thus if ΔPK/DK, ΔPS/DS, aK and aS are known, the value of R consistent with the degree of restriction to diffusion can be determined. For an increase in U of 1000 μm s−1 in rat venules, ΔPK = 5.3 × 10⁻⁴ cm s−1 and ΔPS = 0.2 × 10⁻⁴ cm s−1. Taking DK as 2.47 × 10⁻⁵ cm2 s−1 and DS as 0.833 × 10⁻⁵ cm2 s−1 at 37 °C, (ΔPK/DK)/(ΔPS/DS) = 8.94. With aK = 0.23 nm and aS = 0.45 nm, the value of R consistent with this degree of restricted diffusion is 0.8 nm.
If PS and ΔPS have been underestimated and the true value of ΔPS is twice the value used above (i.e. 0.4 × 10⁻⁴ cm s−1), then (ΔPK/ΔPS) = 4.47 and the value of R consistent with this degree of restriction is 1.0 nm.
Thus, even allowing for considerable error in the estimation of PS, the value of R consistent with the degree of restriction in the flow-dependent pathway is of the order of 1 nm.
Contribution of flow-dependent pores of R = 0.8 nm to the hydraulic permeability (Lp)
If the pores, which are opened by increases in U, have radii of 1 nm, their effect on the hydraulic permeability of the vessel wall (Lp) can be calculated from the changes in PK with U.
For an increase in U of 1000 μm s−1,
| (A4) |
where
and (Ap/Δx) is the ratio of the total cross-sectional area of the pores to the path length through them.
If R = 0.8 nm, (D‘/DK) = 0.225 and since DK = 2.476 × 10⁻⁵ cm2 s−1, Ap/Δx = 95.15 cm−1. The increase in Lp (ΔLp) can then be calculated from Poiseuille's law, i.e. ΔLp = (Ap/Δx)R2/8η, where η is the viscosity of the fluid in the pores.
With Ap/Δx = 95.15 cm−1 and η = 0.692 × 10⁻² dyn s cm−2, ΔLp = 1.08 × 10⁻⁸ cm s−1 cmH2O−1 which is just less than 4.5 % of the mean value of Lp (2.43 × 10⁻⁷ cm s−1 cmH2O−1) for rat venules reported by Kendall & Michel (1995).
References
- Adamson RH, Lenz JF, Curry FE. Quantitative laser scanning confocal microscopy on single capillaries: permeability measurement. Microcirculation. 1994;1:251–265. doi: 10.3109/10739689409146752. [DOI] [PubMed] [Google Scholar]
- Adamson RH, Michel CC. Pathways through the intercellular clefts of frog mesenteric capillaries. Journal of Physiology. 1993;466:303–327. [PMC free article] [PubMed] [Google Scholar]
- Bailey NTJ. Statistical Methods in Biology. London, UK: English Universities Press; 1959. pp. 98–99. [Google Scholar]
- Curry FE. Mechanics and thermodynamics of transcapillary exchange. In: Renkin EM, Michel CC, editors. Handbook of Physiology, section 2, Microcirculation. IV. Washington, DC, USA: American Physiological Society; 1984. pp. 309–394. [Google Scholar]
- Davis MJ, Gore RW. Double-barrel pipette system for micro-injection. American Journal of Physiology. 1987;253:H965–967. doi: 10.1152/ajpheart.1987.253.4.H965. [DOI] [PubMed] [Google Scholar]
- Fu BM, Adamson RH, Curry FE. Test of a two-pathway model for small-solute exchange across the capillary wall. American Journal of Physiology. 1998;274:H2062–2073. doi: 10.1152/ajpheart.1998.274.6.H2062. [DOI] [PubMed] [Google Scholar]
- Fu BM, Curry FE, Weinbaum S. A diffusion wake model for tracer ultrastructure-permeability studies in microvessels. American Journal of Physiology. 1995;269:H2124–2140. doi: 10.1152/ajpheart.1995.269.6.H2124. [DOI] [PubMed] [Google Scholar]
- Fu BM, Tsay R, Curry FE, Weinbaum S. A junction-orifice-fiber entrance layer model for capillary permeability: application to frog mesenteric capillaries. Journal of Biomechanical Engineering. 1994;116:502–513. doi: 10.1115/1.2895802. [DOI] [PubMed] [Google Scholar]
- Head SD, Kajimura M, Michel CC. Effects of flow on potassium and fluid permeability of single microvessels. International Journal of Microcirculation: Clinical and Experimental. 1996;16(suppl. 1):216. [Google Scholar]
- Huxley VH, Curry FE, Adamson RH. Quantitative fluorescence microscopy on single capillaries: α-lactalbumin transport. American Journal of Physiology. 1987;252:H188–197. doi: 10.1152/ajpheart.1987.252.1.H188. [DOI] [PubMed] [Google Scholar]
- Kajimura M, Head SD, Michel CC. The effects of flow on the transport of potassium ions through the walls of single perfused frog mesenteric capillaries. Journal of Physiology. 1998;511:707–718. doi: 10.1111/j.1469-7793.1998.707bg.x. [DOI] [PMC free article] [PubMed] [Google Scholar]
- Kajimura M, Michel CC. Inhibition of effects of flow on potassium permeability in single perfused frog mesenteric capillaries. Journal of Physiology. 1999a;516:201–207. doi: 10.1111/j.1469-7793.1999.201aa.x. [DOI] [PMC free article] [PubMed] [Google Scholar]
- Kajimura M, Michel CC. Flow modulates the transport of K+ through the walls of single perfused mesenteric venules in anaesthetised rats. Journal of Physiology. 1999b;521:665–677. doi: 10.1111/j.1469-7793.1999.00665.x. [DOI] [PMC free article] [PubMed] [Google Scholar]
- Kendall S, Michel CC. The measurement of permeability in single rat venules using the red cell microperfusion technique. Experimental Physiology. 1995;80:359–372. doi: 10.1113/expphysiol.1995.sp003853. [DOI] [PubMed] [Google Scholar]
- Lipowsky HH, Zweifach BW. Network analysis of microcirculation of cat mesentery. Microvascular Research. 1974;7:73–83. doi: 10.1016/0026-2862(74)90038-7. [DOI] [PubMed] [Google Scholar]
- McKay MK, Huxley VH. ANP increases capillary permeability to protein independent of perfusate protein composition. American Journal of Physiology. 1995;268:H1139–1148. doi: 10.1152/ajpheart.1995.268.3.H1139. [DOI] [PubMed] [Google Scholar]
- Michel CC, Mason JC, Curry FE, Tooke JE, Hunter PJ. A development of the Landis technique for measuring the filtration coefficient of individual capillaries in the frog mesentery. Quarterly Journal of Experimental Physiology and Cognate Medical Sciences. 1974;59:283–309. doi: 10.1113/expphysiol.1974.sp002275. [DOI] [PubMed] [Google Scholar]
- Montermini D, Winlove CP, Michel CC. The effects of flow on the transport of sodium fluorescein through the walls of single perfused frog mesenteric capillaries. Journal of Vascular Research. 2000;37(suppl. 1):28. [Google Scholar]
- Neal CR, Bates DO. Measurement of hydraulic conductivity of single perfused Rana mesenteric microvessels between periods of controlled shear stress. Journal of Physiology. 2002;543:947–957. doi: 10.1113/jphysiol.2002.026369. [DOI] [PMC free article] [PubMed] [Google Scholar]
- Pappenheimer JR. Passage of molecules through capillary walls. Physiological Reviews. 1953;33:387–423. doi: 10.1152/physrev.1953.33.3.387. [DOI] [PubMed] [Google Scholar]
- Pappenheimer JR, Renkin EM, Borrero LM. Filtration, diffusion and molecular sieving through peripheral capillary membranes. A contribution to the pore theory of capillary permeability. American Journal of Physiology. 1951;167:13–46. doi: 10.1152/ajplegacy.1951.167.1.13. [DOI] [PubMed] [Google Scholar]
- Pries AR, Reglin B, Secomb TW. Structural adaptation of microvascular networks: functional roles of adaptive responses. American Journal of Physiology. 2001;281:H1015–1025. doi: 10.1152/ajpheart.2001.281.3.H1015. [DOI] [PubMed] [Google Scholar]
- Pries AR, Secomb TW, Gaehtgens P. Structure and hemodynamics of microvascular networks: heterogeneity and correlations. American Journal of Physiology. 1995;269:H1713–1722. doi: 10.1152/ajpheart.1995.269.5.H1713. [DOI] [PubMed] [Google Scholar]
- Renkin EM. Filtration, diffusion and molecular sieving through porous, cellular membranes. Journal of General Physiology. 1954;38:225–243. [PMC free article] [PubMed] [Google Scholar]
- Rippe B, Haraldsson B. Capillary permeability in rat hind quarters as determined by estimations of capillary reflection coefficients. Acta Physiologica Scandinavica. 1986;127:289–303. doi: 10.1111/j.1748-1716.1986.tb07908.x. [DOI] [PubMed] [Google Scholar]
- Rippe B, Haraldsson B. Transport of macromolecules across microvascular walls: two pore theory. Physiological Reviews. 1994;74:163–219. doi: 10.1152/physrev.1994.74.1.163. [DOI] [PubMed] [Google Scholar]
- Sill HW, Chang YS, Artman JR, Frangos JA, Hollins TM, Tarbell JM. Shear stress increases hydraulic conductivity of cultured endothelial monolayers. American Journal of Physiology. 1995;268:H535–543. doi: 10.1152/ajpheart.1995.268.2.H535. [DOI] [PubMed] [Google Scholar]
- Turner MR, Pallone T. Hydraulic and diffusional permeabilities of isolated outer medullary descending vasa recta from the rat. American Journal of Physiology. 1997;272:H392–400. doi: 10.1152/ajpheart.1997.272.1.H392. [DOI] [PubMed] [Google Scholar]
- Watson PD. Permeability of cat skeletal muscle capillaries to small solutes. American Journal of Physiology. 1995;268:H184–193. doi: 10.1152/ajpheart.1995.268.1.H184. [DOI] [PubMed] [Google Scholar]
- Weatherburn CE. A First Course in Mathematical Statistics. Cambridge, UK: Cambridge University Press; 1946. pp. 226–236. [Google Scholar]
- Williams DA. Network assessment of capillary hydraulic conductivity after abrupt changes in fluid shear stress. Microvascular Research. 1999;57:107–117. doi: 10.1006/mvre.1998.2128. [DOI] [PubMed] [Google Scholar]
- Wolf MB. Identification of microvascular transport pathways in skeletal muscle. American Journal of Physiology. 1994;267:H383–399. doi: 10.1152/ajpheart.1994.267.1.H383. [DOI] [PubMed] [Google Scholar]
- Yuan Y, Granger HJ, Zawieja DC, Chilian WM. Flow modulates coronary venular permeability by a nitric oxide related mechanism. American Journal of Physiology. 1992;263:H641–646. doi: 10.1152/ajpheart.1992.263.2.H641. [DOI] [PubMed] [Google Scholar]