

Abstract
We studied granule cells (GCs) in the intact frog olfactory bulb (OB) by combining whole-cell recordings and functional two-photon Ca2+ imaging in an in vitro nose-brain preparation. GCs are local interneurones that shape OB output via distributed dendrodendritic inhibition of OB projection neurones, the mitral-tufted cells (MTCs). In contrast to MTCs, GCs exhibited a Ca2+-activated non-specific cation conductance (ICAN) that could be evoked through strong synaptic stimulation or suprathreshold current injection. Photolysis of the caged Ca2+ chelator o-nitrophenol-EGTA resulted in activation of an inward current with a reversal potential within the range -20 to +10 mV. ICAN in GCs was suppressed by the intracellular Ca2+ chelator BAPTA (0.5–5.0 mM), but not by EGTA (up to 5 mM). The current persisted in whole-cell recordings for up to 1.5 h post-breakthrough, was observed during perforated-patch recordings and was independent of ionotropic glutamate and GABAA receptor activity. In current-clamp mode, GC responses to synaptic stimulation consisted of an initial AMPA-mediated conductance followed by a late-phase APV-sensitive plateau (100–500 ms). BAPTA-mediated suppression of ICAN resulted in a selective reduction of the late component of the evoked synaptic potential, consistent with a positive feedback relationship between NMDA receptor (NMDAR) current and ICAN. ICAN requires Ca2+ influx either through voltage-gated Ca2+ channels or possibly NMDARs, both of which have a high threshold for activation in GCs, predicting a functional role for this current in the selective enhancement of strong synaptic inputs to GCs.
Vertebrates initially process sensory information from peripheral odourant receptors within the olfactory bulb (OB). The anatomy and neurochemistry of the OB are well defined in mammals and exhibit considerable similarity across vertebrate species (Halasz & Shepherd, 1983; Scalia et al. 1991; Shipley & Ennis, 1996; Shepherd, 1998). OB output to other cortical regions is shaped by two distinct populations of local interneurones, periglomerular cells (PGs) in the superficial glomerular layer and granule cells (GCs) deeper in the external plexiform layer (EPL). GCs affect OB output via reciprocal dendrodendritic synapses along secondary dendrites of the projection neurones, the mitral and tufted cells (MTCs). These dendrodendritic interactions control MTC firing through feedback and feedforward inhibitory interactions (Rall et al. 1966; Price & Powell, 1970; Nicoll, 1971; Jahr & Nicoll, 1980, 1982; Woolf et al. 1991). In addition, these synapses are thought to provide the circuitry for generating stimulus-induced oscillations (Rall & Shepherd, 1968; Freeman, 1972; Yokoi et al. 1995; Shepherd, 1998; but see Desmaisons et al. 1999).
Studies of the electrophysiological properties of GCs are generally lacking in the intact OB, despite their importance in shaping MTC firing patterns in response to odour stimulation (but see Wellis & Scott, 1990; Wellis & Kauer, 1994). This is predominately due to their small size (≈10 μm) and location deep below the surface of the bulb (≈500 μm). We used blind, whole-cell, patch-clamp recordings of GCs in the intact OB of an in vitro frog nose-brain preparation (Delaney & Hall, 1996). This preparation exhibits spontaneous and odour-evoked activity similar to that observed in vivo. Our data demonstrate the presence of a Ca2+-activated non-specific cation (CAN) conductance in GCs that significantly affects their response to excitatory synaptic inputs from MTCs.
CAN currents (ICAN) have been described in numerous cell types including neurones (reviewed in Partridge et al. 1994). In neurones, ICAN produces a depolarizing current in response to increased cytoplasmic [Ca2+]. Because they typically don't undergo rapid inactivation, CAN currents are known to underlie such phenomena as bursting (Kramer & Zucker, 1985; Swandulla & Lux, 1985), slow after-depolarizations (Hasuo et al. 1990) and plateau potentials (Fraser & MacVicar, 1996; Rekling & Feldman, 1997; Morisset & Nagy, 1999; Di Prisco et al. 2000). In addition, they can be modulated through calcium-dependent mechanisms (Partridge & Valenzuela, 1999) and driven by Ca2+ influx via NMDA receptor (NMDAR) channels (Di Prisco et al. 2000). Our experiments indicate that ICAN in OB GCs enhances the late-phase, NMDAR-mediated component of excitatory synaptic potentials. The positive reciprocal feedback between NMDAR-mediated Ca2+ influx and ICAN in GCs results in selective enhancement of synaptic depolarizations that are large enough to generate a sustained Ca2+ influx while having no effect on smaller-amplitude excitatory synaptic inputs.
METHODS
Isolation of the frog nose and brain
All animals used in this study were cared for in accordance with the recommendations of the Canadian Council on Animal Care and the regulations and policies of the Simon Fraser University Animal Care Facility and the University Animal Care Committee.
Adult, male frogs (Rana pipiens) were maintained on a 12 h alternating light-dark cycle at 10 °C and fed small insects once per week. They were transferred to room temperature to acclimate for at least 3 days prior to experiments and fed every 2 days. For a detailed description of the procedure for dissection of the nose-brain preparation see Delaney & Hall (1996). Briefly, animals were cryoanaesthetized for approximately 30 min, until they no longer responded to foot pinch with a withdrawal reflex, and then rapidly decapitated. Lidocaine paste applied to the skin of the back of the head was used as a local anaesthetic. The preparation consisted of the intact OBs and telencephalic structures caudal to the level of the optic chiasm, attached to the nose via the olfactory nerves (ONs). The recording chamber consisted of two compartments that were separated by a Vaseline wall: one containing the nose connected to the brain by the ONs which passed through a slit in the wall to a second compartment containing the intact bilateral OBs and olfactory cortex. In many experiments the brain was bisected from the level of the optic chiasm, medially through telencephalic structures and the interbulbar adhesion to improve access for whole-cell patch-clamp electrodes. Each hemisphere of the brain was pinned with the medial wall facing upwards with cactus spines. Using oblique illumination, the first ventricle was visualized beneath the brain surface with a stereomicroscope and used as a landmark for electrode placement. For some experiments the OB was isolated by removing structures about 1 mm caudal of the OB. Experiments were performed at ambient temperature (20–24 °C) and the preparation was continuously perfused with oxygenated (95 % O2-5 % CO2), bicarbonate-buffered Ringer solution at a rate of 1–2 ml min−1.
Whole-cell patch recordings
Patch pipettes were pulled on a horizontal micropipette puller (Model P-97 Flaming Brown, Sutter Instruments, Novato, CA, USA) from 1.5 mm diameter filamented borosilicate glass pipettes (PG150T-10; Warner Instrument Corp., Hamden, CT, USA). Patch pipettes were pulled to resistances of 7–13 MΩ. Access resistance ranged from 15 to 70 MΩ. Current- and voltage-clamp recordings were made using commercial patch-clamp amplifiers (models 501 and 500, Warner Instrument Corp., or Axopatch 200B, Axon Instruments, Foster City, CA, USA).
Solutions
Standard Ringer solution contained (mm): NaCl 72, NaHCO3 26, NaH2PO4 2.5, Na2HPO4 0.5, MgSO4 1.5, KCl 2.0, glucose 10 and CaCl2 2. The solution was bubbled with 95 % O2-5 % CO2 during perfusion of the brain. A dissection saline was used containing (mm): NaCl 93, NaHCO3 5, NaH2PO4 0, Na2HPO4 0, MgSO4 3, CaCl2 1 and Hepes buffer 5, pH 7.4. Standard intracellular patch-pipette solution contained (mm): potassium gluconate 110, NaCl 5, MgCl2 2, CaCl2 0.2, EGTA 1, d-glucose 10, Hepes 5, ATP 0.1, glutathione 0.5 and GTP 0.3 at pH 7.35. Modified solutions for voltage-clamp analysis are specified where the data are presented and included addition of lidocaine n-ethyl iodide (QX314; at 1 or 2 mm) for Na+ channel blockade, and TEA (5 mm) + CsMeSO3 (10 mm) or replacement of 50 mm potassium gluconate with CsMeSO3 for K+ channel blockade. For experiments requiring increased Ca2+ buffer capacity, BAPTA was added at concentrations ranging from 500 μM to 5 mm.
Perforated-patch recordings
Amphotericin B solution in DMSO, aliquoted and frozen at 30 mg ml−1, was diluted daily in molar equivalent potassium gluconate intracellular solution to a final concentration of 120 μg ml−1. Solutions were sonicated frequently and were not used for more than 2 h. Electrode tips were filled with amphotericin-free solution using negative pressure and then backfilled with amphotericin B solution. Access resistances were monitored and were comparable to values recorded in whole-cell configuration (20–30 MΩ) within 20 min after formation of a gigaohm seal. TEA at 5 mm was added to the solution to control for spontaneous breakthrough.
Drugs
Aliquots of 20 mm 6-cyano-7-nitroquinoxaline-2,3-dione (CNQX) in water, 50 mm d-2-amino-5-phosphopentanoic acid (APV) in 100 mm NaOH and 5 mm bicuculline methiodide in water were stored at -15 °C, thawed, sonicated and diluted (× 1000) in Ringer solution as needed. CNQX and APV were obtained from Precision Biochemicals (North Vancouver, Canada) and bicuculline was obtained from Sigma.
Caged Ca2+ photolysis
The caged Ca2+ chelator o-nitrophenol-EGTA (NP-EGTA; Molecular Probes, Eugene, OR, USA) was used at concentrations ranging from 1.4 to 2 mm in a modified whole-cell solution in the absence of additional Ca2+ buffer. Photolysis was achieved using ultraviolet light (wavelength 350 ± 6 nm) from a 75 W xenon arc lamp that was controlled by a switching monochrometer (Polychrome II, T.I.L.L. Photonics, Planegg, Germany) through a 20 × quartz, water-immersion lens (NA 0.5; Olympus, Melville, NY, USA). Absorbance spectroscopy was used to confirm the concentration and sensitivity to photolysis of stock solutions by applying the following equation: A = ε × pathlength × [NP-EGTA], where A is the absorbance, and ε (m−1 × cm−1) for NP-EGTA (at 260 nm) = 5.52 × 10³ (Ellis-Davies & Kaplan, 1994) for a 1 cm pathlength.
Neuronal labelling
Neurobiotin (Vector Laboratories, Burlingame, CA, USA) was added to the intracellular pipette solution (0.5 % w/v) and cells were filled by passive diffusion. Brain tissue was fixed overnight at 6 °C in 4 % paraformaldehyde solution containing 0.1 % glutaraldehyde and then cryoprotected by immersion in phosphate buffer solution (100 mm) containing 30 % (w/v) sucrose. Sections were sliced at between 50 and 100 μm at ≈-10 °C on a freezing microtome. Labelling of filled neurones was accomplished in floating sections using a standard ABC kit (Vector Laboratories) through a horseradish-peroxidase-mediated reaction of diaminobenzidine (0.25 mg ml−1; Sigma). Sections were mounted on gelatin-coated coverslips and dehydrated in ethanol, then cleared and coverslipped in methyl salicylate (Sigma). Digital images of stained neurones were acquired with bright-field illumination, and reconstructed by aligning and overlapping images in Adobe Photoshop.
Frog OB anatomy
The anatomical features of the frog OB were consistent with those described in previous studies (Scalia et al. 1991). The boundary between the GC and MTC somata layers is less distinct in frogs than in mammals (Scalia et al. 1991). In horizontal sections, some GC somata could be found interspersed with MTCs in the EPL. However, GCs were concentrated caudally adjacent to the ventricle, while MTC somata predominated in the rostral half of the OB towards the ON where olfactory glomeruli were most abundant. The high density of GC somata adjacent to the first ventricle was easily visualized with transmitted light and a stereomicroscope. This served as a landmark for electrode placement. Intracellular staining with neurobiotin showed that GC somata were slightly smaller and more rounded than those of MTCs. A subset of imaged neurones was outlined by hand and converted to a digital binary layer. Measurements of membrane area and shape were made using NIH Image particle analysis macros. The average cross-sectional area of GC somata was 46 ± 12 μm2 (mean ± s.d.; n = 10) versus 114 ± 23 μm2 for MTC (mean ± s.d.; n = 10). The average ratio of major/minor elliptical axes was 1.4 ± 0.13 for GCs compared to 1.7 ± 0.26 for MTCs.
Ca2+ imaging: two-photon scanning laser microscopy
Calcium Green-1 or Oregon Green-1 BAPTA 488 (Molecular Probes) was added to the intracellular solution at concentrations ranging from 100 to 450 μM. The intracellular EGTA concentration was 200 μM. Dyes were excited with femtosecond pulsed light at wavelengths between 810 and 830 nm delivered by a titanium-doped sapphire (Ti3+:Al2O3) laser (Mira 900S; Coherent Laser, Santa Clara, CA, USA) pumped with a Nd:YVO4 laser (5 W Verdi, Coherent Laser). Excitation light delivered to the preparation ranged in power from 300 to 800 mW at the output of the laser, corresponding to approximately 75–200 mW at the back of the objective lens. Images were obtained using water-immersion lenses (Leica 40 ×, UV-10, 0.8 NA; Olympus LUMPlanFL, 60 ×, 0.9 NA). Fluorescence signals were acquired using a modified BioRad MRC 600 scan head (BioRad; Hercules, CA, USA) attached to an Olympus BX50 WI microscope and analysed off-line using NIH Image software and custom routines that were implemented with Igor Pro (Oswego, OR, USA). Signals were collected with an external non-descanned detector employing a photomultiplier tube (model HC125-02, Hamamatsu, Bridgewater, NJ, USA). Electrophysiological data were acquired simultaneously using an Axopatch 200B amplifier and Clampex 8.0 (Axon Instruments). Electrophysiological data were analysed using rountines in Igor Pro (Wavemetrics), including one-way ANOVA for statistical analysis.
RESULTS
Whole-cell recordings of GCs
The thickness of the intact OB required us to adopt procedures other than direct visualization of cells with infrared differential interference contrast microscopy to confirm cellular identities determined through electrophysiological analysis. We used multi-photon Ca2+ imaging to examine the anatomy of neurones during physiological recording in more than 20 experiments and neurobiotin labelling in seven experiments to confirm the accuracy of our electrophysiological identification criteria. Neurobiotin-stained GCs had diffusely branching dendritic arborizations that spread predominantly in a rostral direction in horizontal sections (Fig. 1Ai). GC dendrites were covered in gemmules as well as long-necked spines (up to ≈10 μm). In contrast, MTCs were characterized by aspiny basolateral dendrites that projected laterally or slightly towards the pial surface and aspiny apical dendrites that ramified in distinct glomerular tufts in the superficial glomerular layer (Fig. 1Bi, inset), as described previously in frog (Jiang & Holley, 1992). In contrast to mammals, but similar to reports in turtle (Mori & Takagi, 1978; Berkowicz & Trombley, 2000), frog MTC apical dendrites were seen in several instances to project to more than one glomerulus. MTCs were bipolar with basolateral and apical dendrites often branching from the same initial projection while their axon extended towards the olfactory cortex via the lateral and medial olfactory tracts. Both MTC and GC branching patterns were extremely diffuse: GC dendrites projected up to 600 μm while MTC dendritic projections often spanned nearly the width of the OB (≈1 mm).
Figure 1. Anatomical and electrophysiological properties of recorded neurones.
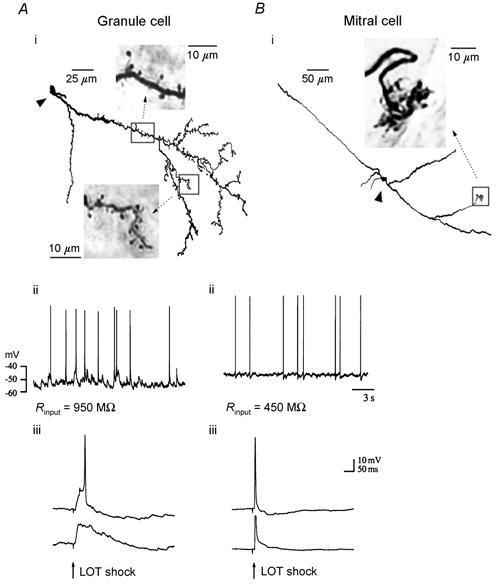
OB neurones were distinguished by their anatomical and electrophysiological properties in blind whole-cell recordings. Ai and Bi, reconstructions of neurobiotin-labelled cells from horizontal OB sections (300 μm). GC interneurones (Ai) were characterized by widely branching dendrites projecting rostrally in horizontal sections. GC dendrites were covered in gemmules and long-necked spines, up to 10 μm in length (insets - photomicrographs of the regions delineated by the boxes; arrowheads mark cell somata). MTC dendrites, by contrast, were aspiny. In the MTC shown (Bi) an apical dendrite can be followed rostrally, where it ramifies in an olfactory glomerulus (inset). Aii and Bii, traces of spontaneous synaptic activity from the cells in Ai and Bi show the characteristic differences between GC and MTC electrophysiology at rest. In the nose-brain preparation, large (> 5 mV) spontaneous depolarizing potentials in GCs occurred at rates of ≈5 Hz, while spontaneous synaptic activity was less prominent in MTCs. Rinput, input resistance. Aiii and Biii, lateral olfactory tract (LOT) stimulation evoked an antidromic AP in MTCs, which, in turn, synaptically activated the GC population. The antidromic AP in MTCs rose straight from baseline. Hyperpolarization (lower trace) did not block the AP but reversed the synaptically mediated after-hyperpolarization (the AP is truncated in the lower trace). In GCs, LOT stimulation produced an EPSP that increased at more hyperpolarized levels, while the AP was blocked.
GCs could also be distinguished from MTCs on the basis of their electrophysiological properties. Input impedance values were approximately twofold higher for GCs (860 ± 225 MΩ compared to 480 ± 169 MΩ; means ± s.d.; n = 6). Resting membrane potential (RMP) values were similar for GCs (-55 ± 9.8 mV; mean ± s.d.; n = 14) and MTCs (-53 ± 5.0 mV; mean ± s.d.; n = 12) in the intact preparation. Another distinguishing feature was the frequency of subthreshold synaptic events, which was considerably higher in GCs than MTCs, as reported previously in the intact rat OB (Wellis & Scott, 1990). Spontaneous activity in current-clamp recordings of GCs was composed of frequent EPSPs (≈5 Hz for EPSPs > 5 mV), including apparently unitary events up to 10 mV in amplitude, while non-stimulated MTCs revealed few excitatory synaptic potentials and infrequent spontaneous APs at < 1 Hz (Fig. 1Aii and Bii; also cf. traces in Fig. 2Ai).
Figure 2. Characterization of unique GC responses to direct current injection: ramping depolarization and non-stationary spike firing.
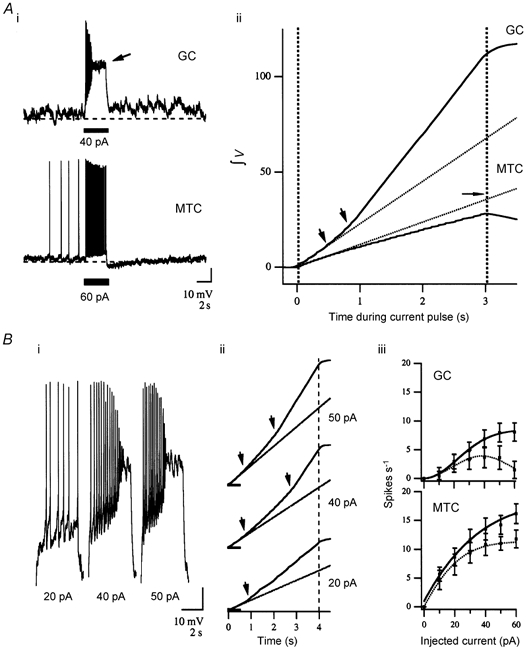
Ai, voltage responses to suprathreshold current injection (at bar) in a GC and MTC from the same brain, demonstrating the qualitative differences in their response parameters. Sustained suprathreshold depolarization of GCs resulted in a slowly activating ‘ramping’ depolarization and superimposed APs, increasing in frequency. Prolonging this depolarization drove GCs to an inactivated plateau near -20 mV (arrow). All tested GCs responded in this manner, although not all exhibited an obvious after-depolarization (see text). MTC responses were consistent over the entire range of injected currents, responding with step depolarization and a superimposed train of APs. Spike accommodation in MTCs was evident. Aii, differences in depolarizing responses were quantified for the traces in Ai. Cumulative integrated voltage (in mV s) during the pulse is plotted against time (continuous lines) compared to a linear extrapolation of the expected integral based upon the first 500 ms of the response (dotted lines). Integrated MTC depolarizations were linear but fell slightly short of the extrapolation. This can be accounted for by the area lost due to declining spike frequency, an estimation of which is marked by the horizontal arrow. Integrations of GC responses were distinctly non-linear with two inflection points (arrowheads). The first corresponded to initiation of ramping depolarization early in the pulse, while the second corresponded to a rapid jump to inactivated plateau. Bi, responses are expanded for a range of current amplitudes in another GC. Evident is the underlying ramping depolarization, increased firing frequency and quick step to inactivated plateau. Bii, the direct relationship between current amplitude and ramp depolarization, as well as the inverse relationship between amplitude of injected current and time to inactivation are evident in the integration records (arrowheads). Biii, ramping depolarization in GCs resulted in distinct spike train parameters compared to MTCs. AP counts are shown for the 1st (continuous lines) and 3rd (dotted lines) seconds of the response in relation to injected current. MTCs showed a non-linear rise to maximum due to increased firing in conjunction with increasing accommodation. The GC plot is sigmoidal for the 1st second data due to the early increase in spike frequency. However, spike number in GCs declined in the 3rd second of the pulse and eventually even in the 1st second for large injected currents as the delay to onset of the inactivated plateau decreases.
Antidromic monosynaptic activation of the OB, via lateral olfactory tract (LOT) stimulation, evoked distinct responses in MTCs and GCs (Fig. 1Aiii and Biii), as expected from the neuronal connectivity of the OB and previous observations (Mori & Takagi, 1978; Mori & Shepherd, 1979; Nowycky et al. 1981a, b; Mori & Kishi, 1982; Wellis & Scott, 1990; Kunze et al. 1992). In frog, the LOT consists exclusively of MTC axons projecting to the lateral (olfactory) cortex. MTCs responded to LOT stimulation with an initial antidromic action potential (AP; seen in ≈55 % of MTCs) followed by hyperaypolarization (Fig. 1Biii) or just slow hyperpolarization if an antidromic AP was not elicited. In contrast, GCs were synaptically depolarized by LOT stimulation with resulting APs delayed relative to the active response in MTCs (Fig. 1Aiii). Hyperpolarization from the RMP (20–30 mV) consistently blocked the AP in GCs and increased the amplitude of the underlying synaptic potential. Antidromic APs in MTCs rose straight from baseline and were not blocked by the injection of hyperpolarizing current through the recording electrode.
GC responses to direct current injection: ramping depolarization and non-stationary firing properties
GC responses to current injection differed substantially from MTC responses (Fig. 2A). To quantify these differences we examined two parameters, AP firing and the cumulative integrated area of the underlying depolarization during current injection (Fig. 2Bi-iii). The cumulative integrated area included the superimposed APs because we found that low-pass filtering (30 Hz) did not change measurements of the area under the curve by more than a few per cent. Our desire to maintain natural network activity during the recordings and to use orthodromic (ON shock) and antidromic (LOT shock) activation of the OB precluded the use of TTX in most experiments.
MTC responses to increasing current injection revealed a positive direct relationship between integrated depolarization and current amplitude over the entire range of current amplitudes tested (up to 120 pA) and decreasing AP frequency in response to prolonged stimulation (1–4 s). In MTCs, current injection was followed by a period of hyperpolarization, lasting up to 12 s, the duration of which was directly related to stimulus strength. It has been inferred that this is due to interneurone-mediated inhibitory feedback (Nowycky et al. 1981b). Integrating the MTC depolarizing response to current injection revealed a positive linear relationship during the pulse, reflecting the constant step depolarization, and a negative slope after the pulse due to the subsequent hyperpolarization below baseline RMP. In all MTCs tested (current injection amplitude of +60 pA for 3 s), the positive slope of the MTC response to current injection integrated over time was slightly less than expected based on a linear extrapolation from the initial 500 ms of the response. By determining the area under a single AP we calculated that this slight deviation from the extrapolated value could be accounted for by adaptation of the spike firing frequency over the time course of the pulse (marked by the horizontally oriented arrow in Fig. 2Aii).
GCs responded similarly to current injections that depolarized them just below threshold (10–20 pA) with a rapid stepwise depolarization and then a constant depolarization and firing rate over the duration of the current injection. This resulted in a linear increase in the integrated voltage over time. However, injecting larger currents (≥ 20 pA) evoked an additional slowly activating ‘ramping’ depolarization. This resulted in an initial acceleration of AP firing rate, and if current injection was sustained, there followed a pronounced decline in AP amplitude and an additional sharp depolarizing rise to an inactivated plateau near -20 mV. This characteristic ramping response towards a sustained plateau was clearly demonstrated by cumulative integration of the response voltage (cf. GC and MTC Fig. 2Aii) and resulted in strikingly non-stationary firing properties in GCs.
To compare GC and MTC responses, AP firing was quantified by counting the number of spikes per second in the 1st and 3rd seconds of a depolarizing pulse and plotted with respect to current amplitude (Fig. 2Biii). MTC firing frequency initially increased directly with current amplitude towards a maximum value, while spike accommodation also became more prominent at higher stimulus levels. For consistency, spikes in GCs were counted until their amplitude fell below one-half that of the initial AP in the train. This point corresponded well with the start of the observed plateau. For GCs, spike counts in both the 1st and 3rd seconds of the pulse initially increased in a sigmoidal fashion but then declined at higher amplitude as the delay to reach the inactivated state decreased with stronger depolarization.
The initial increase in instantaneous firing rate suggested that Na+ channel inactivation was not involved in the ramping depolarization in GCs, although it probably became prominent later, eventually leading to complete cessation of AP firing. Long hyperpolarizing pre-steps (-20 mV for up to 10 s) did not alter the response to depolarizing current injection, suggesting that the steadily increasing depolarization was not related to inactivation of a transient A-type K+ current. In voltage-clamp mode, stepping GCs from a holding potential of -65 mV to a range of potentials as polarized as -110 mV (step duration up to 200 ms) did not result in activation of any sustained inward current, suggesting that a hyperpolarization-activated current is not present (McCormick & Pape, 1990) in these neurones.
Following relatively high-amplitude current injection (60 pA (4 s)−1), 80 % of GCs tested (n = 16) remained slightly depolarized (< 10 mV above pre-stimulus RMP) for many (2–12) seconds. This accounts for the positive slope in the integration curve after the end of the pulse in the cell shown in Fig. 2A. In contrast to the situation in GCs, MTCs were invariably hyperpolarized for varying durations (4.69 ± 1.85 s; mean ± s.e.m.; n = 6) following current pulse steps that induced bouts of medium- to high-frequency firing (20–60 pA (4 s)−1; cf. GC and MTC in Fig. 2A).
Ramping depolarization in GCs is due to an intrinsic conductance
To test whether the ramping depolarization and inactivated plateau potentials were intrinsic to GCs or dependent upon ionotropic receptor activation, depolarizing current injections were applied in the presence of GABAA and ionotropic glutamate receptor blockers (Fig. 3). Under these conditions, responses to current injection were indistinguishable from control responses (Fig. 3B). Due to a slight hyperpolarization from pre-block baseline, consistent with the loss of spontaneous excitatory input, an additional 5–20 pA of current was often required to reproduce the same degree of ramping depolarization (cf. Fig. 3A and B).
Figure 3. Ramping depolarization in GCs is independent of ionotropic receptor activity and not related to cytoplasmic washout.
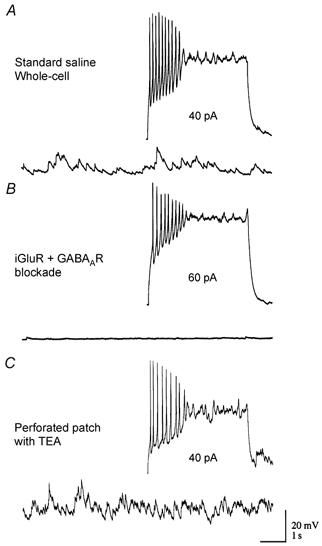
A, a typical GC response to current injection is shown under standard recording conditions (top trace). The lower trace shows baseline spontaneous activity in the same cell at this time. B, GC responses in the same cell were tested following application of 20 μM CNQX + 50 μM APV and 5 μM bicuculline to block ionotropic receptor activity. Under these conditions, responses to direct current injection were unaffected (top trace) while spontaneous synaptic activity in the network was abolished (lower trace). iGluR, ionotropic glutamate receptor. C, GCs were recorded in the perforated-patch configuration using amphotericin B. In these recordings TEA (5 mm) was added to the intracellular solution to control for spontaneous breakthrough. Responses obtained through perforated patch at similar access resistances (within 20 min in all three cells tested) were indistinguishable from those obtained in standard whole-cell recordings.
Perforated-patch-clamp recordings (Rae et al. 1991) from three cells were obtained using amphotericin B (120 μg ml−1) to confirm that ramping depolarization was not an artefactual consequence of rapid washout of a hyperpolarizing conductance (Fig. 3C) or some other process associated with intracellular dialysis during whole-cell recordings. For perforated-patch recordings, TEA (5 mm) was added to control for spontaneous breakthrough and recordings were made when access resistances were comparable to those used during whole-cell recordings, typically within 15–20 min after obtaining a gigaseal. Under these recording conditions responses to current injection were identical to responses acquired under the whole-cell configuration. Flufenamic acid (FFA, 1 mm) did, however, significantly reduce the cumulative depolarization during current injection to 85 ± 2.8 % (mean ± s.e.m.; n = 4; P < 0.001) of baseline pre-drug control levels. FFA has been demonstrated to be a blocker of non-specific cation channels in the central nervous system (CNS). However, the specificity of this effect has not been determined in frog GCs, and non-specific effects have been noted, such as a gradual increase in intracellular Ca2+ levels (Partridge & Valenzuela, 2000).
Previous studies demonstrated roles for ICAN in driving plateau potentials in neurones (Fraser & MacVicar, 1996; Rekling & Feldman, 1997; Morisset & Nagy, 1999; Di Prisco et al. 2000). We predicted that such a conductance in GCs may be responsible for driving ramping depolarization and maintaining the cell at an inactivated plateau near -20 mV. To test this hypothesis directly we examined the necessity of intracellular Ca2+ to drive depolarization in GCs through addition of the Ca2+ chelator BAPTA to whole-cell recording pipettes.
Suppression of ramping depolarization by intracellular BAPTA
Ramping depolarization and subsequent inactivated plateaus were observed as early as 30 s and up to approximately 1.5 h post-breakthrough in standard recording solution (0 BAPTA, 1 mm EGTA), further evidence that these phenomena were not due to washout of the cytosol. Addition of the intracellular Ca2+ chelator BAPTA (500 μM or 5 mm) to the recording pipette removed the ramping depolarization with a time course after breakthrough that correlated with BAPTA concentration (i.e. 5 mm suppressed the depolarization faster than 0.5 mm; Fig. 4). This is quantified in Fig. 4B where the increase in delay to inactivated plateau is plotted against time post-breakthrough (1–15 min). The slope of the cumulative integration line also decreased over time, as predicted (Fig. 4Aii). At 15 min post-breakthrough, injection of the same current amplitude resulted only in step depolarization and steady AP firing. Suppression of the ramping depolarization in GCs was not observed when EGTA was used as the sole exogenous Ca2+ chelator (control cells in Fig. 4). No effect was observed up to 5 mm EGTA (0 BAPTA). These results strongly suggest that a localized elevation in cytoplasmic [Ca2+] is required to drive the ramping depolarization. In light of these results we tested the sufficiency of a rise in intracellular [Ca2+] to evoke a depolarizing current in GCs.
Figure 4. Ramping depolarization to current injection is suppressed over time by addition of the intracellular Ca2+ chelator BAPTA.
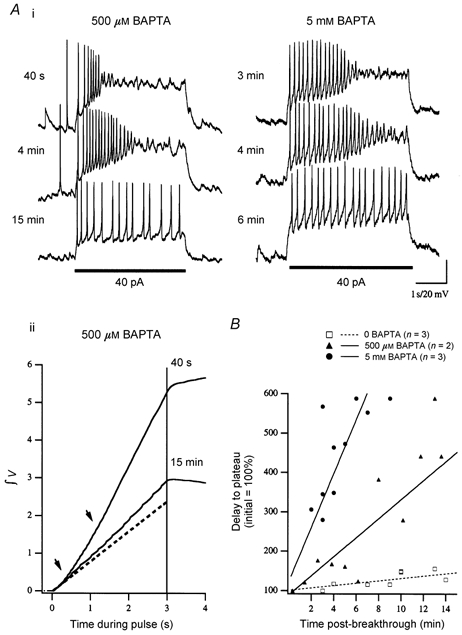
Ai, GCs loaded with intracellular BAPTA, pipette concentrations of either 500 μM (left) or 5 mm (right), were monitored for ramping depolarization during current injection (40 pA, at bar). Example traces are presented for one cell at each concentration at the indicated time post-breakthrough. Immediately following breakthrough (< 3 min), cells responded to current injection with ramping depolarization leading to inactivation typical of cells recorded in low (0.2–1 mm) EGTA and 0 BAPTA recording solutions. These phenomena were gradually suppressed and completely absent by 15 min post-breakthrough. Suppression was more rapid at the higher concentration of BAPTA (5 mm). Aii, suppression of the ramping depolarization is illustrated by plotting the cumulative integration of the voltage response ([mV s]/20). Examples are from the cell in Ai (500 μM BAPTA). At 40 s post-breakthrough the two obvious inflections (arrowheads) represent initial ramping depolarization and the subsequent step to inactivated plateau (cf. Fig. 2). At 15 min the cumulative voltage at the end of the pulse is substantially reduced, the slope of the line is decreased and the second inflection is absent due to removal of the inactivated plateau. The dashed line is an extrapolation calculated as an average from the first 500 ms of the 40 s response and 15 min after breakthrough. B, cumulative data are shown by plotting time to inactivation (inversely related to the strength of the ramping depolarization) with respect to time post-breakthrough for the cells tested at the concentrations shown in A (500 μM, n = 2 and 5 mmn = 3) as well as three control cells (0 BAPTA) for which a complete time series was acquired.
Caged Ca2+ photolysis evokes a depolarizing inward current in GCs
To test whether or not a rise in cytoplasmic [Ca2+] was sufficient to evoke a depolarizing conductance in GCs we used UV-photolysis of the caged Ca2+ chelator NP-EGTA (1.4–2 mm). Cells were patch clamped in the whole-cell configuration and loaded with NP-EGTA by passive diffusion in the absence of any other Ca2+ buffer (n = 9 GC; n = 2 MTC). Experiments were performed under standard extracellular conditions (n = 4 GC, n = 1 MTC) and then in the presence of ionotropic receptor antagonists (20 μM CNQX + 100 μM APV + 5 μM bicuculline; n = 3 GC, n = 1 MTC). Two additional GCs were recorded in voltage-clamp mode in the presence of intracellular blockers of fast Na+ and K+ currents (10–50 mm CsMeSO3 + 5 mm TEA + 2 mm QX314).
After 10–15 min of loading, UV light (wavelength 350 ± 6 nm for 5–15 s) evoked a depolarization in current-clamped GCs (Fig. 5A) that varied in amplitude among cells (maximum ≈25 mV). The evoked potential was slow to activate, did not inactivate throughout the duration of photolysis, and persisted after the end of the uncaging pulse in current-clamped GCs when spontaneous synaptic activity was unblocked (Fig. 5Ai). Under voltage-clamp conditions (holding potential -80 to -45 mV), a slowly activating inward current was observed (Fig. 5Aii), the amplitude of which increased with more hyperpolarized holding potentials. No depolarizing response was observed in the MTCs tested. Furthermore, UV exposure in the absence of intracellular NP-EGTA caused no observable effect. Since we were using illumination intensities that did not photolyse substantial amounts of NP-EGTA over several seconds of exposure, we could deliver several ‘flashes’ of photolysing light. Responses were repeatable and consistent, up to an observed maximum of 10 times.
Figure 5. Activation of a Ca2+-dependent non-specific conductance in GCs by photolysis of a caged Ca2+ chelator.
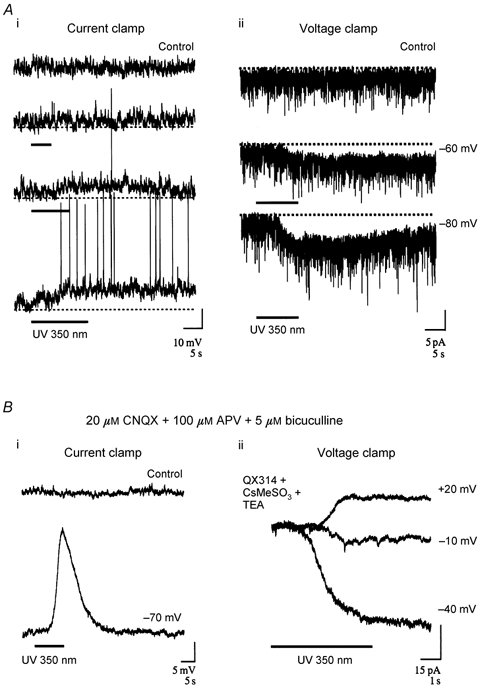
The caged Ca2+ chelator NP-EGTA was introduced by passive diffusion from whole-cell pipettes and photolysed with UV light (wavelength 350 nm) to demonstrate the sufficiency of cytoplasmic [Ca2+] to initiate a depolarizing current in GCs. Ai, recordings from a NP-EGTA-loaded GC in response to increasing duration of UV exposure (at bar). UV photolysis, ≈10 min after wash-in, resulted in a slowly activating depolarization that increased in duration with the length of the uncaging flash and persisted after the end of the pulse. Aii, voltage-clamp recordings from the cell in Ai in response to a UV flash at two different holding potentials and in the absence of UV flash (control trace at -60 mV). Photolysis (at bar) activated an inward current, the amplitude of which increased at more hyperpolarized potentials in response to the same uncaging stimulus. Bi, recordings from another current-clamped GC in the presence of extracellular ionotropic receptor blockade (CNQX + APV + bicuculline). A slowly activating depolarization outlasting the UV flash (at bar) was obvious in these recording conditions, confirming that calcium-evoked activation of this current was via an intrinsic mode of activation. Bii, voltage-clamp recordings from another GC are presented in the presence of ionotropic blockade and intracellular Na+ and K+ channel block (2 mm QX314 + 50 mm CsMeSO3 + 5 mm TEA). Under these conditions UV photolysis (at bar) evoked an inward current at potentials more hyperpolarized than -10 mV and reversed between this potential and +20 mV.
Similar depolarizing responses to Ca2+ uncaging pulses were observed in the presence of ionotropic receptor blockade (Fig. 5Bi), consistent with the hypothesis that increased cytoplasmic [Ca2+] activated an intrinsic current independent of neurotransmitter release. Whole-cell recordings were performed in four GCs in the presence of both ionotropic receptor antagonists and internal voltage-gated Na+ and K+ channel blockers (Fig. 5Bii). The peak current evoked by flash photolysis in these cells was 40 pA at a holding potential of -70 mV. By stepping the holding potential and repeating the activation pulse we attempted to reverse the current. In these cells the current was reversed at between -20 and +10 mV. We did not extend this paradigm to extract the precise I-V relationship of the evoked current since it is obviously limited by variability in the level of photolytic Ca2+ release from pulse to pulse, thus resulting in potentially variable amplitudes of ICAN activation. In spite of uncertainty in the amount of Ca2+ released per photolysis trial, the method provided valid upper and lower limits for the reversal potential, between -20 and +10 mV, which cannot be accounted for by the reversal potential of any single ion in the bathing medium.
In order to examine the role this conductance might play in shaping orthodromically driven excitatory synaptic potentials in GCs we evoked synaptic responses with ON shock and looked at the relative contributions of different conductances by blocking with APV, CNQX or BAPTA.
Role of Ca2+-evoked conductance in ON- and LOT-evoked responses
APV-sensitive plateau potentials in GCs
Synaptically driven responses in GCs resulting from electrical shock of the main ON were mediated by NMDA- and AMPA-type ionotropic glutamate channels, since they were completely abolished within 15 min by addition of both 100 μM APV and 20 μM CNQX (Fig. 6Ai). This is consistent with previous reports in turtle, salamander and mammals (Nowycky et al. 1981b; Trombley & Westbrook, 1990; Wellis & Kauer, 1994; Schoppa et al. 1998). The excitatory post-synaptic response in GCs consisted of an initial APV-insensitive component that was removed by addition of CNQX, and a longer-lasting (≈100–500 ms) APV-sensitive phase that plateaued when the basal membrane potential was at more depolarized levels (-50 mV and above). At a membrane voltage of -50 mV, APV (100 μM) blocked 50 % (3.96 ± 1.15 vs. 1.99 ± 0.32; means ± s.e.m.; n = 5) of the late-phase integrated post-synaptic potential (PSP; between 100 and 500 ms), while the initial 100 ms of the response was essentially unaffected; 91 % of its initial cumulative area remained after 10 min in APV (1.35 ± 0.36 vs. 1.24 ± 0.57; means ± s.e.m.; n = 5). As indicated earlier, the remaining initial response was completely blocked by the addition of CNQX (20 μM) (Fig. 6B).
Figure 6. Synaptic responses to olfactory nerve shock in GCs: a late-phase NMDA-mediated component.
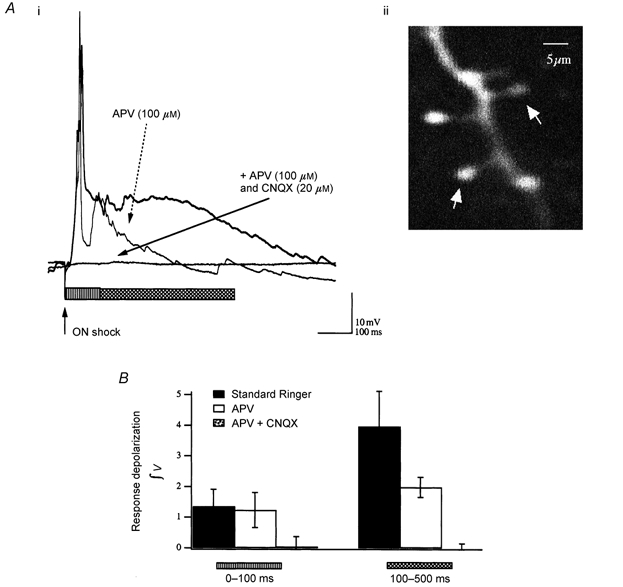
Ai, characteristic recordings from a current-clamped GC demonstrate the presence of a late-phase, APV-sensitive, ‘plateau-like’ potential in response to olfactory nerve (ON) shock. Traces are responses to ON shock in normal saline (thick trace), after 10 min under NMDAR block (dashed arrow), and after addition of an AMPA receptor (AMPAR) antagonist (continuous arrow). The horizontal bars indicate 0–100 ms (striped bar) and 100–500 ms (hatched bar) of the response. Responses to nerve shock were thus primarily AMPAR mediated in the first 100 ms and predominantly carried by NMDA receptor channels between 100 and 500 ms. Aii, two-photon-excited fluorescence image (200 μM Oregon-Green-1 BAPTA 488) of the cell in Ai showing a small region of dendrite with the distinguishing spiny processes (arrows) that are characteristic of GCs. B, cumulative data from five neurones showing the average responses (means ± s.e.m.) before addition of extracellular blockers (Standard Ringer), after 10 min in the presence of APV and then > 5 min after additional application of CNQX (note n = 2 for combined APV + CNQX), which completely blocked both synaptic and spontaneous activity.
To control for the effect of ionotropic blockers on the initial ON-to-MTC synapse we added APV and CNQX and tested monosynaptically evoked GC responses. Using LOT shock to evoke antidromic APs in MTCs, and thus monosynaptic EPSPs in GCs, it proved much more difficult to evoke strong NMDA-mediated synaptic plateaus. This may be due to the spatially distributed projections of LOT fibres in the frog (Scalia et al. 1991) in combination with the localized bipolar stimulation, which resulted in stimulation of fewer MTCs. This is consistent with the observation that only ≈50 % of the MTCs we recorded from responded with an antidromic AP in response to LOT shock. Furthermore, antidromic activation is brief compared to orthodromic synaptic activation. In GCs exhibiting a synaptically evoked plateau, APV blocked 54 % of the PSP between 100 and 500 ms, comparable to the ON-shock-induced suppression. Addition of CNQX removed the remaining response to LOT stimulation.
Selective suppression of the NMDA-mediated plateau by intracellular BAPTA
Next we examined the contribution of ICAN to synaptically driven potentials. The integrated PSP for the initial 100 ms of ON-evoked responses (primarily AMPAR mediated) and the integrated response between 100 and 500 ms (primarily NMDAR mediated) were quantified during wash-in of the Ca2+ chelator BAPTA and compared to control cells (0 BAPTA). BAPTA specifically suppressed the late-phase component, which increased over time post-breakthrough, concurrent with a suppression of current-evoked depolarization (Fig. 7). At between 15 and 20 min (time post-breakthrough) the average standardized voltage decreased both for the initial and late phase of the nerve stimulation response. The degree of suppression was related to the initial strength of the response during this period. This would be expected if the stronger the response the greater the relative contribution of ICAN.
Figure 7. BAPTA suppression of ICAN depresses the NMDA-mediated synaptic component in GCs activated by olfactory nerve shock.
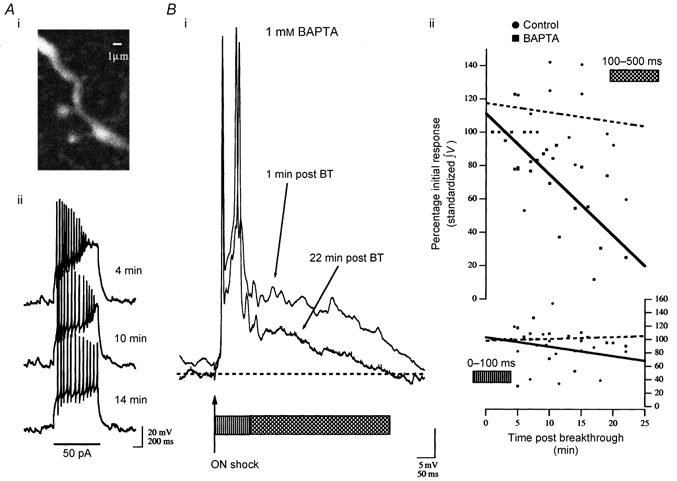
Ai, a two-photon Oregon Green BAPTA 488 fluorescence image of a branch of the neurone in Aii and Bi showing the characteristic anatomy of a GC as confirmation of cellular type. Aii, characteristic responses to current injection in this GC are shown with 1 mm BAPTA + 200 μM Oregon Green BAPTA-1 in the recording pipette at the post-breakthrough times indicated. Bi, over the time course of BAPTA wash-in, a concurrent suppression of the late-phase (100–500 ms; hatched bar) NMDAR-mediated component of the synaptic response was observed. BT, breakthrough. Bii, cumulative, standardized data from four neurones showing the integrated voltage of the synaptic response for the response components indicated by the corresponding bars under the traces in Bi (100–500 ms (left axis) and 0–100 ms (right axis)) with respect to time post-breakthrough. Lines are linear regressions through the data to aid visualization of the trend without necessarily implying a linear model for the relationship (continuous line, 1 mm BAPTA; dashed line, control). The negative slope of the line fit to the BAPTA 100–500 ms interval (left axis) reflects suppression of this component compared to the control trace which shows little to no change 20 min after breakthrough. Comparing the data for the first 100 ms of the synaptic response (right axis) shows that suppression was specific to the late component.
The first 100 ms of the response to nerve shock was depressed slightly in cells loaded with 1 mm BAPTA (72 ± 4.8 %) compared to control neurones without added BAPTA (98 ± 2.7 %; means ± s.e.m.; n = 4; P < 0.05). This suppression is evident in the example trace shown in Fig. 7Bi. This is most simply explained by hypothesizing that ICAN is slightly activated by Ca2+ influx through voltage-gated Ca2+ channels (VGCCs) during the evoked AP and/or that some of the PSP observed during the first 100 ms is due to NMDAR current. Because suppression of the initial component was slight and the data set relatively small we did not try to compare strength of initial excitation with degree of suppression, although a positive relationship would be expected.
BAPTA-mediated suppression of the late phase of the PSP was more significant. At between 15 and 20 min post-breakthrough, the integrated voltage of the response at 100–500 ms was 46 ± 5.3 % of the standardized response compared to 111 ± 5.9 % in non-BAPTA-loaded controls (means ± s.e.m.; n = 4; P < 0.001).
Whole-cell currents and calcium-influx threshold
We recorded whole-cell currents under conditions that blocked voltage-gated Na+ and K+ channels to examine the threshold for VGCC activation in GCs. Increasing voltage steps from a holding potential of -65 mV (5 mV increments) resulted in inward current activation beginning at around -40 mV (Fig. 8B). This level is above the AP threshold we observed for current-clamped GCs (≈-45 mV) and suggests that Ca2+ influx is not substantial in the absence of APs. Consistent with this observation, a rise in intracellular [Ca2+] was never observed with two-photon Ca2+ imaging in response to subthreshold depolarizations (Fig. 8A) in either spines or parent dendrites, while APs elevated intracellular [Ca2+] in both spines and dendrites to similar degrees. The amplitude of the combined inward current peaked between -30 and -20 mV. A high threshold for Ca2+ influx via VGCCs predicts that the ICAN in GCs will be activated only when APs are evoked, consistent with current-clamp and optical recordings.
Figure 8. Activation of VGCCs and Ca2+ influx in GCs.
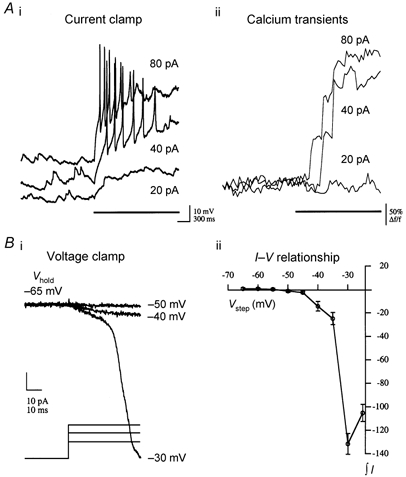
Whole-cell current-clamp recordings showed that substantial Ca2+ influx occurs only above AP threshold in GCs. Ai, electrophysiological traces showing typical GC responses to different levels of injected current (at bar). Note that the traces are slightly offset in the vertical dimension for clarity. Step-like responses to subthreshold current injection (20 pA) are contrasted by the slowly activating ramping depolarization seen in response to suprathreshold current pulses. Aii, Ca2+ transients (Oregon Green BAPTA 488 fluorescence measured from a dendrite with 2 ms line scans) resulting from the current injections shown in Ai demonstrate the correlation between Ca2+ influx and AP initiation. Ca2+ influx was not observed in response to subthreshold depolarization from a resting membrane potential of -60 mV, while the delay to the initial rise of [Ca2+] decreased with increasing current injection amplitude as the time to onset of AP initiation decreased. Characteristic GC responses to voltage steps, from an initial holding potential (Vhold) of -65 mV, are shown in Bi. Data were acquired in the presence of intracellular Na+ and K+ channel blockers (2 mm QX314 + 50 mm CsMeSO3 + 5 mm TEA). No inward current was activated at potentials below -45 mV. Under this protocol, whole-cell current amplitude peaked at between -30 and -20 mV. Bii, average data are plotted for four GCs under the same conditions and experimental paradigm as in Bi. Total integrated current (in pA s) during the step is plotted with respect to step voltage (Vstep; means ± s.e.m.). On average, GC recordings showed no current activation to voltage steps below ≈-45 mV, and the integrated whole-cell current response peaked at -30 mV.
Discussion
Our data demonstrate the presence of a Ca2+-activatable ICAN in GCs of the adult frog OB. Both the necessity and sufficiency of increased cytoplasmic [Ca2+] to evoke depolarization were demonstrated, through buffering intracellular Ca2+ with BAPTA and UV photolysis of intracellular caged Ca2+, respectively. Pharmacological blockade of ionotropic glutamate and GABAA receptors showed that ICAN is activated intrinsically, independent of the synaptic interactions between GCs and MTCs. The conductance could be evoked either by direct injection of current through the whole-cell recording pipette or through synaptic activation evoked by ON or LOT shock. The persistence of this conductance over time in whole-cell recordings (30 s to 1.5 h post-breakthrough), and its presence in perforated-patch recordings argues strongly against the possibility that it is an artefact associated with washout of a constitutive hyperpolarizing current.
Functionally, the current appears to work synergistically with NMDAR-mediated potentials to amplify the late phase of synaptic events (at between 100 and 500 ms post-breakthrough) evoked by orthodromic activation of the OB. Buffering intracellular [Ca2+] with BAPTA reduces the amplitude of synaptically evoked potentials that have an NMDAR-mediated component, without affecting AMPA receptor (AMPAR)-mediated synaptic potentials. The requirement for strong or persistent increases in intracellular [Ca2+] to drive ICAN in GCs results in a mechanism in which strong, but not weak, synaptic depolarizations are enhanced.
CAN currents have been demonstrated in a variety of cells including CNS neurones (for review see Partridge et al. 1994). Activation of ICAN in isolated membrane patches suggests that, at least in some cells, it is directly evoked by rises in cytoplasmic [Ca2+] and not via indirect second-messenger pathways (Partridge & Swandulla, 1987; Razani-Boroujerdi & Partridge, 1993). A common feature of CAN conductances is that they do not undergo time-dependent inactivation. Therefore, if elevation of [Ca2+] is sustained, they provide prolonged depolarization. Slow depolarizations mediated by ICAN have been shown to underlie such phenomena as bursting in molluscan neurones (Kramer & Zucker, 1985) and plateau potentials in motoneurones of the mammalian spinal cord (Arakawa et al. 1991; Morisset & Nagy, 1999) as well as brainstem neurones of both the lamprey (Di Prisco et al. 2000) and the mouse (Rekling & Feldman, 1997). ICAN is also responsible for slow after-depolarizations in mammalian septal nucleus neurones (Hasuo et al. 1990). ICAN is present in turtle motoneurones, although a recent report suggests that it is not involved in driving calcium-dependent plateaus in these cells (Perrier & Hounsgaard, 1999).
Activation of persistent depolarizing currents, for example non-inactivating Na+ channels, can amplify NMDAR currents in neocortical pyramidal cells (Schwindt & Crill, 1995). Our data suggest that, in GCs, activation of ICAN provides a similar effect, extending or amplifying the late NMDA-mediated phase of synaptic depolarizations. Synaptic potentials evoked by ON shock in frog GCs are comprised of a mix of ionotropic glutamate receptor conductances. Sufficiently strong synaptic stimulation results in a late phase (100 to ≈500 ms post-breakthrough) synaptic plateau in GCs that is largely APV sensitive. NMDA receptor channels, when activated, provide neurones with a strong Ca2+ influx, which is responsible for initiating intracellular signalling cascades that can result in long-term changes at synapses.
The voltage-activation parameters and non-specific ion permeability of NMDAR channels combine such that their maximal conductance is at membrane potentials near -20 mV (e.g. Hess et al. 1998). The reversal potential of ICAN tends to drive GCs to a membrane potential near -20 mV, as evident in our recorded responses to current injection and from the reversal potential estimated from the photolytic release of caged Ca2+. Activation of ICAN is therefore well suited to enhance NMDAR-mediated Ca2+ current in GCs. It has recently been documented in lamprey that an interplay between ICAN and NMDAR currents may be responsible for creating long-lasting synaptic plateau potentials in reticulospinal neurones. Generation of these plateaus coincides with the behavioural threshold for initiation of a swimming response in a semi-intact preparation (Di Prisco et al. 2000). This predicted synergism between NMDAR Ca2+ influx and the intrinsic ICAN current provides a functional switch by which sensory input is turned into a motor command. It has previously been demonstrated in mammalian OB GCs that NMDAR-dependent Ca2+ influx is sufficient by itself to drive neurotransmitter release (Chen et al. 2000; Halabisky et al. 2000). Therefore, through enhancing NMDAR-mediated EPSPs, ICAN may prolong GABA-mediated feedback and feedforward (lateral) inhibition within the OB, possibly affecting the spatial spread of this signal.
Activation of ICAN in GCs is driven by cytoplasmic Ca2+, and therefore only by depolarizations large enough to evoke a rise in intracellular [Ca2+]. Voltage- and current-clamp recordings as well as dendritic Ca2+ imaging indicate that VGCCs in GCs are of a high-threshold type and that the depolarization required to generate a voltage-gated Ca2+ influx is comparable to the threshold for AP initiation. The requirement for strong, and perhaps sustained, Ca2+ influx to drive ICAN results in a mechanism that selectively enhances strong over weak synaptic inputs. A consequence of this is that the frequent spontaneous excitatory synaptic inputs seen in GC recordings are not influenced by the presence of ICAN channels, as these only occasionally reach the threshold for firing. This contrasts with other mechanisms in neuronal networks that could increase the responsiveness of neurones to synaptic inputs, such as increasing input impedance which, while enhancing the amplitude of synaptic potentials, potentially increases noise levels in the system via amplification of weak yet frequent spontaneous inputs.
There is also the possibility that Ca2+ influx through NMDARs may contribute to the activation of ICAN. This would constitute a reciprocally synergistic interaction between the voltage dependence of NMDARs and the Ca2+ dependence of ICAN. While the present studies are not able to unambiguously separate Ca2+ influx from VGCCs versus NMDARs, they suggest a significant contribution of NMDAR-mediated Ca2+ influx to the activation of ICAN. The VGCCs have a high threshold for activation and unless the amplitude of the synaptic potential during the NMDA-dependent plateau is much greater than that measured at the soma, VGCCs would generate only a small Ca2+ influx. Furthermore, in the present study, synaptic stimulation sufficiently strong to generate a BAPTA-sensitive NMDA- and ICAN-mediated plateau only produced a few APs (Fig. 7). In contrast, initiation of significant ICAN current by AP trains alone required bursts of much higher frequency and duration than those resulting from strong synaptic activation (e.g. Fig. 2B). Our data therefore suggest that NMDAR-mediated Ca2+ influx is capable of contributing significantly to the activation of ICAN.
In addition to being directly activated by increased internal [Ca2+], ICAN is known to be upregulated by intracellular [Ca2+] in some systems (Razani-Boroujerdi & Partridge, 1993; Partridge & Valenzuela, 1999). We suspect that the slow onset kinetics of ICAN in GCs may reflect priming of this current by the initial Ca2+ influx. Ca2+-dependent modulation of ICAN would provide another means by which influx through NMDARs could contribute to activation of ICAN through potentiation of the effects of AP-dependent Ca2+ influx through VGCCs.
Acknowledgments
We would like to thank Alan Gelperin and Timothy Murphy for comments on the manuscript. This work was supported by the Canadian Institutes for Health Research, BC Health Research Foundation grants to K.R.D. and the Linville Graduate Fellowship in Olfaction to B.J.H.
References
- Arakawa O, Nakahiro M, Narahashi T. Mercury modulation of GABA-activated chloride channels and non-specific cation channels in rat dorsal root ganglion neurons. Brain Research. 1991;551:58–63. doi: 10.1016/0006-8993(91)90913-g. [DOI] [PubMed] [Google Scholar]
- Berkowicz DA, Trombley PQ. Dopaminergic modulation at the olfactory nerve synapse. Brain Research. 2000;855:90–99. doi: 10.1016/s0006-8993(99)02342-2. [DOI] [PubMed] [Google Scholar]
- Chen WR, Xiong W, Shepherd GM. Analysis of relations between NMDA receptors and GABA release at olfactory bulb reciprocal synapses. Neuron. 2000;25:625–633. doi: 10.1016/s0896-6273(00)81065-x. [DOI] [PubMed] [Google Scholar]
- Delaney KR, Hall BJ. An in vitro preparation of frog nose and brain for the study of odour-evoked oscillatory activity. Journal of Neuroscience Methods. 1996;68:193–202. doi: 10.1016/0165-0270(96)00069-6. [DOI] [PubMed] [Google Scholar]
- Desmaisons D, Vincent JD, Lledo PM. Control of action potential timing by intrinsic subthreshold oscillations in olfactory bulb output neurons. Journal of Neuroscience. 1999;19:10727–10737. doi: 10.1523/JNEUROSCI.19-24-10727.1999. [DOI] [PMC free article] [PubMed] [Google Scholar]
- Di Prisco GV, Pearlstein E, Le Ray D, Robitaille R, Dubuc R. A cellular mechanism for the transformation of a sensory input into a motor command. Journal of Neuroscience. 2000;20:8169–8176. doi: 10.1523/JNEUROSCI.20-21-08169.2000. [DOI] [PMC free article] [PubMed] [Google Scholar]
- Ellis-Davies GC, Kaplan JH. Nitrophenyl-EGTA, a photolabile chelator that selectively binds Ca2+ with high affinity and releases it rapidly upon photolysis. Proceedings of the National Academy of Sciences of the USA. 1994;91:187–191. doi: 10.1073/pnas.91.1.187. [DOI] [PMC free article] [PubMed] [Google Scholar]
- Fraser DD, MacVicar BA. Cholinergic-dependent plateau potential in hippocampal CA1 pyramidal neurons. Journal of Neuroscience. 1996;16:4113–4128. doi: 10.1523/JNEUROSCI.16-13-04113.1996. [DOI] [PMC free article] [PubMed] [Google Scholar]
- Freeman W. Measurement of oscillatory responses to electrical stimulation in the olfactory bulb of cat. Journal of Neurophysiology. 1972;35:762–779. doi: 10.1152/jn.1972.35.6.762. [DOI] [PubMed] [Google Scholar]
- Halabisky B, Friedman D, Radojicic M, Strowbridge BW. Calcium influx through NMDA receptors directly evokes GABA release in olfactory bulb granule cells. Journal of Neuroscience. 2000;20:5124–5134. doi: 10.1523/JNEUROSCI.20-13-05124.2000. [DOI] [PMC free article] [PubMed] [Google Scholar]
- Halasz N, Shepherd GM. Neurochemistry of the vertebrate olfactory bulb. Neuroscience. 1983;10:579–619. doi: 10.1016/0306-4522(83)90206-3. [DOI] [PubMed] [Google Scholar]
- Hasuo H, Phelan KD, Twery MJ, Gallagher JP. A calcium-dependent slow afterdepolarization recorded in rat dorsolateral septal nucleus neurons in vitro. Journal of Neurophysiology. 1990;64:1838–1846. doi: 10.1152/jn.1990.64.6.1838. [DOI] [PubMed] [Google Scholar]
- Hess SD, Daggett LP, Deal C, Lu CC, Johnson EC, Velicelebi G. Functional characterization of human N-methyl-d-aspartate subtype 1A/2D receptors. Journal of Neurochemistry. 1998;70:1269–1279. doi: 10.1046/j.1471-4159.1998.70031269.x. [DOI] [PubMed] [Google Scholar]
- Jahr CE, Nicoll RA. Dendrodendritic inhibition: demonstration with intracellular recording. Science. 1980;207:1473–1475. doi: 10.1126/science.7361098. [DOI] [PubMed] [Google Scholar]
- Jahr CE, Nicoll RA. An intracellular analysis of dendrodendritic inhibition in the turtle in vitro olfactory bulb. Journal of Physiology. 1982;326:213–234. doi: 10.1113/jphysiol.1982.sp014187. [DOI] [PMC free article] [PubMed] [Google Scholar]
- Jiang T, Holley A. Morphological variations among output neurons of the olfactory bulb in the frog (Rana ridibunda) Journal of Comparative Neurology. 1992;320:86–96. doi: 10.1002/cne.903200106. [DOI] [PubMed] [Google Scholar]
- Kramer RH, Zucker RS. Calcium-dependent inward current in Aplysia bursting pace-maker neurones. Journal of Physiology. 1985;362:107–130. doi: 10.1113/jphysiol.1985.sp015666. [DOI] [PMC free article] [PubMed] [Google Scholar]
- Kunze WA, Shafton AD, Kem RE, Mckenzie JS. Intracellular responses of olfactory bulb granule cells to stimulating the horizontal diagonal band nucleus. Neuroscience. 1992;48:363–369. doi: 10.1016/0306-4522(92)90496-o. [DOI] [PubMed] [Google Scholar]
- McCormick DA, Pape HC. Properties of a hyperpolarization-activated cation current and its role in rhythmic oscillation in thalamic relay neurons. Journal of Physiology. 1990;431:291–318. doi: 10.1113/jphysiol.1990.sp018331. [DOI] [PMC free article] [PubMed] [Google Scholar]
- Mori K, Kishi K. The morphology and physiology of the granule cells in the rabbit olfactory bulb revealed by intracellular recording and HRP injection. Brain Research. 1982;247:129–133. doi: 10.1016/0006-8993(82)91035-6. [DOI] [PubMed] [Google Scholar]
- Mori K, Shepherd GM. Synaptic excitation and long-lasting inhibition of mitral cells in the in vitro turtle olfactory bulb. Brain Research. 1979;172:155–159. doi: 10.1016/0006-8993(79)90904-1. [DOI] [PubMed] [Google Scholar]
- Mori K, Takagi SF. An intracellular study of dendrodendritic inhibitory synapses on mitral cells in the rabbit olfactory bulb. Journal of Physiology. 1978;279:569–588. doi: 10.1113/jphysiol.1978.sp012362. [DOI] [PMC free article] [PubMed] [Google Scholar]
- Morisset V, Nagy F. Ionic basis for plateau potentials in deep dorsal horn neurons of the rat spinal cord. Journal of Neuroscience. 1999;19:7309–7316. doi: 10.1523/JNEUROSCI.19-17-07309.1999. [DOI] [PMC free article] [PubMed] [Google Scholar]
- Nicoll RA. Pharmacological evidence for GABA as the neurotransmitter in granule cell inhibition in the olfactory bulb. Brain Research. 1971;35:137–149. doi: 10.1016/0006-8993(71)90600-7. [DOI] [PubMed] [Google Scholar]
- Nowycky MC, Mori K, Shepherd GM. GABAergic mechanisms of dendrodendritic synapses in isolated turtle olfactory bulb. Journal of Neurophysiology. 1981a;46:639–648. doi: 10.1152/jn.1981.46.3.639. [DOI] [PubMed] [Google Scholar]
- Nowycky MC, Mori K, Shepherd GM. GABAergic mechanisms of dendrodendritic synapses in isolated turtle olfactory bulb. Journal of Neurophysiology. 1981b;46:639–648. doi: 10.1152/jn.1981.46.3.639. [DOI] [PubMed] [Google Scholar]
- Partridge LD, Muller TH, Swandulla D. Calcium-activated non-selective channels in the nervous system. Brain Research. Brain Research Reviews. 1994;19:319–325. doi: 10.1016/0165-0173(94)90017-5. [DOI] [PubMed] [Google Scholar]
- Partridge LD, Swandulla D. Single Ca-activated cation channels in bursting neurons of Helix. Pflügers Archiv. 1987;410:627–631. doi: 10.1007/BF00581323. [DOI] [PubMed] [Google Scholar]
- Partridge LD, Valenzuela CF. Ca2+ store-dependent potentiation of Ca2+-activated non-selective cation channels in rat hippocampal neurones in vitro. Journal of Physiology. 1999;521:617–627. doi: 10.1111/j.1469-7793.1999.00617.x. [DOI] [PMC free article] [PubMed] [Google Scholar]
- Partridge LD, Valenzuela CF. Block of hippocampal CAN channels by flufenamate. Brain Research. 2000;867:143–148. doi: 10.1016/s0006-8993(00)02275-7. [DOI] [PubMed] [Google Scholar]
- Perrier JF, Hounsgaard J. Ca2+-activated nonselective cationic current (ICAN) in turtle motoneurons. Journal of Neurophysiology. 1999;82:730–735. doi: 10.1152/jn.1999.82.2.730. [DOI] [PubMed] [Google Scholar]
- Price JL, Powell TP. The synaptology of the granule cells of the olfactory bulb. Journal of Cell Science. 1970;7:125–155. doi: 10.1242/jcs.7.1.125. [DOI] [PubMed] [Google Scholar]
- Rae J, Cooper K, Gates P, Watsky M. Low access resistance perforated patch recordings using amphotericin B. Journal of Neuroscience Methods. 1991;37:15–26. doi: 10.1016/0165-0270(91)90017-t. [DOI] [PubMed] [Google Scholar]
- Rall W, Shepherd GM. Theoretical reconstruction of field potentials and dendrodendritic synaptic interactions in olfactory bulb. Journal of Neurophysiology. 1968;31:884–915. doi: 10.1152/jn.1968.31.6.884. [DOI] [PubMed] [Google Scholar]
- Rall W, Shepherd GM, Reese TS, Brightman MW. Dendrodendritic synaptic pathway for inhibition in the olfactory bulb. Experimental Neurology. 1966;14:44–56. doi: 10.1016/0014-4886(66)90023-9. [DOI] [PubMed] [Google Scholar]
- Razani-Boroujerdi S, Partridge LD. Activation and modulation of calcium-activated non-selective cation channels from embryonic chick sensory neurons. Brain Research. 1993;623:195–200. doi: 10.1016/0006-8993(93)91427-t. [DOI] [PubMed] [Google Scholar]
- Rekling JC, Feldman JL. Calcium-dependent plateau potentials in rostral ambiguus neurons in the newborn mouse brain stem in vitro. Journal of Neurophysiology. 1997;78:2483–2492. doi: 10.1152/jn.1997.78.5.2483. [DOI] [PubMed] [Google Scholar]
- Scalia F, Gallousis G, Roca S. A note on the organization of the amphibian olfactory bulb. Journal of Comparative Neurology. 1991;305:435–442. doi: 10.1002/cne.903050307. [DOI] [PubMed] [Google Scholar]
- Schoppa NE, Kinzie JM, Sahara Y, Segerson TP, Westbrook GL. Dendrodendritic inhibition in the olfactory bulb is driven by NMDA receptors. Journal of Neuroscience. 1998;18:6790–6802. doi: 10.1523/JNEUROSCI.18-17-06790.1998. [DOI] [PMC free article] [PubMed] [Google Scholar]
- Schwindt PC, Crill WE. Amplification of synaptic current by persistent sodium conductance in apical dendrite of neocortical neurons. Journal of Neurophysiology. 1995;74:2220–2224. doi: 10.1152/jn.1995.74.5.2220. [DOI] [PubMed] [Google Scholar]
- Shepherd GM. The Synaptic Organization of the Brain. New York: Oxford University Press; 1998. [Google Scholar]
- Shipley MT, Ennis M. Functional organization of the olfactory system. Journal of Neurobiology. 1996;30:123–176. doi: 10.1002/(SICI)1097-4695(199605)30:1<123::AID-NEU11>3.0.CO;2-N. [DOI] [PubMed] [Google Scholar]
- Swandulla D, Lux HD. Activation of a nonspecific cation conductance by intracellular Ca2+ elevation in bursting pacemaker neurons of Helix pomatia. Journal of Neurophysiology. 1985;54:1430–1443. doi: 10.1152/jn.1985.54.6.1430. [DOI] [PubMed] [Google Scholar]
- Trombley PQ, Westbrook GL. Excitatory synaptic transmission in cultures of rat olfactory bulb. Journal of Neurophysiology. 1990;64:598–606. doi: 10.1152/jn.1990.64.2.598. [DOI] [PubMed] [Google Scholar]
- Wellis DP, Kauer JS. GABAergic and glutamatergic synaptic input to identified granule cells in salamander olfactory bulb. Journal of Physiology. 1994;475:419–430. doi: 10.1113/jphysiol.1994.sp020082. [DOI] [PMC free article] [PubMed] [Google Scholar]
- Wellis DP, Scott JW. Intracellular responses of identified rat olfactory bulb interneurons to electrical and odor stimulation. Journal of Neurophysiology. 1990;64:932–947. doi: 10.1152/jn.1990.64.3.932. [DOI] [PubMed] [Google Scholar]
- Woolf TB, Shepherd GM, Greer CA. Local information processing in dendritic trees: subsets of spines in granule cells of the mammalian olfactory bulb. Journal of Neuroscience. 1991;11:1837–1854. doi: 10.1523/JNEUROSCI.11-06-01837.1991. [DOI] [PMC free article] [PubMed] [Google Scholar]
- Yokoi M, Mori K, Nakanishi S. Refinement of odor molecule tuning by dendrodendritic synaptic inhibition in the olfactory bulb. Proceedings of the National Academy of Sciences of the USA. 1995;92:3371–3375. doi: 10.1073/pnas.92.8.3371. [DOI] [PMC free article] [PubMed] [Google Scholar]