Abstract
In most mammalian species force of contraction of cardiac muscle increases with increasing rate of stimulation, i.e. a positive force-frequency relationship. In single mouse ventricular cells, both positive and negative relationships have been described and little is known about the underlying mechanisms. We studied enzymatically isolated single ventricular mouse myocytes, at 30 °C. During field stimulation, amplitude of unloaded cell shortening increased with increasing frequency of stimulation (0.04 ± 0.01 ΔL/L0 at 1 Hz to 0.07 ± 0.01 ΔL/L0 at 4 Hz, n = 12, P < 0.05). During whole cell voltage clamp with 50 μM [K5-fluo-3]pip, both peak and baseline [Ca2+]i increased at higher stimulation frequencies, but the net Δ[Ca2+]i increased only modestly from 1.59 ± 0.08 ΔF/F0 at 1 Hz, to 1.71 ± 0.11 ΔF/F0 at 4 Hz (n = 17, P < 0.05). When a 1 s pause was interposed during stimulation at 2 and 4 Hz, [Ca2+]i transients were significantly larger (at 4 Hz, peak F/F0 increased by 78 ± 2 %, n = 5). SR Ca2+ content assessed during caffeine application, significantly increased from 91 ± 24 μmol l−1 at 1 Hz to 173 ± 20 μmol l−1 at 4 Hz (n = 5, P < 0.05). Peak ICa,L decreased at higher frequencies (by 28 ± 6 % at 2 Hz, and 45 ± 8 % at 4 Hz), due to slow recovery from inactivation. This loss of ICa,L resulted in reduced fractional release. Thus, in mouse ventricular myocytes the [Ca2+]i-frequency response depends on a balance between the increase in SR content and the loss of trigger ICa,L. Small changes in this balance may contribute to variability in frequency-dependent behaviour. In addition, there may be a regulation of the contractile response downstream of [Ca2+]i.
The change in contractile force in response to a change in frequency of stimulation is a general property of cardiac muscle. For most species, including healthy humans, the relation is a positive one, i.e. force of contraction increases with increasing frequency of stimulation (e.g. Gwathmey et al. 1990 for human). This positive staircase results from larger [Ca2+]i transients at higher frequencies, due to an increase in sarcoplasmic reticulum (SR) content with increasing stimulation frequency (reviewed in Bers, 2001). Frequency-dependent facilitation of ICa,L may also contribute to the positive staircase (Zygmunt & Maylie, 1990). For the rat the relation is negative in the lower range of frequencies (below 2 Hz, e.g. Henderson et al. 1974; but see also Layland & Kentish, 1999). It is thought that resting SR content in the rat is high and cannot be increased in this range of frequencies; incomplete recovery of the release channel during stimulation at higher frequencies would then result in a negative staircase (reviewed in Bers, 2001). The force-frequency relation is often used to describe the contractile state and can be altered by inotropic interventions, e.g. by drugs that increase [Na+]i (Koch-Weser & Blinks, 1963; Mubagwa et al. 1997) or that affect SR Ca2+ uptake and release (Baudet et al. 1996; Bers & Christensen, 1990), and by disease states such as heart failure (Mulieri et al. 1992). Changes in the relation usually reflect alterations in one of the underlying mechanisms, e.g. the diminished capacity of the SR to increase its Ca2+ content, which has been implicated in the negative force-frequency of the failing human heart (Pieske et al. 1999).
Because of transgenic technology, the mouse has become a much-studied species for cardiovascular pathophysiology. The basic, normal physiology, may however be quite particular in this small animal with high in vivo heart rates. For the frequency response, experiments on trabeculae have shown a positive relation with an increase in force for increase in stimulation frequency from 1 to 4 Hz (Gao et al. 1998). The response in the amplitude of the Ca2+ transient was also positive, though less pronounced than for contraction. In vivo, the frequency response appears to be rather flat in the range from 500 to 850 beats min−1 (Georgakopoulos & Kass, 2001). In some of the recent transgenic mouse models the frequency response was found to be altered, e.g. by changes in phospholamban, PLB, expression (Kadambi et al. 1999), or by knockout of Annexin VII (Herr et al. 2001). Yet the mechanisms determining the frequency response in the mouse, which may be particular to this species, have not been studied. We therefore examined the characteristics of the frequency response of contraction and of Ca2+ fluxes in single mouse ventricular myocytes. We found a prominent role for frequency-dependent reductions in ICa,L which offset the effect of an increase in SR Ca2+ content at higher frequencies. This interplay between factors promoting a positive frequency response and factors promoting a negative frequency response results in a rather flat [Ca2+]i-frequency relation.
METHODS
Cell isolation
Single ventricular myocytes were enzymatically dissociated from 3- to 4-month-old mice (strain 129/SV). Mice were killed by an overdose of pentobarbital (100 mg kg−1i.p.), and the heart quickly excised. After cannulation of the aorta, hearts were mounted to a Langendorff perfusion set. The heart was briefly rinsed with normal Tyrode solution, containing (mm): 137 NaCl, 5.4 KCl, 0.5 MgCl2, 1 CaCl2, 11.8 Hepes and 10 glucose, pH adjusted to 7.4 with NaOH. Subsequently it was perfused with a Ca2+-free solution for 8 min. The Ca2+-free Tyrode solution contained (mm): 130 NaCl, 5.4 KCl, 1.2 KH2PO4, 1.2 MgSO4, 6 Hepes, 20 glucose, pH adjusted to 7.2 with NaOH. Collagenase A (0.6 mg ml−1, Roche Diagnostics, GmbH, Mannheim, Germany) and protease (type XIV, 0.1 mg ml−1, Sigma, St Louis, MO, USA), added to the Ca2+-free solution, were recirculated for 10 min. The enzymes were washed out with low Ca2+ solution, i.e. the Ca2+-free solution to which 0.18 mm CaCl2 was added. The heart was then removed, the ventricles were cut into small pieces and further dissociated into single cells by gentle shaking. Cells were stored in low Ca2+ solution at room temperature and used within 8 h after isolation. All experimental procedures were approved by the Ethics Committee on Animal Use of the University of Leuven.
Measurements of contraction, [Ca2+]i and membrane currents
The setup for combined [Ca2+]i and membrane current recording was as described before (Sipido et al. 1997).
Cell shortening was measured with a video-edge detector (Crescent, Salt Lake City, UT, USA) at 240 Hz frame rate. Field stimulation was done with 5 ms square pulses of constant voltage, at 20 % above threshold. The absolute cell shortening is expressed as the fractional shortening, i.e. normalized to resting cell length, ΔL/L0.
[Ca2+]i was measured with fluo-3, and is reported as the fluorescence normalized to baseline values, after background subtraction, F/F0. For higher frequencies of stimulation the baseline fluorescence increased, and values were normalized to the value at rest, before the onset of stimulation, or 10 s after stopping stimulation. In a subset of voltage clamped cells we calibrated fluo-3 signals after obtaining the Fmax, as described by Trafford et al. (1999). With this method we established that [Ca2+]i of resting myocytes is 108 ± 10 nm (n = 8). To calibrate signals of field-stimulated cells, loaded with fluo-3-AM, we used the approach of Cheng et al. (1993) assuming a Kd of 800 nm and a resting [Ca2+]i of 108 nm.
Membrane currents were sampled at 4 kHz and filtered at 1 kHz. For the global analysis of frequency dependence of Ca2+ release, we used a K+-based pipette solution (mm): 120 potassium aspartate, 20 KCl, 10 Hepes, 5 MgATP, 10 NaCl, 0.05 K5-fluo-3, pH adjusted to 7.2 using KOH, and Tyrode solution with 1 mm CaCl2 as the external solution. For measurements of L-type Ca2+ current, we blocked K+ currents and Cl− concentrations were set to have a reversal potential near 0 mV. For these experiments the pipette solution contained (mm): 130 CsCl, 10 Hepes, 0.5 MgCl2, 4 MgATP (pH 7.2 with CsOH), and the external solution contained (mm): 130 NaCl, 10 CsCl, 11.8 Hepes, 0.5 MgCl2, 1 CaCl2, 10 glucose, with pH 7.4 with NaOH.
To determine SR Ca2+ content, we perfused the cell with 10 mm caffeine for 8 s to empty the stores and extrude Ca2+ via Na+-Ca2+ exchange. The Na+-Ca2+ exchange current was integrated and from the resulting charge we recalculated the amount of Ca2+ released from the SR (Varro et al. 1993). We applied a correction for Ca2+ removal by other pathways of 19 %. This value is based on measurements of the rate of decline of [Ca2+]i in the presence of caffeine and with Na+-Ca2+ exchange blocked with NiCl2 (Varro et al. 1993). The SR Ca2+ content is expressed as [Ca2+] per accessible cell volume, assuming a surface/volume (S/V) ratio of 7.47 pF pl−1, and an accessible fraction of 0.65. The S/V is based on measurements of cell capacity and estimates of cell volume during confocal imaging as described by Satoh et al. (1996). The values are close to those reported for rat ventricular myocytes, a species which like the mouse has an extensive T-tubular network, and are consistent with morphology data from the literature (reviewed in Bers, 2001).
All experiments were done at 30 °C. Different frequencies were tested in random order to minimize time-dependent changes. For statistical analysis we used ANOVA for repeated measurements, with Bonferroni or Tukey post hoc testing; values of P < 0.05 were considered significant. Values are reported as mean ± s.e.m.
RESULTS
Frequency dependence of contraction of unloaded myocytes
Figure 1 shows in the top panel original traces of cell shortening in a myocyte stimulated at 1, 2 and 4 Hz. The amplitude of shortening increased with increasing frequency, but the cell did not relax completely at 2 and 4 Hz. The lower panel summarizes the data for 12 cells. Only one cell has a frank negative response. A few cells have a very pronounced positive response. On average there is a significant increase in the amplitude of shortening at higher stimulation frequencies: ΔL/L0 increases from 0.040 ± 0.007 at 1 Hz, to 0.047 ± 0.005 at 2 Hz, and to 0.069 ± 0.009 at 4 Hz (P < 0.05).
Figure 1. Frequency dependence of cell shortening in mouse myocytes.
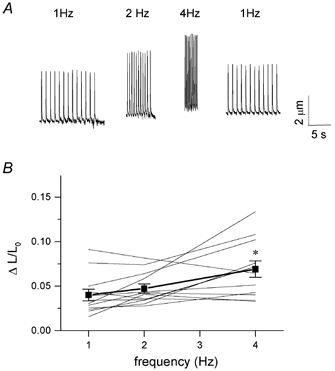
A, example of cell shortening measurements in an unloaded cell, externally stimulated at 1, 2 and 4 Hz, showing a positive frequency response. B, frequency response of amplitude of cell shortening (ΔL), normalized to resting cell length (L0) of individual cells, represented by thin lines, one cell showed a negative response. Average data show an increase in amplitude with increasing stimulation frequency (mean ± s.e.m., n = 12, *P < 0.05 vs. 1 Hz).
Frequency dependence of [Ca2+]i transients
We further studied the underlying mechanisms of the frequency response in whole cell voltage clamp mode. The mouse action potential is very brief and in current clamp mode we found that at 25 ms the membrane had repolarized to values below -50 mV (n = 8, data not shown). In the voltage clamp mode we thus used 25 ms depolarizing steps from -70 to +20 mV. Figure 2A shows in the top panel a typical example of [Ca2+]i transients during this protocol. The peak [Ca2+]i increases with frequency, and so does the baseline [Ca2+]i. The data for all cells is summarized in Fig. 2B. Baseline [Ca2+]i, expressed as F/F0, increases from 1.03 ± 0.01 at 1 Hz to 1.25 ± 0.06 at 2 Hz, and to 1.60 ± 0.10 at 4 Hz; peak [Ca2+]i increases from 2.58 ± 0.08 at 1 Hz to 2.94 ± 0.11 at 2 Hz, and to 3.31 ± 0.08 at 4 Hz (n = 17, P < 0.05). In panel C, the average data for the amplitude of the [Ca2+]i transients, i.e. peak - baseline, is shown. On average there is a small increase in the amplitude: ΔF/F0 increases from 1.56 ± 0.08 at 1 Hz to 1.70 ± 0.11 at 2 Hz and 1.71 ± 0.11 at 4 Hz (n = 17, P < 0.05 for 4 Hz only). This change in amplitude is modest, suggesting there is little increase in SR Ca2+ release.
Figure 2. Frequency dependence of [Ca2+]i transients.
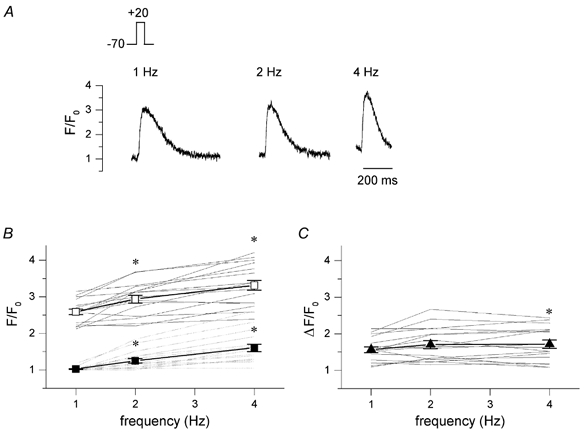
A, original current traces, I, and [Ca2+]i transients, F/F0, recorded in a voltage clamped cell during steady-state stimulation with 25 ms depolarizing steps from -70 to +20 mV at the indicated frequencies. B, individual data for frequency dependence of [Ca2+]i transients, F/F0, showing peak values (continuous lines) and baseline values (dashed lines) of 17 cells. Pooled data show an increase in peak [Ca2+]i (□) and baseline [Ca2+]i (▪) at higher stimulation frequencies (mean ± s.e.m., *P < 0.05 vs. 1 Hz). C, amplitude of the [Ca2+]i transients, ΔF/F0, with increasing stimulation rate (mean ± s.e.m., *P < 0.05 vs. 1 Hz).
We checked that this was not due to the rather short pulses. In three cells, we compared the frequency response with 25 ms pulses to the response with 100 ms pulses. The absolute [Ca2+]i values were larger for the 100 ms pulses, consistent with higher SR content for longer pulse duration (Terracciano et al. 1997), but the relative change with frequency was the same (data not shown).
The lack of significant increase in Ca2+ release at higher frequencies could be the result of a lack of increase in SR Ca2+ content, and/or of a decrease in fractional release due to a decrease in (trigger) Ca2+ current and/or opening of the Ca2+ release channel, the ryanodine receptor, RyR. In the first case, introducing a longer pause during the stimulation will not increase SR Ca2+ release, but in the second case a pause will increase SR Ca2+ release, as it may relieve inactivation of ICa,L and/or RyR. We thus tested these hypotheses in the experiment illustrated in Fig. 3A. Following a train of pulses at 2 and 4 Hz, we introduced a 1 s pause before the next depolarizing test step. The [Ca2+]i transients with this test step, t, were compared to the last [Ca2+]i transient of the conditioning step, c. In the example it can be seen that the [Ca2+]i transients for t are significantly larger than for c at 2 Hz and at 4 Hz, suggesting there is a decrease in ICa,L and/or ryanodine receptor availability. Average data are shown in Fig. 3B, and the differences between test and conditioning pulses are significant (# P < 0.05, n = 5). In this same experiment we also compared the test steps at 2 and 4 Hz with the steady-state at 1 Hz. This analysis shows that for t there is a large increase with frequency (*P < 0.05), suggesting that there is an increase in SR Ca2+ content during the conditioning pulses.
Figure 3. [Ca2+]i transients following 1 s pause after different stimulation frequencies.
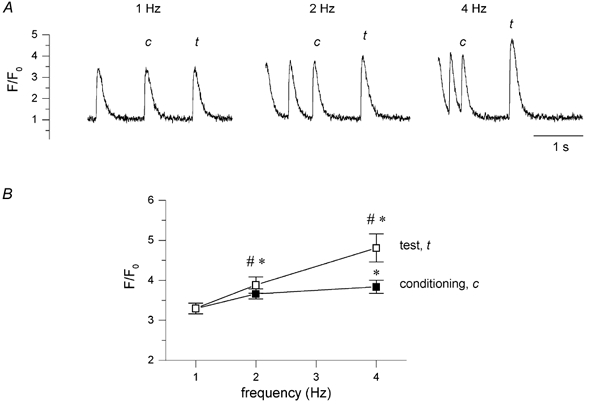
A, typical example of [Ca2+]i transients, F/F0, elicited by a 25 ms depolarizing pulse from -70 to +20 mV following 1 s interval (test pulse, t) after stimulation with 10 conditioning pulses (conditioning, c) at different frequencies of 1, 2 and 4 Hz. B, pooled data of peak [Ca2+]i, F/F0, of the test pulse (□) and of the last conditioning pulse (▪) as a function of increasing stimulation frequency (# P < 0.05 for t vs. c, *P < 0.05 for 2 and 4 Hz vs. 1 Hz, mean ± s.e.m., n = 5).
SR Ca2+ content at different frequencies of stimulation
The SR content was measured by emptying the SR with a fast application of 10 mm caffeine following conditioning pulses to the different frequencies. A typical example is shown in Fig. 4A, with [Ca2+]i transients shown as F/F0 and the membrane current shown as the running integral. Average values are given in panels B and C. Peak of caffeine-induced transients increases with increasing frequency of stimulation (peak F/F0 from 4.86 ± 0.34 at 1 Hz, to 5.86 ± 0.30 at 2 Hz and to 6.75 ± 0.40 at 4 Hz (n = 5, P < 0.05). SR Ca2+ content, calculated from INa,Ca as described in Methods, increases from 91 ± 24 μmm at 1 Hz to 132 ± 17 at 2 Hz and 173 ± 20 μM at 4 Hz (n = 5, P < 0.05).
Figure 4. Frequency dependence of SR Ca2+ content.
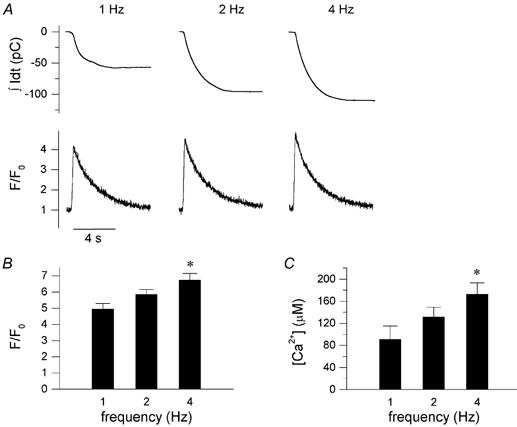
A, typical example of integrated Na+-Ca2+ exchange current, shown as the running integral, and [Ca2+]i transients, F/F0, induced by 8 s application of 10 mm caffeine following a 1 s pause after stimulation with 10 conditioning pulses at the indicated frequency (1, 2 and 4 Hz). B, peak of caffeine-induced transients, F/F0, with increasing frequency of stimulation (mean ± s.e.m., n = 5, P < 0.05). C, SR Ca2+ content, calculated from integrating INa,Ca, and normalized to accessible cell volume, as described in the Methods section (mean ± s.e.m., n = 5, P < 0.05).
In Fig. 5A, we compared the amplitude of the stimulation-induced [Ca2+]i transient to the amplitude of the caffeine-induced [Ca2+]i transient, as a rough approximation of fractional release during stimulation at 1, 2 and 4 Hz. For this we divided the amplitude of the last [Ca2+]i transient of the conditioning train, ΔF/F0 of c, by the amplitude of the caffeine transient, ΔF/F0 of caffeine, evoked at the end of the train. This value decreases from 49 ± 5 % at 1 Hz, to 41 ± 4 % at 2 Hz and to 31 ± 5 % at 4 Hz (n = 5, P < 0.05). In Fig. 5B, we have plotted the ratio of the amplitude of the last [Ca2+]i transient of the conditioning train, ΔF/F0 of c, over the amplitude of the test pulse transient, ΔF/F0 of t (data from Fig. 3). This ratio decreases with frequency, in a manner very similar to the ratio with the caffeine-induced [Ca2+]i transient. These data are consistent with the hypothesis that there is a decrease in the trigger for SR Ca2+ release, or in the availability of the RyR.
Figure 5. Reduced ‘fractional’ release at higher frequencies.
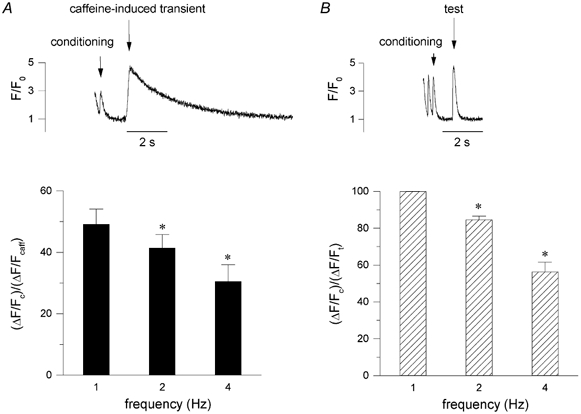
A, the ratio of the amplitude of the [Ca2+]i transients of the conditioning pulses, ΔF/Fc, and the [Ca2+]i transient of caffeine-induced transient ΔF/Fcaff, from experiments as shown in the inset, as an estimate of fractional release (mean ± s.e.m., n = 5, P < 0.05). B, for comparison we also calculated the ratio between the amplitude of the [Ca2+]i transients of the conditioning pulses, ΔF/Fc, relative to the [Ca2+]i transient of the test pulse after a 1 s pause, ΔF/Ft, at different frequencies (mean ± s.e.m., n = 5, P < 0.05). Data from the same experiments as shown in Fig. 3.
Changes in ICa,L with increasing frequency of stimulation
To measure ICa,L we used other solutions than in the previous experiments to exclude contamination by K+ and Na+ currents (see Methods). The test pulse was set to 0, instead of to +20 mV, to prevent a potential contribution of Cl− currents. Figure 6A shows the time course of a typical experiment, recording the amplitude of ICa,L during different frequencies. During each series of pulses there is decrease in peak current, which is largest for the highest frequencies. The current recovers during rest periods in between trains of stimulation at the various frequencies, excluding that this results from rundown of channels. In Fig. 6B, the average loss of peak current for the three frequencies tested is shown. ICa,L is reduced to 88 ± 3 % at 1 Hz, 72 ± 6 % at 2 Hz and 54 ± 8 % at 4 Hz (n = 6, P < 0.05). These data suggest that there is inactivation and incomplete recovery of ICa,L at the higher frequencies.
Figure 6. Frequency dependence of L-type Ca2+ current.
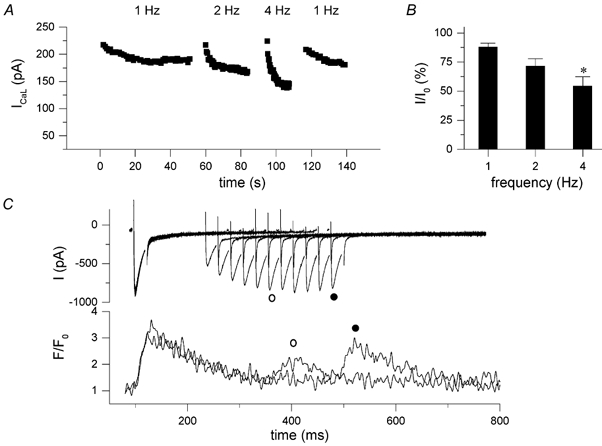
A, time course of a typical experiment measuring ICa,L during stimulation at 1, 2 and 4 Hz with a 10 s interval between the different frequencies, showing absolute peak values of ICa,L at each frequency. ICa,L was measured with 25 ms depolarizing steps from -70 to 0 mV in K+-free internal and external solutions. B, peak of steady-state current, expressed as percentage of I0 (mean ± s.e.m., n = 6). C, recovery from inactivation of ICa,L; a 25 ms depolarizing step from -70 to +20 mV was followed by a test step after a 125 ms interval, and this interval was increased by 25 ms steps, interpulse duration was 10 s.
This was tested more directly during an inactivation-recovery protocol as illustrated in Fig. 6C. At the longest interval of 500 ms, recovery is nearly, but not fully complete. On average ICa,L recovery was 84 ± 3 % at 250 ms and 95 ± 3 % at 500 ms (n = 7). In the example shown, recovery of the [Ca2+]i transient exceeds the time for recovery of the current, suggesting that release itself may recover more slowly. On average, the recovery of the amplitude of the [Ca2+]i transient, ΔF/F0, was 38 ± 6 % at 250 ms and 83 ± 6 % at 500 ms.
We also calculated the impact of the reduction of ICa,L at higher frequencies on the total Ca2+ influx. Using the steady-state data from experiments as shown in Fig. 6, we calculated that the Ca2+ influx via ICa,L was 3.34 ± 0.65 μm l−1 s−1 at 1 Hz, 5.40 ± 1.09 μm l−1 s−1 at 2 Hz and 8.06 ± 1.90 μm l−1 s−1 at 4 Hz (n = 6, normalized to accessible cell volume).
Frequency dependence of decline of [Ca2+]i
To study the changes in relaxation at different frequencies, we measured the half-time of decay of the [Ca2+]i transient at steady-state stimulation. Because the relaxation is incomplete at the higher frequencies, we measured half-time of decay for the last pulse of a train at each frequency. At 1 Hz the half-time is 126 ± 18 ms, at 2 Hz it is 113 ± 13 ms, and at 4 Hz, 105 ± 9 ms. These data indicate that Ca2+ removal is indeed faster at the higher frequencies.
Relation between the frequency dependence of Ca2+ release and of contraction
Comparing the frequency dependence of contractions measured in field-stimulated myocytes (Fig. 1), with the frequency dependence of [Ca2+]i transients measured in voltage clamped cells (Fig. 2), it seems that the contraction- frequency relation is more steep than the [Ca2+]i-frequency relation. Since these were independent measurements with possible confounding factors, we loaded cells with the ester form of fluo-3 and recorded simultaneously [Ca2+]i transients and cells shortening in field-stimulated cells. In these cells, as in Fig. 1B, positive, flat and negative relations were observed. In Fig. 7 we have pooled the data of eight cells with a positive contraction-frequency response, together with the [Ca2+]i-frequency relation. These data support the impression from the previous independent measurements, namely that the increase in contraction amplitude is more pronounced than the increase in the [Ca2+]i transient amplitude. Compared to 1 Hz, shortening amplitude, ΔL/L0, increases approximately 1.2- and 1.8-fold at 2 and 4 Hz respectively, whereas Δ[Ca2+]i increases 1.1- and 1.4-fold.
Figure 7. Simultaneous measurement of cell shortening and [Ca2+]i transients during field stimulation.
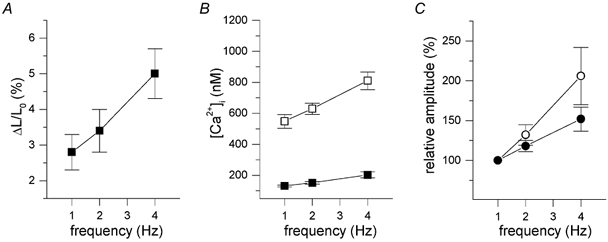
Pooled data of eight cells loaded with fluo-3AM, and calibrated [Ca2+]i signals. A, amplitude of fractional cell shortening. B, peak (□) and basal (▪) [Ca2+]i of transients. C, relative amplitude of cell shortening (○), calculated as percentage of the amplitude at 1 Hz, compared to the relative increase in the amplitude of the [Ca2+]i transients (•).
Discussion
In the mouse, the increase in [Ca2+]i transient amplitude with increasing frequencies of stimulation is modest. An unexpected and novel finding was that the frequency-dependent increase in SR content is actually very steep. At the higher frequencies of stimulation a loss of trigger for release offsets this increase in SR Ca2+ content, resulting in the rather shallow [Ca2+]i-frequency response. This loss of trigger with increasing frequency has not been reported before. We also observed that the increase in contraction amplitude is disproportionately larger than the increase in the [Ca2+]i transient, suggesting that there may be a regulation downstream of [Ca2+]i.
Increase in SR content with increasing frequency of stimulation
The increase in SR content is consistent with reports in other animal species, including healthy humans. The underlying mechanism must be Ca2+ influx exceeding the Ca2+ efflux. We calculated that net influx via ICa,L is indeed larger at the higher frequencies, despite the reduction in peak current. A reduction of Ca2+ efflux via the Na+-Ca2+ exchanger is due to a shorter time spent at diastolic membrane potentials, and to the increase in [Na+]i at higher frequencies (e.g. Cohen et al. 1982; Frampton et al. 1991; Harrison & Boyett, 1995), which would shift the reversal potential of the exchanger to more negative values. On the other hand, the increase in diastolic [Ca2+]i would counteract this shift. In preliminary experiments on mouse myocytes we observed an increase in cytosolic [Na+] in mouse myocytes, but the increase was rather slow compared to the increase in contraction (F. Moccia & K. Mubagwa, unpublished observations). Subsarcolemmal gradients may be more important for shifts in reversal potential of the Na+-Ca2+ exchange, as suggested by recent studies (Su et al. 2001).
Another potential mechanism for the increase in SR content is increased sarco(endo)plasmic reticulum Ca2+-ATPase (SERCA) activity due to Ca2+/calmodulin kinase phosphorylation of PLB (Bassani et al. 1995; Hagemann et al. 2000) or through other pathways (Li et al. 1998). Our results are also consistent with a faster SR uptake at higher frequencies.
Lastly, the decrease in ICa,L at higher frequency and the decrease in fractional release will reduce the Ca2+ efflux via the exchanger and reduce Ca2+-dependent inactivation of ICa,L, thus increasing SR content (Trafford et al. 2001). This and the above mentioned mechanisms are likely to act in concert to increase SR content.
Loss of ICa,L at higher frequencies
In the mouse, the loss of Ca2+ current with stimulation at 2 and 4 Hz is apparently related to slow recovery from inactivation. In our experiments [Ca2+]i was not buffered and Ca2+-dependent mechanisms are likely to be of major importance, as probably also in vivo. The decay of [Ca2+]i is not complete at 250 ms, as can be seen in Fig. 6, and at steady-state 4 Hz stimulation, diastolic [Ca2+]i is clearly elevated. The time course of beat-to-beat decrease in ICa,L does however not occur in parallel with a beat-to-beat increase in diastolic [Ca2+]i. The increase in diastolic [Ca2+]i indeed occurs rather abruptly with the first short stimulation interval (data not shown). [Ca2+]i remains then elevated at the same level, whereas the Ca2+ current continues to decline. One explanation is the accumulation of inactivation, as recovery is incomplete. Another factor may be that the subsarcolemmal [Ca2+] is more elevated.
The pronounced decrease of ICa,L with frequency in normal mouse myocytes has not yet been described. We have however previously observed a loss of ICa,L with frequent stimulation in myocytes from failing human hearts, where it will contribute to the negative staircase typical of heart failure (Sipido et al. 1998). The loss of ICa,L in the human failing heart occurs at lower frequencies of stimulation (0.5, 1 and 2 Hz), but is also due to slow recovery from inactivation. In the case of the failing heart, the slow removal of Ca2+ by the SR has a role in the current inactivation. This loss of ICa,L leads to a decrease in the plateau values of the action potential. Li et al. (1999) have also observed a loss of ICa,L at higher frequencies of stimulation in human myocytes from the right ventricle (RV) of failing hearts. These authors could show that shortening of the action potential at these higher frequencies is the result of a decrease in ICa,L. The decrease in ICa,L at higher frequencies in patients is an important mechanism in the negative staircase, and helps to explain the beneficial effects of slowing the heart rate. Our observations in the mouse indicate that this phenomenon may more common than we thought, and may be present in healthy cardiac muscle.
The combination of a reduced ICa,L and increasing SR Ca2+ content at higher frequencies predicts that the effect of pause as e.g. after an ectopic beat, may have major consequences for both the action potential time course and the amplitude of contraction, because of enhanced recovery of ICa,L and increased Ca2+ release. This mechanism could be important for arrhythmogenesis.
Our findings of a pronounced loss of ICa,L contrasts with several reports on frequency-dependent potentiation of ICa,L, which also appears to be Ca2+-dependent (see e.g. Zygmunt & Maylie, 1990; Bates & Gurney, 1993; and review in Anderson, 2001). Probably both potentiation and inhibition can occur, and a potential explanation is that both phenomena have a different sensitivity to Ca2+. Potentiation is usually observed with small increases in [Ca2+]i when there is moderate [Ca2+]i buffering, e.g. with EGTA (Fedida et al. 1988a; Hryshko & Bers, 1990; Zygmunt & Maylie, 1990). Without [Ca2+]i buffering and with larger increases in [Ca2+]i inhibition occurs (Fedida et al. 1988b). The mechanisms of such a double response remain however elusive. Recent mutational analysis of the α1 subunit identified Ca2+/calmodulin binding sites, but the same sites were involved in facilitation as well as inactivation (Zuhlke et al. 2000).
Our data cannot exclude that slow recovery from inactivation of the RyR (reviewed in Bers, 2001) also contributes to the reduced fractional release at higher frequencies. The data of Fig. 6 could be interpreted this way, as Ca2+ release recovers more slowly than ICa,L. However, as we compare the recovery to a first beat after a 10 s pause, it is possible that the SR Ca2+ content is not the same. We therefore cannot establish with certainty the role of RyR recovery.
Relation between the [Ca2+]i and contraction response to frequency
An additional finding was that contraction increased more steeply with frequency, than the amplitude of the [Ca2+]i transient. This is consistent with the previous report by Gao et al. (1998) who measured simultaneously [Ca2+]i and isometric contractions in trabeculae of mouse hearts at room temperature. A phase-plane analysis of force vs. [Ca2+]i showed that the relation between [Ca2+]i and force was dependent on the stimulation frequency, and steeper at higher frequencies. This is an unusual finding not reported in other animal species. The ‘sensitization’ of myofilaments at higher frequencies could be related to the increase in diastolic [Ca2+]i which may affect phosphorylation of myosin light chains (Morano et al. 1990). The lack of full relaxation of the cell at higher frequencies may be related to such a sensitization phenomenon. Another explanation is that the shift in diastolic [Ca2+]i moves the starting point of the contraction more towards the steep part of the tension-pCa relation. Indeed, the tension-pCa reported by Gao et al. (1998) has a shallow foot, but is then very steep for [Ca2+]i above 500 nm. Although calibration of fluo-3 is not as reliable as for fura-2, our estimate is that basal [Ca2+]i increases from 108 ± 10 nm to 208 ± 30 nm (n = 10) at 4 Hz. This is still below the activation level for contraction, but would reduce the required increase in [Ca2+]i for contraction.
Conclusions
In the mouse the response of contraction to increased frequency of stimulation is a fine balance between positive factors and negative factors, and the frequency response may thus be very sensitive to small changes in any of these factors. This may explain the existence of variability between cells, or between different mouse strains. Indeed, some authors have described a frank negative staircase (Wolska & Solaro, 1996; Ashley et al. 2001). The increase in baseline [Ca2+]i at higher frequencies is likely to be important in the regulation of the frequency response. Higher basal [Ca2+]i may be involved in the loss of ICa,L, but also in the increased contractile response, and perhaps in increased SERCA activity by promoting Ca2+-dependent phosphorylation.
Acknowledgments
This study was supported by the FWO, the Flanders Fund for Scientific Research (K.R.S., K.M.).
References
- Anderson ME. Ca2+-dependent regulation of cardiac L-type Ca2+ channels: is a unifying mechanism at hand? Journal of Molecular and Cellular Cardiology. 2001;33:639–650. doi: 10.1006/jmcc.2000.1354. [DOI] [PubMed] [Google Scholar]
- Bassani RA, MattiaIZZ A, Bers DM. CaMKII is responsible for activity-dependent acceleration of relaxation in rat ventricular myocytes. American Journal of Physiology. 1995;268:H703–712. doi: 10.1152/ajpheart.1995.268.2.H703. [DOI] [PubMed] [Google Scholar]
- Bates SE, Gurney AM. Ca2+-dependent block and potentiation of L-type calcium current in guinea-pig ventricular myocytes. Journal of Physiology. 1993;466:345–365. [PMC free article] [PubMed] [Google Scholar]
- Baudet S, Do E, Noireaud J, Le-Marec H. Alterations in the force-frequency relationship by tert-butylbenzohydroquinone, a putative SR Ca2+ pump inhibitor, in rabbit and rat ventricular muscle. British Journal of Pharmacology. 1996;117:258–267. doi: 10.1111/j.1476-5381.1996.tb15185.x. [DOI] [PMC free article] [PubMed] [Google Scholar]
- Bers DM. Excitation-Contraction Coupling and Cardiac Contractile Force. The Netherlands: Kluwer Academic Publishers; 2001. [Google Scholar]
- Bers DM, Christensen DM. Functional interconversion of rest decay and ryanodine effects in rabbit and rat ventricle depends on Na/Ca exchange. Journal of Molecular and Cellular Cardiology. 1990;22:715–723. doi: 10.1016/0022-2828(90)91014-x. [DOI] [PubMed] [Google Scholar]
- Cheng H, Lederer WJ, Cannell MB. Calcium sparks: elementary events underlying excitation-contraction coupling in heart muscle. Science. 1993;262:740–744. doi: 10.1126/science.8235594. [DOI] [PubMed] [Google Scholar]
- Cohen CJ, FoARDZZ HA, Sheu SS. Increase in intracellular sodium ion activity during stimulation in mammalian cardiac muscle. Circulation Research. 1982;50:651–662. doi: 10.1161/01.res.50.5.651. [DOI] [PubMed] [Google Scholar]
- Fedida D, Noble D, Spindler AJ. Use-dependent reduction and facilitation of Ca2+ current in guinea-pig myocytes. Journal of Physiology. 1988a;405:439–460. doi: 10.1113/jphysiol.1988.sp017341. [DOI] [PMC free article] [PubMed] [Google Scholar]
- Fedida D, Noble D, Spindler AJ. Mechanism of the use dependence of Ca2+ current in guinea-pig myocytes. Journal of Physiology. 1988b;405:461–475. doi: 10.1113/jphysiol.1988.sp017342. [DOI] [PMC free article] [PubMed] [Google Scholar]
- Frampton JE, Harrison SM, Boyett MR, Orchard CH. Ca2+ and Na+ in rat myocytes showing different force-frequency relationships. American Journal of Physiology. 1991;261:C739–750. doi: 10.1152/ajpcell.1991.261.5.C739. [DOI] [PubMed] [Google Scholar]
- Gao WD, Perez NG, Marban E. Calcium cycling and contractile activation in intact mouse cardiac muscle. Journal of Physiology. 1998;507:175–184. doi: 10.1111/j.1469-7793.1998.175bu.x. [DOI] [PMC free article] [PubMed] [Google Scholar]
- Georgakopoulos D, Kass DA. Minimal force-frequency modulation of inotropy and relaxation of in situ murine heart. Journal of Physiology. 2001;534:535–545. doi: 10.1111/j.1469-7793.2001.00535.x. [DOI] [PMC free article] [PubMed] [Google Scholar]
- Gwathmey JK, Slawsky MT, Hajjar RJ, Briggs GM, Morgan JP. Role of intracellular calcium handling in force-interval relationships of human ventricular myocardium. Journal of Clinical Investigation. 1990;85:1599–1613. doi: 10.1172/JCI114611. [DOI] [PMC free article] [PubMed] [Google Scholar]
- Hagemann D, Kuschel M, Kuramochi T, Zhu W, Cheng H, Xiao RP. Frequency-encoding Thr17 phospholamban phosphorylation is independent of Ser16 phosphorylation in cardiac myocytes. Journal of Biological Chemistry. 2000;275:22532–22536. doi: 10.1074/jbc.C000253200. [DOI] [PubMed] [Google Scholar]
- Harrison SM, Boyett MR. The role of the Na+-Ca2+ exchanger in the rate-dependent increase in contraction in guinea-pig ventricular myocytes. Journal of Physiology. 1995;482:555–566. doi: 10.1113/jphysiol.1995.sp020539. [DOI] [PMC free article] [PubMed] [Google Scholar]
- Henderson AH, Brutsaert DL, Forman R, Sonnenblick EH. Influence of caffeine on force development and force-frequency relations in cat and rat heart muscle. Cardiovascular Research. 1974;8:162–172. doi: 10.1093/cvr/8.2.162. [DOI] [PubMed] [Google Scholar]
- Herr C, Smyth N, Ullrich S, Yun F, Sasse P, Hescheler J, Fleischmann B, Lasek K, Brixius K, Schwinger RH, Fassler R, Schroder R, Noegel AA. Loss of annexin A7 leads to alterations in frequency-induced shortening of isolated murine cardiomyocytes. Molecular Cell Biology. 2001;21:4119–4128. doi: 10.1128/MCB.21.13.4119-4128.2001. [DOI] [PMC free article] [PubMed] [Google Scholar]
- Hryshko LV, Bers DM. Calcium current facilitation during post-rest recovery depends on Ca entry. American Journal of Physiology. 1990;259:H951–961. doi: 10.1152/ajpheart.1990.259.3.H951. [DOI] [PubMed] [Google Scholar]
- Kadambi VJ, Ball N, Kranias EG, Walsh RA, Hoit BD. Modulation of force-frequency relation by phospholamban in genetically engineered mice. American Journal of Physiology. 1999;276:H2245–2250. doi: 10.1152/ajpheart.1999.276.6.H2245. [DOI] [PubMed] [Google Scholar]
- Koch-Weser J, Blinks JR. The influence of the interval between beats on myocardial contractility. Pharmacological Reviews. 1963;15:601–652. [PubMed] [Google Scholar]
- Layland J, Kentish JC. Positive force- and [Ca2+]i frequency relationships in rat ventricular trabeculae at physiological frequencies. American Journal of Physiology. 1999;276:H9–18. doi: 10.1152/ajpheart.1999.276.1.H9. [DOI] [PubMed] [Google Scholar]
- Li GR, Yang B, Feng J, Bosch RF, Carrier M, Nattel S. Transmembrane ICa contributes to rate-dependent changes of action potentials in human ventricular myocytes. American Journal of Physiology. 1999;276:H98–106. doi: 10.1152/ajpheart.1999.276.1.H98. [DOI] [PubMed] [Google Scholar]
- Li L, Chu G, Kranias EG, Bers DM. Cardiac myocyte calcium transport in phospholamban knockout mouse: relaxation and endogenous CaMKII effects. American Journal of Physiology. 1998;274:H1335–1347. doi: 10.1152/ajpheart.1998.274.4.H1335. [DOI] [PubMed] [Google Scholar]
- Morano I, Rosch J, Arner A, Ruegg JC. Phosphorylation and thiophosphorylation by myosin light chain kinase: different effects on mechanical properties of chemically skinned ventricular fibers from the pig. Journal of Molecular and Cellular Cardiology. 1990;22:805–813. doi: 10.1016/0022-2828(90)90091-f. [DOI] [PubMed] [Google Scholar]
- Mubagwa K, Wei Lin Sipido KR, Bosteels S, Flameng W. Monensin-induced reversal of positive force-frequency relationship in cardiac muscle: role of intracellular sodium in rest-dependent potentiation of contraction. Journal of Molecular and Cellular Cardiology. 1997;29:977–989. doi: 10.1006/jmcc.1996.0342. [DOI] [PubMed] [Google Scholar]
- Mulieri LA, Hasenfuss G, Leavitt B, Allen PD, Alpert NR. Altered myocardial force-frequency relation in human heart failure. Circulation. 1992;85:1743–1750. doi: 10.1161/01.cir.85.5.1743. [DOI] [PubMed] [Google Scholar]
- Pieske B, Maier LS, Bers DM, Hasenfuss G. Ca2+ handling and sarcoplasmic reticulum Ca2+ content in isolated failing and nonfailing human myocardium. Circulation Research. 1999;85:38–46. doi: 10.1161/01.res.85.1.38. [DOI] [PubMed] [Google Scholar]
- Satoh H, Delbridge LM, Blatter LA, Bers DM. Surface:volume relationship in cardiac myocytes studied with confocal microscopy and membrane capacitance measurements: species-dependence and developmental effects. Biophysical Journal. 1996;70:1494–1504. doi: 10.1016/S0006-3495(96)79711-4. [DOI] [PMC free article] [PubMed] [Google Scholar]
- Sipido KR, Maes MM, Van De Werf F. Low efficiency of Ca2+ entry through the Na/Ca exchanger as trigger for Ca2+ release from the sarcoplasmic reticulum. Circulation Research. 1997;81:1034–1044. doi: 10.1161/01.res.81.6.1034. [DOI] [PubMed] [Google Scholar]
- Sipido KR, Stankovicova T, Flameng W, Vanhaecke J, Verdonck F. Frequency dependence of Ca2+ release from the sarcoplasmic reticulum in human ventricular myocytes from end-stage heart failure. Cardiovascular Research. 1998;37:478–488. doi: 10.1016/s0008-6363(97)00280-0. [DOI] [PubMed] [Google Scholar]
- Su Z, Sugishita K, Ritter M, Li F, Spitzer KW, Barry WH. The sodium pump modulates the influence of INa on [Ca2+]i transients in mouse ventricular myocytes. Biophysical Journal. 2001;80:1230–1237. doi: 10.1016/S0006-3495(01)76099-7. [DOI] [PMC free article] [PubMed] [Google Scholar]
- Terracciano CM, Tweedie D, Macleod KT. The effects of changes to action potential duration on the calcium content of the sarcoplasmic reticulum in isolated guinea- pig ventricular myocytes. Pflügers Archiv. 1997;433:542–544. doi: 10.1007/s004240050312. [DOI] [PubMed] [Google Scholar]
- Trafford AW, Diaz ME, Eisner DA. A novel, rapid and reversible method to measure Ca buffering and time-course of total sarcoplasmic reticulum Ca content in cardiac ventricular myocytes. Pflügers Archiv. 1999;437:501–503. doi: 10.1007/s004240050808. [DOI] [PubMed] [Google Scholar]
- Trafford AW, Diaz ME, Eisner DA. Coordinated control of cell Ca2+ loading and triggered release from the sarcoplasmic reticulum underlies the rapid inotropic response to increased L-type Ca2+ current. Circulation Research. 2001;88:195–201. doi: 10.1161/01.res.88.2.195. [DOI] [PubMed] [Google Scholar]
- Varro A, Negretti N, Hester SB, Eisner DA. An estimate of the calcium content of the sarcoplasmic reticulum in rat ventricular myocytes. Pflügers Archiv. 1993;423:158–160. doi: 10.1007/BF00374975. [DOI] [PubMed] [Google Scholar]
- Wolska BM, Solaro RJ. Method for isolation of adult mouse cardiac myocytes for studies of contraction and microfluorimetry. American Journal of Physiology. 1996;271:H1250–1255. doi: 10.1152/ajpheart.1996.271.3.H1250. [DOI] [PubMed] [Google Scholar]
- Zuhlke RD, Pitt GS, Tsien RW, Reuter H. Ca2+-sensitive inactivation and facilitation of L-type Ca2+ channels both depend on specific amino acid residues in a consensus calmodulin-binding motif in the(alpha)1C subunit. Journal of Biological Chemistry. 2000;275:21121–21129. doi: 10.1074/jbc.M002986200. [DOI] [PubMed] [Google Scholar]
- Zygmunt AC, Maylie J. Stimulation-dependent facilitation of the high threshold calcium current in guinea-pig ventricular myocytes. Journal of Physiology. 1990;428:653–671. doi: 10.1113/jphysiol.1990.sp018233. [DOI] [PMC free article] [PubMed] [Google Scholar]


