

Abstract
A new method for the determination of hydraulic conductivity in individually perfused microvessels in vivo is described. A vessel is cannulated at both ends with glass micropipettes and the fluid filtration rate across the vessel wall measured from the velocities of red cells when the pressure in the micropipettes is balanced. Hydraulic conductivity measured using this double-cannulation method (2.6 (± 0.9) × 10−7 cm s−1 cmH2O−1) was not significantly different from that measured using a previously described technique in the same vessel (2.4 (± 0.9) × 10−7 cm s−1 cmH2O−1 using the Landis-Michel method). Shear stress on the vessel wall was controlled by changing the difference between the inflow and outflow pressures during periods of perfusion. The volume flow through the vessel, calculated from red cell velocity either in the vessel or in the pipette, was linearly proportional to this pressure difference. Higher flow rates could only be calculated from red cell velocities in the micropipette. There was no relationship between the imposed shear stress and intervening measurements of hydraulic conductivity (r = 0.029). This novel technique has advantages over the Landis-Michel method, which include the control of outflow resistance, the measurement of shear stress under conditions of controlled pressure, the elimination of compression damage to the vessel (since vessel occlusion is not necessary) and assessment of hydraulic conductivity over the same length of vessel throughout the experiment. The measurement of solute concentrations by indwelling micropipette electrodes and the collection of perfusate for analysis are other possibilities.
The effect of shear stress on vascular permeability is, despite numerous investigations, still controversial. There is evidence that potassium permeability increases with increased shear stress (Kajimura et al. 1998). However, hydraulic conductivity (permeability to water, Lp) appears not to change (Head et al. 1996) and neither does the endothelial calcium concentration, which is often increased when Lp is increased (Head et al. 1996; Curry et al. 2000). Furthermore, the permeability to small proteins appears to decrease with chronically increased shear stress (Huxley & Parker, 2000).
Over the last 30 years, the development of techniques to measure capillary permeability in individual microvessels has enabled the elucidation of many of the mechanisms that regulate fluid exchange (Curry et al. 1983; Michel & Curry, 1999). One of the most powerful of these methods, the Landis-Michel technique, has been used to determine the Lp of capillaries and post-capillary venules by measurement of the fluid filtration rate in cannulated vessels during an imposed hydrostatic or oncotic pressure gradient (Michel et al. 1974). The Lp is measured after a period of perfusion by occluding the vessel with a glass rod to equilibrate the pressure in the vessel to the driving pressure. Any movement of marker red cells in the occluded vessel will therefore be due to filtration or absorption of fluid across the vessel wall, which can be calculated from the surface area of the vessel wall and the velocity of the cells. Lp is calculated as the filtration rate per unit area per unit pressure.
This technique has been applied to the measurement of capillary permeability in vivo under conditions of increased pressure (Neal & Michel, 1996), thermal insult (Neal & Michel, 1992), stimulation of intracellular signalling pathways (Rumbaut et al. 1995), synthetic (Neal & Michel, 1995) and endogenous inflammatory mediators (Michel & Kendall, 1997) and angiogenic cytokines (Bates & Curry, 1996). The effects of shear stress on Lp have only been measured by correlating the measured permeability with the shear stress in the vessel before cannulation (Williams, 1999). Techniques that determine permeability parameters other than hydraulic conductivity have been used, and it has been shown that the effects depend on the parameters measured. For instance, permeability to potassium ions (Kajimura et al. 1998) and sodium fluorescein (Montermini et al. 2001b) is dependent on shear rate, but the permeability to macromolecules is not (Huxley & Parker, 2000). It is difficult to measure the effect of shear stress on Lp using the Landis-Michel technique, since in order to make measurements it is necessary to occlude the vessel, reducing the flow and shear rate to zero. It is possible to measure Lp during occlusion in between periods of shear, but in the Landis-Michel singlecannulation technique, the shear rate in the vessel is dependent on the flow along the vessel, which is dependent on the difference between the inflow and outflow resistances. The outflow resistance in these experiments is dependent on the downstream resistance of the microcirculation of the animal, and therefore cannot be controlled easily without changing the perfusion pressure. This resistance can be highly variable and depends on the pressure and diameter of the vessels downstream of the cannulated vessel.
Measurements of permeability (specifically the diffusive permeability to potassium ions) have been made in singly perfused capillaries under conditions of controlled shear stress by partial occlusion of the vessel (Kajimura et al. 1998). However, this technique could not be used to measure hydraulic conductivity between periods of controlled shear stress, as partial occlusion of the vessel resulted in a highly variable outflow resistance as the perfused red-cell markers either pass or clog the partial occlusion. We have therefore modified the Landis-Michel technique to develop a system where inflow and outflow pressures can be controlled, so that shear stress can be accurately calculated and Lp measured in between periods of controlled shear stress.
METHODS
All animal experiments used procedures conforming to Schedule 1 of the UK Animals (Scientific Procedures) Act 1986. Frogs (Rana temporaria) were stunned and pithed, and a small incision was made in the lateral body wall. The gut was teased out of the body cavity and laid around the top of a Perspex pillar, and the mesentery resting on the pillar surface was superfused with frog Ringer solution (111 mM NaCl, 2.4 mM KCl, 1 mM MgSO4, 1.1 mM CaCl2, 5.5 mM glucose, 0.20 mM NaHCO3, 2.63 mM N-2- hydroxyethylpiperazine-N'-2-ethanesulphonic (Hepes) acid and 2.37 mMHepes sodium salt).
Three water manometers were required in the system to achieve perfusion and to measure permeability: an inflow, an outflow and a pressure-balancing manometer (Fig. 1). The inflow manometer (either m1 or m2, Fig. 1) was defined as the manometer set at the higher pressure. Both inflow and outflow manometers were used to control the flow in the vessel during perfusion. The balance manometer (mb, Fig. 1) could be switched to the right micropipette and could be controlled down to less than 1 mmH2O using an attached syringe in which the plunger could be advanced or withdrawn by a screw (ss, Fig. 1). The other micropipette contained an insert along which the micropipette contents could be replaced in an isovolumetric, isobaric manner (perfusion pressure maintained) from a refiller (Neal, 1998; R, Fig. 1). The refiller (R) could be isolated from the refill micropipette using two taps (t1, t2, Fig. 1).
Figure 1. Diagram of the manometer and tubing network designed to measure permeability and volume flow rate or shear stress in a microvessel (v) using the double-cannulation method.
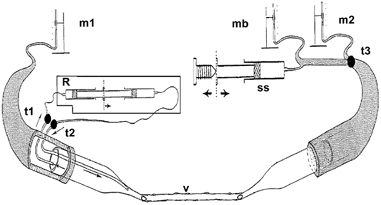
Manometers m1 and m2 were used for perfusion with the inlet micropipette (either m1 or m2) connected to the manometer set at the highest pressure. The balance manometer (mb) could be selected with tap t3 to balance the pressure from m1, enabling stopped-flow measurements of red cell movement to calculate fluid filtration. A screw controlling syringe ss was used to finely control the pressure level in mb and the right micropipette to obtain stopped flow. With taps t1 and t2 open, the micropipette refiller (R) could refill the left micropipette with new solutions during perfusion.
Long, straight, unbranching capillaries and venular capillaries up to 2 mm long with no noticeable change in diameter were selected, and a glass restraining rod (fire polished 50 μm diameter tip) positioned to hold the mesentery down on the pillar close to the vessel. Vessels were cannulated with bevelled micropipettes of similar diameter to the microvessel and perfused with Ringer solution containing 1% bovine serum albumin (BSA: 10 mg ml_1) and marker red cells at a pressure between 15 and 35 cmH2O. A second restrainer was placed at the other end of the vessel and a second micropipette filled with 1% BSA in Ringer inserted in the opposite direction to the first to act as an outflow micropipette. The driving pressure in the manometer connected to the second micropipette was initially set lower than the first micropipette to enable perfusion (Figs 1 and 2B).
Figure 2. Diagram to show singly and doubly cannulated microvessels.
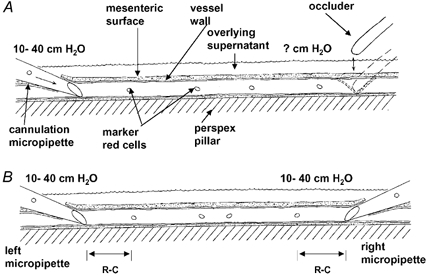
A, the established (Landis-Michel) method for measurement of hydraulic conductivity involves occlusion of the vessel downstream of the cannulation. The outflow pressure is unknown during perfusion. B, in the double-cannulation technique a pipette is used to cannulate downstream of the original cannulation site in an anterograde direction to enable control of the outflow pressure and therefore the flow rate through the vessel.
Initially, flow was optimised by adjusting the position of each micropipette until red cell velocities were maximal with a smooth flow transition from the micropipette to the microvessel and into the second micropipette. After flow had been optimised, vessels were perfused with the inflow pressure set at 35 cmH2O and the outflow at either 10, 15, 20, 25 or 30 cmH2O, so that a set rate flow could be established along the vessel length at pressure differences of 25, 20, 15, 10 and 5 cmH2O. Red cell velocities were video recorded during perfusion in the micropipette (vM) and these recordings were later used to calculate the volume flow rate or the shear stress in the microvessel (see below).
For comparison, microvascular red cell velocities were measured during perfusion in the capillary (vC) by video recording the field of view while panning the microscope between the two cannulation sites and measuring frame-to-frame red cell displacements relative to fixed markers.
Calculation of volume flux and shear stress
Volume flux through the system (Q̇) was calculated by multiplying the red cell velocity in the micropipette (vM) or vessel (vC) by the cross-sectional area of the fluid front in the micropipette of radius vM, or vessel of radius vC:
.
Shear stress (τ) was calculated from the shear rate (sR) multiplied by the viscosity of the perfusate(η) and sR was calculated from fluid velocity in the vessel (vC) divided by the vessel radius (rC), measured from still video frames:
| (1) |
| (2) |
| (3) |
Mean vC was derived from the micropipette fluid velocity assuming that fluid losses in the vessel during perfusion were negligible, so that volume flow through the micropipette (Q̇M) would equal volume flow through the microvessel (Q̇C):
| (4) |
| (5) |
| (6) |
.
| (7) |
Shear stress can also be calculated from the pressure difference between the inflow and outflow pipette (eqn (8)). The shear rate between the micropipette tips was calculated using this equation for comparison with the velocity derived shear stress (eqn (7)):
| (8) |
where dP is the pressure difference between the micropipette tips (initially assumed to be close to the manometer pressure), and lC is the distance between the micropipette tips.
Calculation of Lp
Double-cannulation method
Lp values in doubly cannulated vessels were generated by measuring fluid filtration when the pressure was balanced. Pressure was balanced to the highest (inflow) pressure from the cannulated micropipettes (35 cmH2O) as this gave a higher driving pressure for fluid filtration through the microvascular walls.
After an initial perfusion period at a selected pressure difference between the two cannulation sites, the pressure from the balance manometer (preset close to the inflow pressure) was switched through to the outflow micropipette. During the first few ‘pressure balances’ pressure was raised or lowered (using the screw syringe) to reduce or stop red cells moving in the vessel close to one cannulation site. Perfusion was resumed and in subsequent periods of pressure balance the velocity of red cells was video recorded at various distances from each cannulation site (R-C, Fig. 2B).
Rather than introduce another microscope into the experimental area and video the red cell movements simultaneously at the two cannulation sites, the existing video microscope was adjusted so that it could be moved rapidly on its mountings between two adjustable ‘end stops’. In this way, one of the cannulation sites was recorded for 2–5 s before rapidly moving to the other cannulation site.
During pressure balance with no perfusion occurring, red cell velocities were video recorded in the vessel close to the left and right micropipette and later measured on a calibrated monitor. These velocities were used to calculate the differences in red cell velocity due to fluid exchange across the vessel wall area between the two sets of red cells. Fluid filtration rates per unit area of the vessel wall were calculated from the difference in red cell velocities during pressure balance (dvB):
| (9) |
where vL is red cell velocity at pressure balance close to the left micropipette and vR is the red cell velocity at pressure balance close to the right micropipette.
The fluid filtration rate per unit area of the wall (JV/A) was calculated by multiplying dvB by the cross-sectional area of the vessel to determine the volume flow rate of fluid exchange across the vessel wall between the two red cells. This fluid filtration rate (JV) was divided by the area of the vessel wall between the red cells (the wall area where the fluid was exchanged; eqn (10)):
 |
(10) |
where lR is the mean distance between the red cells used to measure vL and vR.
Lp was calculated from the Starling equation (eqn (11)) by dividing JV/A by the pressure difference across the vessel wall:
 |
(11) |
where σΔπ is the effective oncotic pressure difference (effective colloid osmotic pressure) of 1% BSA (2.5 cmH2O), ΔP is the hydrostatic pressure difference across the capillary wall and Pc the pressure in the vessel lumen; the mesenteric interstitial hydrostatic pressure Pi has been measured previously and is close to zero (Kajimura et al. 2001). Since the manometer pressure during pressure balance Pmb (when perfusion has ceased) is equal to Pc:
 |
(12) |
From eqn (12), the Lp of 1% BSA-perfused vessels can be simply calculated by dividing JV/A by Pmb minus 2.5 cmH2O.
In three vessels perfused with 5% BSA where JV/A was estimated at two or more balance pressures, Lp was calculated from the slope of the pressure filtration plot (dividing the difference in JV/A by the difference in pressures; Fig. 10):
| (11) |
Figure 10. Filtration rate plotted against hydrostatic pressure in a single microvessel perfused with 5% BSA using the double-cannulation pressure-balance method.
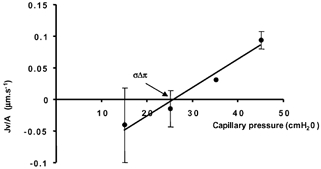
When the pressure was balanced at 15, 25, 35 or 45 cmH2O, the pressure in the manometer Pmb was equal to the capillary pressure Pc. The mean value of all the filtration rates fitted a linear relationship with a slope (Lp) of 4.5 (± 1.1) w 10−7 cm s−1 cmH2O−1; r2 = 0.97. The pressure axis intercept (σΔπ, or the effective colloid osmotic pressure) was 25.8 cmH2O.
Single-cannulation (micro-occlusion) technique
Lp values were generated using the Landis-Michel micro-occlusion technique (Michel et al. 1974; Neal & Michel, 1992) either prior to the insertion of the second micropipette or after the doublecannulation experiment. Briefly, a fire-polished glass rod was used to occlude the microvessel either downstream of the potential second cannulation site or upstream of the second cannulation site after the experiment. Red cell velocities were recorded at one or two pressures in the occluded lengths of vessel and were later used to calculate the exchange of fluid across the walls of the vessel between red cell and occluder. Lp was calculated as the fluid filtration rate per unit area of the vessel wall per unit pressure applied from the manometer during occlusion (see eqn (11)).
RESULTS
The effect of partial occlusion on shear stress
In order to determine whether partial occlusion of singly cannulated capillaries could be used to determine the Lp between periods of controlled shear stress, the shear stress was measured in four vessels during perfusion at 15 cmH2O and partial occlusion at 30 cmH2O. Figure 3 shows a representative example of the variation in shear stress during a partial occlusion. There was significant variation in shear stress during occlusion that did not significantly change during partial occlusion at a higher pressure. During partial occlusion, the shear stress varied by over one order of magnitude, even though the inflow manometer pressure was constant (30 cmH2O).
Figure 3. Shear stress (τ) in a single microvessel perfused at 15 cmH2O and perfused at partial occlusion at 30 cmH2O to reduce flow and shear rate.
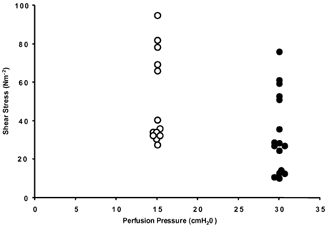
There was a large variation in shear stress for a set perfusion pressure (over an order of magnitude). This made it impossible to determine the relationship between shear stress and hydraulic conductivity.
Measurement of perfusion flow through doublecannulated capillaries
In order to determine whether measurement of fluid flow through the capillary could be accurately assessed by micropipette fluid flow at different pressures, volume flows were assessed in the pipette and vessel in three different vessels. These were the only three vessels where red cell velocities were low enough to be measured by video analysis of a panned microscope image. Figure 4 shows a representative example of the effect of increasing the pressure drop between the inflow and outflow pipettes on the volume flow measured in either the vessel or the pipette in a single experiment. The velocity of the red cells was highest in the vessel (the vessel being the narrowest part of the system) so that at higher flow rates (higher pressure differences) it was difficult to accurately assess the red cell velocity in the vessel in frame-by-frame analysis of the videotape. This is demonstrated in Fig. 4, where the volume flux measured in the pipette was linear with increasing pressure drop and the same as the volume flux estimated in the vessel up to a flow rate of 2 nl s−1. Once flow increased above 2 nl s−1, the volume flows were underestimated (the red cells in the vessel moved faster than could be accurately determined by frame-by-frame video analysis). Since the volume flux measured in the micropipette increased linearly with the pressure drop, these values were used in subsequent calculations rather than the volume flux estimated from the velocities in the vessel.
Figure 4. Microvascular volume flux or shear stress in a single microvessel estimated at various pressure differences set by an inflow pressure of 35 cmH2O and variable outflow pressures.
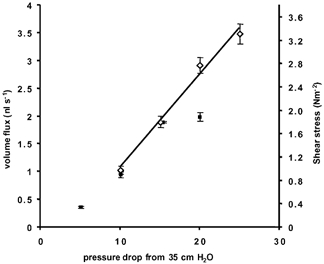
The red cell velocities used to calculate the volume flux or shear stress (mean ± s.e.m.) were measured in the microvessel (▪) or the micropipette (⋄). The line shows the relationship between pressure and flow (or shear stress) measured in the pipette.
Figure 5 shows a representative example of vessels (n = 4) where volume flux was determined by calculations of red cell velocity in both the inflow and the outflow pipettes. There was no significant difference between the volume flux determined from velocity values measured in either the inflow or outflow pipettes, showing that the conductivity of the system measured at the inflow or outflow was not significantly different (see Fig. 5).
Figure 5. Comparison of volume flux measured in the inflow or outflow micropipette during various pressure drops.
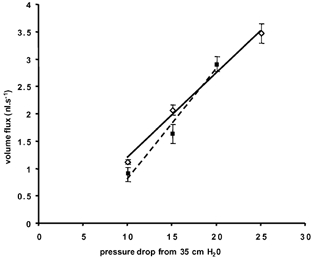
Volume flux (mean ± s.e.m.) in a single microvessel calculated from red cell velocities in the inflow (▪, dashed line, r2 = 0.977) or outflow micropipette (3, continuous line, r2 = 0.994). There were no significant differences between the two slopes (P > 0.1, t test).
Comparison of the two methods of estimating shear stress
In four vessels, the shear stress was calculated from the velocity (τ) and the pressure difference (τ′). The shear stress calculated from the velocity was between 4 and 93% of that calculated from the pressure difference. It appeared that during perfusion the pressure difference between the micropipette tips (the vessel length) was much less than the pressure difference between the perfusion manometers. Therefore there must be a pressure gradient from the wide regions of the micropipette barrel (of similar dimensions to the manometer and tubing) to the micropipette tip. Figure 6 shows the relationship between τ and τ′ for two vessels (A and B) where the ratio of τ/τ′ was 0.93 and 0.22.
Figure 6. Comparisons of the method of calculating shear stress.
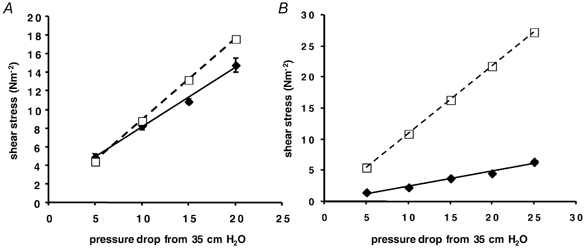
Shear stress calculated from the pressure difference (τ′, from eqn (8); □, dashed line) or from the red cell (fluid) velocity (τ, from eqn (7); ♦, continuous line) has been plotted against the pressure drop from one manometer to the other. In all four cases τ′ was higher than τ. A, τ is 93% of τ′. B, τ is 22% of τ′.
Accuracy of flow measurement
Measurements of flow rate through six individual vessels showed that the flow rate was consistent for a set pressure drop after a number of different interventions, including balancing the pressures and altering the volume flows to change the shear rate in the vessel. For instance, Fig. 7 shows that at 10 cmH2O pressure difference between inlet and outlet manometers, the volume flux through this vessel was the same even if that pressure drop was created at varying absolute pressures (the volume flow rate with the inlet pressure at 20 cmH2O was the same as that at 15 or 35 cmH2O with a pressure drop to the outlet of 10 cmH2O). In this vessel, measurement of volume flux in the micropipette was not significantly different from measurement in the vessel at 20 cmH2O pressure drop, and was consistent over a period of more than 1 h during which a number of interventions (e.g. pressure alterations, balances) were made. Once both cannulation sites have been positioned for optimum flow, volume flow rates did not change for a set pressure drop.
Figure 7. Comparison of volume (mean ± s.e.m.) flux through a single microvessel estimated from the fluid velocity through microvessel (hatched columns) or micropipette (filled columns) at pressure drops of 10 or 20 cmH2O from different inlet pressures.
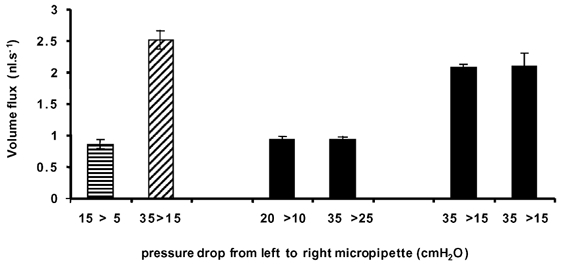
There was no significant difference between the flow rates when the inflow pressure was significantly higher (i.e. 35 vs. 15 cmH2O) provided the difference between inflow and outflow pressure was the same (P > 0.1, paired t test). The final two bars represent estimates of volume flux taken 1 h apart to show temporal consistency of volume flux.
While the micropipette- or vessel-estimated volume flow rates correlate together with the applied pressure difference, the expected parabolic laminar flow profile in a micropipette should provide a significantly greater red cell velocity in the centre of the pipette than the mean fluid velocity. Is it possible that we are overestimating the flow rate from the velocity of the red cells in the micropipette? To determine whether flow rate was overestimated we measured the velocity of the red cells at different points along the outflow micropipette moving away from the cannulation site (as the pipette grows wider). The change in velocity as the red cells move through the outflow micropipette (i.e. an increasing diameter of constraining walls) was compared with a theoretical change calculated from the starting velocity and assuming a flat laminar flow profile. As the pipette becomes wider, the laminar velocity profile will become shallower, if there is a significant parabolic velocity profile in the pipette then the velocity versus distance curve will be non-linear. Measurements from one experiment (Fig. 8) show that the red cell velocity reduces linearly over the distance measured from the cannulation site at three different flow rates (pressure differences). There appeared to be no difference between the mean of the measured velocity of red cells in the micropipette and the mean velocity of the fluid in the micropipette.
Figure 8. Comparison of red cell velocity with position along the outflow micropipette.
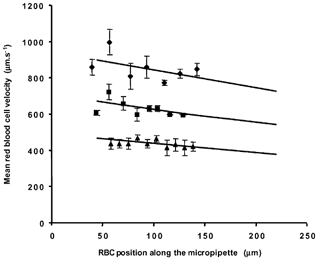
In one microvascular perfusion the red cell velocities were carefully measured (mean ± s.e.m.) along the widening glass tube using the left screen edge of the monitor as a fixed point, 0 μm. The velocities were compared with the theoretical flow change (continuous lines) if velocity at the start (∼40 μm from left screen edge) was reduced only in proportion to the open cross-sectional area of the micropipette; widening from 145 to 158 μm internal diameter at 50 and 200 μm away from the screen edge. There was no difference between the theoretical trend and the calculated regression line at three different flow rates.
Measurement of Lp
Lp was calculated from JV/A (eqn (11)), which was derived from dvB (eqn (10)). An example of the red cell velocity plots used to derive dvB is shown in Fig. 9. The six representative velocity graphs in Fig. 9 were generated from the video recordings of a vessel which was pressure balanced at one of four pressures and perfused between balances at a pressure drop of 5 cmH2O from the balance pressure (from m1 to m2; Fig. 1). For example, in Fig. 9A and B, the perfusion was from 15 cmH2O in manometer m1 to 10 cmH2O in manometer m2. Balance pressure (Pmb), equal to pressure in the vessel (Pc), was 15 cmH2O. In C, D, E and F of the same figure, balance Pc was 25, 35, 45 and 45 cmH2O, respectively. Thus the volume flux and shear stress were constant in the intervening perfusions, but the pressure in the vessel changed.
Figure 9. Plots of red cell velocity obtained at different balance pressures in a single vessel perfused with 5% bovine serum albumin (BSA).
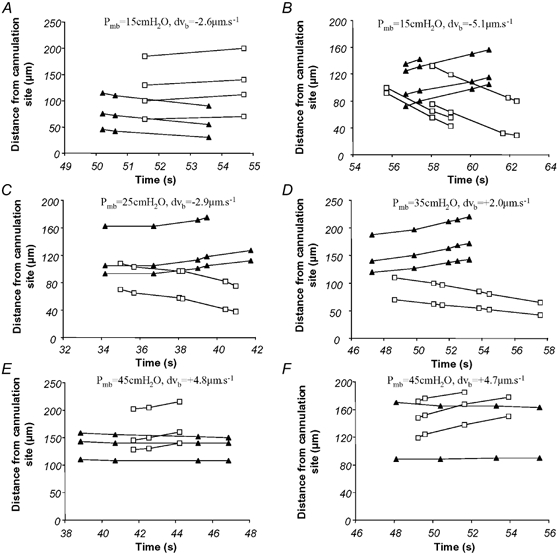
These six graphs show distance moved of different red cells with time from either the left (▴) or right (□) micropipette tip (R-C, Fig. 2B), after the pressure in a perfused microvessel was raised to a balance pressure, stopping perfusion. The difference between these residual red cell velocities (the slopes) show whether the red cells were getting closer together. If the cells moving away from one tip are moving faster than those moving towards the other tip fluid is moving out of the vessel (filtration, e.g. E and F). On the other hand, if the cells moving away from one tip are moving slower than cells moving towards the other, then the cells were moving apart (i.e. fluid moving into the vessel from the tissues; absorption, A and B). If both sets of cells are moving towards their closest tip, then absorption is occurring, and if both are moving away, then filtration is occurring. The pressure was balanced at one of four pressures (Pc = Pmb during balance): A and B, Pmb = 15 cmH2O; C, Pmb = 25 cmH2O; D, Pmb = 35 cmH2O; E and F, Pmb = 45 cmH2O.
In Fig. 9 the perfusion solution was 5% BSA in frog Ringer solution; this has a colloid osmotic pressure of 27.5 cmH2O and absorption of fluid into the vessel should occur at 15 cmH2O. This is shown in Fig. 9B, where the four red cells moving towards the right micropipette (squares) do so at 12.8 ± 0.9 μm s−1 (vL), while the four red cells moving away from the left micropipette (triangles) do so at only 7.7 ± 0.8 mm s−1 (vR). The difference of 5.1 μm s−1 (dvB; eqn (9)) describes the movement of red cells due to the absorption of fluid into the vessel and an increase in the length of the fluid column between the two sets of red cells. In Fig. 9E and F, however, Pc is above the colloid osmotic pressure and the groups of red cells positioned at either end of the vessel move closer together as the intervening fluid column shortens with filtration into the tissues. This is clearly shown in Fig. 9F, where the red cells near the left micropipette (triangles) are nearly stationary but the other red cells are moving away from the right micropipette (squares), shortening the column of fluid by 4.7 μm s−1 (dvB).
Measured volume decreases in the vessel during pressure balance were assigned a positive value, in line with the convention of positive fluid filtration out of the vessel and absorption back into the vessel being negative. Values were used to calculate fluid filtration (JV/A; eqn (10)) at each of the four pressures. Lp was calculated from the mean ± S.E.M. JV/A values plotted against Pc (Fig. 10). The slope of this relationship is the Lp (eqn (11)).
The two red cells near the left micropipette (triangles) in Fig. 9E and F are not exactly stationary, but appear to also show a shortening of the intervening column of fluid. Although it could be argued that this shortening is due to filtration, the distance between the two red cells could be changing due to red cell tumbling or wall interactions. That the rate of movement is proportional to the pressure difference (see Fig. 10) suggests, but does not prove, that this movement was due to filtration alone over those very short distances.
Measurement of the effective oncotic pressure difference and reflection coefficient
To determine whether this double-cannulation technique was also capable of measuring absorption of fluid into the vessel, and hence determining the reflection coefficient of the vessel, filtration rate was measured at a variety of pressures during perfusion with 5% albumin (n = 3, colloid osmotic pressure 27.5 cmH2O). Figure 9 shows six red cell velocity plots from one of the three vessels. dvB, derived from these and other pressure balances in the vessel, was used to derive fluid filtration rates per unit area of the wall (JV/A). Figure 10 shows the relationship between filtration rate and pressure in this single vessel. The effective oncotic pressure difference (σΔπ) calculated from these measurements was 25.8 cmH2O in this vessel. This corresponds to a reflection coefficient of 0.97 when calculated using the method of Michel & Phillips (1987).
Comparison with the Landis-Michel technique
In vessels perfused with 1% BSA, Lp was measured in five vessels by double cannulation and with the Landis-Michel method. It can be seen from Fig. 11 that there was no significant difference between Lp measurements using the double-cannulation (2.6 (± 0.9) × 10−7 cm s−1 cmH2O−1) or the Landis-Michel techniques (2.4 (± 0.9) × 10−7 cm s−1 cmH2O−1) in the same vessels (P > 0.10). In three other vessels Lp was estimated using the double-cannulation method alone (Lp values; 5.3, 1.6 and 4.5 × 10⁻⁷ cm s−1 cmH2O−1). The measurements using the Landis-Michel and double-cannulation methods fall within those previously described for Rana temporaria mesenteric capillaries and venular capillaries (Michel et al. 1974; Michel & Phillips, 1987; Bates, 1998; Michel & Curry, 1999). The technique for measurement was most accurate when the velocity of the slowest red cells was at a minimum. Figure 12 shows the Lp measured in a variety of vessels during balances plotted against the velocity of the slower of the two red cells. If measurement was accurate at all velocities then the Lp values should lie on the lines indicated. There was considerable spread around the mean Lp, but in general, with increasing velocity of the slower cell (i.e. imperfect balance pressures) the spread of Lp measurements became greater and more inaccurate. Therefore, it is necessary to make these fluid filtration red cell velocity measurements at as close to a perfect balance as possible (i.e. that one of the red cells has negligible movement).
Figure 11. Comparison of Lp of vessels measured by both the single- and double-cannulation methods.
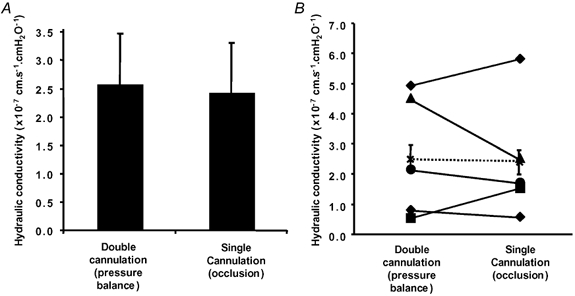
In five vessels, Lp was estimated using the double-cannulation pressure balance and also using the single-vessel-occlusion method. A, there was no significant difference in the mean Lp measured by the two techniques (mean ± s.e.m.). B, plot of the Lp of individual vessels, and mean (×) ± s.e.m. of all five vessels.
Figure 12. The influence of the slowest red cell velocity during balance on the calculated Lp.
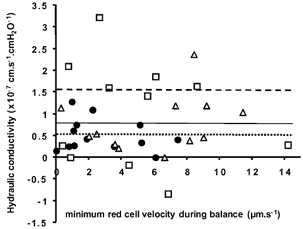
Lp measured during pressure balance (35 cmH2O) in three (1% BSA perfused) vessels is plotted against the slowest red cell velocity during balance. The mean Lp for each of the three vessels is shown by the dashed horizontal line for vessel 1 (□), the continuous horizontal line for vessel 2 (▵) and the dotted horizontal line for vessel 3 (•).
Effect of shear stress on Lp
Figure 13 shows the permeability of four vessels measured between intervening periods of at least 10 min imposed shear stress. There was no significant relationship between permeability and the imposed shear stress. This was true between vessels (P > 0.05, r2 = 0.171), as well within individual vessels.
Figure 13. Control Lp estimated during pressure balance is plotted against microvascular shear stress (τ) induced on the vessel walls during intervening perfusion.
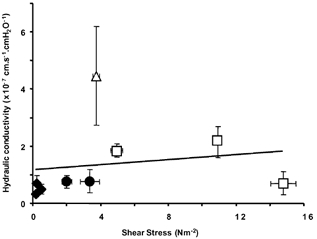
Nine levels of shear stress and Lp were measured in four vessels (each shape represents measurements in one vessel). For these four vessels, no relationship was observed between Lp and shear stress (slope = 0.1763, r2 = 0.03).
DISCUSSION
The investigation of microvascular permeability in single perfused microvessels in vivo has been extended here to enable the measurement of permeability between periods of controlled shear stress. This has been brought about by the development of a technique to cannulate a microvessel (capillary, or postcapillary venule) at both ends. The double cannulation and perfusion of larger blood vessels (coronary venules 40–60 μm) has been described previously (Yuan et al. 1993), but the introduction of a doublecannulation technique in microvessels of 15–25 μm diameter is novel.
Using this system we have been able to measure Lp without resorting to distortion and potential damage to part of the vessel (which occurs in the micro-occlusion technique; Michel et al. 1974). We have shown that the two methods give measurements of Lp that are not significantly different from each other (Fig. 11). The two methodologies are equally valid for measurement of permeability provided occlusion damage is avoided in the Landis-Michel technique or that the pressure balance is sufficiently well controlled in the double-cannulation technique (one of the marker red cells shows little or no movement). Furthermore, the technique could successfully be used to measure the effective oncotic pressure difference by measuring filtration rate (or absorption rate) at different pressures. The calculated reflection coefficient using this technique was similar to published values using the occlusion technique (Michel & Phillips, 1987; Bates, 1998). Therefore this technique appears to suffer no disadvantage in its accuracy of measurement compared to the occlusion technique.
We have also shown that Lp measured between perfusions does not vary according to the shear stress induced in the previous perfusion. This is in contrast to measurements of the permeability of microvessels to small ions in the same model, which does depend upon shear stress (Kajimura & Michel, 1999a). Furthermore, studies in coronary venules have shown that the apparent permeability to albumin also increased in response to shear stress (Yuan et al. 1992). It is of course possible that the permeability depends on the shear rate at the exact moment of measurement rather than the shear rate to which vessels are exposed before and after measurement. It is not possible using the methodology described here to measure fluid flow across a capillary wall at the instant of high shear stress. However, the relationship between shear rate and small-ion permeability is dependent on endothelial cell signalling (Kajimura & Michel, 1999b), and can be abolished by increasing cAMP, or by inhibiting cGMP production (Kajimura & Michel, 1999a). Since stimulation of increased permeability through these pathways often takes minutes rather than seconds (He & Curry, 1993; Bates & Curry, 1996), it might be assumed that the permeability of the wall may take some time (more than the duration of an occlusion) to adjust to a pressure balance or occlusion where the flow rate and shear stress are zero. However, Kajimura et al. (1998, 1999b) were able to demonstrate that the changes in permeability to potassium that accompany changes in perfusion rate of mesenteric capillaries were complete within 20 s, and possibly within 11 s. Therefore, a clear demonstration of the time course of the changes in permeability in response to shear would be a particularly useful aid to settle this argument.
It is interesting to note that there is a correlation between shear rate and the permeability to slightly larger solutes such as sodium fluorescein, in the same preparation as used here, in both rats (Montermini et al. 2001a) and frogs (Montermini et al. 2001b). There is also a correlation between shear rate and permeability to macromolecules such as albumin in larger venules (Yuan et al. 1992). If further work can confirm that Lp is not affected by shear rate, but the diffusive permeability to small solutes is, then it is possible that the permeability to small hydrophilic substances may be modulated through a different pathway to that of water (Fu et al. 1994). The opening of small (∼1 nm diameter) pores in response to shear has been proposed as a model that would explain the increase in permeability to potassium ions and sodium fluorescein and have a negligible (< 5%) effect on hydraulic conductivity (Montermini et al. 2002, this issue).
The double-cannulation method has a number of advantages over the micro-occlusion technique. In addition to not having to make contact with any part of the vessel across which permeability is measured and the ability to control shear stress between measurements irrespective of perfusion pressure, the technique allows the collection of the perfusate after perfusion through a single vessel for immediate or later analysis (i.e. including a measuring electrode in the tip of the collecting micropipette). This technique could also be used to determine whether perfusion of vessels in a retrograde direction affects Lp.
When cannulated at both ends the vessel is very stable, since the mesentery is held down on the pillar by two restrainers and there is no movement associated with occluding the vessel. Occlusion of the vessel with a glass rod can cause compression damage to the vessel; this is avoided by moving the occluder to a new position closer to the cannulation site. However, the length of available vessel diminishes with each set of occlusions. With the double-cannulation technique, Lp estimation relies upon balancing the pressure in a vessel, which is done remotely, and the original vessel length is maintained. As permeability is assessed on the same length of vessel throughout the procedure, much longer experimental protocols are possible.
In summary, we have developed a new technique for measurement of hydraulic conductivity between periods of controlled shear stress. This technique gives similar values to that using the Landis–Michel micro-occlusion method for measurement of Lp. Using this technique we have found no relationship between the shear stress in a vessel and the hydraulic conductivity in four vessels.
Acknowledgments
C.R.N. is supported by The Wellcome Trust grant no. 58083. D.O.B. is supported by the British Heart Foundation (BB2 000003).
REFERENCES
- Bates DO. The chronic effect of vascular endothelial growth factor on individually perfused frog mesenteric microvessels. Journal of Physiology. 1998;513:225–233. doi: 10.1111/j.1469-7793.1998.225by.x. [DOI] [PMC free article] [PubMed] [Google Scholar]
- Bates DO, Curry FE. Vascular endothelial growth factor increases hydraulic conductivity of isolated perfused microvessels. American Journal of Physiology. 1996;271:H2520–2528. doi: 10.1152/ajpheart.1996.271.6.H2520. [DOI] [PubMed] [Google Scholar]
- Curry FE, He P, Richmond-Mcknight TM, Bates DO. The effect of shear on endothelial cell calcium. Journal of Physiology. 2000;525.P:126S. [Google Scholar]
- Curry FE, Huxley VH, Sarelius IH. Techniques in the microcirculation: measurement of permeability, pressure and flow. Cardiovascular Physiology. 1983;P309:1–34. [Google Scholar]
- Fu BM, Weinbaum S, Tsay RY, Curry FE. A junction-orifice-fiber entrance layer model for capillary permeability: application to frog mesenteric capillaries. Journal of Biomechanical Engineering. 1994;116:502–513. doi: 10.1115/1.2895802. [DOI] [PubMed] [Google Scholar]
- He P, Curry FE. Differential actions of cAMP on endothelial [Ca2+]i and permeability in microvessels exposed to ATP. American Journal of Physiology. 1993;265:H1019–1023. doi: 10.1152/ajpheart.1993.265.3.H1019. [DOI] [PubMed] [Google Scholar]
- Head SD, Kajimura M, Michel CC. Effects of flow on potassium and fluid permeability of single microvessels. International Journal of Microcirculation: Clinical and Experimental. 1996;16:216. [Google Scholar]
- Huxley VH, Parker JL. Altered permeability responses of porcine coronary microvessels: roles for flow and exercise. Journal of Physiology. 2000;525.P:18S. [Google Scholar]
- Kajimura M, Head SD, Michel CC. The effects of flow on the transport of potassium ions through the walls of single perfused frog mesenteric capillaries. Journal of Physiology. 1998;511:707–718. doi: 10.1111/j.1469-7793.1998.707bg.x. [DOI] [PMC free article] [PubMed] [Google Scholar]
- Kajimura M, Michel CC. Flow modulates the transport of K+ through the walls of single perfused mesenteric venules in anaesthetised rats. Journal of Physiology. 1999a;521:665–677. doi: 10.1111/j.1469-7793.1999.00665.x. [DOI] [PMC free article] [PubMed] [Google Scholar]
- Kajimura M, Michel CC. Inhibition of effects of flow on potassium permeability in single perfused frog mesenteric capillaries. Journal of Physiology. 1999b;516:201–207. doi: 10.1111/j.1469-7793.1999.201aa.x. [DOI] [PMC free article] [PubMed] [Google Scholar]
- Kajimura M, Wiig H, Reed RK, Michel CC. Interstitial fluid pressure surrounding rat mesenteric venules during changes in fluid filtration. Experimental Physiology. 2001;86:33–38. doi: 10.1113/eph8602106. [DOI] [PubMed] [Google Scholar]
- Michel CC, Curry FE. Microvascular permeability. Physiological Reviews. 1999;79:703–761. doi: 10.1152/physrev.1999.79.3.703. [DOI] [PubMed] [Google Scholar]
- Michel CC, Kendall S. Differing effects of histamine and serotonin on microvascular permeability in anaesthetized rats. Journal of Physiology. 1997;501:657–662. doi: 10.1111/j.1469-7793.1997.657bm.x. [DOI] [PMC free article] [PubMed] [Google Scholar]
- Michel CC, Mason JC, Curry FE, Tooke JE, Hunter PJ. A development of the Landis technique for measuring the filtration coefficient of individual capillaries in the frog mesentery. Quarterly Journal of Experimental Physiology and Cognate Medical Sciences. 1974;59:283–309. doi: 10.1113/expphysiol.1974.sp002275. [DOI] [PubMed] [Google Scholar]
- Michel CC, Phillips ME. Steady-state fluid filtration at different capillary pressures in perfused frog mesenteric capillaries. Journal of Physiology. 1987;388:421–435. doi: 10.1113/jphysiol.1987.sp016622. [DOI] [PMC free article] [PubMed] [Google Scholar]
- Montermini DW, inlove CP, Michel CC. Effects of perfusion velocity upon the permeability of single mesenteric venules to sodium fluorescein in anaesthetised rats. Journal of Physiology. 2001a;531.P:27P. [Google Scholar]
- Montermini D, Winlove CP, Michel CC. Transport of sodium fluorescein through the walls of single perfused frog mesenteric capillaries: Effects of perfusion rate. Journal of Vascular Research. 2001b;38:189. [Google Scholar]
- Montermini D, Winlove CP, Michel CC. Effects of perfusion rate on permeability of frog and rat mesenteric microvessels to sodium fluorescein. Journal of Physiology. 2002;543:959–975. doi: 10.1113/jphysiol.2002.023010. [DOI] [PMC free article] [PubMed] [Google Scholar]
- Neal C. A method for changing the contents of a micropipette in situ. Journal of Physiology. 1998;513.P:4P. [Google Scholar]
- Neal CR, Michel CC. Transcellular openings through microvascular walls in acutely inflamed frog mesentery. Experimental Physiology. 1992;77:917–920. doi: 10.1113/expphysiol.1992.sp003659. [DOI] [PubMed] [Google Scholar]
- Neal CR, Michel CC. Transcellular gaps in microvascular walls of frog and rat when permeability is increased by perfusion with the ionophore A23187. Journal of Physiology. 1995;488:427–437. doi: 10.1113/jphysiol.1995.sp020977. [DOI] [PMC free article] [PubMed] [Google Scholar]
- Neal CR, Michel CC. Openings in frog microvascular endothelium induced by high intravascular pressures. Journal of Physiology. 1996;492:39–52. doi: 10.1113/jphysiol.1996.sp021287. [DOI] [PMC free article] [PubMed] [Google Scholar]
- Rumbaut RE, Mckay MK, Huxley VH. Capillary hydraulic conductivity is decreased by nitric oxide synthase inhibition. American Journal of Physiology. 1995;268:H1856–1861. doi: 10.1152/ajpheart.1995.268.5.H1856. [DOI] [PubMed] [Google Scholar]
- Williams DA. Network assessment of capillary hydraulic conductivity after abrupt changes in fluid shear stress. Microvascular Research. 1999;57:107–117. doi: 10.1006/mvre.1998.2128. [DOI] [PubMed] [Google Scholar]
- Yuan Y, Chilian WM, Granger HJ, Zawieja DC. Permeability to albumin in isolated coronary venules. American Journal of Physiology. 1993;265:H543–552. doi: 10.1152/ajpheart.1993.265.2.H543. [DOI] [PubMed] [Google Scholar]
- Yuan Y, Granger HJ, Zawieja DC, Chilian WM. Flow modulates coronary venular permeability by a nitric oxiderelated mechanism. American Journal of Physiology. 1992;263:H641–646. doi: 10.1152/ajpheart.1992.263.2.H641. [DOI] [PubMed] [Google Scholar]