Abstract
In this study, we examined the effect of Na+–K+ pump inhibition on the expression of early response genes in vascular smooth muscle cells (VSMC) as possible intermediates of the massive RNA synthesis and protection against apoptosis seen in ouabain-treated VSMC in our previous experiments. Incubation of VSMC with ouabain resulted in rapid induction of c-Fos protein expression with an approximately sixfold elevation after 2 h of incubation. c-Jun expression was increased by approximately fourfold after 12 h, whereas expression of activating transcription factor 2, cAMP/Ca2+ response element binding protein (CREB)-1 and c-Myc was not altered. Markedly augmented c-Fos expression was also observed under Na+–K+ pump inhibition in potassium-depleted medium. Na+–K+ pump inhibition triggered c-Fos expression via elevation of the [Na+]i/[K+]i ratio. This conclusion follows from experiments showing the lack of effect of ouabain on c-Fos expression in high-potassium-low-sodium medium and from the comparison of dose responses of Na+–K+ pump activity, [Na+]i and [K+]i content and c-Fos expression to ouabain. A fourfold increment of c-Fos mRNA was revealed 30 min following addition of ouabain to the incubation medium. At this time point, treatment with ouabain resulted in an approximately fourfold elevation of [Na+]i but did not affect [K+]i. Augmented c-Fos expression was also observed under VSMC depolarization in high-potassium medium. Increments in both c-Fos expression and 45Ca uptake in depolarized VSMC were abolished under inhibition of L-type Ca2+ channels with 0.1 μM nicardipine. Ouabain did not affect the free [Ca2+]i or the content of exchangeable [Ca2+]i. Ouabain-induced c-Fos expression was also insensitive to the presence of nicardipine and [Ca2+]o, as well as chelators of [Ca2+]o (EGTA) and [Ca2+]i (BAPTA). The effect of ouabain and serum on c-Fos expression was additive. In contrast to serum, however, ouabain failed to activate the Elk-1, serum response factor, CREB and activator protein-1 transcription factors identified within the c-Fos promoter. These results suggest that Na+–K+ pump inhibition triggers c-Fos expression via [Na+]i-sensitive [Ca2+]i-independent transcription factor(s) distinct from factors interacting with known response elements of this gene promoter.
In the overwhelming number of eukaryotic cells studied so far, Na+–K+-ATPase is an integral membrane protein that is responsible for the electrogenic movement of 3Na+ and 2K+ against their equilibrium potentials (Therien & Blostien, 2000). The electrochemical gradients of monovalent cations generated by this enzyme are critical for the maintenance of cell volume, resting membrane potential and excitation-contraction coupling as well as the activity of monovalent cation-coupled transporters, including Na+-H+ and Na+-Ca2+ exchange, Na+, K+, Cl− cotransport, cotransport of Na+ with amino acids, glucose, phosphate and neurotransmitters (Blanco & Merger, 1998). In addition to these fundamental cellular functions, Na+–K+ pump inhibition leads to cell-type-specific modulation of cell proliferation and survival. In the majority of cells studied so far, including human prostatic smooth muscle cells, modest inhibition of the Na+–K+ pump accelerates cell growth, whereas its complete inhibition sharply decreases cell survival (Chueh et al. 2001).
The relative contributions of necrosis and apoptosis to cell death under Na+–K+ pump inhibition remain a controversial matter (Contreras et al. 1999; Chueh et al. 2001). It should be emphasized, however, that several cell types, such as monkey kidney epithelial cells (Contreras et al. 1999), rat astrocytes (Murata et al. 1996), and the vascular smooth muscle cells (VSMC) of rabbit (Henningsen et al. 1984) and rat (Orlov et al. 2001), are highly resistant to full-scale inhibition of the Na+–K+ pump. Moreover, in rat VSMC (Orlov et al. 1999), rat neuronal cells (Isaev et al. 2000) and porcine renal epithelial cells (Zhou et al. 2001), inhibition of the Na+–K+ pump with ouabain or in potassium-depleted medium protects against apoptosis triggered by diverse stimuli. Using rat VSMC, we also reported that the antiapoptotic effect of ouabain is mediated by elevation of the [Na+]i/[K+]i ratio (Orlov et al. 1999) and is abolished by inhibitors of protein and RNA synthesis (Orlov et al. 2000b). The latter observation suggests strongly that elevation of the [Na+]i/[K+]i ratio blocks apoptosis via the expression of inhibitor(s) of the apoptotic machinery.
Na+–K+-ATPase and other monovalent ion transporters involved in adjustment of the [Na+]i/[K+]i ratio are subjected to regulation by diverse stimuli including endogenous ouabain-like factor, whose circulating level is augmented in several experimental models of hypertension (for recent review, see Goto & Yamada, 2000). Keeping these data in mind, we continued to study the mechanism of suppression of apoptosis under an increased [Na+]i/[K+]i ratio. We found that inhibition of VSMC Na+–K+-ATPase leads to massive RNA synthesis, which after 6–12 h is elevated by up to 10-fold, as assessed by [3H]uridine RNA labelling (Orlov et al. 2001). Based on these results, we proposed that inhibition of the VSMC Na+–K+ pump is accompanied by the expression of early response genes (ERG: Orlov et al. 2001). This hypothesis is supported by data on ouabain- or low-[K+]o-induced expression of mRNA species encoding c-Fos and c-Jun observed in several other cell types, including hepatocytes (Cayanis et al. 1992), fibroblasts, HeLa cells, melanoma cells (Nakagawa et al. 1992), cardiomyocytes (Peng et al. 1996), leukaemia precursor T-helper cells (Numazawa et al. 1996), lymphocytes (Olej et al. 1998), PC12 (Ando et al. 2000), and mIMCD-3 cells (Joannidis et al. 1997). However, neither RNA synthesis nor ERG expression seems to be a universal property of ouabain-treated cells. Indeed, inhibition of the Na+–K+ pump diminishes RNA synthesis in Escherichia coli (Lubin & Ennis, 1964), sarcoma S-180 cells (Lubin, 1967) and lymphocytes (Szamel & Reshkin, 1981) and does not affect c-Fos expression in Madin Darby canine kidney cells (Joannidis et al. 1997). Moreover, in none of the studies listed here was the effect of Na+–K+ pump inhibition on the expression of ERG proteins examined. This last statement is important because of the inhibitory action of elevated [Na+]i/[K+]i ratio on protein synthesis caused by the requirement for high K+ at a step of amino acid transfer from aminoacyl-RNA to the polypeptide (Lubin & Ennis, 1964).
The role of the Na+–K+ pump as a regulator of ERG expression in VSMC has not yet been explored. Moreover, in spite of well-documented data on ERG mRNA expression in other cell types, several key questions concerning the mechanisms underlying this phenomenon remain unanswered. First, the role of modulation of the [Na+]i/[K+]i ratio in ERG expression has not been investigated in the majority of the studies cited here. This issue becomes important because of recent data on the [Na+]i-[K+]i-independent mechanism of activation of mitogen-activated protein kinase (MAPK) in ouabain-treated rat cardiomyocytes (Liu et al. 2000) and canine VSMC (Aydemir-Koksoy & Allen, 2001), and elevation of DNA synthesis in ouabain-treated VSMC in rat (Golomb et al. 1994) and canine (Aydemir-Koksoy & Allen, 2001). Second, in studies where an impact of intracellular cations in the regulation of ERG expression has been proposed (Peng et al. 1996), the relative contributions of increased [Na+]ivs. reduced [K+]i have not been explored. Third, data on the intracellular signalling systems triggered by Na+–K+ pump inhibition and related to ERG expression are controversial. Thus, for example, c-Fos mRNA expression in ouabain-treated cardiomyocytes was completely blocked by incubation in calcium-free medium or in the presence of the [Ca2+]i chelator BAPTA (Peng et al. 1996), whereas in ouabain-treated fibroblasts, it was independent of the presence of Ca2+ and BAPTA (Nakagawa et al. 1992). Fourth, transcription factors involved in the regulation of ERG expression by growth factors, calcium-raising agents and other intermediates of intracellular signalling are well characterized (Piechaczyk & Blanchard, 1994; Larner & Finbloom, 1995; Whitmarsh & Davis, 1996). The role of these transcription factors in the ERG expression triggered by Na+–K+ pump inhibition has not been explored.
In the present study, we report that inhibition of the VSMC Na+–K+ pump with ouabain or in potassium-depleted medium leads to the rapid expression of c-Fos protein. This effect is mediated by [Na+]i elevation rather than [K+]i reduction and is not caused by modulation of cell volume, intracellular pH or Ca2+, or by known transcription factors that interact with c-Fos promoter response elements.
METHODS
Cultured VSMC
VSMC were isolated by explant methods that have been described previously (Orlov et al. 1996), from the aortae of Brietal-anaesthetized (3 mg kg−1), 10- to 13-week-old male Brown Norway (BN.lx) rats, in accordance with the procedures outlined in the Guide for the Care and Use of Experimental Animals endorsed by the Medical Research Council of Canada. They were cultured in Dulbecco's modified Eagle's medium (DMEM) with 10 % calf serum, 100 U ml−1 penicillin and 100 μg ml−1 streptomycin for use between 10 and 16 passages. To establish quiescence, the cells were incubated for 48 h in DMEM containing 0.2 % serum.
Na+–K+ pump activity
Na+–K+ pump activity was measured as an ouabain-sensitive component of the rate of 86Rb influx. VSMC were washed twice with 2 ml aliquots of medium A, which contained (mm): NaCl 140, KCl 5, MgCl2 1, CaCl2 1, d-glucose 5 and Hepes-Tris buffer 20 (pH 7.4). To escape feedback activation of the Na+–K+ pump by elevation of [Na+]i content (Therien & Blostien, 2000), the cells were preloaded with Na+ by 1 h incubation at 37 °C in 1 ml of potassium-depleted medium A. This medium was then aspirated, and 0.25 ml of complete medium A was added with 1 μCi ml−186Rb, 10 μM bumetanide, and ouabain at the concentrations shown in Fig. 3. After 5 min, isotope uptake was terminated by the addition of 2 ml of ice-cold medium W, which contained (mm): MgCl2 100 and Hepes-Tris buffer 10 (pH 7.4). Next, the cells were washed with 4 × 2 ml aliquots of the same medium and lysed in 1 ml of a mixture containing 1 % SDS-4 mm EDTA. The radioactivity of the incubation medium and cell lysate was measured with a liquid scintillation analyser, and the rate of 86Rb influx (V, nmol (mg protein)−1 (5 min)−1) was calculated as V = A/(am), where A is the radioactivity of the samples (c.p.m.), a is the specific radioactivity of K+ (86Rb) in the medium (c.p.m. nmol−1) and m is the protein content.
Figure 3. Effect of ouabain on the Na+–K+ pump, [Na+]i and [K+]i and expression of c-Fos protein in quiescent VSMC.
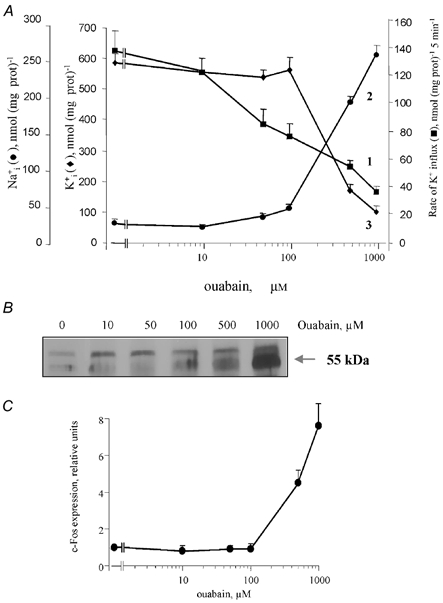
A, dose dependency of the effect of ouabain on Na+–K+ pump activity (curve 1, ▪) and intracellular content of exchangeable Na+ and K+ (curves 2, •, and 3, ▴, respectively). Means ± s.e.m. from experiments performed in quadruplicate are shown. B, representative Northern blot illustrating c-Fos expression after incubation of VSMC with different concentrations of ouabain 6 h. C, dose dependency of the ouabain effect on c-Fos expression. c-Fos content in the absence of ouabain was taken as 1.0. Means ± s.e.m. from three experiments are shown.
[Na+]i and [K+]i content
The content of exchangeable [Na+]i and [K+]i was measured as the steady-state distribution of extra- and intracellular 22Na and 86Rb, as described in detail previously (Orlov et al. 1999). Briefly, to establish isotope equilibrium, VSMC growing in 12 or 24 well plates were preincubated for 6 h in DMEM containing 0.5 μCi ml−186RbCl or 2 μCi ml−122NaCl either with or without ouabain. To study the kinetics of modulation of [Na+]i and [K+]i under Na+–K+ pump inhibition, ouabain was added for the next 5 h. At the end of incubation, the cells were transferred onto ice, washed four times with 2 ml of ice-cold medium W and lysed with the SDS-EDTA mixture. The radioactivity of the incubation medium and cell lysate was measured, and intracellular cation content was calculated as A/(am), as defined earlier.
Measurement of free [Ca2+]i
VSMC were grown on glass coverslips and incubated for 30–40 min in medium B, which contained 5–10 mm fura-2 AM. The cells were then washed twice with medium B and kept for up to 30 min at room temperature before the experiments. Two approaches were employed to estimate [Ca2+]i. To measure [Ca2+]i in the total cell population, the coverslips were mounted in a diagonal position in a 1 × 1 cm cuvette, and fluorescence was determined under permanent stirring at 37 °C (excitation wavelength, λex = 340 and 380 nm, slit = 4 nm; emission wavelength, λem = 510 nm, slit = 12 nm), using a SPEX FluoroMax spectrofluorimeter (Edison, NJ, USA). Free [Ca2+]i was quantified as [Ca2+]i =Kd(R - Rmin) × (Rmax - R) - 1, where Kd is the dissociation constant of the calcium-fura-2 complex (224 nm at 37 °C), and R = F340/F380 is the ratio of fluorescence at λex = 340 and 380 nm. To determine Fmax, the cells were treated with 0.5 μM ionomycin in the presence of 1 mm CaCl2. To determine Fmin, MnCl2 was added at a final concentration of 2 mm. To measure [Ca2+]i in single cells by fluorescence ratio imaging, coverslips were placed in the bottom of a laminar flow-through chamber mounted on the stage of a Nikon inverted microscope equipped for epifluorescence (Eclipse TE300, Nikon, Tokyo, Japan). Fura-2-loaded cells were illuminated at 340 and 380 nm, with a 100 W mercury lamp and interference filters (Chroma Technology, Brattleboro, VT, USA) mounted on a filter wheel (Sutter Lambda 10-C, Sutter Instrument Co., Novato, CA, USA) and a dichroic mirror (510/40 nm, Chroma Technology). Images obtained at λem = 510 nm were acquired via a × 40 objective (CFI PL FLUOR, Nikon) and a Princeton T57 Micromax CCD camera at the rate of one ratio image per 4 s. In this imaging system (Canabra Packard Canada, Mississauga, ON, Canada), cell illumination and fluorescence image acquisition hardware were run by MetaFluor software (Universal Imaging, West Chester, PA, USA).
Ca2+ uptake and exchangeable [Ca2+]i content were measured in accordance with a previously described method (Orlov et al. 1996). Briefly, quiescent VSMC seeded in 24 well plates were preincubated for 30 min in medium B. Then, the medium was aspirated, and 0.25 ml of medium B containing 0.2 mm CaCl2 was added. After 5 min of incubation at 37 °C, 0.256 ml of low-potassium medium (5 mm KCl, 145 mm NaCl) or high-potassium medium (120 mm KCl, 30 mm NaCl) containing 2–3 μCi ml−145CaCl2 with or without 0.2 mm nicardipine was added. Isotope uptake was terminated in 5 min, radioactivity within the cells was counted, and Ca2+ uptake was calculated as indicated earlier. To measure the content of exchangeable [Ca2+]i, the cells were incubated for 6 h in DMEM containing 1–2 μCi ml−145CaCl2 with or without ouabain.
Intracellular pH measurement
VSMC growing in 85 cm2 flasks were harvested in DMEM containing 0.05 % trypsin and 0.1 % EDTA, washed once with DMEM containing 10 % calf serum and twice with medium B containing 0.1 % bovine serum albumin (BSA). They were then incubated for 30 min at room temperature in 3 ml of the same medium containing 10 μM 2′,7′-bis-(2-carboxyethyl)-5-(and-6)-carboxyfluorescein, acetoxymethyl ester (BCECF-AM). The cells were subsequently washed twice with medium B containing 0.1 % BSA and kept in 1 ml of the same medium at 37 °C with or without 1 mm ouabain. After 1 h, 0.2 ml of the cell suspension was added to 2.5 ml of medium B with or without 1 mm ouabain, and BCECF fluorescence was measured with a SPEX FluoroMax spectrofluorimeter at λex 495 and 440 nm, slit 5 nm and λem 530 nm, slit = 12 nm. Fluorescence was calibrated in terms of intracellular pH (pHi) in sodium-free medium containing 10 μM nigericin. In these experiments, we observed that elevation of extracellular pH from 6.71 to 7.75 by addition of aliquots of 1 m Tris augmented the F495/F440 ratio from 5.1 to 9.5. We have employed this method previously in a study of the Na+-H+ exchanger in VSMC (Orlov et al. 2000a).
Cell volume measurement
[14C]urea equilibrium distribution was used to measure intracellular water space. Cells seeded in 12 well plates were incubated for 6 h in DMEM containing 2 μCi ml−1[14C]urea and then aliquots of medium were added with the same radioactivity with or without ouabain at a final concentration of 1 mm. To induce hyperosmotic shrinkage, mannitol was added to DMEM at a final concentration of 100 or 300 mm. After termination of the experiments, the cells were washed with 4 × 3 ml of ice-cold medium W and lysed for radioactivity measurement as described above. The volume of intracellular water (Vi, μl (mg protein)−1) was calculated as Vi =VoAi/Aom, where Ai and Ao are the radioactivity of [14C]urea in the cell lysate and incubation medium, respectively (d.p.m.), m is the protein content in the cell lysate (mg), and Vo is the volume of the incubation medium (μl) used for Ao determination.
Western blotting
VSMC grown in 75 cm2 flasks and treated as indicated in the figure captions were scraped with a rubber policeman, washed with ice-cold medium C, which contained 150 mm NaCl and 10 mm Hepes-Tris (pH 7.4), and centrifuged (500 g, 5 min). The resultant cell pellet was washed twice with the same medium and lysed with buffer containing 150 mm NaCl, 25 mm Hepes-Tris (pH 7.5), 0.1 % SDS, 0.25 % sodium deoxycholate, 2 mm EGTA, 2 mm EDTA, 1 mm Na3VO4, 10 mm NaF, 200 μM phenylmethylsulphonyl fluoride, 1 μg ml−1 leupeptin and 1 μg ml−1 aprotinin. Equal portions of cell lysate (20 μg lane−1) were electrophoresed on a 10 % SDS-polyacrylamide gel, transferred to a nitrocellulose membrane, washed with phosphate-buffered saline containing 0.05 % Tween 20 (PBS-Tween) and 0.5 % skimmed milk, and incubated overnight at 4 °C with ERG antibodies. After incubation, the membranes were washed three times with PBS-Tween and incubated for 1 h with horseradish-peroxidase-conjugated antibody (Santa Cruz Biotechnology, Santa Cruz, CA, USA). The membranes were then washed with PBS-Tween and the protein bands were visualized with an enhanced chemiluminescence detection kit (Santa Cruz Biotechnology) and exposed to X-ray film. Relative protein content was determined using the NIH Image program.
Northern blotting
VSMC were collected as described earlier, and total RNA was isolated with TRIZOL reagent (Life Technologies, Burlington, ON, Canada) in accordance with the manufacturer's instructions. Total RNA (10 μg), as determined by UV spectrophotometry, was subjected to gel electrophoresis, transferred to a Hybond N+ membrane (Amersham Pharmacia Biotech, Baie d'Urfé, QC, Canada), UV immobilized and hybridized to 32P-labelled probes. c-Fos mRNA forward (AGGAATAAGATGGCTGCAGCCAAG) and reverse (GACTCTGGGGTGGTAGCCTCAG) primers corresponding to the 569–838 region of rat c-Fos mRNA were synthesized using the primer-designed GeneFisher program. GAPDH forward (ATGGTGAAGGTCGGTGTCAACGCA) and reverse (GAGCCCTTCCACGATGCCAAAGTTGTCATG) primers were provided by Dr Y. Sun (CHUM, Université de Montréal). The probes were purified with the Wizard PCR Preps DNA purification system from Promega (Madison, WI, USA), and quantified with the Low DNA Mass Ladder (Life Technologies). They were labelled with a Random primer DNA labelling system kit (Life Technologies), purified on Sephadex G-50, hybridized for 24 h, visualized on the Phosphor-Imager (Molecular Dynamics, CA, USA) and quantified with ImageQuant version 5.1 software (Molecular Dynamics). Ribosomal S18 RNA was visualized on the membrane by fluorescence in a Typhoon 8600 (Molecular Dynamics).
Activity of transcription factors
Activation of the transcription factors Elk-1 and adenosine cAMP/Ca2+ response element binding protein (CREB) was measured by the ‘PathDetect’ transreporter system (Stratagene, La Jolla, CA, USA). Briefly, fusion transactivator plasmids encoding the GAL4 DNA-binding domain and the activation domains of Elk-1 or CREB, respectively, were co-transfected with the plasmid encoding the luciferase gene under the control of GAL4-binding elements. Agonist-induced activation of Elk-1 or CREB results in binding of the corresponding fusion transactivator to GAL4-binding elements and activation of transcription of the luciferase gene. VSMC at 90 % confluency grown on 24 well plates were transfected with the following plasmids (per well): 200 ng pFR-luciferase (luciferase reporter plasmid), 10 ng pFA2-Elk-1 or 10 ng pFA2-CREB (fusion transactivator plasmids), and 200 ng pcDNA3-LacZ (transfection efficiency control plasmid). The day before stimulation, the cells were serum-starved overnight in 0.2 % calf serum, followed by incubation for 6 h with 1 mm ouabain or 10 % serum. They were then washed twice with PBS, lysed in protein extraction reagent, and the cleared lysates were assayed for luciferase and β-galactosidase activity with corresponding assay kits (Promega, Madison, WI, USA). To account for the differences in transfection efficiency, the luciferase activity of each sample was normalized to that of β-galactosidase activity. Serum response factor (SRF) activity was measured by cis-reporter assay using the luciferase reporter plasmid for the mutant serum response element (SRE) of the c-Fos promoter lacking the T-cell-factor binding site (Hill et al. 1995). The activity of activator protein (AP)-1 was also measured by cis-reporter assay, using the AP1-luciferase reporter plasmid (Stratagene). VSMC were transfected with 100 ng luciferase cis-reporter plasmids and 200 ng pcDNA3-LacZ, then stimulated with ouabain or control agonists, followed by luciferase assay, as described earlier.
Chemicals
[14C]Urea, 86RbCl, 22NaCl and 45CaCl2 were obtained from Amersham (Montreal, QC, Canada); furosemide, bumetanide, ouabain, nicardipine, monensin, nigericin and valinomycin were from Sigma (Oakville, ON); fura-2 AM and BCECF AM were from Molecular Probes (Eugene, OR, USA); BAPTA AM was from Calbiochem (San Diego, CA, USA). Polyclonal antibodies for c-Fos, c-Jun, c-Myc, CREB-1 and activating transcription factor (ATF)-2 were obtained from Santa Cruz Biotechnology. Salts and buffers were purchased from Sigma and Anachemia Science (Montreal, QC, Canada).
RESULTS
Na+–K+ pump inhibition causes rapid c-Fos expression in VSMC
Incubation of VSMC with ouabain resulted in rapid induction of c-Fos protein expression, levels increasing by approximately sixfold after 2 h incubation, followed by a decline to the basal level by 24 h (Fig. 1). In contrast to c-Fos, ouabain-induced c-Jun expression reached the maximum of approximately fourfold induction at 12 h, a level that was sustained for up to 24 h (Fig. 1). We failed to observe any effect of ouabain on the expression of ATF-2, CREB or c-Myc (Fig. 1A). We focused our further studies on the mechanism of induction of c-Fos expression in ouabain-treated cells.
Figure 1. Effect of ouabain on early response gene (ERG) expression in quiescent vascular smooth muscle cells (VSMC).
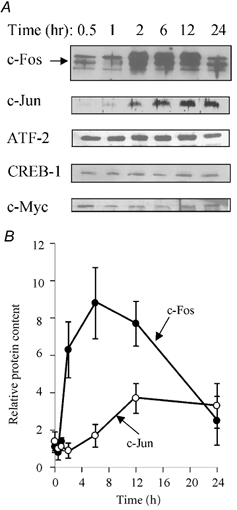
A, representative blot showing expression of c-Fos, c-Jun, activating transcription factor (ATF)-2 and cAMP-Ca2+ response element binding protein (CREB)-1 proteins after incubation of VSMC for up to 24 h with 1 mm ouabain. B, kinetics of c-Fos (•) and c-Jun (○) expression in ouabain-treated quiescent VSMC. ERG content in the absence of ouabain was taken as 1.0. Means ± s.e.m. from three experiments are shown.
The affinity of the ubiquitous α1 isoform of the Na+–K+ pump for cardiac glycosides in rodents is three- to fourfold lower than in other mammalian species, and 1 mm ouabain should be added to inhibit this enzyme in rat VSMC by 80–90 % (Willis & Ellory, 1983). Keeping in mind the possibility of ouabain side-effects at high concentrations, we used potassium-free medium as an alternative approach for Na+–K+ pump inhibition. Figure 2 shows that similarly to ouabain, 6 h incubation of VSMC in potassium-depleted medium sharply augmented c-Fos expression.
Figure 2. Effect of ouabain and potassium-depleted medium on the expression of c-Fos protein in quiescent VSMC.
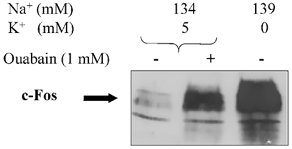
VSMC were incubated for 6 h in control medium with or without 1 mm ouabain or in potassium-depleted medium. Concentrations of Na+ and K+ in the media are shown at the top of the figure. The control media contained (mm): NaCl 121, KCl 5, CaCl2 1.8, MgSO4 0.8, NaHCO3 12, NaH2PO4 0.9, Hepes 4.2 (pH 7.2), glucose 5, and vitamins and amino acids at concentrations indicated for Dulbecco's modified Eagle's medium (DMEM) recipes. In potassium-depleted medium, KCl was substituted with NaCl.
Ouabain triggers c-Fos expression via elevation of the [Na+]i/[K+]i ratio
The electrogenic Na+–K+ pump can affect c-Fos expression by modulation of the [Na+]i/[K+]i ratio as well as by rapid depolarization of VSMC or activation of the distinct signalling cascade triggered by its conformational transition. To examine these possibilities, we compared the dose-responses of Na+–K+ pump activity, the [Na+]i/[K+]i ratio and c-Fos expression to the increasing ouabain concentrations.
The addition of 100 μM ouabain led to an approximately twofold inhibition of the rate of K+ (86Rb) influx in sodium-loaded VSMC (used as a measure of maximal Na+–K+ pump activity; Fig. 3A, curve 1). However, because of feedback activation of the Na+–K+ pump by intracellular Na+ (Therien & Blostien, 2000), the [Na+]i/[K+]i ratio still remained at the basal level under treatment with 100 μM ouabain, and increment of the [Na+]i/[K+]i ratio became evident at 500 μM and higher concentrations of ouabain (Fig. 3A, curves 2 and 3). The lack of effect on 86Rb uptake of ouabain at concentrations less than 10 μM suggests a major contribution of the low affinity α1 isoform of the Na+–K+ pump in regulation of the [Na+]i/[K+]i ratio. This conclusion is in accordance with the lack of expression of mRNA encoding the α2 and α3 isoforms of the Na+–K+ pump with high affinity for ouabain in cultured VSMC from the rat aorta (Yamamoto et al. 1994), low expression of α2 and α3 proteins in freshly isolated rat arteries and in VSMC compared to neuronal cells (Sahin-Erdemli et al. 1994) and immunocytochemical data showing expression of these isoforms in the restricted plasma membrane area termed the plasmerosome (Juhasova & Blaustein, 1997; Blaustein & Lederer, 1999).
There was no significant effect of 100 μM ouabain on c-Fos expression, whereas at 500 and 1000 μM, immunoreactive c-Fos protein content was increased by fourfold and sevenfold, respectively (Fig. 3B and C). These results show that elevation of the [Na+]i/[K+]i ratio is an obligatory intermediate for the triggering of c-Fos expression by ouabain.
c-Fos expression in ouabain-treated VSMC is mediated by elevation of [Na+]i
The 2 h incubation of VSMC with ouabain was sufficient to increase immunoreactive c-Fos content by five- to eightfold (Fig. 1B). At this time point, ouabain led to an elevation of exchangeable [Na+]i content of approximately 15-fold, whereas [K+]i content was decreased by only 40–50 % (Fig. 4A). To further examine the relative contributions of [Na+]i and [K+]i in c-Fos expression, we employed Northern blot analysis of c-Fos mRNA content. In these experiments, sustained elevation of c-Fos mRNA content was observed in following treatment with ouabain for 10 min, with an increment of up to fourfold in 30 min (i.e. at time points when there was no significant effect of ouabain on [K+]i content), whereas [Na+]i was increased by approximately fourfold (Fig. 4A). These kinetics show that elevation of [Na+]i rather than attenuation of [K+]i content is a key intermediate of c-Fos expression in VSMC with an inhibited Na+–K+ pump.
Figure 4. Ouabain-induced modulation of [Na+]i, [K+]i and the c-Fos/S18 ratio.
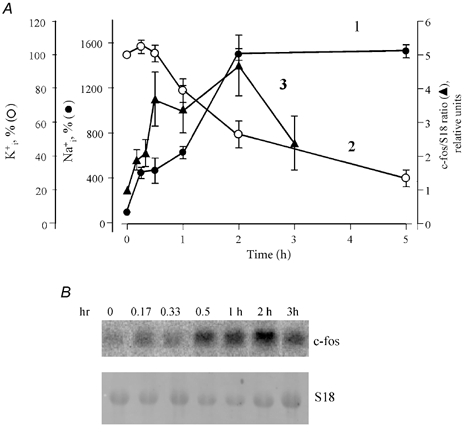
A, kinetics of the modulation by ouabain of [Na+]i (1, •) and [K+]i (2, ○) content and the c-Fos mRNA/ribosomal S18 RNA ratio (3, ▴). To measure [Na+]i and [K+]i, quiescent VSMC were preincubated for 6 h in DMEM with 0.5 μCi ml−186RbCl or 2 μCi ml−122NaCl, and then aliquots of DMEM with the same radioactivity and 1 mm ouabain were added for the next 0.25, 0.5, 1, 2 and 5 h. The content of exchangeable Na+, K+ and the c-Fos/S18 RNA ratio in the absence of ouabain was taken as 100 %. Means ± s.e.m. from three (intracellular ions) and five (c-Fos mRNA) experiments are given. B, representative blot showing the kinetics of c-Fos mRNA expression in ouabain-treated VSMC.
Role of cell volume, [pH]i and Ca2+
Elevation of [Na+]i can affect [pH]i and free Ca2+ concentration ([Ca2+]i) by activation of the Na+-H+ and Na+-Ca2+ exchanger, respectively. In addition, an increased [Na+]i/[K+]i ratio can alter the total content of intracellular osmolytes, thus affecting VSMC volume. To examine the relative contribution of pHi, [Ca2+]i and cell volume in c-Fos expression triggered by elevated [Na+]i, we studied their modulation by ouabain.
We did not detect any pHi changes in VSMC treated with 1 mm ouabain for 1 h (pHi = 7.11 ± 0.14 vs. 7.09 ± 0.12 in control and ouabain-treated cells, respectively, n = 4). These results are in accordance with the prevalence of the Na+-Na+ mode of operation of the Na+-H+ exchanger shown with cultured BCECF-loaded VSMC in our recent study (Orlov et al. 2000a). In contrast to unaltered pHi, VSMC volume was decreased from 2.49 ± 0.12 to 2.09 ± 0.14 μl of cell water per mg of protein after 2 h of ouabain exposure (Fig. 5A). A similar reduction of cell volume was observed in the presence of 100 mm mannitol, whereas at 300 mm, this impermeable osmolyte decreased VSMC volume by ≈35–40 % (Fig. 5B). Previously, it was found that cell shrinkage leads to the expression of several mRNA species (Burg, 1995), including α1 and β1 Na+–K+-ATPase subunits (Muto et al. 1998). However, mannitol failed to affect basal (Fig. 5C) or ouabain-induced (data not shown) c-Fos expression in VSMC. These results rule out the role of pHi and cell volume as intermediates of c-Fos expression in ouabain-treated VSMC.
Figure 5. Role of cell volume in c-Fos expression.
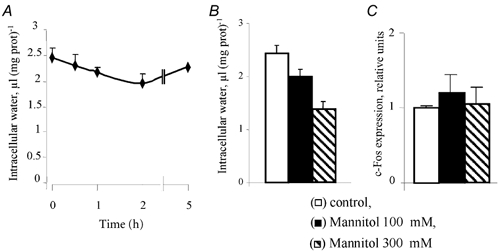
A, kinetics of cell volume modulation by ouabain. Quiescent VSMC were preincubated for 6 h in DMEM containing 2 μCi ml−1[14C]urea, and then ouabain was added at a final concentration of 1 mm. Means ± s.e.m. from experiments performed in triplicate are given. B, effect of hyperosmotic medium on VSMC volume. The osmolality of the medium was increased by the addition of either 100 or 300 mm mannitol to DMEM. Means ± s.e.m. from experiments performed in quadruplicate are given. C, effect of hyperosmotic medium on c-Fos protein expression. Quiescent VSMC were incubated in DMEM containing 100 or 300 mm mannitol for 6 h. c-Fos expression in the absence of mannitol was taken as 100 %. Means ± s.e.m. from experiments performed in triplicate are given.
The electrogenic Na+–K+ pump can also affect c-Fos expression by rapid depolarization of VSMC. In various types of electrically excitable cells, including VSMC (Orlov et al. 1996), elevation of [K+]o causes cell depolarization and activation of L-type Ca2+ channels. In our experiments, incubation of VSMC in a high-potassium medium led to a similar activation of c-Fos expression as observed in ouabain-treated cells (Fig. 6). However, the following results indicate that this effect does not represent the mechanism for ouabain-induced c-Fos expression, but is rather mediated by a distinct, calcium-dependent pathway. Indeed, incubation of VSMC in a high-potassium medium augmented 45Ca uptake from 327 ± 33 to 831 ± 52 pmol (mg protein)−1 (5 min)−1, an effect that was completely blocked by nicardipine (0.1 μM), an inhibitor of L-type Ca2+ channels. Similarly to Ca2+ uptake, an increment of c-Fos expression triggered by a high-potassium medium was also abolished by nicardipine (Fig. 6). By contrast, the effect of ouabain on c-Fos expression was not affected by nicardipine, which rules out a role for L-type Ca2+ channels in ouabain-induced c-Fos expression.
Figure 6. Effect of nicardipine (0.1 μM) on c-Fos protein expression after incubation of VSMC for 6 h in control and high-potassium media.

For composition of the control medium, see Fig. 2. In high-potassium medium, NaCl was substituted with KCl. Ouabain was added at final concentration of 1 mm.
As [Ca2+]i can be a potent trigger of c-Fos expression, we further investigated its potential involvement in ouabain-induced expression of c-Fos in VSMC. However, the following results do not support this possibility. First, we measured [Ca2+]i in the total population of fura-2-loaded cells. We did not observe any significant effect of 1 mm ouabain on [Ca2+]i or on the Ca2+ signal triggered by thapsigargin, an inhibitor of the sarcoplasmic reticulum Ca2+ pump (Fig. 7A and C). Second, we measured the F340/F380 ratio in single fura-2-loaded cells by fluorescence microscopy. We failed to find any systematic effect of ouabain on this parameter (Fig. 7B and D). Third, we measured the total content of exchangeable [Ca2+]i. After incubation of VSMC with ouabain for 6 h, the steady-state content of 45Ca in VSMC was slightly decreased rather than increased (Fig. 7E). Fourth, we examined the influence of [Ca2+]o on c-Fos expression in ouabain-treated cells. Figure 8 shows that the effect of ouabain on c-Fos expression was not dependent on the presence of CaCl2 in the incubation medium. Fifth, to maintain [Ca2+] in the incubation medium at a level less than 0.1 μM, we added 0.1 mm EGTA. Neither EGTA nor the [Ca2+]i chelator BAPTA affected c-Fos expression in ouabain-treated VSMC (Fig. 8). Taken together, these data rule out a role for [Ca2+]i in ouabain-induced c-Fos expression.
Figure 7. [Ca2+]i in control and ouabain-treated cells.
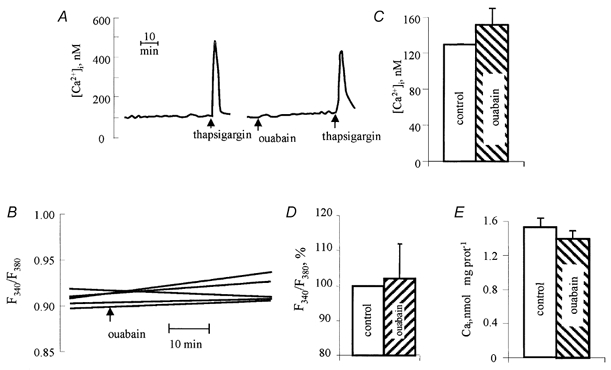
A, representative records of the effect of ouabain and thapsigargin on free [Ca2+]i measured in the total cell population. Additions of 1 mm ouabain and 0.5 μM thapsigargin are shown by arrows. B, representative records of the effect of ouabain on the F340/F380 ratio measured in five single cells by fluorescence ratio imaging. C, free [Ca2+]i in the total population of control cells and cells treated with 1 mm ouabain for 40 min. Means ± s.e.m. from six experiments are given. D, the F340/F380 ratio in control cells and cells treated with 1 mm ouabain for 60 min. The values of F340/F380 ratio in control cells was taken as 100 %. Means ± s.e.m. from the analysis of five to six single cells in three experiments are given. E, the content of exchangeable [Ca2+]i in control cells and cells treated with ouabain for 6 h. Means ± s.e.m. from experiments performed in quadruplicate are given.
Figure 8. Effect of ouabain on c-Fos protein expression in calcium-free medium and in BAPTA-loaded VSMC.
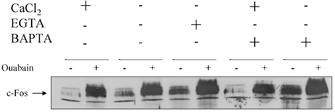
Quiescent VSMC were incubated for 30 min in DMEM in the absence or presence of 20 μM BAPTA-AM. This medium was then aspirated and the cells were incubated for the next 6 h in regular CaCl2-containing DMEM, in CaCl2-free DMEM or in CaCl2-free DMEM containing 0.1 mm EGTA, in the absence or presence of 1 mm ouabain.
Additive affect of ouabain and serum on c-Fos expression
The data described above were obtained on quiescent VSMC. Does inhibition of the Na+–K+ pump affect c-Fos expression in the presence of serum-derived growth factors?Figure 9A shows that the addition of serum to quiescent VSMC led to the same sharp and transient pattern of c-Fos mRNA expression as was observed with ouabain-treated cells (Fig. 4B), which complicates quantification of their combined action. In contrast to c-Fos mRNA expression, ouabain-induced c-Fos protein content stayed elevated and did not significantly decrease when incubated with the drug for between 2 and 12 h (Fig. 1), whereas it was sharply diminished within 6 h in serum-supplied cells (Fig. 9B). Using this time point, we observed that ouabain augmented c-Fos expression by approximately twofold in the presence of serum (Fig. 10), suggesting that the effects of ouabain and serum are additive.
Figure 9. Effect of serum on c-Fos mRNA (A) and protein (B) expression.
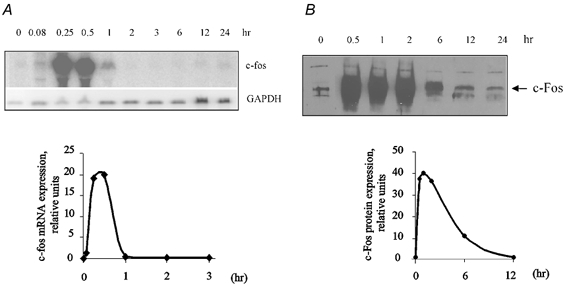
Above each of the graphs a representative Northern and Western blot is presented showing c-Fos mRNA (A) and protein expression (B) after stimulation of quiescent cells with 10 % serum. A, kinetics of the increment in c-Fos mRNA in serum-treated VSMC. B, kinetics of the increment in protein content in serum-treated VSMC. Since serum time-dependently augmented GAPDH mRNA, we did not use its content to normalize c-Fos mRNA expression. The value of c-Fos mRNA and protein expression in untreated cells was taken as 100 %. Means ± s.e.m. from three experiments are given.
Figure 10. Additive effect of serum and ouabain on c-Fos expression.
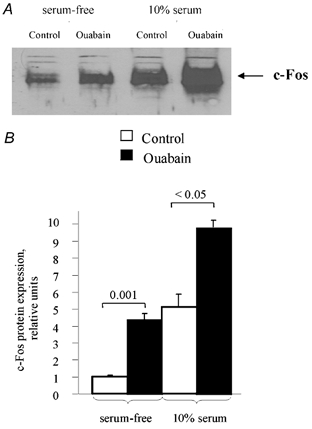
A, representative blot showing c-Fos protein in control quiescent cells and cells treated with 1 mm ouabain and 10 % calf serum for 6 h. B, relative content of c-Fos protein after incubation with serum and/or ouabain. c-Fos content in untreated cells was taken as 1.0. Means ± s.e.m. obtained from three experiments are shown.
Role of known c-Fos transcription factors
The additive effect of serum and ouabain on c-Fos expression suggests that these stimuli employ distinct transcription factors and/or distinct response elements of the c-Fos promoter. To examine this hypothesis, we studied the impact of ouabain on the activity of transcription factors known to regulate the c-Fos promoter. The c-Fos promoter contains three major transcriptional control elements: SRE interacting with ternary complex factors, such as Elk-1, and with SRF, cAMP/Ca2+ response element (CRE) interacting with CREB, and AP-1 interacting with the c-Fos-c-Jun complex to provide feedback regulation of c-Fos expression (Wang & Howells, 1994). The c-Fos-c-Jun complex becomes active under phosphorylation of c-Fos and c-Jun by extracellular signal-regulated protein kinase (ERK) and jun-kinase (JNK), respectively (Piechaczyk & Blanchard, 1994; Whitmarsh & Davis, 1996). Previously, we did not observe any activation of ERK1/2, JNK and p38 MAPK in ouabain-treated VSMC (Orlov et al. 2000b). In the present study, we examined the effect of ouabain on the activity of Elk-1, SRF, CREB and AP-1 transcription factors, using corresponding luciferase reporter assays. As shown in Table 1, the activity of these transcription factors was augmented by serum, which was used as a positive control. In contrast, ouabain did not affect the activity of Elk-1 or CREB, and even suppressed the basal expression of luciferase driven by SRF and AP-1.
Table 1.
Effect of ouabain, serum, isoproterenol and endothelin-1 on the activity of transcription factors in vascular smooth muscle cells (VSMC)
| Luciferase activity (relative light units, % of control) | |||
|---|---|---|---|
| Response element (transcription factor) | Control | Ouabain | Serum |
| SRE (Elk-1) | 100 ± 25 | 104 ± 6 | 245 ± 44 |
| SRE (SRF) | 100 ± 10 | 48 ± 4 | 1128 ± 78 |
| CRE (CREB) | 100 ± 25 | 100 ± 27 | 632 ± 55 |
| CRE (CREB) | 100 ± 25 | 100 ± 27 | 632 ± 55 |
| AP-1 (c-Fos/-Jun) | 100 ± 3 | 67 ± 13 | 663 ± 50 |
VSMC were transfected with the desired DNA and were serumstarved for 24 h in Dulbecco's modified Eagle's medium containing 0.2% calf serum, followed by incubation for an additional 6 h with or without 1 mM ouabain or 10% fetal bovine serum. The activity of transcription factors in the cell lysates was then measured by corresponding luciferase reporter assays (see Methods). Shown are means ± S.E.M. from representative experiments performed in quadruplicate. (SRE, serum response element; SRF, serum response factor; CRE, cAMP/Ca2+ response element; CREB, CRE binding protein; AP−1, activator protein 1).
Discussion
Our results show that inhibition of the Na+–K+ pump in VSMC with ouabain or potassium-depleted medium leads to massive c-Fos protein expression (Fig. 1 and Fig. 2), which is consistent with the transient c-Fos mRNA expression observed in several other cell types (Cayanis et al. 1992; Nakagawa et al. 1992; Numazawa et al. 1996; Peng et al. 1996; Joannidis et al. 1997; Olej et al. 1998; Ando et al. 2000). In VSMC, the addition of 1 μg ml−1 of actinomycin D completely blocked RNA synthesis (Orlov et al. 2000b). This inhibitor of RNA synthesis also blocked an increment in c-Fos production in ouabain-treated VSMC (data not shown), revealing that Na+–K+ pump inhibition elicits an increased rate of c-Fos RNA synthesis rather than a decreased rate of its degradation. By comparing the dose-dependencies of the effect of ouabain on Na+–K+ pump activity and [Na+]i and [K+]i content (Fig. 3), we demonstrated that induction of c-Fos expression is mediated by elevation of the [Na+]i/[K+]i ratio rather than by [Na+]i-[K+]i-independent systems triggered by the inactivated Na+–K+ pump, which has been studied in more detail in rat cardiomyocytes (Kometiani et al. 1998). Most importantly, we report here for the first time that: (1) c-Fos expression is triggered by elevation of [Na+]i rather than by decrease of [K+]i; (2) c-Fos expression in VSMC can also be triggered by elevated Ca2+ influx in depolarized cells (although the calcium-dependent pathway is not involved in the c-Fos expression triggered by Na+–K+ pump inhibition); (3) the [Na+]i-sensitive, [Ca2+]i-independent mechanism of c-Fos expression is not mediated by the activation of transcriptional factors coupled to the known response elements of its gene promoter.
Data on the relative contributions of [Na+]ivs.[K+]i in the regulation of gene expression are limited to a few publications. Thus, Ruiz-Opazo and co-workers (1997) reported augmented α1-Na+–K+-ATPase mRNA expression after treatment of A10 cells with monensin, an ionophore that provides electroneutral Na+-H+ exchange. Augmented α1-Na+–K+-ATPase mRNA expression was also observed in monensin-treated renal epithelial cells (Muto et al. 2000). It should be emphasized, however, that a key role of elevated [Na+]i proposed in these studies was not supported by comparative analysis of the effect of these compounds on [Na+]i and [K+]i content. This comment becomes important because in our experiments, the 6 h exposure of VSMC to 0.3 μg ml−1 monensin led to non-selective elevations of [Na+]i and [K+]i by ≈35 % and 80 %, respectively. Exposure of VSMC to valinomycin for 6 h provided selective transmembrane K+ movement, did not affect [Na+]i, but decreased [K+]i by twofold. Neither monensin nor valinomycin affected c-Fos expression in VSMC (data not shown). Keeping in mind these negative results and non-selective and/or modest effects of these compounds on [Na+]i and [K+]i content, we focused on the kinetics of ouabain-induced modulation of [Na+]i, [K+]i and c-Fos mRNA expression. Because the resting membrane potential of VSMC (Em≈-50 mV) is closer to EK than to ENa (≈-100 mV and +80 mV, respectively; Davis et al. 1997), inhibition of the Na+–K+ pump during the initial 1 h sharply augmented [Na+]i, but did not significantly affect [K+]i (Fig. 4). Maximal increment of c-Fos mRNA production was found within 30 min of ouabain addition, which allowed us to conclude that Na+–K+ pump inhibition triggers c-Fos expression via [Na+]i elevation.
Growth factors, peptide hormones and neurotransmitters affect c-Fos expression via activation of transcription factors by various protein kinases such as MAPK, protein kinase A and Ca2+-calmodulin-dependent protein kinase (for review, see Piechaczyk & Blanchard, 1994; Sheng et al. 1998; Whitmarsh & Davis, 2000). Data obtained in the present study show that the calcium-dependent pathway of c-Fos expression can be triggered by activation of L-type Ca2+ channels during sustained depolarization of VSMC in high-potassium medium (Fig. 6). This observation is consistent with the calcium-dependent excitation- transcription coupling seen in other electrically excitable cells (for review, see Anderson, 2000). However, in contrast to depolarized cells, we did not detect any effect of ouabain on [Ca2+]i handling (Fig. 7). Ouabain-induced c-Fos expression was not affected by the blockade of L-type Ca2+ channels (Fig. 6), or by the chelation of [Ca2+]o and [Ca2+]i (Fig. 8). These results contradict data showing that chelation of [Ca2+]o and [Ca2+]i results in the inhibition of ouabain-induced c-Fos expression in cardiomyocytes (Peng et al. 1996). It should be emphasized, however, that cardiomyocytes are rich in Na+-Ca2+ exchanger, and [Na+]i elevation in these cells sharply activates 45Ca influx (Blaustein & Lederer, 1999). Several research teams have reported that application of ouabain transiently increases [Ca2+]i in freshly isolated aortic strips and primary cultured VSMC (for review, see Blaustein & Lederer, 1999). In our cells, which were subjected to more than 10 passages, we failed to observe any effect of ouabain on 45Ca uptake (Orlov et al. 1993) or on [Ca2+]i (Fig. 7A-D) and exchangeable [Ca2+]i content (Fig. 7E). Regardless of the mechanism of downregulation of the Na+-Ca2+ exchanger in VSMC used in our study, it is important to stress that this phenomenon allowed us to dissect calcium-dependent and sodium-dependent mechanisms of c-Fos expression revealed in cells subjected to depolarization in K+-free medium and in cells treated with ouabain, respectively.
Previously, we did not detect MAPK activation in ouabain-treated VSMC (Orlov et al. 2000b). Viewed collectively with these studies, our present results suggest that neither calcium-dependent kinases nor downstream steps of MAPK signalling contribute to activation of the c-Fos promoter in ouabain-treated VSMC. To test this hypothesis and to assess the involvement of other known mechanisms of c-Fos induction, we examined the role of SRE, CRE and AP-1, the established regulatory elements of the c-Fos promoter, in [Na+]i-dependent c-Fos expression. Our data, summarized in Table 1, show that none of these regulatory elements is involved in triggering ouabain-induced c-Fos expression, suggesting the existence of other elements in the c-Fos promoter that interact with transcription factor(s) distinct from Elk-1, SRF, CREB and AP1. The recently discovered intragenic regulation of c-Fos expression via suppression of a transcriptional pause site, located at intron 1 of the c-Fos gene (Coulon et al. 1999), is in accordance with this notion. Such a possibility will be addressed in future studies.
In conclusion, our results show that inhibition of the Na+–K+ pump triggers c-Fos expression by a [Na+]i-sensitive, [Ca2+]i-independent mechanism, without the recruitment of transcription factors known to stimulate the c-Fos promoter. This raises at least two questions: What is the molecular origin of the [Na+]i sensor that triggers the initial signal? Which systems are involved in downstream signal transduction and activation of the c-Fos promoter? We will address these questions in forthcoming experiments.
Acknowledgments
This study was supported by grants from the Canadian Institutes of Health Research (MT-10803) and the Heart and Stroke Foundation of Canada. The technical assistance of Monique Poirier and the editorial help of Ovid Da Silva are appreciated.
References
- Anderson ME. Connections count. Excitation-contraction meets excitation-transcription coupling. Circulation Research. 2000;86:717–719. doi: 10.1161/01.res.86.7.717. [DOI] [PubMed] [Google Scholar]
- Ando K, Omi N, Shimosawa T, Takanashi K, Fujita T. Effect of ouabain on the growth and DNA synthesis of PC12 cells. Journal of Cardiovascular Pharmacology. 2000;37:233–238. doi: 10.1097/00005344-200103000-00001. [DOI] [PubMed] [Google Scholar]
- Aydemir-Koksoy A, Allen JC. Low concentrations of ouabain induce vascular smooth muscle proliferation. Cellular and Molecular Biology. 2001;47:341–345. [PubMed] [Google Scholar]
- Blanco G, Merger RW. Isozymes of the Na-K-ATPase: heterogeneity in structure, diversity in function. American Journal of Physiology. 1998;275:F663–650. doi: 10.1152/ajprenal.1998.275.5.F633. [DOI] [PubMed] [Google Scholar]
- Blaustein MP, Lederer WJ. Sodium/calcium exchange: its physiological implications. Physiological Reviews. 1999;79:763–854. doi: 10.1152/physrev.1999.79.3.763. [DOI] [PubMed] [Google Scholar]
- Burg M B. Molecular basis of osmotic regulation. American Journal of Physiology. 1995;268:F983–996. doi: 10.1152/ajprenal.1995.268.6.F983. [DOI] [PubMed] [Google Scholar]
- Cayanis E, Russo JJ, Wu Y, Edelman IS. Serum independence of low K+ induction of Na-K-ATPase: possible role of c-fos. Journal of Membrane Biology. 1992;125:163–170. doi: 10.1007/BF00233355. [DOI] [PubMed] [Google Scholar]
- Chueh SC, Guh JH, Chen J, Lai MK, Teng CM. Dual effect of ouabain on the regulation of proliferation and apoptosis in human prostatic smooth muscle cells. Journal of Urology. 2001;166:347–353. [PubMed] [Google Scholar]
- Contreras RG, Shoshani L, Flores-Maldonado C, Lazaro A, Cereijido M. Relationship between Na+, K+-ATPase and cell attachment. Journal of Cell Science. 1999;112:4223–4232. doi: 10.1242/jcs.112.23.4223. [DOI] [PubMed] [Google Scholar]
- Coulon V, Veyrune JL, Tourkine N, Vié A, Hipskind RA, Blanchard JM. A novel calcium signaling pathway targets the c-fos intragenic transcriptional pausing site. Journal of Biological Chemistry. 1999;274:30439–30446. doi: 10.1074/jbc.274.43.30439. [DOI] [PubMed] [Google Scholar]
- Davis JP, Harper AA, Chipperfield AR. Stimulation of intracellular chloride accumulation by noradrenaline and hence potentiation of its depolarization of rat arterial smooth muscle in vitro. British Journal of Pharmacology. 1997;122:639–642. doi: 10.1038/sj.bjp.0701431. [DOI] [PMC free article] [PubMed] [Google Scholar]
- Golomb E, Hill MR, Brown RB, Keiser HR. Ouabain enhanced the mitogenic effect of serum in vascular smooth muscle cells. American Journal of Hypertension. 1994;7:69–74. doi: 10.1093/ajh/7.1.69. [DOI] [PubMed] [Google Scholar]
- Goto A, Yamada K. Putative roles of ouabain-like compound in hypertension: revised. Hypertension Research. 2000;23:7–13. doi: 10.1291/hypres.23.supplement_s7. [DOI] [PubMed] [Google Scholar]
- Henningsen N, Stavenow L, Borg C. Effect of ouabain and potassium on rabbit arterial smooth muscle cells in culture. Scandinavian Journal of Clinical and Laboratory Investigation. 1984;44:197–201. doi: 10.3109/00365518409083796. [DOI] [PubMed] [Google Scholar]
- Hill CS, Wynne J, Treisman R. The Rho family GTPases RhoA, Rac1, and CDC42Hs regulate transcriptional activation by SRF. Cell. 1995;81:1159–1170. doi: 10.1016/s0092-8674(05)80020-0. [DOI] [PubMed] [Google Scholar]
- Isaev NK, Stelmashook EV, Halle A, Harms C, Lautenschlager M, Weih M, Dirnagl U, Victorov IV, Zorov DB. Inhibition of Na+, K+-ATPase activity in cultured cerebellar granule cells prevents the onset of apoptosis induced by low potassium. Neuroscience Letters. 2000;283:41–44. doi: 10.1016/s0304-3940(00)00903-4. [DOI] [PubMed] [Google Scholar]
- Joannidis M, Cantley LG, Spokes K, Stuart-Tilley AK, Alper SL, Epstein FH. Modulation of c-fos and egr-1 expression in the isolated perfused kidney by agents that alter tubular work. Kidney International. 1997;52:130–139. doi: 10.1038/ki.1997.312. [DOI] [PubMed] [Google Scholar]
- Juhasova M, Blaustein MP. Na+ pump low and high ouabain affinity α subunit isoforms are differently distributed in cells. Proceedings of the National Academy of Sciences of the USA. 1997;94:1800–1805. doi: 10.1073/pnas.94.5.1800. [DOI] [PMC free article] [PubMed] [Google Scholar]
- Kometiani P, Li J, Gnudi L, Kahn BB, Askari A, Xie Z. Multiple signal transduction pathways link Na+/K+-ATPase to growth-related genes in cardiac myocytes: the roles of ras and mitogen-activated protein kinases. Journal of Biological Chemistry. 1998;273:15249–15256. doi: 10.1074/jbc.273.24.15249. [DOI] [PubMed] [Google Scholar]
- Larner AC, Finbloom DS. Protein tyrosine phosphorylation as a mechanism which regulates cytokine activation of early response genes. Biochimica et Biophysica Acta. 1995;1266:278–287. doi: 10.1016/0167-4889(95)00015-k. [DOI] [PubMed] [Google Scholar]
- Liu J, Tian J, Haas M, Shapiro JI, Askari A, Xie Z. Ouabain interaction with cardiac Na+/K+-ATPase initiates signal cascade independent of changes in intracellular Na+ and Ca2+ concentrations. Journal of Biological Chemistry. 2000;275:27838–27844. doi: 10.1074/jbc.M002950200. [DOI] [PubMed] [Google Scholar]
- Lubin M. Intracellular potassium and macromolecular synthesis in mammalian cells. Nature. 1967;213:451–453. doi: 10.1038/213451a0. [DOI] [PubMed] [Google Scholar]
- Lubin M, Ennis HL. On the role of intracellular potassium in protein synthesis. Biochimica et Biophysica Acta. 1964;80:614–631. doi: 10.1016/0926-6550(64)90306-8. [DOI] [PubMed] [Google Scholar]
- Murata Y, Matsuda T, Tamada K, Hosoi R, Asano S, Takuma K, Tanaka K, Baba A. Ouabain-induced cell proliferation in cultured rat astrocytes. Japanese Journal of Pharmacology. 1996;72:347–353. doi: 10.1254/jjp.72.347. [DOI] [PubMed] [Google Scholar]
- Muto S, Nemoto J, Okada K, Miyata Y, Kawakami K, Saito T, Asano Y. Intracellular Na+ directly modulates Na+, K+-ATPase gene expression in normal rat kidney epithelial cells. Kidney International. 2000;57:1617–1653. doi: 10.1046/j.1523-1755.2000.00006.x. [DOI] [PubMed] [Google Scholar]
- Muto S, Ohtaka A, Nemoto J, Kawakami K, Asano Y. Effect of hyperosmolality on Na, K-ATPase gene expression in vascular smooth muscle cells. Journal of Membrane Biology. 1998;162:233–245. doi: 10.1007/s002329900361. [DOI] [PubMed] [Google Scholar]
- Nakagawa Y, Rivera V, Larner AC. A role for Na/K-ATPase in the control of human c-fos and c-jun transcription. Journal of Biological Chemistry. 1992;267:8785–8788. [PubMed] [Google Scholar]
- Numazawa S, Inoru N, Nakuta H, Sugiyama T, Fijino E, Shinoki M, Yoshida T, Kuroiwa Y. A cardiac steroid bufalin-induced differentiation of THP-cells. Involvement of Na+, K+-ATPase inhibition in the early changes on proto-oncogene expression. Biochemical Pharmacology. 1996;52:321–329. doi: 10.1016/0006-2952(96)00210-9. [DOI] [PubMed] [Google Scholar]
- Olej B, Dos Santos NF, Leal L, Rumjanek VM. Ouabain induces apoptosis in PHA-activated lymphocytes. Bioscience Report. 1998;18:1–7. doi: 10.1023/a:1022259832207. [DOI] [PubMed] [Google Scholar]
- Orlov SN, Adarichev VA, Devlin AM, Maximova NV, Sun YL, Tremblay J, Dominiczak AF, Postnov YV, Hamet P. Increased Na+/H+ exchanger isoform 1 activity in spontaneously hypertensive rats: lack of mutations within coding region of NHE1. Biochimica et Biophysica Acta. 2000a;1500:169–180. doi: 10.1016/s0925-4439(99)00101-5. [DOI] [PubMed] [Google Scholar]
- Orlov SN, Resink TJ, Bernhardt J, Ferracin F, Buhler FR. Vascular smooth muscle cell calcium transport. Regulation by angiotensin II and lipoproteins. Hypertension. 1993;21:195–203. doi: 10.1161/01.hyp.21.2.195. [DOI] [PubMed] [Google Scholar]
- Orlov SN, Taurin S, Thorin-Trescases N, Dulin NO, Tremblay J, Hamet P. Inversion of the intracellular Na+/K+ ratio blocks apoptosis in vascular smooth muscle cells by induction of RNA synthesis. Hypertension. 2000b;35:1062–1068. doi: 10.1161/01.hyp.35.5.1062. [DOI] [PubMed] [Google Scholar]
- Orlov SN, Taurin S, Tremblay J, Hamet P. Inhibition of Na+, K+ pump affects nucleic acid synthesis and smooth muscle cell proliferation via elevation of the [Na+]i/[K+]i ratio: possible implication in vascular remodeling. Journal of Hypertension. 2001;19:1559–1565. doi: 10.1097/00004872-200109000-00007. [DOI] [PubMed] [Google Scholar]
- Orlov SN, Thorin-Trescases N, Kotelevtsev SV, Tremblay J, Hamet P. Inversion of the intracellular Na+/K+ ratio blocks apoptosis in vascular smooth muscle at a site upstream of caspase-3. Journal of Biological Chemistry. 1999;274:16545–16552. doi: 10.1074/jbc.274.23.16545. [DOI] [PubMed] [Google Scholar]
- Orlov SN, Tremblay J, Hamet P. cAMP signaling inhibits dihydropyridine-sensitive Ca2+ influx in vascular smooth muscle cells. Hypertension. 1996;27:774–780. doi: 10.1161/01.hyp.27.3.774. [DOI] [PubMed] [Google Scholar]
- Peng M, Huang L, Xie Z, Huang WH, Askari A. Partial inhibition of Na+/K+-ATPase by ouabain induces the Ca2+-dependent expression of early-response genes in cardiac myocytes. Journal of Biological Chemistry. 1996;271:10372–10378. doi: 10.1074/jbc.271.17.10372. [DOI] [PubMed] [Google Scholar]
- Piechaczyk M, Blanchard JM. c-fos proto-oncogene regulation and function. Critical Reviews in Oncology and Hematology. 1994;17:93–131. doi: 10.1016/1040-8428(94)90021-3. [DOI] [PubMed] [Google Scholar]
- Ruiz-Opazo N, Cloix JF, Melis MG, Xiang XH, Herrera VLM. Characterization of a sodium-response transcriptional mechanism. Hypertension. 1997;30:191–198. doi: 10.1161/01.hyp.30.2.191. [DOI] [PubMed] [Google Scholar]
- Sahin-Erdemli I, Rashed SM, Songu-Mize E. Rat vascular tissues express all three α-isoforms of Na+–K+-ATPase. American Journal of Physiology. 1994;266:H350–H353. doi: 10.1152/ajpheart.1994.266.1.H350. [DOI] [PubMed] [Google Scholar]
- Sheng M, Dougan ST, McFadden G, Greenberg ME. Calcium and growth factor pathways of c-Fos transcriptional activation require distinct upstream regulatory sequences. Molecular and Cell Biology. 1998;8:2787–2796. doi: 10.1128/mcb.8.7.2787. [DOI] [PMC free article] [PubMed] [Google Scholar]
- Szamel M, Reshkin SJ. Inhibition of lymphocyte activation by ouabain. Interference with the early activation of membrane phospholipid metabolism. Biochimica et Biophysica Acta. 1981;647:297–301. doi: 10.1016/0005-2736(81)90258-3. [DOI] [PubMed] [Google Scholar]
- Therien AG, Blostien R. Mechanisms of sodium pump regulation. American Journal of Physiology. 2000;279:C541–566. doi: 10.1152/ajpcell.2000.279.3.C541. [DOI] [PubMed] [Google Scholar]
- Wang WW, Howells RD. Sequence of the 5′-flanking region of the rat c-fos proto-oncogene. Gene. 1994;143:261–264. doi: 10.1016/0378-1119(94)90107-4. [DOI] [PubMed] [Google Scholar]
- Whitmarsh AJ, Davis RJ. Transcription factor AP-1 regulation by mitogen-activated protein kinase signal transduction pathways. Journal of Molecular Medicine. 1996;74:589–607. doi: 10.1007/s001090050063. [DOI] [PubMed] [Google Scholar]
- Whitmarsh AJ, Davis RJ. Regulation of transcription function by phosphorylation. Cellular and Molecular Life Sciences. 2000;57:1172–1183. doi: 10.1007/PL00000757. [DOI] [PMC free article] [PubMed] [Google Scholar]
- Willis JS, Ellory JC. Ouabain-sensitivity: diversities and disparities. In: Hoffman JF, Forbush B III, editors. Current Topics in Membranes and Transport. Vol. 19. New York: Academic Press; 1983. pp. 227–280. [Google Scholar]
- Yamamoto K, Ikeda U, Saito T, Kawakami K, Shimada K. Sodium ion mediated regulation of Na/K-ATPase gene expression in vascular smooth muscle cells. Cardiovascular Research. 1994;28:957–962. doi: 10.1093/cvr/28.7.957. [DOI] [PubMed] [Google Scholar]
- Zhou X, Jiang G, Zhao A, Bondeva T, Hirzel P, Balla T. Inhibition of Na, K-ATPase activates PI3 kinase and inhibits apoptosis in LLC-PK1 cells. Biochemical and Biophysical Research Communications. 2001;285:46–51. doi: 10.1006/bbrc.2001.5126. [DOI] [PubMed] [Google Scholar]


