

Abstract
This study examined whether evoked magnetic fields and intra- and extracellular potentials from longitudinal CA3 slices of guinea-pig can be interpreted within a single theoretical framework that incorporates ligand- and voltage-sensitive conductances in the dendrites and soma of the pyramidal cells. The 1991 CA3 mathematical model of R. D. Traub is modified to take into account the asymmetric branching patterns of the apical and basal dendrites of the pyramidal cells. The revised model accounts for the magnitude and waveform of the bi- and triphasic magnetic fields evoked by somatic and apical stimulations, respectively, in the slice in the absence of fast inhibition (blocked by 0.1 mm picrotoxin). The revised model also accounts for selective effects of 4-aminopyridine (4-AP) and tetraethylammonium (TEA), which block the potassium channels of A and C type, respectively, on the slow wave of the magnetic fields. Furthermore, the model correctly predicts the laminar profiles of field potential as well as intracellular potentials in the pyramidal cells produced by two classes of cells - those directly activated and those indirectly (synaptically) activated by the applied external stimulus. The intracellular potentials in this validated model reveal that the spikes and slow waves of the magnetic fields are generated in or near the soma and apical dendrites, respectively. These results demonstrate that a single theoretical framework couched within the modern concepts of cellular physiology provides a unified account of magnetic fields outside the slice, extracellular potentials within the slice and intracellular potentials of the pyramidal cells for CA3.
In the past 20 years, concepts in cellular electrophysiology have undergone dramatic changes due to discoveries of active channels, i.e. ligand and voltage-sensitive conductances, in the membrane (Llinás, 1984, 1988; Traub & Miles, 1991; Traub et al. 1999; Hille, 2001). Unlike the classic cable model of central nervous system (CNS) neurons, these active channels are distributed throughout the dendrites and soma. Such discoveries have led to re-examination of the genesis of evoked and spontaneous magneto-encephalography (MEG) and electro-encephalography (EEG) signals within the modern conceptual framework of CNS cellular physiology (Lopes da Silva, 1991; Okada et al. 1997; Wu & Okada,1998, 1999, 2000; Buzsáki, 2002).
The present investigation examined this issue by evaluating whether it is possible to interpret three distinct types of data - MEG signals outside the slice, extracellular field potentials within the slice and intracellular potentials of the pyramidal cells - in terms of a single mathematical model that incorporates ligand- and voltage-sensitive conductances in model neurons. The evaluation was carried out for the longitudinal CA3 slice of guinea-pig hippocampus because such a combined theoretical and experimental analysis can be carried out with this preparation. A high-resolution MEG sensor developed for this purpose (Buchanan et al. 1989; Okada et al. 1994) is capable of providing clear magnetic field signals from the CA3 slice preparation even on single trials without averaging (Okada & Xu, 1996). Thus, the magnetic field as well as intra- and extracellular potentials can be collected from this preparation (Kyuhou & Okada, 1993; Okada et al. 1997; Wu & Okada, 1998, 1999, 2000). Traub and his colleagues have developed mathematical models for CA3 (Traub et al. 1991, 1994, 1999; Traub & Miles, 1991). These models have been thoroughly validated for intracellular data from the CA3. Thus, Traub's models provide a mathematical framework for this analysis. In the present analysis, a mathematical model provided by Traub served as the basic model. It is essentially the same as his 1991 model (Traub et al. 1991) with a few improvements implemented in his later models (Traub et al. 1992, 1993). This was selected as the basic model over the more recent models with branched dendrites (e.g. Traub et al. 1994) because of its representation of the pyramidal neurons as single equivalent cylinders arranged in parallel to each other (Rall, 1962). The spatial distribution of the evoked MEG signal above the slice is dipolar and the generators of the underlying currents can be modelled by a set of dipolar currents in these cylinders that are arranged parallel to each other (Okada et al. 1997). Thus, it was best suited for the analysis of evoked magnetic fields.
An earlier analysis showed that the basic model required certain modifications, even though it accounted for basic features of evoked magnetic fields and intra- and extracellular potentials (Okada & Wu, 1998). The critical aspects of the model requiring revision were thus identified and a revised model was developed as part of the present investigation. As described below, the revised model was capable of providing a remarkably accurate detailed account of the three types of data. The results provide new insights into the genesis of these signals within a unified modern conceptual framework of CNS electrophysiology.
METHODS
Experimental methods
All experimental procedures were carried out according to the guidelines of the National Institutes of Health. The experimental methods have already been described (Okada et al. 1997; Wu & Okada, 1998). Here, the methods are described briefly in order to help interpret the empirical data presented for comparison with theoretical signals. The hippocampus of an adult guinea-pig was removed from the brain under anaesthesia, placed on an agar block and cut as shown in Fig. 1A to obtain longitudinal CA3 slices. The CA1 was removed and the edges were cut to obtain a longitudinal CA3 slice which was 0.4 mm thick, about 6 mm wide and 2 mm high (Fig. 1B). The slice was placed in a submersion type, non-ferromagnetic chamber (Fig. 1C) and superfused with oxygenated physiological saline (Ringer solution). Picrotoxin (PTX, 0.1 mm) was added to this Ringer solution to block GABAA receptors. An array of bipolar stimulating electrodes made of silver wire was placed against the slice from below to synchronously stimulate the pyramidal cells. The field potentials were measured with an array of silver wire recording electrodes placed in the slice from below. The magnetic field was measured with four detecting coils of high-resolution MEG sensor placed 2 mm above the slice (Fig. 1D). The magnetic field and extracellular field potential measured simultaneously were amplified, bandpassed from 0.1-1 Hz (highpass filter) and 1–2 kHz (lowpass filter), and digitally averaged on-line. In other experiments, the intracellular potential was measured with a glass micropipette (3 m KCl or potassium acetate) along with the extracellular field potentials in the same chamber used for simultaneous MEG and field potential recordings. A DC-coupled amplifier with a low pass filter of 10 kHz was used.
Figure 1. Longitudinal CA3 slice preparation and experimental arrangement.
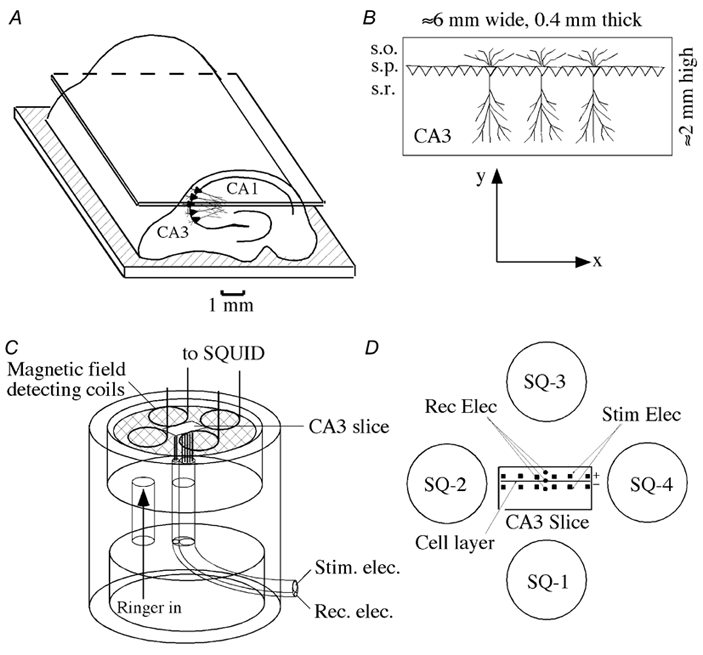
A, arrangement for cutting the hippocampus to obtain a 400 μm thick CA3 slice. B, schematic representation of the CA3 geometry. Pyramidal cells were arranged parallel to each other with their cell bodies along the stratum pyramidale (s.p.; x axis) and their longitudinal axis along the orthogonal direction (y axis). Basal dendrites were in the stratum oriens (s.o.) and apical dendrites in the stratum radiatum (s.r.). C, arrangement for measuring the magnetic field, field potentials and intracellular potentials. A slice was placed on a nylon net and superfused with oxygenated physiological saline from below. Stimulating and recording electrodes (125 μm Ag-AgCl wires) were placed from below and the magnetic field detection coils connected to superconducting quantum interference devices (SQUIDs; Okada et al. 1994) were placed 2 mm above the slice. In some experiments, the field potential was measured with a glass micropipette filled with 2 m NaCl. Intracellular potentials from the pyramidal cells were measured with a sharp glass micropipette filled with 3 m KCl. D, geometry of the stimulating and recording arrangements. An array of bipolar electrodes, positive and negative electrodes, separated by 400 μm, were placed along the cell layer with a spacing of about 800 μm between pairs of electrodes. Three extracellular field potential recording electrodes were placed in the basal, soma and apical regions of the pyramidal cells. Four SQUID channels (SQ-1 to SQ-4) were centred over the slice.
Mathematical model - basic model
The basic model was essentially the same as the 1991 CA3 Traub model (Traub et al. 1991). It consisted of 100 excitatory cells (e-cells), representing the pyramidal neurons and 20 inhibitory cells (i-cells), representing the interneurons. Each cell type was a 19 compartment, equivalent single-cylinder model as shown in Fig. 2A and B. The basal dendrites were represented by eight compartments (1-8), the soma by one compartment (9) and the apical dendrites by 10 compartments (10-19). Each e-cell contained two types of excitatory synapses - the AMPA-type receptors (labelled as Quis for the quisqualate receptors in Traub et al. 1991) and NMDA receptors - in compartments 3 and 15. Each e-cell also contained GABAA receptors in the soma and adjacent compartments (8-10), and GABAB receptors in one compartment of the basal and apical dendrites (3 and 15). In addition to these receptor types, each e-cell contained six types of active ion-gated conductances sensitive to membrane voltage and/or intracellular calcium concentration: voltage-sensitive sodium conductance, gNa; voltage-sensitive potassium conductance of delayed rectifier type, gK(DR); voltage-sensitive potassium conductance of A-type, gK(A); voltage-sensitive calcium conductance, gCa; voltage- and calcium-sensitive potassium conductance of C-type, gK(C) and calcium-sensitive potassium conductance of AHP-type, gK(AHP). The distributions of channel density shown in Fig. 2A are those of the revised model described below. Each i-cell (see Fig. 2B) contained AMPA, NMDA and GABAA receptors at the same locations as in the e-cells, but had only two types of active ion-gated conductances - gNa and gK(DR). The channel distributions shown in Fig. 2B are those of the basic model. They were unaltered in the revised model. The Hodgkin-Huxley-type equations were used to calculate the forward and backward kinetics of the activation and inactivation processes for each ion-gated channel.
Figure 2. CA3 model (from Traub et al. 1991).
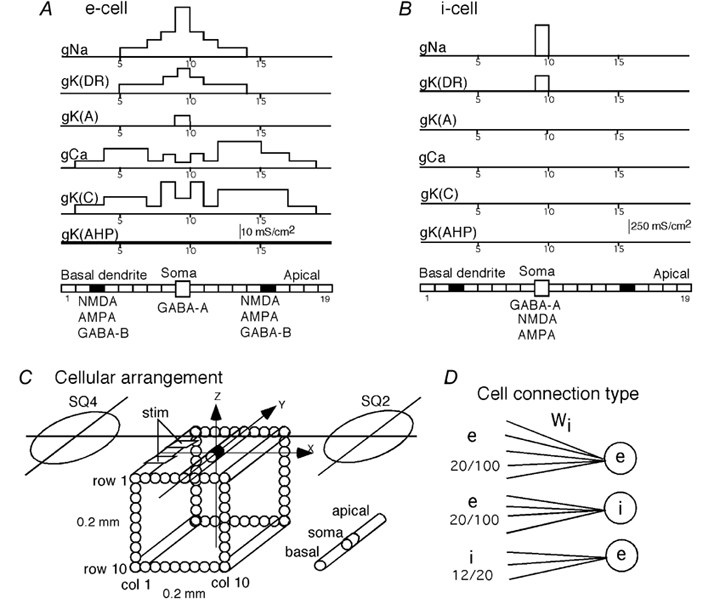
A, multi-compartment, equivalent single-cylinder representation of model pyramidal cells (e-cells) together with the distribution of channel densities of the active conductances. B, similar model for the inhibitory interneurons (i-cells). Note that i-cells had only gNa and gK(DR) both located only in soma. (For a more detailed explanation see Methods.) C, geometric arrangement of e-cells in a square array of 10 × 10 cells, spaced 20 μm apart. A bipolar stimulating electrode was placed in columns 1-3. The SQUID channels (SQ-2 and SQ-4) were placed at the same locations as in our experiments. D, three types of cell-cell connections represented in the present simulation study. e → e: randomly selected, 20 out of 100, e-cells made synaptic connections to each e-cell with synaptic weight Wi which depended on e-e cell distance. e → i: randomly selected, 20 out of 100, e-cells made synpatic connections with each i-cell with a uniform synaptic weight. i →e: randomly selected, 12 out of 20, i-cells contacted each e-cell with a uniform synaptic weight.
As shown in Fig. 2C, 100 e-cells were arranged in a square matrix of 0.2 mm × 0.2 mm with a grid spacing of 20 μm corresponding to the soma diameter of the e-cells. An array of bipolar stimulating electrodes was placed along the pyramidal cell layer with a spacing of 0.8 mm. This array produced highly synchronized activity across the slice (Okada et al. 1997). Thus, activity within each cross-sectional area between two pairs of bipolar electrodes could be assumed to be identical across the slice. Furthermore, the activation pattern could be assumed to be symmetrical with respect to the midline between the two pairs of stimulating electrodes. Thus, the unit cross-sectional area was half the cross-sectional area between pairs of stimulating electrodes or 0.4 mm × 0.4 mm for a 0.4 mm-thick slice. The basic model (0.2 mm × 0.2 mm) was half the length along each dimension of the experimental slice.
The basic model contained four types of cellular connections. Figure 2D shows three of these connections that were effective in the present simulation study. Each e-cell received synaptic contacts from 20 out of 100 randomly selected e-cells with a synaptic weight that was an exponential function of the distance between the cells divided by a space constant (Fig. 2D). Each of 20 i-cells received contacts from 20 out of 100 randomly selected e-cells with a fixed synaptic strength independent of cell-to-cell distance. Each of 100 e-cells received synaptic contacts from 12 out of 20 randomly selected i-cells with a fixed synaptic weight. The equations for synaptic transmission and the kinetics of AMPA, NMDA and GABAB channels were adopted from an improved version of the model (Traub et al. 1992). In the basic model, a presynaptic cell sent a spike to its follower cells when the soma was depolarized to more than 20 mV and when no spike had been sent for at least 3 ms. Upon a synaptic input, the unitary conductance of AMPA channels in a postsynaptic cell increased according to the following equation: dS/dt=σ(t) - S/τ, where S was a variable proportional to unitary synaptic conductance, σ represented opening of a channel and was set to 1 for 2 ms and then set to zero thereafter, and the time constant τ was 2 ms. This time constant was varied in the present study to simulate the effects of 4-aminopyridine (4-AP). The contributions from multiple presynaptic spikes were added together with a constraint that S≤Smax. The kinetics for NMDA channels depended on S with σ= 1 for 5 ms and set to zero thereafter, and τ= 150 ms, plus an additional factor g which was voltage and Mg2+ sensitive (Traub et al. 1993). GABAB receptor kinetics were the same as in the 1991 Traub model (Traub et al. 1991).
Revisions to the basic model
The revised model contained three types of modifications in order to account for the magnetic field and field potential data better. First, some of the distributions of channel density were modified. Channel distribution along the longitudinal axis of the pyramidal cell is not well understood for most of the channels represented in the model and the distributions are somewhat arbitrarily chosen to account for intracellular data (Traub & Miles, 1991; Traub et al. 1994). The studies by D. Johnston and his colleagues indicated that the channel densities for gNa, gCa and gK(A) in the CA1 are different from those assumed for CA3 in the basic model (Johnston et al. 1996, 2000; Magee et al. 1998). Thus, simulations were carried out with different channel distributions. In making modifications, attempts were made to stay as close as possible to the basic model since the original model parameters were carefully chosen by Traub to be consistent with empirical data as much as possible. According to our initial analysis, the basic model could not account for short-latency spikes in the MEG and field potential data. Thus, the distributions for gNa and gK(DR) were spread more widely along the dendrites with a unimodal distribution, as shown in Fig. 2A, instead of the trimodal distribution assumed in the basic model. The channel distributions of gCa and gK(C) were also varied to account for the MEG data, but no satisfactory results were obtained when the distributions deviated significantly from those of the basic model. The final distributions shown in Fig. 2A are similar to those of the basic model. The channel distribution of gK(A) does not extend to the dendrites, even though this conductance was found extensively across the dendrites of the pyramidal cells in CA1 (Johnston et al. 2000).
Second, the dendritic branching was taken into account in calculating the magnetic fields and field potentials. The intracellular current in any dendrite can be decomposed into a component parallel to the longitudinal axis of the pyramidal cells and a component orthogonal to this axis. When two dendrites of symmetrically branched neurons intersect, the longitudinal components of their intracellular currents should add, whereas their orthogonal components should cancel each other. Thus, the magnetic field should be due to the longitudinal component. The observed spatial distribution of the magnetic field on the bath surface just above a slice was consistent with this conclusion (Okada et al. 1997). Since the currents add vectorially, the contribution of branched dendrites to the external magnetic field is reduced when the branching is heavy and the longitudinal component is consequently reduced. This effect of branching was represented by estimating the component of the intracellular currents along the longitudinal axis from representative branching geometries of the pyramidal cells (Traub et al. 1994). The relative contribution was expressed by a weight between 0 and 1.0. The weights were 0.125 for compartments 1-6, 0.5 for compartment 7, 0.75 for compartment 8, 1.0 for compartments 9–12 and 0.375 for compartments 13-19. The final weights were adjusted by trial and error instead of starting with a representative branching geometry and formally transforming it to an equivalent cylinder. The same weights were also used in calculating the field potentials within the slice since they were also determined by intracellular currents.
Third, a change was made in the space constant (λ) which determines the synaptic weight between e-cells. The weight depends on an exponential function: exp(-z/λ), where z is the cell-to-cell distance. In the basic model the connectivity space constant was a 25-cell distance. This led to nearly synchronous activation of the e-cells within the entire model slice contrary to experimental data. In the revised model this distance was shortened to a 2-cell distance to compensate for the fact that the model slice was one quarter of the unit cross-sectional area for experimental CA3 slices. This change effectively increased the distance between cells and reduced the propagation speed. The 2-cell distance accounted for the slow waves of the magnetic fields.
In addition, some specific modifications were made to the revised model to test whether it could account for effects of 4-AP and TEA on the magnetic fields. The effects of 4-AP and TEA on the magnetic fields were simulated as follows. The 4-AP is known to not only block gK(A), but also to increase the effectiveness of AMPA neurotransmission by increasing the time constant of AMPA channels (Traub et al. 1995). These effects were simulated by setting gK(A)= 0 and increasing the time constant (τ) of AMPA activation kinetics from 2 up to 10 ms. The value of τ in the basic model was 2 ms. TEA is known to block gK(C). The blocking effect of TEA was modelled by altering the steady-state activation function (c∞) without changing time constant τc of the activation function for the C-channel. The c∞ and τc are defined as:
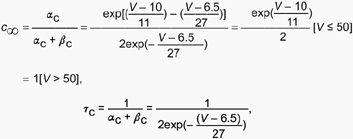 |
where αc is forward and βc backward activation function. The midpoint of the steady-state activation function (c∞= 0.5) was set to 10 mV in the basic model for V < 50 mV (depolarization of 50 mV above the resting potential). In the revised model this function was shifted toward the depolarizing direction by 2 mV, from 10, 11 and up to 12 mV relative to the resting membrane potential of −60 mV. These changes then determined new αc and βc values.
Modelling of the extracellular stimulation
The externally applied stimulation within each unit volume of tissue (half the volume between two pairs of stimulating electrodes) was simulated by placing a pair of bipolar electrodes over columns 1–3 of the model slice as shown in Fig. 2C. One electrode was placed next to compartment 9 (soma) and the other next to compartment 15. In the actual experiments, the electrode distance for each bipolar pair was about 400 μm. Simulations were carried out for two stimulation conditions. In somatic stimulation, a rectangular 50 μs pulse of negative potential was applied to the extracellular space next to compartment 9 and an equal, but opposite rectangular pulse of positive potential to the extracellular space next to compartment 15. Apical stimulation was the same as somatic stimulation but with opposite charges. The effects of extracellular stimulation have been carefully studied by McIntyre & Grill (1999). In their method for a model neuron, the extracellular potential generated by a constant current stimulus was calculated as a function of distance between the stimulating electrodes and each compartment of the model neuron, then the extracellular potentials along the longitudinal axis of the model were used to estimate the intracellular current which was, in turn, used to compute the transmembrane potential. In the present study, the transmembrane potential at time step n was calculated by subtracting the extracellular potential at time step n - 1 from the intracellular potential at time step n - 1. The transmembrane potential was used to compute channel conductances and intracellular potential for time step n. When a negative extracellular potential is applied, the intracellular potentials in the adjacent cells also become negative, but their transmembrane potentials are relatively depolarized and thus the neurons can be activated.
Percentage of neurons directly activated by the stimulation
In order to carry out the simulations, it was necessary to assume a value for the proportion of neurons that were directly activated by the stimulus. This proportion was at first estimated by comparing model predictions with empirical MEG and field potential data. The value of 30 % gave waveforms that were similar to the empirical waveforms. An experimental study was carried out to ascertain that this proportion was close to the actual value. Here the intracellular potential in the pyramidal cell was measured as a function of distance from the stimulating negative electrode in the pyramidal cell layer (Fig. 3A) in a longitudinal CA3 slice preparation (total of 6 slices). 6-Cyano-7-nitroquinoxaline-2,3-dione (CNQX; 20 μM), which blocks AMPA receptors, and d-aminophosphonovalerate (APV; 50 μM), which blocks NMDA receptors, were used to remove synaptic activation. The potentials were measured 10 times at each position and the burst probability was determined for varying stimulus strengths. Only those bursts with a short-latency initial spike were considered as directly activated responses. Figure 3B shows the probability of burst as a function of distance from the stimulating electrode for single pulses (0.6 mA, 50 μs) applied every 4 s. Figure 3C shows examples of a burst at 90 and 130 μm and no response at 260 and 280 μm (the four positions indicated by open circles in Fig. 3B). These results indicated that the proportion of directly activated neurons was 30–50 % for the range of stimulus strengths (50 μs, 0.5-1.0 mA) used in the experiments analysed here. Thus, in the simulations, 30 % of the e-cells were directly stimulated and the remaining 70 % were synaptically stimulated.
Figure 3. Experimental determination of proportion of directly activated neurons.
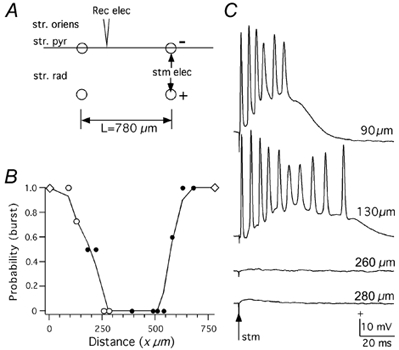
A, recording arrangement. A sharp electrode (3 m KCl, 50–100 MΩ) was placed along the pyramidal cell layer and the intracellular potential was recorded in the pyramidal cells (stratum oriens, str.oriens; stratum pyramidale, str. pyr and stratum radiatum, str.rad) as a function of distance x from a bipolar stimulating electrode. B, proportion of bursts as a function of distance. ⋄, origin of the stimulating electrodes (no recording was made); ○, records in Fig.3C were obtained from these locations; •, other measured locations. Points plotted are the average of 10 measurements. C, examples of intracellular potentials recorded. Cells within the first 150 μm were directly activated by the stimulus. Ringer solution contained CNQX (20 μM) and APV (50 μM).
Calculations of magnetic fields and extracellular field potentials
The intracellular currents in the model neurons were used to compute the magnetic field and extracellular field potentials. Extracellular currents were not considered in the present analysis since their contribution to the magnetic field was negligible in a mathematical model in which the assumption of isopotential in the revised model was removed and the extracellular potentials were explicitly calculated (S. Murakami & Y. C. Okada, unpublished results). The component of the magnetic field normal to bath surface (Bz) was computed at the centre of detection coils (SQ-2 and SQ-4) located at x=±4.2 mm from the centre of the slice. The effects of the finite diameter of the detection coils were taken into account. Figure 2C shows two of the four magnetic field sensing coils placed at these two positions (note that the model slice is rotated by 180 deg and thus the MEG channels are also rotated by 180 deg in comparison to Fig. 1D). The longitudinal current (Qik(t) =JyAL; where k= 1 to 19, i= 1 to 100, Jy= current density along the longitudinal axis, A= cross sectional area of compartment k and L= length of compartment k); was computed for each compartment k of each e-cell i as a function of time over a time window of 150 ms. The Bz was computed at each field position by summing the magnetic field produced by each Qik. The magnetic field due to Qik was calculated for the detection coils (4 mm diameter) of the MEG sensor located 2 mm above the centre of the slice, using the formula of Jazbinsek et al. (1989), so that theoretical results can be compared with experimental results. Okada et al. (1997) found that the spatial distribution of the evoked magnetic field produced by the pyramidal neurons on the surface of the bath above the slice was dipolar for three types of slice (transverse and longitudinal CA1 and longitudinal CA3). The field strength is thus apparently dominated by the dipolar component of the longitudinal current in each cell. The fields from higher moments such as the quadrupolar component were apparently too weak to contribute to the signal. Thus, the temporal waveform of Bz is approximately proportional to the waveform of the dipole moment in the slice. The net dipole moment in the slice as a function of time (Qtotal) was computed from the longitudinal currents Qik by summing the currents across all compartments and neurons. In addition to Qtotal, the Q was calculated separately for those cells (in column 1-3) directly stimulated by the external stimulus (Qdirect) and for those in columns 4–10 synaptically activated by the first group of neurons (Qsynaptic). The extracellular field potentials in the two regions (columns 1–3 and columns 4-10) were calculated from Qik as well, using the divergence formula (Malmivuo & Plonsey, 1995).
RESULTS
Comparison of empirical and theoretical MEG waveforms
Empirical signals
The evoked magnetic fields obtained by Wu & Okada (1998) are shown in Fig. 4 (labelled as Data) for comparison with simulation results. The signals were mirror images of each other across superconducting quantum interference device (SQUID) channels 2 and 4 with virtually no signal at SQUID channels 1 and 3 (not shown; cf. Fig. 1D). In the case of somatic stimulation, the magnetic signals at SQ-2 and SQ-4 were biphasic consisting of an initial spike followed by a slow wave. The spike typically exhibited 1–3 smaller spikes on its trailing edge. The magnetic field at the initial spike peak was directed into the bath at SQ-2 and out of the bath at SQ-4, indicating that its underlying intracellular current was directed from the basal to the apical sides of the pyramidal cells. The slow wave was opposite in polarity to the spike, indicating that it was due to intracellular currents directed from the apical to basal sides of the pyramidal cells.
Figure 4. Theoretically and experimentally evoked magnetic fields from the CA3 slice produced by somatic and apical stimulations.
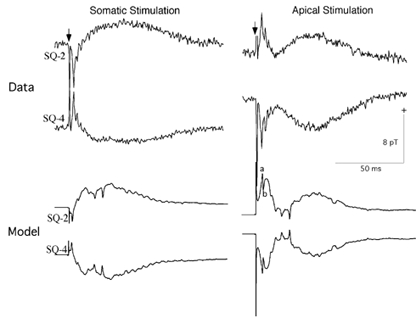
Data, experimentally determined magnetic field waveforms 2 mm above the slice. Model, theoretical waveforms. (Taken from Wu & Okada, 1998). Note the calibration scales are the same for both theoretical and experimental data. Refer to text for description of components a and b. Positivity indicates field directed out of the bath in this and all other figures.
In the case of apical stimulation the magnetic field was triphasic, consisting of an initial spike, followed by a return to baseline, which sometimes slightly overshot past the baseline, and terminated with a slow wave. The spike contained 1–3 smaller spikes on its trailing edge. The first component was directed out of the bath at SQ-2 and into the bath at SQ-4, indicating that its underlying intracellular current was directed from the apical to the basal dendrites. The slow wave was due to intracellular currents directed from the apical to the basal side just as in the case of somatic stimulation.
Theoretical signals
The theoretical magnetic fields shown in Fig. 4 (labelled as Model) were similar to the empirical waveforms in several important respects, although the agreements were by no means perfect. In the somatic condition, the model correctly accounted for the biphasic shape. The polarities also matched the empirical results. The magnitude of the initial spike was too small for the model, but the magnitude for the slow wave was similar between the model and data. The empirical magnetic field in Fig. 4 was 6–7 pT for the initial peak and 2–3 pT for the slow wave, which was typical of empirical results in this laboratory, whereas the theoretical values were 2 pT and 4 pT, respectively, for these two components. The calculated field values were normalized for a slice with a cross-sectional area of 6 mm wide × 0.4 mm thick estimated to contain 12 000 pyramidal neurons (5000 cells mm−2, Traub & Miles, 1991): The magnetic fields of the model slice were multiplied by a factor of 120. The latency of the initial peak was 2.3 ms for the model and 3.4 ms for the data in Fig. 4. The mean latency for 20 slices was 2.2 ms with a range of 1.4-4.3 ms (Wu & Okada, 1998). The agreement between the theory and data is remarkable. The latency of the model spike was shorter (≈1 ms) when the stimulation was weaker. As the stimulation strength was increased, the initiation of the spike was blocked by capacitative shunting and the latency increased to a value closer to the empirical value, beyond which the spike failed to be elicited. The theoretical slow wave was slightly shorter than the data in duration due to the model having a smaller number of synaptically activated neurons.
In the apical condition, the model correctly accounted for the detailed shape and latency of the triphasic waveform. The initial sharp spike was directed upward at SQ-2 and downward at SQ-4 as in the data. Its amplitude of 7 pT was comparable with the data. The latency of this initial peak (4.9 ms here; labelled a in Fig. 4) was close to the peak latency (4.4 ms) of the data in Fig. 4 and was within the range of values (1.7-5.2 ms) found across 23 slices (Wu & Okada, 1998). The theoretical waveform exhibited a second sharp spike of opposite polarity (labelled b) immediately following this initial spike. The genesis of the biphasic spike (a/b) is examined later in connection with Fig. 11 and Fig. 12. The envelope of the first component of the triphasic waveform was similar in shape, amplitude and width to the data. The latency of the second component, which according to the revised model represents an active process rather than a passive return to the baseline, was also well captured by the model. The third component, the slow wave, matched in polarity and peak latency. However, its duration was slightly longer in the data than in the model due to the small number of neurons in the model. As in the somatic condition, the slow wave was similar in magnitude to the empirical value (4 pT for the model and 2–5 pT for these data).
Figure 11. Comparison of intracellular potentials (Vi) and current dipole moment (Q) in the somatic condition.
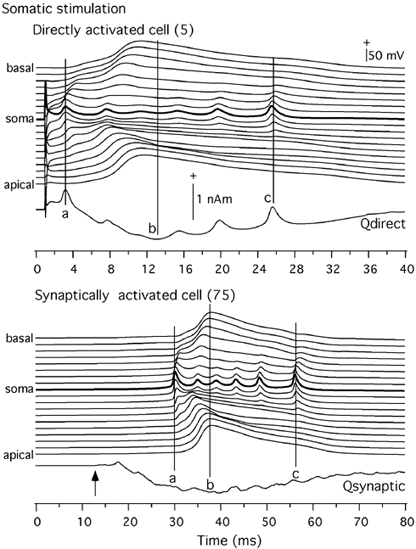
Top, Vi in the directly activated cell (5) along 15 compartments and Q due to directly activated e-cells. Bottom, same for a synaptically activated e-cell (75) and Q due to the synaptically activated e-cells. Basal, 1-8; soma 9 and apical 10-19. See text for components a, b and c. + Indicates intracellular positivity and current dipole moment directed from basal to apical side.
Figure 12. Comparison of intracellular potentials (Vi) and current dipole moment (Q) in the apical condition.
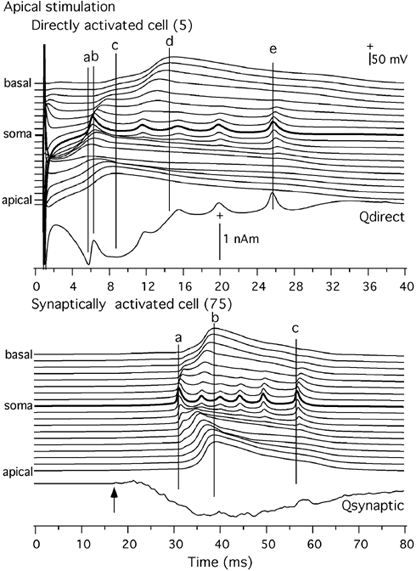
Top, Vi in the directly activated cell (5) along 15 compartments and Q due to directly activated e-cells. Bottom, same for a synaptically activated e-cell (75) and Q due to the synaptically activated e-cells. Basal, 1-8; soma 9 and apical 10-19. See text for components a-e. + Indicates intracellular positivity and current dipole moment directed from basal to apical side.
Decomposition of the magnetic field
The bi- and triphasic MEG signals were previously interpreted as being due to a synchronously activated uniform population of neurons in the slice (Okada et al. 1997; Wu & Okada, 1998, 1999, 2000). However, the present simulation study showed that these characteristic waves from the entire slice may be due to a weighted sum of magnetic fields with two distinct waveforms - one produced by those directly activated by the applied external stimulus and the other by those that were synaptically activated by the first group of neurons. Figure 5 shows the current dipole moment Q for the entire slice (Qtotal) and those due to the two populations of neurons (Qdirect and Qsynaptic). They have been normalized for a slice with a cross-sectional area of 6 mm by 0.4 mm, as was done for the Bz. The histogram at the bottom of the Figure shows the number of cells firing as a function of time after stimulation (at time 1 ms).
Figure 5. Decomposition of current dipole moments.
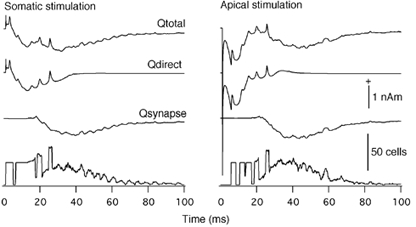
The moment produced by the entire slice (Qtotal) was decomposed into Qdirect produced by neurons directly activated by the externally applied stimulus (cells in columns 1-3) and Qsynaptic produced by neurons synaptically activated by these neurons (cells in columns 3-10). Results are shown separately for the somatic and apical stimulation conditions. Bottom, number of model pyramidal neurons which fired (i.e. with somatic potential > 20 mV) as a function of time after stimulation at 1 ms. Positivity indicates currents directed from the basal to the apical side.
In the case of somatic stimulation, the initial part of Qtotal was dominated by Qdirect. Qdirect was biphasic with the initial component being due to currents directed from the basal to the apical sides and the second component due to reversed currents directed from the apical to basal sides. The directly activated neurons also produced the late spikes seen in Qtotal due to the fact that these neurons were highly synchronized. The later part of the slow wave in Qtotal was dominated by Qsynaptic. The Qsynaptic was basically monophasic due to currents directed from the apical to basal sides. The number of e-cells firing was limited to 30 % during the initial period. The number of synaptically activated neurons peaked around 35 ms post-stimulus. The envelope of Qsynaptic was highly correlated with the number of synaptically activated e-cells.
In the case of apical stimulation, the triphasic waveform of Qtotal was found to be due to Qdirect, which was biphasic and Qsynaptic, which was basically monophasic. Qdirect was responsible for the first two components of Qtotal. The magnitude of the second component at around 20 ms could overshoot past the baseline when the currents in the basal compartments were enhanced, for example by ignoring the branching in the basal dendrites or by increasing the channel densities of the basal dendritic compartments relative to the apical compartments. The channel densities and the weights used in this report gave a second component resembling the experimental data. Qdirect also produced spikes at long latencies, again due to a high degree of synchronization in this population of neurons. The slow wave of Qtotal was found to be due to Qsynaptic. The waveform of Qsynaptic was similar to that in the somatic condition. The number of firing e-cells indicated that there was a delay in the initial firing after stimulation at 1 ms, then the number of e-cells was clamped to the directly activated neurons. The synaptically activated neurons started to dominate with peak activity around 40 ms post stimulus. Again the envelope of Qsynaptic was highly correlated with the number of synaptically activated e-cells.
Further comparisons of theoretical and empirical magnetic fields
The revised model was tested in two additional comparisons of theoretical versus empirical magnetic fields. Wu & Okada (2000) experimentally characterized the effects of 4-AP (0.1 mm) and TEA (3 mm) on the evoked magnetic fields. Figure 6A (Data) shows the empirical results from their study showing the effects of 4-AP on the magnetic field. 4-AP selectively affected the slow wave of the triphasic response produced by the apical stimulation, increasing its amplitude and shortening its peak latency. Since 4-AP is known to not only block gK(A), but also enhance the efficacy of AMPA transmission (Traub et al. 1995), the effects of 4-AP were simulated by blocking gK(A) (Model 1), by increasing the time constant of AMPA activation from the original value of 2 ms (Traub et al. 1995) up to 10 ms (Model 2), and by combining these two effects (Model 3). The simulations captured the selective effects of 4-AP on the slow wave. Its amplitude was larger and peak latency shorter in the presence of 4-AP, just as in the empirical data.
Figure 6. Evoked magnetic fields in the presence of 4-AP.
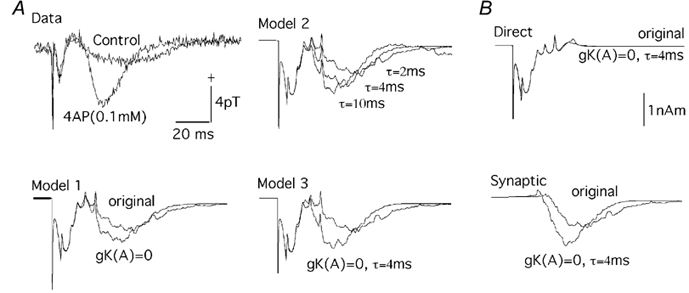
A, experimental (measured) and theoretical (models 1-3) evoked magnetic fields. Measurments were made in Ringer solution with 0.1 mm PTX (control) and with 0.1 mm PTX and 0.1 mm 4-AP (4AP). Model 1, theoretical waveforms for the revised model with and without gK(A) blocked. Model 2, time constant (τ) for AMPA activation changed from the value of 2 ms in the revised model to 4 and 10 ms. Model 3, time constant (τ) of 4 ms for AMPA activation and gK(A) blocked. B, net current dipole moment (Q) for the directly activated set of e-cells (top) and synaptically activated set of e-cells (bottom) comparing the effects of 4-AP (simulated by τ= 4 ms and gK(A)= 0) on the two populations of e-cells.
The basis of the 4-AP effects was examined by analysing the effects separately for Qdirect and Qsynaptic (Fig. 6B). Setting gK(A)= 0 and τ= 4 ms had very little effect on Qdirect. The Qsynaptic, on the other hand, showed an increase in amplitude and a decrease in latency of its onset and peak. Thus, according to the model, the effects of 4-AP on the magnetic field are due to its effects on the synaptically activated population of neurons.
Figure 7A (labelled Data) shows empirical results from the study by Wu & Okada (2000) showing effects of TEA on the evoked magnetic field. TEA primarily affected the slow wave, enhancing its amplitude as in the case of 4-AP, but delaying its peak amplitude in contrast to 4-AP. The effects of TEA were simulated by shifting the steady-state activation curve of gK(C) to a more depolarized direction (see Methods), which effectively delayed the activation kinetics of gK(C). Changing the membrane voltage for the mid-point of the steady-state activation curve from the original value of 10 mV to 11 and 12 mV selectively enhanced the slow wave and increased its peak latency (Fig. 7A, labelled Model) just as in the case of the empirical data.
Figure 7. Evoked magnetic fields in the presence of TEA.
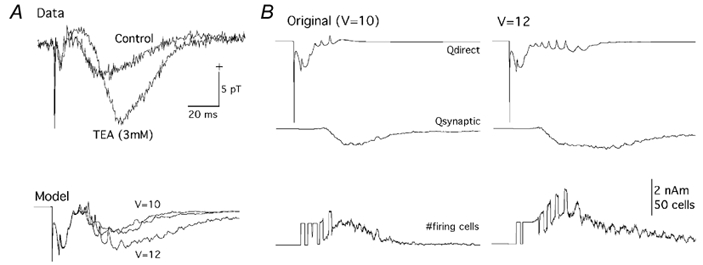
A, experimental (Data) and theoretical (Model) evoked magnetic fields in control and in the presence of TEA. Data, control: magnetic field obtained in Ringer solution with 0.1 mm PTX. TEA (3 mm): magnetic field obtained in Ringer solution with 0.1 mm PTX and 3 mm TEA. Model, mid-point of the steady-state activation curve of gK(C) set to 10 mV relative to the resting level, simulating the control condition and 11 and 12 mV simulating the delayed activation in presence of TEA. B, theoretical evoked magnetic fields in the control condition (left) and in the presence of 3 mm TEA (right). Dipole moment Q shown separately for the directly activated population of e-cells (Qdirect) and synaptically activated population of e-cells (Qsynaptic). Bottom trace shows number of firing e-cells. V, voltage in mV.
The model provided some insights into the basis of these effects on the slow wave (Fig. 7B). Slowing the activation kinetics of gK(C) affected the dipole moments of both the directly and synaptically activated neurons. The intracellular potentials (not shown) exhibited a longer train of spikes superimposed on a burst. Mirroring these changes, the Qdirect (Fig. 7B, top) showed a longer train of spikes superimposed on a slow wave. The spikes were seen over a long period of time due to highly synchronized, directly activated e-cells. Their spikes were, however, not clearly evident in the empirical data perhaps due to a lower level of synchronization in the experimental slices than in the model. The Qsynaptic (Fig. 7B, middle) showed activity over a longer period of time with an increase in latency of its peak. The increase in duration of activity is directly shown by the number of cells firing as a function of time (Fig. 7B, bottom).
Intracellular potentials of the pyramidal cells in two populations
According to the above analysis, the two regions of the slice generate distinctly different signals. Although this prediction cannot be easily tested for the magnetic field, it can be verified for the intra- and extracellular potentials.
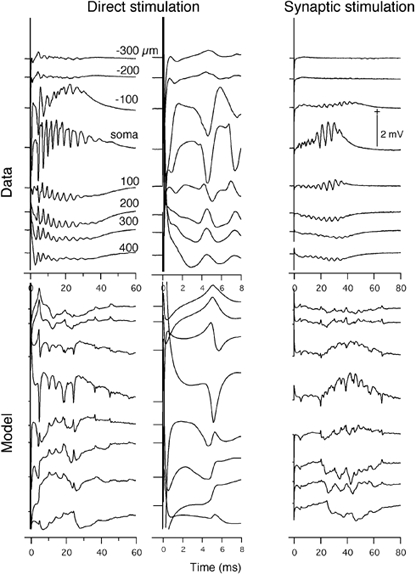
Figure 8 (labelled as Data) presents the intracellular potentials measured from a longitudinal CA3 slice within the region of directly activated neurons (< 100 μm from the stimulating somatic electrode) and within the region of synaptically activated neurons (between 150 and 650 μm away from the somatic electrode). In the somatic condition (Fig. 8, top, left), the empirical data from a pyramidal cell located 90 μm from the centre of the somatic electrode showed an initial spike without a synaptic delay, confirming that the e-cell was directly activated by the stimulus. This spike was followed by a train of spikes superimposed on a burst. The initial spikes of the responses measured from cells located at 75 and 100 μm from the stimulating electrode (not shown) did not vary their latency in accordance with the model. The burst of activity within the synaptically activated region was delayed as a function of distance. The pattern of intracellular potentials was similar for the apical stimulation condition (Fig. 8, top, right). These data were collected from the same cells from which the data for somatic stimulation were obtained. The responses close to the stimulating electrodes exhibited an initial spike without any synaptic delay, when the delay due to hyperpolarization of the soma by the bipolar stimulating electrodes was taken into account. In contrast, those in the middle region between the stimulating electrodes showed an increasing delay in spike burst as a function of distance from the stimulating electrode.
Figure 8. Comparison of measured and theoretical intracellular potentials in the CA3 slice as a function of distance from the centre of the stimulating electrode.
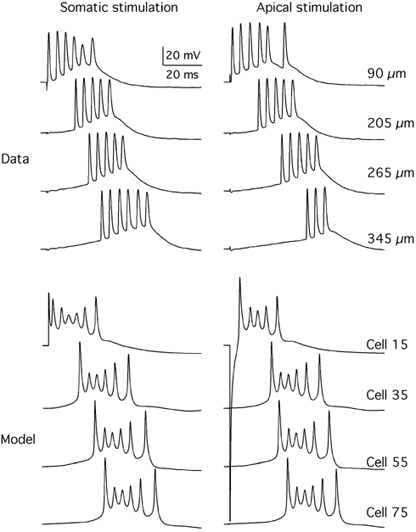
Data, intracellular potentials measured in pyramidal neurons within the directly activated population of neurons (90 μm) and within the synaptically activated population of neurons (205-345 μm), shown separately for the somatic and apical stimulation conditions. Model, intracellular potentials in cell 15 (directly stimulated cell in column 1) and in cells 35, 55 and 75 (synaptically stimulated cells in columns 3, 5 and 7, respectively). All cells were from row 5 (cf. Fig. 2C).
The model captured the essential aspects of the data. The model predictions (Fig. 8, bottom, labelled Model) for the somatic and apical stimulation conditions (left and right, respectively) were quite similar to the empirical data in all cases. Cell 15, which was directly stimulated, fired an initial spike without any synaptic delay under both the somatic and apical stimulation conditions. The delay in the initial spike of the apically activated response is, just as for the empirical data, due to a delay imposed by the hyperpolarization in the soma produced by the positive electrode of the bipolar electrode array. Cells 35, 55 and 75 produced a burst of spike activity with longer delays just as found in the data for both the somatic and apical stimulating conditions. It was verified that these delayed responses were synaptically mediated by showing that the synaptic current mediated by AMPA channels was seen before the onset of the burst. The spontaneously generated intracellular potential in the same cells without any external stimulation appeared much later than the synaptically activated responses shown in Fig. 8.
Field potentials of the two populations of neurons
Figure 9 and Figure 10 show the predicted qualitatively different waveforms of field potentials measured in the region of the direct and synaptic stimulations. The two figures compare the extracellular field potentials measured from a CA3 slice (Data) and those calculated with the revised model (Model) in the regions of Direct stimulation and Synaptic stimulation under the somatic (Fig. 9) and apical (Fig. 10) stimulation conditions. The extracellular conductivity of 1.3 S m−1 used in this simulation was calculated from the relation between volume fraction and extracellular impedance (Nicholson & Rice, 1986; McBain et al. 1990).
Figure 9. Comparison of measured and theoretical laminar profiles for the somatic stimulation.
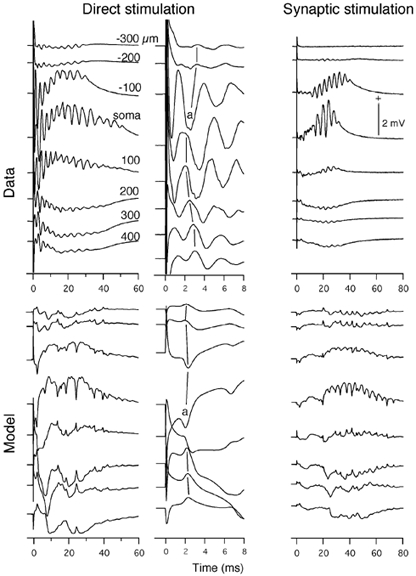
Data, field potentials were measured in a region where pyramidal cells are expected to be directly stimulated by the applied stimulus (Direct stimulation < 100 μm from the stimulating electrodes) and in the middle region between the two pairs of bipolar stimulating electrodes where the cells are expected to be synaptically activated by the directly activated pyramidal cells (Synaptic stimulation). Field potentials were measured along the longitudinal axis of the pyramidal cells with respect to the soma (units in μm, basal negative). Stimulus: 50 μs, 0.6 mA, 4s (stimulus)−1. Model, theoretical field potential laminar profiles in the directly and synaptically stimulated regions of the slice. Calculated field potentials were obtained next to compartments 3, 5, 7, 9, 11, 13, 15 and 17. + indicates extracellular positivity.
Figure 10. Comparison of measured and theoretical laminar profiles for the apical stimulation condition.
All details as for Fig. 9.
Somatic stimulation
The theoretical waveforms matched the empirical data in several important respects. Firstly, the magnitudes were similar between the model and data, even though parameters of the basic model were not adjusted to specifically obtain such a match. Secondly, as in the case of intracellular potentials, both the model and data showed that the field potential from the region of direct stimulation was elicited without any synaptic delay, whereas the field potential from the region of synaptic stimulation showed a delay before the burst of activity. Thirdly, the model correctly predicted the latency and laminar profiles of the spikes in the field potentials from the region of direct stimulation. The initial spike in the model with a latency of less than 1 ms was merged with stimulus artifact and thus it was difficult to compare with the empirical data. The first clear response with a latency of 2.0 ms at the soma (Fig. 9, a) was nearly the same as the latency of the somatic negative spike (also labelled a) in the data. The laminar profile of this spike was the same in both data and model. The spike was negative in the soma region, weakly positive in the basal area and more strongly positive in the apical area. This corresponds to the initial spike with a latency of 2.3 ms in the theoretical magnetic field (Fig. 4). Consistent with the model, this spike in the measured magnetic field was directed from the basal to apical sides, indicating that the spike was produced by the current originating in the soma and directed towards the apical dendrites. Fourthly, there was good agreement between data and model for the slow wave. This was weakly negative in the basal region, strongly positive in the somatic region and strongly negative in the apical region for both the directly and synaptically activated neurons. The laminar profiles indicate that the slow wave was produced by intracellular currents originating in the apical dendrites.
Apical stimulation
Figure 10 shows the results for apical stimulation. Empirically, the field potentials close to a pair of stimulating electrodes (direct stimulation) exhibited a negative extracellular potential between 1 and 4 ms in the apical region and a corresponding negativity in the soma region, indicating a dipolar current. This was immediately followed by a sharp negative spike in the soma area, a weak positivity in the basal area and a stronger positivity in the apical area. The train of spikes following this initial somatic spike had the same polarity profile indicating that they were also somatic in origin. This train of spikes was superimposed on a slow wave which was positive in the soma region, weakly negative in the basal area and more strongly negative in the apical area. The empirical field potentials from the middle of the slice (Synaptic stimulation) showed a delayed burst-like activity in the soma region, a weak negativity in the basal region and stronger negativity in the apical region.
The model predictions again agreed with the empirical data in several important respects. The magnitudes of the spike and slow wave were again similar to the measured data. For the directly activated population of neurons, there was an initial negativity in the apical region and positivity in the somatic and basal regions starting at about 3 ms and lasting up to 5 ms. This initial spike was shorter in duration than that for Data, but their laminar profiles were the same. This was followed immediately by a spike with negativity in the soma area and positivity in the apical and basal areas, just as in Data. The model also captured the basic features of the laminar profile of the slow wave generated by the directly activated neurons, although the shape of this waveform is more complex for the model. The polarity was positive in the soma region and negative in the basal and apical regions just as in the case of somatic stimulation. The predicted waveforms for synaptically activated neurons also matched the empirical data in polarity and laminar profile. The field potentials produced by the synaptically activated neurons were quite similar to those for the somatic condition.
Comparisons of current dipole moments and intracellular potentials in the model
The above results indicate that the revised model based on Traub's work was able to account for three quite different types of data. The model was thus used to infer the origins of the MEG signals and field potentials from the relationship between intracellular potentials in a model pyramidal neuron and the dipole moment. This was examined separately for the directly and synaptically activated neurons, under the two stimulation conditions. Figure 11 makes this comparison for the somatic stimulation condition. The Qdirect is compared against the intracellular potential in each of the 19 compartments in two model pyramidal cells - a directly activated neuron (top panel) and a synaptically activated neuron (bottom panel). The initial spike in Qdirect (a) of the directly activated population of neurons was due to the spike originating in the soma. The spikes in the soma region contributed to the later spikes as well (e.g. c). The slow wave (b) reflected the potentials in the dendrites. The potentials in the basal and apical dendrites were equally strong with the potentials in the apical dendrite being slightly delayed in comparison to those in the basal dendrite. However, the apical dendrites contributed more than the basal dendrites because the apical dendrites have a trunk proximally and a branched dendritic tree distally, whereas the basal dendrites branch immediately from the soma region. Thus, the longitudinal current from apical dendrites to soma was stronger than the current from the basal to the soma. Consequently, the slow wave was directed from the apical to the basal side.
The intracellular potential profile for the synaptically activated pyramidal cell was similar to the profile for the directly stimulated cells. The spikes, however, did not clearly contribute to the Qsynaptic because of the asynchrony of activity in this cell population, which was supported by the empirical intracellular data in Fig. 8. The slow wave in Qsynaptic was due to the difference in the currents produced by the apical and basal dendrites. The dipolar current in the apical dendrite dominated this component and thus determined the polarity of the slow waves of Qtotal and Qsynaptic for the somatic stimulation.
In the case of apical stimulation (Fig. 12), the initial spike (a) riding on top of the first component of the triphasic wave of Qdirect was associated with a spike strongest in the apical trunk region, thus its current was directed from the apical trunk region to the soma. This explains the polarity of the initial spike in the empirical magnetic field (Fig. 4). The second spike (b) was due to the potential strongest in the soma. The current for this spike is quadripolar, but the component from the soma towards the apical dendrite is stronger than the component from the soma towards the basal dendrite because of their dendritic geometries. Thus, the net dipolar current is directed toward the apical dendrite as seen in the data. The same current gives rise to the later train of spikes (e.g. e). The late spikes sometimes seen in the empirical data (Okada et al. 1997) should be thus somatic in origin. The envelope of the first component of Qdirect was due to the strong potential seen in the distal apical dendrite. The return to the baseline in Qdirect, which is responsible for the second component of Qtotal, was due to the potential strongest in the basal dendrite. As mentioned earlier, this second component is due to an active dendritic process. It can overshoot past the baseline if the dendritic gCa density is made stronger relative to gK(C) or if the effect of branching is ignored. The slow wave in Qsynaptic, directed from the apical to basal sides, was determined by the balance of the opposing dipolar currents produced by the apical and basal dendrites just as in the case of somatic stimulation. The apical current dominated this component because of the dendritic geometry.
DISCUSSION
The revised model provided an excellent agreement with the empirically determined signals of three distinct classes - evoked magnetic field measured outside the slice, extracellular field potentials within the slice and intracellular potentials of the pyramidal neurons. The most significant aspect of the revised model responsible for the present results was the weighting function for taking into account the effect of branching of the basal and apical dendrites. By weighting the branched portions of the dendrites much less than the dendritic trunk of the apical dendrites, the role of the basal dendrites was reduced, exposing the currents produced in the soma and apical dendritic trunk. This change provided an improved account over the basic model of the initial component of the evoked magnetic field for both somatic and apical stimulations. In the case of somatic stimulation, it was possible to see the initial spike produced by activation of gNa. The latency of this spike was comparable to the empirical value. To obtain the delay in this spike, it was necessary to choose a stimulus strength which was sufficiently high to block the initial fast response, but not too high to block the spike completely. The amplitude of this spike was, however, still weaker than the spike in the empirical data. One possible explanation may rest on the fact that the present model does not include the axo-axonal gap junctions which are believed to be very important in synchronizing the initial spikes (Traub et al. 1999). In the case of apical stimulation, the first component now contains a sharp-spike complex attributable to the sodium spike produced in the apical trunk immediately followed by a spike produced in the soma.
The weighting also emphasized the contribution of the apical dendrites relative to the basal dendrites. Thus, the first component of the triphasic waveform under the apical stimulation was due to currents produced in the apical dendrites. The second component of the triphasic waveform appeared as a return to the baseline rather than a component with the opposite polarity expected for the basal dendrite because the contribution of the basal dendrite was de-emphasized. With the basic model, the second component could be quite prominent, in some cases as strong as the first component. The current underlying the slow wave for both the somatic and apical stimulations was directed from the apical to the basal dendrites again because of the balance in favour of the apical dendrites, due to the difference in their branching geometries.
The second significant change in the revised model was in the distribution of channel density along the longitudinal axis of the model pyramidal neurons. Traub has been very careful in choosing the parameters of his models (Traub et al. 1991, 1994). The kinetics of the channels closely modelled experimental results. The same is true for the passive cable properties of the cells. One set of parameters that is, however, less certain is the distribution of channels along the longitudinal axis of each cell type (Traub et al. 1991). In the revised model the channel densities of gNa and gK(DR) were maximum at the soma and gradually tapered toward the distal dendrites instead of being trimodal as in the basic model. These changes produced a clear propagation of the gNa-generated spikes toward the distal parts of the dendrites. They also generated a spike in the apical dendrite, followed by a spike in the soma in the apical stimulation condition. Such a pair of spikes was also seen in the empirical data.
The third change incorporated in the revised model was the shortening of the distance over which monosynaptic connections via the recurrent excitatory synapses are made between the e-cells. This reduction effectively slowed down the synaptic propagation and spread the time of propagation of activities within the synaptically activated population of neurons to mimic the longer propagation time in actual slices. This change, however, was forced by the small size of the model slice. With an improved model having a realistic number of cells, it should be possible to use a connectivity space constant reflecting the anatomical value.
The high level of agreement between the model and data seen above provides justification for making some tentative conclusions regarding the physiological origins of the magnetic field and extracellular potentials. First of all, it is remarkable that the revised model, which retains essential features of the 1991 Traub model (Traub et al. 1991), was able to account for the magnitude of both the magnetic field and the field potential. This is rather surprising because the Traub model was developed primarily to account for intracellular data and only secondarily for field potentials. Certainly, it was not intended for magnetic fields. The model not only accounted for the shape and magnitude of the empirical magnetic fields, but also correctly captured the essential features of the laminar profile of field potentials in two regions of the slice. The predictions were quantitatively comparable with the empirical data even though a single set of parameters was used to account for all three types of data in different experimental conditions without adjusting the parameters for individual fits.
The excellent agreement indicates that amplitudes of MEG and EEG signals may be directly related to certain fundamental anatomical and physiological parameters of the neuronal structure. As an important corollary, this conclusion suggests that the magnitudes of these signals may be invariant across different neuronal structures within a given species and perhaps even across the species to the extent that the anatomical and physiological parameters do show some invariance in value such as the density of neurons and the parameters of the passive properties of neurons, and even parameters of active channels (Hille, 2001). Indeed, an earlier review of comparative studies has suggested that the magnitude per unit volume of neuronal tissue may be invariant across the turtle cerebellum, guinea-pig hippocampus and the somatosensory cortex of piglets (Okada et al. 1996).
The present study has also shown that sodium spikes can be detected magnetically and electrically, at least for the CA3 slice preparation. This conclusion suggests that sodium spikes may also be detectable from the human neocortex with MEG and EEG if the geometry of the neurons is favourable. For example, it has been shown recently that a high frequency signal in the range of 600 Hz in the pig neocortex consists of a presynaptic component generated by spikes in the thalamocortical axonal terminals and a postsynaptic component generated by a spike train in cortical neurons (Ikeda et al. 2002). These results indicate that spike activity may be seen when the geometry of neurons is asymmetrical, that is when a neuron has an apical dendritic trunk and soma with branched basal dendrites as is the case in many types of pyramidal neurons in the cortex (Jones, 1984).
The present study also demonstrated that the potentials generated in the apical dendrites are important for generating the slow wave in the absence of fast inhibition. The shape and magnitude of the slow wave, as for the spikes, depend on asymmetry in the geometry of neurons. One thus expects a strong contribution of currents in the apical dendrites when there is an apical dendritic trunk without a comparable trunk in the basal dendrites. The timing of activation in these two dendritic regions can also be different and can play an important role.
In conclusion, the present work shows that the origin of MEG and EEG signals must be re-examined within the modern conceptual framework of CNS physiology, since the active channels such as sodium and calcium channels and their associated potassium channels play important roles in the genesis of these signals. The present analysis was carried out for the hippocampus. As one gains better understanding of the genesis in this structure, it should be possible to analyse MEG and EEG signals from slice preparations of the neocortex. The responses analysed in this study were highly synchronous activities produced in the presence of a blocker of fast inhibition (i.e. GABAA type) which produces epileptiform activities in the hippocampal slice. As more sensitive MEG sensors are developed, one should be in a position to examine collective phenomena in the neocortex which more closely resemble such phenomena giving rise to MEG and EEG signals in vivo.
Acknowledgments
This work was supported financially by a grant from the Ministry of Education, Science, Sports and Culture, Japan, under Grant-in-Aid for Prior Science Research (A)11170211 to A. Hirose and NIH grant RO1-NS21149 to Y. Okada. We acknowledge the generous support of Dr Roger Traub who provided his 1991 model and served as a valuable consultant to this project since its very early conceptual stage in 1985.
REFERENCES
- Buchanan DS, Crum DB, Cox D, Wikswo JP., Jr . Microsquid: a close-spaced four channel magnetometer. In: Williamson SJ, Stroink G, Kotani M, editors. Advances in Biomagnetism. New York: Plenum Press; 1989. pp. 677–679. [Google Scholar]
- Buzsáki G. Θ Oscillations in the hippocampus. Neuron. 2002;33:325–340. doi: 10.1016/s0896-6273(02)00586-x. [DOI] [PubMed] [Google Scholar]
- Hille B. Ionic Channels of Excitable Membranes. Sunderland, MA, USA: Sinauer; 2001. [Google Scholar]
- Ikeda H, Leyba L, Bartolo A, Wang Y, Okada YC. Synchronized spikes of thalamocortical axonal terminals and cortical neurons are detectable outside the brain of piglet with high-resolution MEG. Journal of Neurophysiology. 2002;87:626–630. doi: 10.1152/jn.00332.2001. [DOI] [PubMed] [Google Scholar]
- Jazbinsek V, Trontelj Z, Erné SN, Trahms L. Influence of the finite pickup coil size on the localization of current sources with quadrupolar components. In: Williamson SJ, Hoke M, Stroink G, Kotani M, editors. Advances in Biomagnetism. New York: Plenum Press; 1989. pp. 559–562. [Google Scholar]
- Jones EG. Identification and classification of intrinsic circuit elements in the neocortex. In: Edelman G, Cowan WM, Gall WE, editors. Dynamic Aspects of Neocortical Function. New York: Wiley; 1984. pp. 7–40. [Google Scholar]
- Johnston D, Hoffman DA, Magee JC, Poolos NP, Watanabe S, Colbert CM, Migliore M. Dendritic potassium channels in hippocampal pyramidal neurons. Journal of Physiology. 2000;525:75–81. doi: 10.1111/j.1469-7793.2000.00075.x. [DOI] [PMC free article] [PubMed] [Google Scholar]
- Johnston D, Magee JC, Colbert CM, Cristie BR. Active properties of neuronal dendrites. Annual Review of Neuroscience. 1996;19:165–186. doi: 10.1146/annurev.ne.19.030196.001121. [DOI] [PubMed] [Google Scholar]
- Kyuhou S, Okada YC. Detection of magnetic evoked fields associated with synchronous population activities in the transverse CA1 slice of the guinea pig. Journal of Neurophysiology. 1993;70:2665–2668. doi: 10.1152/jn.1993.70.6.2665. [DOI] [PubMed] [Google Scholar]
- Lopes da Silva F. Neural mechanisms underlying brain waves: from neural membranes to networks. Electroencephalography and Clinical Neurophysiology. 1991;79:81–93. doi: 10.1016/0013-4694(91)90044-5. [DOI] [PubMed] [Google Scholar]
- Llinás RR. Comparative electrobiology of mammalian central neurons. In: Dingledine V, editor. Brain Slices. New York: Plenum Press; 1984. pp. 7–24. [Google Scholar]
- Llinás RR. The intrinsic electrophysiological properties of mammalian neurons: Insights into central nervous system function. Science. 1988;242:1654–1664. doi: 10.1126/science.3059497. [DOI] [PubMed] [Google Scholar]
- McBain CJ, Traynelis SF, Dingledine R. Regional variation of extracellular space in the hippocampus. Science. 1990;10:674–677. doi: 10.1126/science.2382142. [DOI] [PubMed] [Google Scholar]
- McIntyre CC, Grill WM. Excitation of central nervous system neurons by nonuniform electric fields. Biophysical Journal. 1999;76:878–888. doi: 10.1016/S0006-3495(99)77251-6. [DOI] [PMC free article] [PubMed] [Google Scholar]
- Magee J, Hoffman D, Colbert C, Johnston D. Electrical and calcium signaling in dendrites of hippocampal pyramidal neurons. Annuual Review of Physiology. 1998;60:327–346. doi: 10.1146/annurev.physiol.60.1.327. [DOI] [PubMed] [Google Scholar]
- Malmivuo J, Plonsey R. Bioelectromagnetism. New York: Oxford University Press; 1995. [Google Scholar]
- Nicholson C, Rice ME. The migration of substances in the neuronal microenvironment. Annals - New York Academy of Sciences. 1986;481:55–71. doi: 10.1111/j.1749-6632.1986.tb27139.x. [DOI] [PubMed] [Google Scholar]
- Okada YC, Papuashvili N, Xu C. International Conferance of Biomagnetism. Santa Fe, New Mexico: 1996. Maximum current dipole moment density as an important physiological constraint in MEG inverse solutions. A149. [Google Scholar]
- Okada YC, Shah B, Huang JC. Ferromagnetic high-permeability alloy alone can provide sufficient low-frequency and eddy-current shieldings for biomagnetic measurements. IEEE Transactions Biomedical Engineering. 1994;41:688–697. doi: 10.1109/10.301736. [DOI] [PubMed] [Google Scholar]
- Okada YC, Xu C. Single-epoch neuromagnetic signals during epileptiform activities in guinea-pig longitudinal CA3 slices. Neuroscience Letters. 1996;211:155–158. doi: 10.1016/0304-3940(96)12740-3. [DOI] [PubMed] [Google Scholar]
- Okada YC, Wu J, Kyuhou S. Genesis of magnetic signals in a mammalian CNS structure. Electroencephalography and Clinical Neurophysiology. 1997;103:474–485. doi: 10.1016/s0013-4694(97)00043-6. [DOI] [PubMed] [Google Scholar]
- Okada YC, Wu J. Interpretation of evoked magnetic fields, evoked field potentials and intracellular potentials of the longitudinal CA3 slice within a modern theoretical framework. Society for Neuroscience Abstracts. 1998;24(1):1180. [Google Scholar]
- Rall W. Electrophysiology of a dendritic neuron model. Biophysical Journal. 1962;2:145–167. doi: 10.1016/s0006-3495(62)86953-7. [DOI] [PMC free article] [PubMed] [Google Scholar]
- Traub RD, Colling SB, Jefferys JGR. Cellular mechanisms of 4-aminopyridine-induced synchronized after-discharges in the rat hippocampal slice. Journal of Physiology. 1995;489:127–140. doi: 10.1113/jphysiol.1995.sp021036. [DOI] [PMC free article] [PubMed] [Google Scholar]
- Traub RD, Jefferys JGR, Miles R, Whittington MA, TÓTH K. A branching dendritic model of a rodent CA3 pyramidal neurone. Journal of Physiology. 1994;481:79–95. doi: 10.1113/jphysiol.1994.sp020420. [DOI] [PMC free article] [PubMed] [Google Scholar]
- Traub RD, Jefferys JGR, Whittington MA. Fast Oscillations in Cortical Circuits. Cambridge, MA, USA: MIT Press; 1999. [Google Scholar]
- Traub RD, Miles R. Neuronal Networks of the Hippocampus. New York: Cambridge University Press; 1991. [Google Scholar]
- Traub RD, Miles R, Buzsaki G. Computer simulation of carbachol-driven rhythmic population oscillations in the CA3 region of the in vitro rat hippocampus. Journal of Physiology. 1992;451:653–672. doi: 10.1113/jphysiol.1992.sp019184. [DOI] [PMC free article] [PubMed] [Google Scholar]
- Traub RD, Wong RKS, Miles R, Michelson H. A model of a CA3 hippocampal pyramidal neuron incorporating voltage-clamp data on intrinsic conductances. Journal of Neurophysiology. 1991;66:635–650. doi: 10.1152/jn.1991.66.2.635. [DOI] [PubMed] [Google Scholar]
- Wu J, Okada YC. Physiological bases of the synchronized population spikes and slow wave of the magnetic field generated by a guinea-pig longitudinal CA3 slice preparation. Electroencephalography and Clinical Neurophysiology. 1998;107:361–373. doi: 10.1016/s0013-4694(98)00098-4. [DOI] [PubMed] [Google Scholar]
- Wu J, Okada YC. Roles of a potassium after-hyperpolarization current in generating neuromagnetic fields and field potentials in longitudinal CA3 slices of the guinea-pig. Clinical Neurophysiology. 1999;110:1858–1867. doi: 10.1016/s1388-2457(99)00138-8. [DOI] [PubMed] [Google Scholar]
- Wu J, Okada YC. Roles of calcium- and voltage-sensitive potassium currents in the generation of neuromagnetic signals and field potentials in a CA3 longitudinal slice of the guinea-pig. Clinical Neurophysiology. 2000;111:150–160. doi: 10.1016/s1388-2457(99)00207-2. [DOI] [PubMed] [Google Scholar]
- Traub RD, Jefferys JGR, Miles R. Analysis of the propagation of disinhibition-induced after-discharges along the guinea-pig hippocampal slice in vitro. Journal of Physiology. 1993;472:267–287. doi: 10.1113/jphysiol.1993.sp019946. [DOI] [PMC free article] [PubMed] [Google Scholar]