

Abstract
We have measured the release of adenosine and inosine from the dorsal surface of the brainstem and from within the nucleus tractus solitarii (NTS) during the defence response evoked by hypothalamic stimulation in the anaesthetised rat. At the surface of the brainstem, only release of inosine was detected on hypothalamic defence area stimulation. This inosine signal was greatly reduced by addition of the ecto-5′-nucleotidase inhibitor α,β-methylene ADP (200 μM), suggesting that the inosine arose from adenosine that was produced in the extracellular space by the prior release of ATP. By placing a microelectrode biosensor into the NTS under stereotaxic control we have recorded release of adenosine within this nucleus. By contrast to the brainstem surface, a fast increase in adenosine, accompanied only by a much smaller change in inosine levels, was seen following stimulation of the hypothalamic defence area. The release of adenosine following hypothalamic stimulation was mainly confined to a narrow region of the NTS some 500 μm in length around the level of the obex. Interestingly the release of adenosine was depletable: when the defence reaction was evoked at short time intervals, much less adenosine was released on the second stimulus. Our novel techniques have given unprecedented real-time measurement and localisation of adenosine release in vivo and demonstrate that adenosine is released at the right time and in sufficient quantities to contribute to the cardiovascular components of the defence reaction.
Although the defence reaction is evoked as a consequence of sensory inputs arriving at higher brain areas such as the amygdala, it can be reliably induced by stimulation of a circumscribed area of the medial hypothalamus called the hypothalamic defence area (HDA). The defence reaction comprises an increase in respiratory rate, sometimes followed by apnoea; an increase in blood pressure and heart rate; and a range of further autonomic responses that depend upon species but include pupillary dilatation, piloerection, growling, scratching and hissing (Johansson et al. 1974; Lipp & Hunsperger, 1978; Fuchs et al. 1985; Yardley & Hilton, 1986). The sensitivity and gain of baroreceptor and chemoreceptor reflexes are also altered during the defence reaction and may contribute to the changes in blood pressure and heart rate (Jordan et al. 1988; Silva-Carvalho et al. 1993). The defence reaction can thus be considered as a complex set of interrelated changes involving several physiological systems, which alter the state of the animal to prepare it for ‘fight or flight’.
The nucleus tractus solitarii (NTS) of the medulla oblongata is the primary site for termination of chemoreceptor and baroreceptor afferents and plays a pivotal role in the integration of cardiovascular and respiratory activity (see Spyer, 1994 for review). As might be expected, the NTS plays an important role in mediating some of the cardiovascular and respiratory components of the defence reaction. A close relationship exists between purines and modulation of cardiorespiratory function within the NTS. Applications of either ATP or adenosine to the NTS evoke large changes in cardiovascular and respiratory activity (Barraco et al. 1993; Phillis et al. 1997). In addition, the NTS has a very high uptake rate for adenosine (Bisserbe et al. 1985) and a high density of adenosine deaminase (Lawrence et al. 1998) and purinoceptors of both the P1 (adenosine) and P2 (ATP) classes (St Lambert et al. 1996; Tuyau et al. 1997; Kanjhan et al. 1999; Thomas et al. 2000). In an extensive series of experiments, we have illustrated that adenosine acting within the NTS can modulate the baroreceptor and chemoreceptor reflexes, probably via an action on the release of other neurotransmitters in this area (Dawid-Milner et al. 1994; Thomas et al. 2000; see Spyer & Thomas, 2000 for a review).
Adenosine appears to play an important role in the manifestation of some components of the defence reaction. Blockade of A1 adenosine receptors by microinjection of specific receptor antagonists into the NTS of the rat gives a marked attenuation of the associated rise in blood pressure (St Lambert et al. 1995). The apparent rise in adenosine may result from the breakdown of neurally released ATP by ectoenzymes in the NTS. Microinjection of an ecto-5′-nucleotidase inhibitor into the NTS reduces the changes in blood pressure during the defence reaction, confirming that the adenosine may originate from the breakdown of previously released ATP (St Lambert et al. 1997). The data indicating the role of adenosine in regulation of cardiorespiratory responses have been recently reviewed (Spyer & Thomas, 2000) and suggest that an increase in adenosine levels within the NTS may be an important contributor to the modulation of autonomic reflexes during the defence reaction. Nevertheless the time course and spatial accumulation of adenosine production remain unknown, and the direct demonstration of adenosine release in sufficient quantities and with appropriately fast timing has not been achieved.
Recently an enzyme-based sensor sensitive to adenosine has been developed to measure release of adenosine from the spinal cord during motor pattern generation (Dale, 1998). This sensor has been used to measure directly the release of adenosine from hippocampal slices during hypoxia (Dale et al. 2000; Pearson et al. 2001). This biosensor is advantageous because it can give a continuous, real-time measurement of changes in adenosine concentration during physiological activity. It would thus be of great utility to study the role of adenosine in the NTS. However the original adenosine sensor is large (250 μm diameter) and thus impractical to implant into the NTS without causing considerable damage that could potentially confound any experimental observations. A new microelectrode biosensor for adenosine and related purines has recently been developed that has been made as small as 25 μm in diameter and which is little more invasive than many other microelectrode assemblies that are regularly used in vivo (Llaudet et al. 2002). We have therefore utilised the original ‘mark-1′ sensor to make recordings of purine release from the brainstem surface and utilised the advanced ‘mark-2′ microelectrode sensor to systematically sample purine release from within the rostro-caudal axis of the NTS itself.
METHODS
Surgical procedure
Experiments were performed on 29 Sprague-Dawley rats (270-320 g). All procedures were carried out in accordance with the UK Animals (Scientific Procedures) Act 1986. Anaesthesia was initially induced by an i.p. injection of pentobarbitone sodium (Sagatal, May & Baker; 60 mg kg−1), and maintained by supplementary injections as required (10 mg kg−1 h−1, i.v.). The depth of anaesthesia was monitored by the absence of a withdrawal response to a paw pinch, and stable records of cardiovascular and respiratory variables. The femoral artery and vein were cannulated for measurement of arterial blood pressure (ABP) and introduction of drugs, respectively. Body temperature was maintained with a servo-controlled heating pad (37-37.5 °C). The trachea was cannulated and the animal was artificially ventilated with positive pressure (Harvard rodent ventilator, model 683; Harvard Apparatus, Holliston, MA, USA) with a mixture of 21 % oxygen and 79 % nitrogen. The animal was then neuromuscularly blockaded with gallamine triethiodide (Flaxedil, Concord Pharmaceuticals, Dunmow, UK; 10 mg kg−1, i.v.; then 1–2 mg kg−1 h−1, i.v.). End tidal CO2 was monitored on-line using a fast-response CO2 analyser (Analytical Development, Herts, UK) and kept at 4–5 % by altering tidal volume and respiratory frequency.
The animal was placed in a stereotaxic frame. Phrenic nerve activity was recorded as an indication of central respiratory drive. Activity was amplified (×10 000), filtered, smoothed and rectified (τ= 50 ms). An occipital craniotomy was performed in order to gain access to the dorsal surface of the medulla oblongata. A portion of the cerebellum was aspirated so that the dorsal surface of the medulla could be clearly visualised 2 mm caudal and 3 mm rostral to the obex (see Paxinos & Watson, 1998). The dorsal surface of the medulla was then superfused continuously (0.5-1.0 ml min−1) with artificial cerebrospinal fluid (aCSF), maintained at a temperature of 37 °C by means of a water bath. The aCSF consisted of (mm): 124 NaCl, 3.3 KCl, 2.4 CaCl2, 1.3 MgSO4, 26 NaHCO3, 1.2 KH2PO4, 10 d-glucose, bubbled with 95 % O2 and 5 % CO2.
A concentric bipolar electrode (SNE 100; Harvard Apparatus) was placed in the left part of the hypothalamus. The hypothalamus was stimulated with 1 ms pulses, 100–200 μA, 100 Hz for 5 s and the defence area (HDA) was identified on the basis of the cardiovascular and respiratory response evoked upon electrical stimulation as described previously (Yardley & Hilton, 1986; Thomas & Spyer, 1996). Positioning of the hypothalamic electrode was adjusted to give an appropriate response qualitatively similar to that observed in the previous reports. The position of the stimulating electrode in the hypothalamus and the stimulation parameters remained unchanged during the course of the experiment.
Adenosine sensors
The principle of the mark-1 adenosine sensor (Fig. 1A) has been described in detail previously (Dale, 1998; Dale et al. 2000; Pearson et al. 2001). Briefly, the probe was loaded with a three-enzyme cascade, adenosine deaminase (AD), nucleoside phosphorylase (NP) and xanthine oxidase (XO), that successively converts adenosine to inosine, and then xanthine, which is oxidised to uric acid with the evolution of H2O2, which can be detected electrochemically (Fig. 1A). The enzymes were loaded into dual-barrelled sensor probes (Sycopel International, Jarrow, UK). In one barrel, all three enzymes were loaded, to give a sensor sensitive to adenosine and inosine, while in the second barrel only the last two enzymes were added to give a sensor sensitive to inosine. The sensor, mounted on a stereotaxic manipulator, was positioned by eye on the left side of the dorsal surface of the brainstem, close to the midline so that its semipermeable glass membrane spanned from the level of the obex to 2 mm rostral of the obex (Fig. 2A). The identical placement of the sensors without enzymes and with enzymes was achieved by aligning them to the obex and to landmark blood vessels and by means of the vernier scale of the manipulator. Although a specific adenosine signal can be obtained by subtracting the output from one barrel from that of the other, the difficulty of placing the sensor relative to the dorsal surface of the brainstem made such differential measurements hard to interpret. We therefore illustrate only the output of the sensor barrel containing all three enzymes. To test whether the sensor specifically measured adenosine released we examined the effects of blocking the first enzyme of the detection cascade, adenosine deaminase, by adding coformycin to the aCSF (Dale, 1998; Dale et al. 2000). Coformycin (1 μM) was added 5 min before the measurement (this time is sufficient for this compound to permeate the dialysis tube of the mark-1 sensor).
Figure 1. Principles and performance of adenosine biosensors.
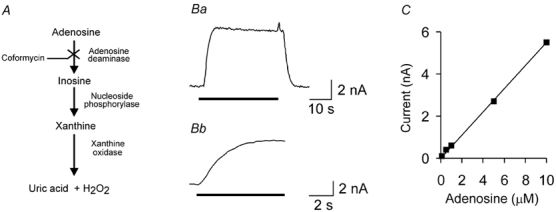
A, the enzymatic cascade used by the mark-1 and mark-2 sensors, involving three enzymes which successively metabolise adenosine to produce H2O2, which can be detected electrochemically. B, response of mark-2 sensor to 10 μM adenosine. An expanded portion of trace Ba is shown in Bb to demonstrate the fast response characteristics of the sensor, which reaches full response within a few seconds. C, calibration curve for a mark-2 sensor to demonstrate linearity of detection from 100 nm to 10 μM adenosine.
Figure 2. Brainstem placements of mark-1 and mark-2 sensors.
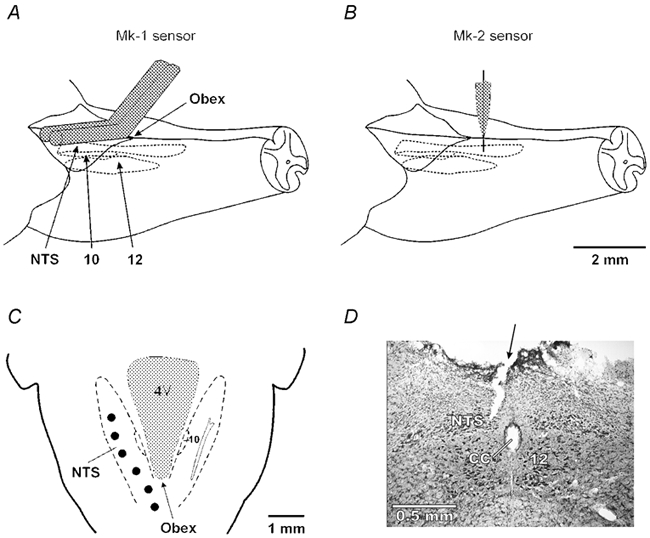
A, the mark-1 sensor was laid on the surface of the brainstem at around the level of the obex so that it was as close to the NTS as possible. B, by mounting the mark-2 sensor on a stereotaxic manipulator this microelectrode sensor could be placed repeatedly into the NTS. C, schematic diagram showing placements (•) of the mark-2 sensor along the rostro-caudal axis of the NTS. D, histological identification of the mark-2 sensor placement in the caudal NTS. 10, dorsal vagal motor nucleus; 12, hypoglossal nucleus; 4V, fourth ventricle; CC, central canal. Arrow indicates track of the sensor.
The mark-2 adenosine sensor relied on the same enzyme cascade (Fig. 1A) but the principle of enzyme entrapment was different. Chemically derivatised pyrrole monomers were now used to make an electropolymer matrix in which the enzymes were entrapped (Llaudet et al. 2002). This matrix was electrodeposited around the platinum working electrode which consisted of either pure platinum or platinum-iridium wire etched to a final diameter that ranged from 25 to 100 μm. The sensor had an exposed length of around 1 mm, which was coated with the polymer/enzyme coating and thus capable of detecting purines. Three types of sensor were used in the present study to identify the nature of the released substance. Firstly null sensors possessing only the electropolymer coating but no enzymes were used as a control to check whether any non-specific electroactive interferents were released and could confound the measurements. Secondly sensors containing just NP and XO were used to detect whether inosine might be produced. Finally sensors with all three enzymes to detect adenosine plus the downstream purines were used.
The performance of the mark-2 sensors (Fig. 1B and C) is far superior to that of the mark-1. The mark-2 sensors exhibit greater sensitivity and faster response times than the mark-1 (Fig. 1B and C; described in detail in Llaudet et al. 2002). To aid the reader we summarise here the main characteristics: the 10–90 % rise time is on average around 2 s (as compared to > 20 s for the mark-1); the specific sensitivity is in the range 100–200 mA m−1 cm−2 (compared to ≈50 mA m−1 cm−2 for the mark-1) and the lower detection limit is ≈10 nm, very similar to that of the mark-1 sensor.
The sensors were connected to a MicroC potentiostat (WPI, Sarasota, FL, USA) and held on a stereotaxic micromanipulator. The sensor was aligned with the obex and then a systematic series of vertical impalements were made at locations relative to this landmark (Fig. 2C). Depending upon the viability of the preparation, changes in adenosine concentration following HDA stimulation were examined at two to six locations along the rostro-caudal axis of the NTS (Fig. 2C). The coordinates of the NTS locations were (in mm, relative to the obex): (1) 0.8 caudal, 0.0-0.4 lateral; (2) 0.3 caudal, 0.1-0.5 lateral; (3) 0.2 rostral, 0.2-0.6 lateral; (4) 0.7 rostral, 1.0 lateral; (5) 1.2 rostral, 1.2 lateral; (6) 1.7 rostral, 1.3 lateral. The sensitive part of the probe was lowered 0.2-0.6 mm below the surface of the brainstem. Changes in adenosine concentration following HDA stimulation at each NTS location were examined 1–3 times in each animal. The data shown in Fig. 7 represent averages of the changes in adenosine concentration following the first HDA stimulation. In some experiments successive HDA stimulations were given at fixed intervals to investigate the effect of the repeated stimulations on changes in adenosine concentration in the NTS. The sensor was calibrated in vitro immediately prior to use and regularly checked between impalements to test whether it retained sensitivity. Following the final impalement, the sensor was recalibrated again. To calculate the approximate adenosine concentrations observed during the experiments, the mean of the initial and final sensor calibrations was used.
Figure 7. Summary data showing the mean release of purines in the rostro-caudal axis of the NTS during the defence response.
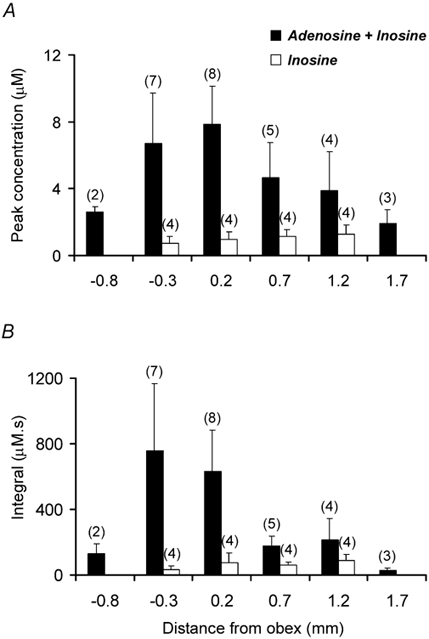
A, the maximum concentration of purine release at each position for adenosine + inosine and inosine alone. Note that so little inosine was released that the combined signal is predominantly adenosine. B, the integral of purine release (area under the increase in sensor signal relative to a baseline drawn between the sensor signal immediately before HDA stimulation and once the sensor had recovered). This gives an indication of the total amount of purine released during the whole response. At levels close to the obex, adenosine was predominantly released. However measurements from more rostral regions revealed that the changes in the combined adenosine + inosine and inosine concentrations became more similar suggesting that in the more rostral regions most adenosine is broken down to inosine. Numbers in parentheses indicate sample sizes; error bars are s.e.m.
To test whether the purine levels measured on the dorsal surface of the brainstem or within the NTS derived from the extracellular breakdown of ATP, we examined the effects of blocking ecto-5′-nucleotidase by adding α,β-methylene ADP (which inhibits the degradation of AMP to adenosine) to the aCSF. α,β-Methylene ADP (200 μM) was added immediately after termination of the first HDA-evoked response. Forty minutes later, changes in purine concentration during hypothalamic stimulation were re-examined. Immediately after this α,β-methylene ADP was washed out and following an additional 40 min the HDA-evoked responses were re-evaluated.
At the end of the experiment, rats were perfused transcardially with saline followed by 4 % paraformaldehyde solution, brains were removed, and locations of the mark-2 biosensor in the NTS were histologically confirmed (Fig. 2D).
Data analysis
Records were analysed using Spike2 software (Cambridge Electronic Design, Cambridge, UK). Changes in purine levels are presented as raw data and means ±s.e.m. of peak (μM) and integral (μM s) increases in adenosine + inosine and inosine concentrations. Means were compared using Student's t test with either paired samples or independent samples design where appropriate (noted in text).
RESULTS
Measurements from the brainstem surface
Specificity of the sensor
Electrochemical sensors are prone to non-specific detection of electroactive species. This is especially true when extending their use to the complex milieu of an in vivo preparation. We therefore performed a series of controls to test the dependence of signals recorded during hypothalamic stimulation on the presence of enzymes within the sensor.
Without enzymes we observed only very modest changes in the sensor signal in response to HDA stimulation (0.16 ± 0.07 nA, n= 6; Fig. 3). To compare these small non-specific signals with those recorded in the presence of the enzymes, we lifted the probe from the brainstem surface, loaded the enzymes and returned the sensor to the same place aided by the stereotaxic manipulator. Following the loading of enzymes into the sensor, so that it became sensitive to adenosine and inosine, a much larger signal was seen in response to hypothalamic stimulation (1.5 ± 0.2 nA, n= 7, Fig. 3). The presence of enzymes in the sensor gave a large increase in the recorded signals strongly suggesting that the vast majority of the signal was due to release of purines during the defence response.
Figure 3. Purine release measured during the defence response at the surface of the brainstem.
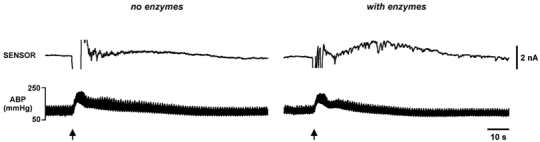
The left panel shows that without enzymes in the sensor only a very small change in sensor current was seen following stimulation of the hypothalamus (indicated by arrows here and in subsequent figures). Once the enzymes had been loaded a much larger response was seen following hypothalamic stimulation (right panel). Here and in subsequent figures: ABP, arterial blood pressure.
To test whether the sensor specifically measured adenosine released we examined the effects of blocking the first enzyme of the detection cascade, adenosine deaminase, by adding coformycin to the aCSF (Dale, 1998; Dale et al. 2000). However, addition of coformycin to the aCSF did not affect the observed increases in the probe signal in response to HDA stimulation (n= 2). This suggests that although the sensor was detecting purines, the contribution to the signal by adenosine was very small. Indeed the signal detected in the second sensor barrel which lacked adenosine deaminase was qualitatively similar (data not shown). We therefore conclude that the recorded signal was mainly due to the presence of inosine rather than adenosine itself.
Purine release from the surface of the brainstem during HDA stimulation
Electrical stimulation of the HDA evoked reproducible increases of ABP of 66 ± 7 % (Figs 3–6). This increase in ABP was similar to that reported by St Lambert et al. (1997) and was maintained for 20–180 s (mean 120.6 ± 10.2 s, n= 54) after the stimulus had terminated. Following HDA stimulation, the purine signal immediately started to rise and reached a peak after 48 ± 15 s (n= 7) before gradually falling back to control levels over the next few minutes (Fig. 3 and Fig. 4). This signal approximates to a mean increase in purine concentration of 4 ± 1 μM (n= 6). The signals recorded were variable (see Fig. 3 and Fig. 4) and depended on the exact placement of the probe on the brainstem surface. In preliminary experiments, we observed that repeated stimulation of the HDA resulted in progressively smaller amounts of purine release. We therefore left a period of at least 40 min between successive hypothalamic stimulations to allow repeatable and comparable increases in the sensor signal to be recorded.
Figure 6. Adenosine is released from a localized portion of the caudal NTS during the defence response.
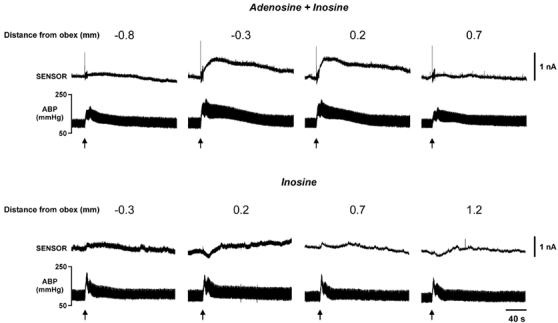
Top panels show the combined adenosine + inosine responses (3-enzyme sensor) obtained by systematic measurements in the same preparation for 0.8 mm caudal to the obex to 0.7 mm rostral to the obex. These measurements were performed over 2–3 h and were not made in an order that accorded to the rostro-caudal sequence. The same sensor sensitive to adenosine + inosine was used for all four impalements. Significant release was seen only at 0.3 mm caudal and 0.2 mm rostral to the obex. Lower panels show measurement of inosine release (2-enzyme sensor) in a different preparation. The same sensor sensitive to inosine was used for all four impalements. Note how the pattern of adenosine localisation is not followed and that the inosine signal is much smaller and slower in time course.
Figure 4. The purines released at brainstem surface during defence response arise from the breakdown of ATP.
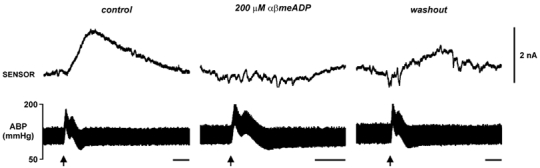
Application of 200 μM α,β-methylene ADP to the dorsal surface of the brainstem reversibly blocked the sensor current. Time bar = 20 s.
Addition of α,β-methylene ADP (200 μM, which inhibits the degradation of AMP to adenosine) to the aCSF reduced the increase in ABP evoked by HDA stimulation from 62 ± 8 % to 50 ± 6 % (P= 0.05, paired sample t test) in 5/7 animals. This variation is similar to that reported previously (St Lambert et al. 1997). The release of purines in response to HDA stimulation was greatly reduced by the presence of α,β-methylene ADP (to 3 ± 2 % of the control response; n= 7, P < 0.001, paired sample t test; Fig. 4). Indeed, in the 5/7 animals where α,β-methylene ADP lowered the pressor response, no measurable increase in probe signal was recorded following HDA stimulation. In the remaining two animals where α,β-methylene ADP had no effect on the pressor response, the amount of purine release was nevertheless reduced as was the mean latency to the peak response (18 ± 10 s). After washout of α,β-methylene ADP, HDA stimulation again led to an increase in the purine signal (74 ± 20 % of control response, not significantly different from control response, n= 3; Fig. 4).
Measurements from within the NTS
As the NTS is some 300–800 μm beneath the surface of the brainstem, measurements of purine release from the surface of the brainstem may at best only provide an indirect picture of changes occurring within the NTS itself. In addition, the purines measured at the surface may originate from several different underlying structures. The original mark-1 sensor, with a diameter of 500 μm is too large to insert into the NTS without causing considerable damage. Furthermore the cumulative damage from successive insertions of this sensor into the NTS would be expected to compromise neural function in this important integrative nucleus. We therefore turned to a smaller microelectrode sensor developed by Llaudet et al. (2002), the mark-2 sensor.
To test the selectivity of the mark-2 microelectrode sensor we used null sensors that lacked any enzymes in the polymer coating to check the possibility that non-specific electroactive interferents might be released in the NTS during HDA stimulation. The null sensors failed to record any signal (Fig. 5) in response to HDA stimulation. We therefore concluded that the mark-2 sensors can be used in this physiological context to record purine release.
Figure 5. Adenosine is predominantly released in the NTS during stimulation of the HDA.
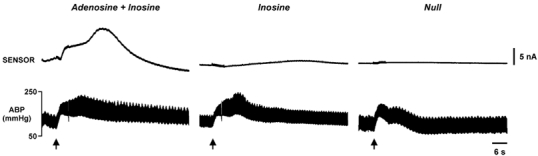
Measurement of purine release from within the NTS (coordinates: 0.2 rostral, 0.2 lateral relative to the obex) with the mark-2 sensor. Note the rapid and large signal recorded by the 3-enzyme sensor (left, sensitive to adenosine and inosine) compared to the much slower signal recorded by the 2-enzyme sensor (middle, sensitive to inosine) and the virtual absence of a response in the null sensor (right panel).
We recorded a fast transient signal from adenosine sensors following HDA stimulation that had a mean amplitude of 1.5 ± 0.5 nA (n= 9 rats). The signals returned to baseline slowly over a period of 30 s to 2 min (Figs 5, 6, 8 and 9). Interestingly, when we used sensors sensitive to inosine, but not adenosine, a much smaller current with a slower onset was seen (Figs 5–7 and Table 1). The delayed appearance of inosine might be expected if inosine arises from the breakdown of adenosine, perhaps in areas somewhat distant from the recording site. We therefore conclude that within the NTS itself, adenosine and not inosine is released during the defence response. Presumably as adenosine diffuses dorsally from the NTS it becomes converted to the inosine which we detected at the brainstem surface. Interestingly there are high levels of adenosine deaminase present in the NTS and structures dorsal to it (Lawrence et al. 1998).
Figure 8. Adenosine release in the NTS during the defence response is derived from the breakdown of ATP.
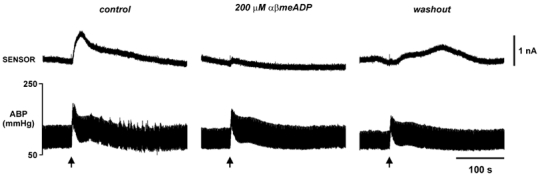
Application of 200 μM α,β-methylene ADP to the dorsal surface of the brainstem reversibly blocked the sensor current.
Figure 9. Adenosine release during the defence response is depletable.
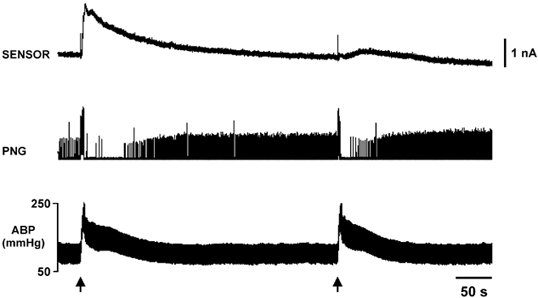
Two successive stimuli to the hypothalamus were given 5 min apart. Much less adenosine was released during the second stimulus. The changes in ABP were unaltered in the two defence responses. However, recordings of the integrated phrenic nerve activity (PNG) showed that the period of apnoea in the second defence reaction was shorter than during the first. This correlates with the depleted adenosine release.
Table 1.
Time course of changes in arterial blood pressure (ABP) and purine levels during the defence response following stimulation of the hypothalamic defence area
| Distance from obex(mm) | Time to peak of the response (s) | Duration of the response (s) | |
|---|---|---|---|
| Change in ABP | — | 6.9 ± 0.4 (48) | 120.6 ± 10.2 (48) |
| -0.3 | 30.8 ± 11.1 (7) | 233.9 ± 70.2 (7) | |
| Change in adenosine + inosine concentration in the NTS | 0.2 | 30.6 ± 10.2 (9) | 215.3 ± 45.6 (9) |
| 0.7 | 9.3 ± 3.8 (5) | 164.4 ± 52.6 (5) | |
| 1.2 | 7.8 ± 6.6 (5) | 77.2 ± 47.5 (5) | |
| -0.3 | 14.0 ± 9.2 (4) | 52.5 ± 30.9 (4) | |
| Change in inosine concentration in the NTS | 0.2 | 63.0 ± 39.1(4) | 80.5 ± 27.4 (4) |
| 0.7 | 32.8 ± 14.9 (4) | 144.5 ± 48.3 (4) | |
| 1.2 | 36.5 ± 8.5 (4) | 144.8 ± 30.6 (4) |
Numbers in parentheses indicate sample sizes.
In preliminary studies we noticed that the amplitude of the adenosine signal following HDA stimulation could vary considerably from recording to recording. This suggested that the release might be highly localised rather than widespread and diffuse. We therefore performed a systematic investigation of the NTS in which we used stereotaxic coordinates to place the sensor in known and consistent locations.
Starting at 0.8 mm caudal to the obex we tracked rostrally in 0.5 mm increments to a position 1.7 mm rostral to the obex. The release of adenosine was greatest in positions just caudal and rostral to the obex (Fig. 6 and Fig. 7). At these positions the amount of adenosine released during HDA stimulation reached peak concentrations of 6–8 μM (Fig. 7). In a similar series of measurements, the amount of inosine released at the same locations was very much less reaching a maximum of just over 1 μM (Fig. 6 and Fig. 7). Although the peak adenosine + inosine signal exceeded that of inosine at all positions (Fig. 7A), when the integral of purine release - a measure of the total amount of release during the whole response - was plotted (Fig. 7B) adenosine was seen to be even more localised to the region of the obex (Fig. 7). More rostral to this position there was little difference between the integral of the adenosine + inosine signal compared to the inosine signal alone. This suggests that in the rostral areas, although adenosine release may transiently exceed that of inosine, most of the adenosine is eventually converted to inosine by adenosine deaminase.
To compare the changes in blood pressure and purine release during the defence response, we measured the time to peak and duration of both the changes in blood pressure and the purine levels recorded by the sensors (Table 1). The change in blood pressure reached its peak approximately 7 s after the stimulus and lasted around 120 s (Table 1). The time course of the purine signal depended upon location within the NTS. The increase recorded by the adenosine + inosine sensor (which is mainly an adenosine signal) had a time to peak that ranged from 8 s in the more rostral regions to 31 s in the more caudal regions (Table 1). As the peak levels of adenosine recorded in the NTS reached around 8 μM, the adenosine A1 receptors in the NTS will have been effectively saturated before the peak levels of adenosine production were achieved. The duration of elevated adenosine levels ranged from 77 s rostrally to 234 s caudally (Table 1). Thus, the time course of adenosine accumulation matched well to the time course of the changes in blood pressure. The time course of inosine production was harder to measure as the signal recorded by the inosine sensor was much smaller than that for the adenosine + inosine sensor. Nevertheless the onset of inosine accumulation was generally slower than that of adenosine at the equivalent rostro-caudal position within the NTS (Table 1). This is consistent with inosine being the breakdown product of adenosine. The duration of the inosine signal was also shorter, although this may be partly due to the difficulty of accurately determining the duration of a smaller signal.
We next tested whether the adenosine measured in the NTS following HDA stimulation was derived from the extracellular breakdown of ATP. We found that application of 200 μM α,β-methylene ADP to the dorsal surface of the brainstem virtually abolished the sensor signal (Fig. 8, n= 2). Following prolonged washing, we observed partial recovery of the adenosine signal. Thus, like the purines recorded from the surface of the brainstem, adenosine release within the NTS itself arises from the breakdown of ATP by ecto-enzymes.
Interestingly, we also found that the amount of adenosine released in the NTS following HDA stimulation rapidly depleted. When two stimuli were given 5 min apart the amount of adenosine released from the second stimulus was far less (7.2 ± 3.2 μM first stimulus; 1.7 ± 0.7 μM second stimulus, n= 7, Fig. 9). Nevertheless the magnitude (87 ± 7.9 and 85 ± 7.1 mmHg first and second stimuli, respectively) and duration (130.3 ± 24.8 and 113.8 ± 16.6 s first and second stimuli, respectively, n= 12) of the changes in ABP remained unaltered. However the duration of apnoea was significantly reduced during the second HDA stimulus and correlated with the depletion of adenosine release (34 ± 18 and 16 ± 12 s first and second stimuli, respectively, P= 0.02, paired sample t test, n= 5; Fig. 9). It was also found that reproducible changes in the NTS adenosine concentration following hypothalamic stimulation occurred if a sufficient period of rest (>30 min) was provided between applied stimuli. For example, in Fig. 8 partial recovery of adenosine release following washout of α,β-methylene ADP is seen nearly 1.5 h after the first defence response and approximately 40 min after the second. Also, when successive HDA stimulations were given more than 30 min apart the duration of apnoea was comparable (data not shown).
Histological analysis demonstrated all recording sites to be within the targeted regions of the NTS (Fig. 2D).
DISCUSSION
This is the first in vivo study in mammals to utilise an enzyme-based sensor sensitive to adenosine and inosine to illustrate the release of purines from structures within the central nervous system in response to physiological stimuli. This study extends the application of this sensor, which has been previously used with frog embryo spinal cord (Dale, 1998; Llaudet et al. 2002) and hippocampal brain slices in vitro (Dale et al. 2000; Pearson et al. 2001).
Surface measurements
Because the NTS is not visible from the surface of the brainstem, we could not place the sensor in a precise orientation to this structure. At the obex the surface of the brainstem is curved making accurate placement even more difficult. Nevertheless we believe that the surface measurements did monitor, albeit indirectly, purine release occurring in subsurface structures.
The surface-recorded signals depended upon the presence of enzymes within the sensor and were therefore not due to non-specific electroactive interferents. Nevertheless, the adenosine deaminase inhibitor coformycin did not alter the signals recorded during hypothalamic stimulation demonstrating that the sensor was mainly responding to the levels of inosine, the breakdown product of adenosine, rather than to adenosine itself. That the signals measured during stimulation could be reversibly blocked by α,β-methylene ADP gives further support to our interpretation that we were measuring purines, as α,β-methylene ADP blocks the extracellular breakdown of ATP. The simplest interpretation of these data is that they represent the accumulation of inosine, the breakdown product of adenosine produced within the brainstem, which in turn is the breakdown product of neuronally released ATP.
The purine signal measured by the sensor from the surface of the brainstem might originate from a number of dorsal brainstem structures including the NTS, area postrema and dorsal vagal motor nucleus (DVM). Given that the NTS and DVM are located several hundred micrometres below the dorsal surface of the medulla, adenosine released in those regions would have a large distance to diffuse in order to come into contact with the sensor. Adenosine is very rapidly broken down within the extracellular space and the NTS for example has one of highest uptake rates for adenosine within the CNS (Bisserbe et al. 1985). This might explain why we appeared to be measuring changes in the levels of a breakdown product of adenosine, and not directly measuring adenosine levels with the sensor at the surface. Despite these limitations, the signals that we recorded did show temporal correlation with the physiological changes that occurred in response to stimulation in the hypothalamus. This suggests that the sensor gives a reasonable but somewhat filtered indication of changes in purine concentration in the extracellular space in response to these physiological stimuli.
Measurements within the NTS
Our investigations of the purine release in the dorsal brainstem have been greatly aided by the development of a new smaller adenosine microelectrode biosensor. With diameters ranging from 25 to 100 μm, this sensor was much less invasive and thus highly suitable for repeated implantation into the NTS without compromising neural function.
An interesting contrast between the surface and intranuclear measurements emerged. Unlike the surface measurements it became readily apparent that adenosine itself is released in the NTS with a far larger adenosine signal being recorded than that for inosine. This would suggest that adenosine, as it diffuses from the NTS, is broken down to inosine (seen at the brainstem surface) suggesting that the arrangement of ecto-adenosine deaminase may be such to limit the neural actions of adenosine to the NTS itself rather than the overlying structures. Furthermore the signal measured in the NTS had a much faster rise time (mean time to peak around 16 s as opposed to around 48 s recorded at the surface). Given that a sensor within the NTS will be much closer to the site of adenosine production, we believe that the signals recorded by the mark-2 sensor (which has a 10–90 % response time of ≈2 s, Llaudet et al. 2002) are likely to be an accurate reflection of the dynamics of adenosine accumulation at its site of action.
As α,β-methylene ADP blocks the rise in adenosine following HDA stimulation, adenosine appears to be produced from the breakdown of previously released ATP. The known kinetics of the ectonucleotidases may account for the somewhat delayed production of adenosine that we observed. Firstly the process is sequential and secondly, ATP and ADP can mediate feed-forward inhibition of the conversion of AMP to adenosine (Gordon et al. 1986; James & Richardson, 1993; Zimmermann, 1996).
Adenosine and the defence reaction
Our previous data have shown that blockade of adenosine receptors in the NTS reduced the cardiovascular responses evoked by HDA stimulation (St Lambert et al. 1995). Furthermore, injection of α,β-methylene ADP into the NTS to block breakdown of ATP and hence production of adenosine alters the defence response (St Lambert et al. 1997). These observations suggest that the rapidly produced adenosine that we have observed in the NTS contributes to the generation of the defence reaction. The time course of production (reaching a peak within 16 s of the start of HDA stimulation) is consistent with adenosine contributing to all but the very earliest phases of the defence reaction. Furthermore the levels of adenosine that we recorded within the NTS are more than sufficient to strongly activate (and probably saturate) the A1 receptors in this nucleus.
An important finding of the present study is that during electrical stimulation of the hypothalamus the release of adenosine in the NTS is greatest at the level of the obex. This part of the NTS receives baroreceptor afferent input so release of adenosine might be secondary to the activation of baroreceptors that follows the increase in blood pressure evoked by the HDA stimulation. Thus, we cannot completely rule out this possibility. However, in preliminary experiments, the mark-2 adenosine biosensor failed to detect any changes in NTS purine concentration during prolonged increases in blood pressure evoked by intravenous infusion of adrenaline (N. Dale, A. V. Gourine, E. Llaudet & K. M. Spyer, unpublished observations). Therefore, it is unlikely that following HDA stimulation the increase in blood pressure and subsequent activation of baroreceptors per se are responsible for the observed increase in NTS concentration of adenosine.
At the moment we also cannot completely exclude the possibility that variability in the magnitude of the cardiovascular responses evoked by HDA stimulation may account for some of the variability in the recorded changes of adenosine concentration. This is important as we believe that at the NTS level, adenosine may partially mediate cardiovascular responses induced by HDA stimulation (St Lambert et al. 1995, 1997). If so, lower levels of adenosine production in the NTS should result in less profound cardiovascular changes induced by HDA stimulation. Nevertheless some aspects of our work suggest that the relationship between adenosine and the cardiovascular changes accompanying the defence reaction need to be re-evaluated. In particular we found that repeated stimulation of the HDA resulted in a profound decrement in adenosine release unless a sufficient period of rest (>30 min) was provided between applied stimuli. In contrast to the depletable nature of adenosine release, the changes in mean ABP evoked by HDA stimulation were not affected by the time interval between stimuli. At first sight this suggests dissociation between the production of adenosine and some aspects of the cardiovascular response. Nevertheless the levels of adenosine released after depletion (≈1-2 μM) are still sufficiently high to substantially activate the postsynaptic receptors and could thus plausibly maintain the cardiovascular response.
This apparent reduction of adenosine release on repeated stimulation is also observed in the hippocampus as adenosine production during hypoxia in this structure is also depletable (Pearson et al. 2001). Although the functional context is very different, and the mechanisms of adenosine production in hippocampus and NTS may be very different, it is tempting to speculate that the depletion of adenosine release in response to repeated stimulation may be a widespread phenomenon.
A prediction of our finding of adenosine depletion with repeated stimulation of the HDA is that some aspects of the defence reaction should exhibit similar fatigue. Interestingly, the behaviourally evoked defence reaction in cats and dogs exhibits plasticity and the cardiovascular components of this reflex can exhibit habituation prior to observable corresponding changes in the behavioural reflex (Martin et al. 1976). The extent of apnoea following the enhancement of respiration may be one such facet. We found that the length of respiratory depression following the HDA stimulation correlated well with depletion of the adenosine signal. These observations suggest that depletion of adenosine release may contribute to plasticity of components of the defence response at the level of the NTS.
Acknowledgments
We thank the BBSRC, British Heart Foundation, Cunningham Trust, The Royal Society, and the Wellcome Trust for financial support.
REFERENCES
- Barraco R, Ergene E, El-Ridi M. Purinergic receptors in the nucleus tractus solitarius mediate distinct cardiorespiratory response patterns. Drug Development Research. 1993;28:309–314. [Google Scholar]
- Bisserbe JC, Patel J, Marangos PJ. Autoradiographic localization of adenosine uptake sites in the brain using [3H] nitrobenzylthioinosine. Journal of Neuroscience. 1985;5:544–550. doi: 10.1523/JNEUROSCI.05-02-00544.1985. [DOI] [PMC free article] [PubMed] [Google Scholar]
- Dale N. Delayed production of adenosine underlies temporal modulation of swimming in frog embryo. Journal of Physiology. 1998;511:265–272. doi: 10.1111/j.1469-7793.1998.265bi.x. [DOI] [PMC free article] [PubMed] [Google Scholar]
- Dale N, Pearson T, Frenguelli BG. Direct measurement of adenosine release during hypoxia in the CA1 region of the rat hippocampal slice. Journal of Physiology. 2000;526:143–155. doi: 10.1111/j.1469-7793.2000.00143.x. [DOI] [PMC free article] [PubMed] [Google Scholar]
- Dawid-Milner MS, Silva-Carvalho L, Goldsmith GE, Spyer KM. A potential role of central A1 adenosine receptors in the response to hypothalamic stimulation. Journal of the Autonomic Nervous System. 1994;49:15–19. doi: 10.1016/0165-1838(94)90016-7. [DOI] [PubMed] [Google Scholar]
- Fuchs SA, Edinger HM, Siegel A. The organization of the hypothalamic pathways mediating affective defense behavior in the cat. Brain Research. 1985;330:77–92. doi: 10.1016/0006-8993(85)90009-5. [DOI] [PubMed] [Google Scholar]
- Gordon EL, Pearson JD, Slakey L. The hydrolysis of extracellular adenine nucleotides by cultured endothelial cells from pig aorta. Journal of Biological Chemistry. 1986;261:15496–15504. [PubMed] [Google Scholar]
- James S, Richardson PJ. Production of adenosine from extracellular ATP at the striatal cholinergic synapse. Journal of Neurochemistry. 1993;60:219–227. doi: 10.1111/j.1471-4159.1993.tb05841.x. [DOI] [PubMed] [Google Scholar]
- Johansson GG, Kalimo R, Niskanen H, Ruusunen S. Effects of stimulation parameters on behavior elicited by stimulation of the hypothalamic defense area. Journal of Comparative Physiology and Psychology. 1974;87:1100–1108. doi: 10.1037/h0037587. [DOI] [PubMed] [Google Scholar]
- Jordan D, Mifflin SW, Spyer KM. Hypothalamic inhibition of neurones in the nucleus tractus solitarius of the cat is GABA mediated. Journal of Physiology. 1988;399:389–404. doi: 10.1113/jphysiol.1988.sp017087. [DOI] [PMC free article] [PubMed] [Google Scholar]
- Kanjhan R, Housley GD, Burton LD, Christie DL, Kippenberger A, Thorne PR, Luo L, Ryan AF. Distribution of the P2X2 receptor subunit of the ATP-gated ion channels in rat central nervous system. Journal of Comparative Neurology. 1999;407:11–32. [PubMed] [Google Scholar]
- Lawrence AJ, Castillo-MelendeZ M, McLean KJ, Jarrott B. The distribution of nitric oxide synthase-, adenosine deaminase- and neuropeptide Y-immunoreactivity through the entire rat nucleus tractus solitarius: Effect of unilateral nodose ganglionectomy. Journal of Chemical Neuroanatomy. 1998;15:27–40. doi: 10.1016/s0891-0618(98)00020-9. [DOI] [PubMed] [Google Scholar]
- Lipp HP, Hunsperger RW. Threat, attack and flight elicited by electrical stimulation of the ventromedial hypothalamus of the marmoset monkey Callithrix jacchus. Brain Behaviour and Evolution. 1978;15:260–293. doi: 10.1159/000123782. [DOI] [PubMed] [Google Scholar]
- Llaudet E, Botting NP, Crayston JA, Dale N. A 3-enzyme sensor for detecting purines from CNS. Biosensors and Bioelectronics. 2002. in the Press. [DOI] [PubMed]
- Paxinos G, Watson C. The Rat Brain in Stereotaxic Coordinates. London: Academic Press; 1998. [Google Scholar]
- Pearson T, Nuritova F, Caldwell D, Dale N, Frenguelli BG. A depletable pool of adenosine in area CA1 of the rat hippocampus. Journal of Neuroscience. 2001;21:2298–2307. doi: 10.1523/JNEUROSCI.21-07-02298.2001. [DOI] [PMC free article] [PubMed] [Google Scholar]
- Phillis JW, Scislo TJ, O'Leary DS. Purines and the nucleus tractus solitarius: effects on cardiovascular and respiratory function. Clinical and Experimental Physiology and Pharmacology. 1997;24:738–742. doi: 10.1111/j.1440-1681.1997.tb02124.x. [DOI] [PubMed] [Google Scholar]
- St Lambert JH, Dashwood MR, Spyer KM. Role of brainstem adenosine A1 receptors in the cardiovascular response to hypothalamic defence area stimulation in the anaesthetised rat. British Journal of Pharmacology. 1996;117:277–282. doi: 10.1111/j.1476-5381.1996.tb15187.x. [DOI] [PMC free article] [PubMed] [Google Scholar]
- St Lambert JH, Thomas T, Burnstock G, Spyer KM. A source of adenosine involved in cardiovascular responses to defence area stimulation. American Journal of Physiology. 1997;272:R195–200. doi: 10.1152/ajpregu.1997.272.1.R195. [DOI] [PubMed] [Google Scholar]
- St Lambert JH, Thomas T, Spyer KM. Role of brainstem adenosine A1 receptors on the hypothalamic defence response in the anaesthetised rat. Journal of Physiology. 1995;489:154P. doi: 10.1111/j.1476-5381.1996.tb15187.x. [DOI] [PMC free article] [PubMed] [Google Scholar]
- Silva-Carvalho L, Dawid-Milner MS, Goldsmith GE, Spyer KM. Hypothalamic-evoked effects in cat nucleus tractus solitarius facilitating chemoreceptor reflexes. Experimental Physiology. 1993;78:425–428. doi: 10.1113/expphysiol.1993.sp003696. [DOI] [PubMed] [Google Scholar]
- Spyer KM. Central nervous mechanisms contributing to cardiovascular control. Journal of Physiology. 1994;474:1–19. doi: 10.1113/jphysiol.1994.sp019997. [DOI] [PMC free article] [PubMed] [Google Scholar]
- Spyer KM, Thomas T. A role for adenosine in modulating cardio-respiratory responses: a mini-review. Brain Research Bulletin. 2000;53:121–124. doi: 10.1016/s0361-9230(00)00316-6. [DOI] [PubMed] [Google Scholar]
- Thomas T, St Lambert JH, Dashwood MR, Spyer KM. Localization and action of adenosine A2a receptors in regions of the brainstem important in cardiovascular control. Neuroscience. 2000;95:513–518. doi: 10.1016/s0306-4522(99)00473-x. [DOI] [PubMed] [Google Scholar]
- Thomas T, Spyer KM. The role of adenosine receptors in the rostral ventrolateral medulla in the cardiovascular response to defence area stimulation in the rat. Experimental Physiology. 1996;81:67–77. doi: 10.1113/expphysiol.1996.sp003919. [DOI] [PubMed] [Google Scholar]
- Tuyau M, Hansen MA, Coleman MJ, Dampney RA, Balcar VJ, Bennet MR. Autoradiography of [3H] alpha, beta-methylene-ATP binding sites in medulla oblongata and spinal cord of the rat. Neurochemistry International. 1997;30:159–169. doi: 10.1016/s0197-0186(96)00062-9. [DOI] [PubMed] [Google Scholar]
- Yardley CP, Hilton SM. The hypothalamic and brainstem areas from which the cardiovascular and behavioural components of the defence response are elicited in the rat. Journal of the Autonomic Nervous System. 1986;15:227–244. doi: 10.1016/0165-1838(86)90066-4. [DOI] [PubMed] [Google Scholar]
- Zimmermann H. Biochemistry, localization and functional roles of ecto-nucleotidases in the nervous system. Progress in Neurobiology. 1996;49:589–618. doi: 10.1016/0301-0082(96)00026-3. [DOI] [PubMed] [Google Scholar]
- Martin J, Sutherland CJ, Zbrozyna AW. Habituation and conditioning of the defense reactions and their cardiovascular components in cats and dogs. Pflu¨gers Archiv. 1976;365:37–47. doi: 10.1007/BF00583626. [DOI] [PubMed] [Google Scholar]