

Abstract
The time course of adenosine release in the nucleus tractus solitarii (NTS) and ventrolateral medulla (VLM) during acute systemic hypoxia was investigated in the anaesthetised rat by means of amperometric enzymatic sensors. It was found that acute hypoxia induced a significant delayed increase in adenosine level (reaching levels as high as 5 μM) in the NTS and that hypoxia-induced release of adenosine was similar at various regions of the NTS along its rostro-caudal axis. Significantly smaller or no increases in adenosine levels at all in response to hypoxia were observed in the VLM. The increase in adenosine level in the NTS occurred during reoxygenation after the termination of the hypoxic challenge and was accompanied by a smaller increase in inosine concentration. At the dorsal surface of the brainstem, only release of inosine was detected following acute hypoxia. Addition of the ecto-5′-nucleotidase inhibitor α,β-methylene ADP (200 μM) to the dorsal surface of the brainstem completely abolished the signal evoked by hypoxia, suggesting that the inosine arose from adenosine that was produced in the extracellular space by the prior release of ATP. This study indicates that following systemic hypoxia, adenosine levels in the NTS increase to a significantly greater extent than in the VLM. However, the increase in adenosine concentration in the NTS occurs too late to be responsible for the hypoxia-induced depression of the respiratory activity.
The deficit of oxygen in inspired air, or hypoxia, is one of the most serious and life-threatening environmental challenges experienced by living organisms with a high metabolic rate (mammals and birds). The respiratory response to acute severe hypoxia in adults is similar to that of neonates in that there is an initial increase in respiration, followed by a depression in respiratory activity, known as hypoxic ventilatory depression, which often results in apnoea (Richter et al. 1991; Thomas & Marshall, 1994). The mechanisms underlying the initial augmentation of central respiratory activity during hypoxia have been extensively investigated and include activation of arterial chemoreceptors, activation of medullary chemosensory neurones and direct stimulation of respiratory neurones (for review see Richter et al. 1999). The processes responsible for hypoxic ventilatory depression and hypoxic apnoea are less well understood. Depression of neuronal excitability and synaptic interactions between medullary respiratory neurones (Richter et al. 1991) and/or an increase in GABA-mediated inhibition of these neurones (Melton et al. 1990) may underlie hypoxic ventilatory depression.
In addition adenosine, an inhibitory neuromodulator, may also contribute to the mechanisms responsible for hypoxic ventilatory depression. Several lines of evidence support this hypothesis: (i) areas of the brainstem essential for generation of the respiratory rhythm such as dorsal (including nucleus tractus solitarii (NTS)) and ventral (including ventrolateral medulla (VLM)) respiratory groups have a high density of adenosine receptors (Reppert et al. 1991; St Lambert et al. 1996; Thomas et al. 2000b), a high turnover rate for adenosine (Bisserbe et al. 1985) and high concentrations of adenosine deaminase (Lawrence et al. 1998); (ii) adenosine levels within the central nervous system are known to increase during and after periods of hypoxia in neonatal as well as in adult experimental animals (Rubio et al. 1975; Winn et al. 1986; Zetterstrom et al. 1982; Schubert et al. 1994; Yan et al. 1995; Richter et al. 1999); (iii) adenosine and adenosine receptor agonists depress, and adenosine receptor antagonists enhance, respiratory activity in vivo and in vitro (Eldridge et al. 1985; Schmidt et al. 1995; Mironov et al. 1999); and (iv) hypoxic respiratory depression is reduced by administration of adenosine receptor antagonists (Runold et al. 1989; Thomas & Marshall, 1994; Schmidt et al. 1995; Chau & Koos, 1999) or in mice lacking adenosine A1 receptor (Johansson et al. 2001).
Therefore, during acute hypoxia, release and accumulation of adenosine within the areas of the brainstem may be partially responsible for the depression of neuronal activity that leads to hypoxic ventilatory depression and apnoea. Studies using microdialysis have shown that during hypoxia adenosine levels rise within the NTS of piglets (Yan et al. 1995) and within the ventral respiratory group of neurones in the cat (Richter et al. 1999). However, adenosine levels in the VLM rise after the onset of the hypoxic ventilatory depression (Richter et al. 1999), suggesting that even if adenosine contributes to the sustained hypoxic depression of respiration, its action alone cannot explain hypoxic apnoea.
Because in vivo microdialysis relies on taking regular samples over relatively long periods of time it provides only limited temporal resolution. Thus, rapid release of adenosine at a time that preceded and could underlie respiratory depression might be overlooked by this technique. Direct real-time measurement of adenosine release in the medullary structures responsible for generation of the respiratory activity would therefore be advantageous for further testing the role of adenosine in hypoxia-induced changes in respiration. An enzyme-based ‘mark-1′ sensor sensitive to adenosine has been developed to measure release of adenosine from the spinal cord during motor pattern generation (Dale, 1998). More recently, this sensor has been used to measure directly the release of adenosine from hippocampal slices during hypoxia (Dale et al. 2000; Pearson et al. 2001). This technique has significant advantages over microdialysis in that it gives a continuous, real-time measurement of adenosine concentration. Recently a new microelectrode-based ‘mark-2′ sensor for adenosine and related purines has been developed (Llaudet et al. 2002) that has been made as small as 25 μm in diameter (against 500 μm diameter of the microdialysis probe) and which is little more invasive than many other microelectrode assemblies that are regularly used in vivo. In the companion paper the sensor characteristics are given in detail (Dale et al. 2002a). In this study we have used the original mark-1 sensor to record purine (adenosine and inosine) release from the dorsal surface of the brainstem and the new mark-2 microelectrode sensor to measure adenosine and inosine release from within the NTS and VLM during acute systemic hypoxia. Some of these results have been reported previously in brief (Thomas et al. 2000a; Dale et al. 2002b).
METHODS
Surgical procedure
Experiments were performed on 32 male Sprague-Dawley rats (270-320 g). The rats were anaesthetised with pentobarbitone sodium (Sagatal, May and Baker, UK; 60 mg kg−1, i.p.). Anaesthesia was maintained with supplemental doses of pentobarbitone sodium injected intravenously as required (10 mg kg−1 h−1). All studies were carried out in accordance with the UK Animals (Scientific Procedures) Act, 1986. Adequate anaesthesia was ensured by maintaining stable levels of blood pressure, heart and central respiratory rate and monitored by the absence of a withdrawal response to a paw pinch. The femoral artery and vein were cannulated for measurement of arterial blood pressure (ABP) and administration of anaesthetic, respectively. The trachea was cannulated and the animal was ventilated with a mixture of 21 % oxygen and 79 % nitrogen (unless otherwise required by the protocol) using a positive pressure ventilator (Harvard rodent ventilator, model 683; Harvard Apparatus, Holliston, MA, USA) with a tidal volume of 1.5-2 ml and a ventilator frequency similar to spontaneous frequency. The animal was then neuro-muscularly blocked with gallamine triethiodide (Flaxedil, Concord Pharmaceuticals, Dunmow, UK; 10 mg kg−1, i.v.; then 1–2 mg kg−1 h−1, i.v.) and was placed in a stereotaxic frame. An occipital craniotomy was performed and the cerebellum was partially removed to expose the dorsal surface of the brainstem. The dorsal surface of the medulla was then superfused continuously (0.5-1.0 ml min−1) with artificial cerebrospinal fluid (aCSF), maintained at a temperature of 37 °C by means of a water bath. The aCSF consisted of (mm): 124 NaCl, 3.3 KCl, 2.4 CaCl2, 1.3 MgSO4, 26 NaHCO3, 1.2 KH2PO4, 10 d-glucose, bubbled with 95 % O2 and 5 % CO2. Activity of the phrenic nerve was recorded as an indicator of central respiratory drive. The signal was amplified (×10 000), filtered (500-1500 Hz) and rectified and smoothed (τ= 50 ms). Partial pressures of O2 and CO2 as well as pH of the arterial blood (volume of the blood sample was 75 μl) were measured every 1–2 h. End-tidal levels of CO2 were monitored on-line using a fast-response CO2 analyser (Analytical Development, Hertfordshire, UK) and kept at 4–5 % by altering tidal volume and respiratory frequency. When ventilator frequency and tidal volume were adjusted to maintain end-tidal CO2 as well as blood PO2 and PCO2 within the physiological limits (PO2 > 100 mmHg; PCO2≈ 40 mmHg), one phrenic nerve burst for every two strokes of the ventilator was usually observed (average baseline frequency of the phrenic nerve bursts: 36.0 ± 1.4 bursts min−1, n= 60). The body temperature was maintained with a servo-controlled heating pad at 37.0 ± 0.2 °C.
Adenosine sensors
The design and operation of the sensors used in this paper have been described in detail elsewhere (Dale 1998; Dale et al. 2000; Pearson et al. 2001; Llaudet et al. 2002) and in the companion paper (Dale et al. 2002a). Two sensors were used in this study - a larger mark-1 sensor, and a mark-2 sensor that is sufficiently small to be inserted into neural tissue without causing excessive damage.
Three configurations of the mark-1 and mark-2 sensors were used in the present study to identify the nature of the released substance. Null sensors lacking enzymes were used as a control to determine whether any ‘non-specific’ electroactive interferents were released that could confound the measurements. Then, sensors containing just nucleoside phosphorylase (NP) and xanthine oxidase (XO) were used to detect whether inosine is released. Finally, sensors containing all three enzymes (adenosine deaminase plus NP and XO) were used to detect adenosine plus the downstream purines. Sensors were calibrated in vitro immediately prior to use and regularly checked to test whether they retained sensitivity. Following the final use, the sensor was recalibrated. To calculate the purine concentrations, the mean of the initial and final calibrations was used.
Experimental protocol
The sensors were connected to a MicroC potentiostat (WPI, Sarasota, FL, USA) and held on a stereotaxic micromanipulator. The mark-2 sensor was aligned with the obex and then a systematic series of vertical impalements were made at locations relative to this landmark (Fig. 1; see also Fig. 2 of the companion paper, Dale et al. 2002a). Depending upon the viability of the preparation, changes in purine concentrations during hypoxia were examined at two to four locations along the rostro-caudal axis of the NTS. The coordinates of the NTS locations were (in mm, relative to the obex): (1) 0.3 caudal, 0.1-0.5 lateral; (2) 0.2 rostral, 0.2-0.6 lateral; (3) 0.7 rostral, 1.0 lateral; (4) 1.2 rostral, 1.2 lateral. The sensitive part of the probe was lowered 0.2-0.6 mm below the surface of the brainstem. The mark-1 sensor, mounted on a stereotaxic manipulator, was positioned by eye on the left side of the dorsal surface of the brainstem, close to the midline so that its semipermeable glass membrane spanned from the level of the obex to 2 mm rostral of the obex (see Fig. 2 of the companion paper, Dale et al. 2002a). The identical placement of the sensors without enzymes and with enzymes was achieved by aligning them to the obex, landmark blood vessels and by means of the vernier scale of the manipulator. Using the mark-2 sensor, changes in adenosine and inosine levels in the VLM that includes the rostral ventral respiratory group as well as Bötzinger and Pre-Bötzinger complexes (stereotaxic co-ordinates: 1.0-2.5 mm rostral to the obex, 1.5-2.0 mm lateral to the midline and 2.6-3.0 mm ventral from the dorsal surface of the medulla oblongata (Paxinos & Watson, 1998)) were determined. The sensitive part of the probe was lowered 2.6-3.0 mm below the dorsal surface of the brainstem. Once the sensor was placed, a period of at least 30 min was allowed until a steady baseline was obtained.
Figure 1. Histological identification of the mark-2 sensor placement in the caudal nucleus tractus solitarii (A) and rostral ventrolateral medulla (B).

4V, fourth ventricle; 12, hypoglossal nucleus; Amb, ambiguus nucleus; LPGi, lateral paragigantocellular nucleus; NTS, nucleus tractus solitarii; RVLM, rostral ventrolateral medulla; sp5, spinal trigeminal tract. Arrow indicates track of the sensor.
Figure 2. Changes in adenosine and inosine levels in the nucleus tractus solitarii in response to acute systemic hypoxia in anaesthetised rats.
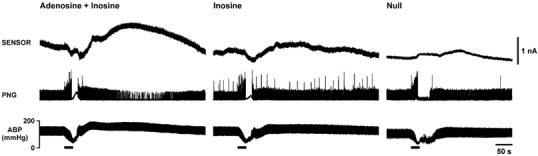
Hypoxia-induced changes in adenosine + inosine (measured by the mark-2 sensor, sensitive to adenosine and inosine; left panel) and inosine (measured by the mark-2 sensor, sensitive to inosine; middle panel) levels in the commissural nucleus tractus solitarii are presented as raw data obtained from the same rat. Right panel shows the small signal recorded during hypoxia by a null sensor placed in the NTS of another rat. Hypoxia was induced by ventilating the animal with 100 % nitrogen. Here and in subsequent figures, horizontal bars indicate duration of hypoxia; PNG, phrenic neurogram; ABP, arterial blood pressure. Signal recorded by the sensor sensitive to adenosine and inosine was markedly greater compared to signal recorded by the sensor sensitive to inosine and was observed during reoxygenation, after termination of the hypoxic stimulus.
To induce fast respiratory depression and apnoea, acute hypoxia was induced by ventilating the animal with 100 % nitrogen for 20–60 s The stimulus was terminated once hypoxic apnoea had been observed. Although, this experimental protocol may be too rapid for a full expression of the chemoreflex (the initial increase in blood pressure due to peripheral chemoreceptor activation is not observed), it was chosen as the high sensitivity and fast response times of the purine biosensors (see companion paper, Dale et al. 2002a) allowed us to determine precisely whether or not an increase in purine concentration in the NTS or VLM preceded the onset of the hypoxia-induced respiratory depression. The other experimental protocols, for example those that include exposure of animals to 5–10 % oxygen in the inspired air, were considered not entirely appropriate for this study. Under those conditions respiratory depression occurs relatively slowly (over several minutes, see for example Richter et al. 1999), and potential accumulation of adenosine over time would make it difficult to conclude whether or not adenosine release played a primary role in hypoxia-induced respiratory depression.
Adenosine may be formed extracellularly from ATP through adenosine triphosphatase and ecto-5′-nucleotidase enzymatic actions (Phillis & Wu, 1981; Zimmermann, 1996). To determine whether purines that appear on the dorsal surface of the brainstem during hypoxia (measured with the mark-1 sensor) are derived from the extracellular breakdown of ATP we used an inhibitor of the ecto-5′-nucleotidase α,β-methylene ADP. When levels of all variables had returned to baseline after hypoxia, α,β-methylene ADP (200 μM) was added to the aCSF and superfused over the dorsal surface of the brainstem. After 20 min, changes in purine levels on the dorsal surface of the brainstem during hypoxia were determined again. The α,β-methylene ADP was then washed out with aCSF and systemic hypoxia was repeated.
At the end of the experiment, rats were perfused transcardially with saline followed by 4 % paraformaldehyde solution, brains were removed, and recording sites of the mark-2 sensor in the NTS and VLM were identified histologically and mapped using a stereotaxic atlas (Paxinos & Watson, 1998). Histological analysis of the mark-2 sensor locations confirmed that all recording sites were within the targeted regions of the NTS or VLM (Fig. 1).
To investigate whether adenosine acting on the dorsal surface is capable of causing respiratory depression, 100 μM adenosine (Sigma, Poole, UK) solution was applied on the dorsal surface of the medulla oblongata of rats ventilated with a mixture of 21 % oxygen and 79 % nitrogen. The effect of adenosine application on the phrenic nerve activity and ABP was determined.
Data analysis
Records were analysed using Spike2 software (Cambridge Electronic Design, Cambridge, UK). Changes in purine levels are presented as raw data and means ±s.e.m. of peak (μM) and integral (μM s) increases in adenosine + inosine and inosine concentrations. Groups were compared using Student's t test or one-way analysis of variance followed by the post hoc Bonferroni's multiple comparison test. A value of P < 0.05 was considered to be significant.
RESULTS
Specificity of the sensors
Electrochemical sensors are prone to non-specific detection of electroactive species. Therefore with both mark-1 and mark-2 sensors we performed a series of controls to test the dependence of signals recorded during and following systemic hypoxia on the presence of enzymes within the sensor. The data described below indicate that in both mark-1 and mark-2 probes the presence of enzymes in the sensors gave a large increase in the recorded signals strongly suggesting that the vast majority of the signal was due to an increase in purine concentration in the area surrounding the sensor.
Responses to acute systemic hypoxia
Before systemic hypoxia the baseline frequency of the phrenic nerve bursts was 36.0 ± 1.4 bursts min−1 (n= 60), and the baseline mean ABP was 91.8 ± 1.2 mmHg (n= 60). Acute systemic hypoxia (0 % oxygen, 100 % nitrogen) resulted in a fall in ABP and initial increase in the amplitude and/or frequency of the phrenic nerve bursts (Figs 2, 3 and 5). This was followed by a hypoxic ventilatory depression, which in all cases progressed to complete respiratory arrest (Figs 2, 3 and 5). Following termination of the hypoxic challenge, several minutes after the beginning of reoxygenation, secondary slowing of the respiratory rhythm was in some cases observed (Fig. 2, left panel; Fig. 3).
Figure 3. Changes in adenosine levels in the nucleus tractus solitarii (NTS) and ventral lateral medulla (VLM) in response to acute systemic hypoxia in anaesthetised rats.
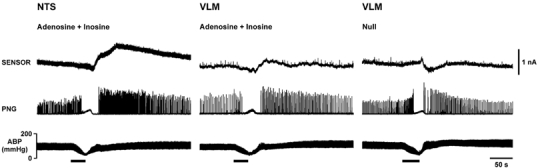
Hypoxia-induced changes in adenosine + inosine (measured by the mark-2 sensor, sensitive to adenosine and inosine) levels in the NTS (left panel) and VLM (middle panel) are presented as raw data obtained from the same rat. Right panel shows the signal recorded by a null sensor in the VLM in the same rat for comparison. Hypoxia was induced by ventilating the animal with 100 % nitrogen. Sensor sensitive to adenosine and inosine recorded a larger purine signal in the NTS compared to the VLM.
Figure 5. Changes in adenosine and inosine levels on the dorsal surface of the medulla oblongata in response to acute systemic hypoxia before and after application of ecto-5′-nucleotidase inhibitor α,β-methylene ADP.
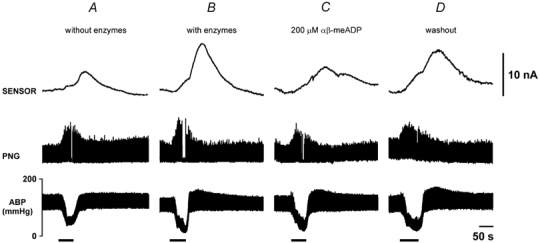
Hypoxia-induced changes in adenosine + inosine (measured by the mark-1 sensor, sensitive to adenosine and inosine) levels on the dorsal surface of the medulla oblongata are presented as raw data obtained in one experiment on the same rat. Hypoxia was induced by ventilating the animal with 100 % nitrogen. A, when no enzymes were loaded on the sensor, the probe recorded only a small signal following systemic hypoxia. B, a much larger signal in response to hypoxia was recorded when sensor was loaded with adenosine deaminase, nucleoside phosphorylase, and xanthine oxidase. C, the amplitude of the sensor signal evoked by hypoxia was reduced by α,β-methylene ADP to 30 % of the control value, and the response recovered after α,β-methylene ADP was washed out (D). α,β-Methylene ADP had no effect on the respiratory and cardiovascular responses evoked by hypoxia.
Measurements from within the NTS and VLM
To test the selectivity of the mark-2 microelectrode sensor we used ‘null’ sensors that lacked any enzymes in the polymer coating to investigate the possibility that some other electroactive interferents could be released during hypoxia. The null sensors failed to record significant signals either in the NTS or in the VLM in response to systemic hypoxia (Fig. 2 and Fig. 3). Both the null and purine-sensitive sensors often exhibited a small negative shift around the onset of hypoxia (Fig. 2 and Fig. 3). This was probably due to changes in PO2 in the neighbourhood of the sensor, which consists of a platinum (Pt) wire polarised to 500 mV and exhibits some intrinsic O2 sensitivity. Such shifts have been reported with the mark-1 sensor during hypoxia in vitro and are greatly diminished in differential recordings (Dale et al. 2000). We therefore do not interpret this negative shift as a fall in purine concentration.
In the commissural NTS we recorded a slow and delayed signal in sensors sensitive to adenosine and inosine in response to acute hypoxia (Fig. 2) that had mean amplitudes of 4.8 ± 1.6 μM (n= 4) and 2.6 ± 0.4 μM (n= 6) in recordings made 0.3 mm caudal and 0.2 mm rostral to the obex, respectively (Fig. 4A). The signals returned to baseline slowly over a period of up to 10 min (Fig. 2 and Fig. 3). In this part of the NTS, significantly lower peak concentrations of purines were recorded by sensors sensitive to inosine only (Fig. 2). In recordings made 0.3 mm caudal and 0.2 mm rostral to the obex, mean peak changes in inosine concentration were 1.0 ± 1.0 μM (n= 4, P < 0.05 compared to adenosine + inosine) and 1.1 ± 0.5 μM (n= 4, P < 0.05 compared to adenosine + inosine), respectively (Fig. 4A). There were no significant differences between the peak purine concentrations recorded from the rostral part of the NTS (0.7 and 1.2 mm rostral from obex) by sensors sensitive to adenosine + inosine and sensors sensitive to inosine only (Fig. 4A). The increase in sensor signal was always observed after termination of the hypoxic stimulus during the period of reoxygenation irrespective of whether the sensor was sensitive to adenosine and inosine or inosine only (Fig. 2 and Fig. 3). Interestingly, there were no significant differences in the overall changes in purine release (as measured by the integral of the sensor signal) recorded at all positions along the rostro-caudal axis of the NTS by sensors sensitive to adenosine + inosine and inosine (Fig. 4B). This suggests that although adenosine levels may transiently exceed those of inosine in the NTS in response to systemic hypoxia, most of the released adenosine is converted eventually to inosine.
Figure 4. Changes in adenosine and inosine levels along the rostro-caudal axis of the nucleus tractus solitarii and in the ventral lateral medulla (VLM) in response to acute systemic hypoxia in anaesthetised rats.

Hypoxia-induced changes in adenosine + inosine (measured by the mark-2 sensor, sensitive to adenosine and inosine; filled bars) and inosine (measured by the mark-2 sensor, sensitive to inosine; open bars) levels (peak concentration in A and integral of response in B) in the nucleus tractus solitarii and VLM are presented as means ±s.e.m. Hypoxia was induced by ventilating the animal with 100 % nitrogen. At the obex level, peak concentration of purines recorded by the sensor sensitive to adenosine and inosine was significantly greater compared to that recorded by the sensor sensitive to inosine. * Significant difference, P < 0.05. Numbers in parentheses indicate sample sizes.
Only moderate increases in sensor signal in response to systemic hypoxia were observed when the sensor was placed in the VLM areas (Fig. 3). There was no difference in the changes in purine concentrations following systemic hypoxia between targeted regions of the VLM. Therefore, the data obtained in experiments with measurements taken from different parts of the VLM were combined and analysed together (Fig. 4). The peak increases in purine levels in the VLM recorded by sensors sensitive to adenosine + inosine and inosine only were 0.5 ± 0.1 μM (n= 17) and 0.8 ± 0.7 μM (n= 3), respectively (Fig. 4A). However, since the duration of the responses was short, the overall (integral) changes in purine concentrations in the VLM evoked by hypoxia were negligible (Fig. 4B).
Measurement from the dorsal surface of the medulla oblongata
In the experiments with the mark-1 probe, we observed only modest changes in sensor signal in response to systemic hypoxia when enzymes were not loaded (0.92 ± 0.70 nA, n= 5; Fig. 5A). To compare these signals with those recorded in the presence of the enzymes, the probe was lifted from the brainstem surface, loaded with the enzymes and returned to the same place. Following the loading of enzymes into the sensor, so that it became sensitive to adenosine and inosine, a considerably larger signal was observed following systemic hypoxia (8.1 ± 1.6 nA, n= 7, Fig. 5B). To test whether the sensor specifically measured adenosine release we examined the effects of blocking the first enzyme of the detection cascade, adenosine deaminase, by adding coformycin to the aCSF (Dale, 1998; Dale et al. 2000). However, addition of coformycin (1 μM) to the aCSF did not affect the observed increases in the probe signal in response to systemic hypoxia (n= 2; data not shown). This suggests that although the sensor was detecting purines, the contribution to the signal by adenosine was very small or absent. Indeed the signal detected in the second sensor barrel, which lacked adenosine deaminase, was qualitatively very similar (data not shown). Thus, on the dorsal surface of the medulla oblongata an increase in concentration of inosine rather than of adenosine itself occurs.
In all animals systemic hypoxia led to a marked increase in the purine concentration recorded by the mark-1 sensor on the dorsal surface of the medulla oblongata (n= 7, Fig. 5B). The purine level started to rise immediately on ventilating the animals with 100 % nitrogen, reaching a peak after the termination of the hypoxic stimulus. This contrasts with the recordings made within the NTS and VLM where the rise in purine levels was delayed with respect to the onset of hypoxia. Nevertheless, the maximal release of purines at the dorsal surface of the medulla oblongata also occurred after the onset of hypoxic ventilatory depression (Fig. 5B) to reach a peak current that approximated to a mean increase in purine production of 8 ± 2 μM (n= 7).
Although addition of α,β-methylene ADP to the aCSF had no effect on the change in ABP or the respiratory depression, it reduced the total purine signal during hypoxia to 30 ± 13 % of the response before the drug (P < 0.05, n= 7; Fig. 5C). Following prolonged washing, partial recovery of the purine signal was observed (84 ± 22 % of the control response, not significantly different from control, n= 5, Fig. 5D), suggesting that purines recorded on the dorsal surface of the medulla oblongata arise from the breakdown of ATP by ecto-enzymes.
Effect of adenosine applied on the dorsal surface of the medulla oblongata on the activity of the phrenic nerve
Application of adenosine (100 μM, 200 μl) to the dorsal surface of the medulla oblongata resulted in a short-term decrease in the frequency and amplitude of the phrenic bursts (Fig. 6) and in some cases (4 out of 12 rats) also resulted in a small decrease in ABP. Thirty seconds after application of adenosine the frequency of the respiratory bursts was 24 ± 3 bursts min−1 (n= 12), which was significantly lower compared to that after application of saline (32 ± 3 bursts min−1, n= 12, P < 0.05; Fig. 6B).
Figure 6. Effect of adenosine, applied on the dorsal surface of the medulla oblongata, on phrenic nerve discharge and arterial blood pressure in anaesthetised rats.
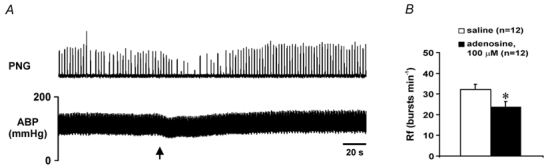
A, raw data illustrating changes in the phrenic nerve activity and arterial blood pressure after application of adenosine (100 μM, 200 μl) on the dorsal surface of the medulla oblongata. Arrow indicates time of application. B, means ±s.e.m. (in bursts min−1) of the respiratory frequency (Rf) 30 s after application of adenosine or saline on the dorsal surface of the medulla oblongata. * Significant difference, P < 0.05.
DISCUSSION
The goal of the present study was to investigate the precise time course of adenosine release in the NTS, and in the VLM, using an enzyme-based amperometric sensor during acute systemic hypoxia in the anaesthetised rat. It was found that acute hypoxia induced a significant increase in adenosine level in the NTS and a much smaller increase in adenosine level in the VLM (only about 10 % of that in the NTS). Importantly, an increase in adenosine level in the NTS or VLM occurred during reoxygenation after termination of the hypoxic challenge. At the dorsal surface of the brainstem, only release of inosine (most likely produced from adenosine that was generated in the extracellular space from ATP) was detected in response to acute systemic hypoxia. Inosine concentration on the dorsal surface of the medulla oblongata started to rise immediately after the onset of hypoxia, reaching a maximal concentration after the termination of the hypoxic stimulus. These data indicate that following systemic hypoxia the level of adenosine significantly increases in the NTS and to a markedly lesser extent in the VLM. However, the timing of these increases in adenosine concentration within both of these structures makes it unlikely that adenosine is responsible for the hypoxia-induced depression of respiration. Interestingly, the magnitude of purine release recorded at the surface was greater than that recorded within the NTS. This makes it likely that additional structures contribute to the increase in purines recorded at the brainstem surface.
Purine release during hypoxia
This study extends further the application of the enzyme-based amperometric sensor which has been previously used with frog embryo spinal cord (Dale, 1998) and hippocampal brain slices in vitro (Dale et al. 2000; Pearson et al. 2001). In this study the original mark-1 sensor was used to measure changes in purine (adenosine and inosine) concentrations on the dorsal surface of the medulla oblongata and the recently developed mark-2 sensor was used to measure changes in purine concentration within the NTS or VLM.
In both the mark-1 and mark-2 probes the presence of enzymes in the sensors gave a large increase in the recorded signals, strongly suggesting that the vast majority of the signal was due to an increase in purine concentration in the area surrounding the sensor. It is unlikely that changes in the brain blood flow during hypoxia affect the sensor signal. Firstly, levels of adenosine in the blood are very low and therefore any contribution of blood-borne adenosine to the total amount measured by the sensor placed in the brainstem would be small. Secondly, as discussed in the companion paper (Dale et al. 2002a), changes in blood pressure per se are unlikely to have a non-specific effect on the sensor signal. On the other hand it is likely that PO2 level in the area surrounding the sensor could decrease significantly during systemic hypoxia. Since the probes are sensitive to oxygen this would result in the negative shift in the sensor signal (seen in the sensor trace). However, this will not affect the ability of the sensor to detect changes in purine concentration.
In the area of the commissural NTS, a significantly higher peak concentration of purines was recorded by the mark-2 sensor sensitive to both adenosine and inosine compared to that recorded by the sensor sensitive to inosine only. However, there were no significant differences in the overall (integral) changes in purine concentration recorded at all positions along the rostro-caudal axis of the NTS by a sensor sensitive to both adenosine and inosine and a sensor sensitive to inosine only. These data suggest that the concentrations of both adenosine and inosine increase in the NTS in response to systemic hypoxia and that most of the released adenosine is converted to inosine. Interestingly, although hypoxia is a ‘global’ signal, the amount of adenosine released during this stimulus was less than that seen in the NTS during the hypothalamically evoked defence response (see companion paper, Dale et al. 2002a).
In experiments using the mark-1 sensor we have found that the adenosine deaminase inhibitor coformycin did not alter the changes in the sensor signal during hypoxia, indicating that the sensor was mainly measuring changes in the levels of inosine, the breakdown product of adenosine, rather than of adenosine itself. Reversible attenuation of the recorded signal by ecto-5′-nucleotidase inhibitor α,β-methylene ADP indicates that this signal represents the accumulation of inosine, the breakdown product of adenosine that is, in turn, produced from extracellular ATP.
We hypothesised initially that the measurements on the surface of the brainstem would monitor, albeit indirectly, purine release occurring in subsurface structures including the NTS. However, the data obtained suggest that even if the NTS-derived inosine contributes to the signal recorded on the dorsal surface, inosine from other sources also appears during hypoxia. Indeed, in recordings made from within the NTS an increase in adenosine concentration was seen only after termination of the hypoxic stimulus (during the period of reoxygenation), while in recordings made on the dorsal surface of the medulla oblongata an increase in purine concentration was observed immediately after the onset of the hypoxic period.
This temporal difference is unlikely to be due to the differences in sensitivity or the response times of the mark-1 and mark-2 sensors, i.e. that the mark-2 sensor responds to the changes in purine concentration with a significant delay. Firstly, the mark-2 sensor has a 10–90 % response time of ≈2 s (Llaudet et al. 2002), about an order of magnitude faster than the mark-1 sensor. Thus, the mark-2 sensor will determine more accurately the dynamics of adenosine accumulation in the area surrounding the sensor than the mark-1. Secondly, using the mark-2 sensor we observed a fast and immediate increase in NTS adenosine concentration following hypothalamic stimulation (see companion paper, Dale et al. 2002a), indicating that the sensor responds quickly to the changes in local purine concentration in vivo. Clearly, the early signal recorded with the mark-1 sensor represents an increase in concentration of inosine on the dorsal surface that must be derived from a source other than NTS. Also, while an increase in inosine level was observed on the dorsal surface, within the NTS itself the peak increase in adenosine concentration was significantly higher compared to the peak increase in inosine level. This suggests that if adenosine released within the NTS contributes to the signal recorded on the dorsal surface it must be broken down to inosine as it diffuses from the NTS. This possibility is supported by the evidence that adenosine is rapidly broken down within the extracellular space and the NTS has high levels of the enzyme adenosine deaminase (Lawrence et al. 1998).
Adenosine and the response to acute systemic hypoxia
Abundant evidence suggests that adenosine may contribute to depression of neuronal excitability and synaptic interactions between medullary respiratory neurones which underlines hypoxic ventilatory depression and apnoea (Eldridge et al. 1985; Runold et al. 1989; Thomas & Marshall, 1994; Schmidt et al. 1995; Mironov et al. 1999; Johansson et al. 2001). Since hypoxia results in elevation of adenosine concentration in the extracellular space of the brain tissue (Rubio et al. 1975; Winn et al. 1981; Zetterstrom et al. 1982; Schubert et al. 1994; Richter et al. 1999) it would be reasonable to assume that during hypoxia, release and accumulation of adenosine within the areas of the brainstem responsible for generation of the respiratory activity might lead to hypoxic ventilatory depression and apnoea. Indeed, our own results with application of adenosine on the dorsal surface confirm that adenosine in this area of the brainstem can depress respiration. Rises in adenosine levels during hypoxia have been recorded by microdialysis within the NTS of piglets (Yan et al. 1995) and within the ventral respiratory group of neurones in the cat (Richter et al. 1999). Nevertheless in vivo microdialysis offers only limited temporal resolution leaving open the issue of whether endogenous adenosine is produced sufficiently early to mediate respiratory depression. Our new studies, using enzyme-based amperometric sensors, offer a more precise determination of the time course of hypoxia-induced changes in adenosine concentration in these areas of the medulla oblongata as well as on its dorsal surface and are thus an important contribution to this debate.
The principal findings of the present study were quite unexpected in two aspects. Firstly, significant increases in adenosine concentration in response to acute systemic hypoxia were observed only in the NTS supporting the observation of Yan et al. (1995). Only very small changes in adenosine concentration in response to hypoxia were recorded in the caudal or rostral VLM. This differs from the results obtained by Richter et al. (1999). It seems unlikely that the difference between our data and those of Richter et al. (1999) is related to the differences in the animal species used (i.e. cats vs. rats). In the study of Richter et al. (1999) the duration of the hypoxic period was much longer than that in our study. A longer period of hypoxia could conceivably induce a much larger increase in adenosine concentration within the VLM. However, our preliminary experiments indicate that the enzyme-based amperometric sensor fails to detect substantial purine release within the VLM irrespective of the duration of the hypoxic stimulus (A. V. Gourine, E. Llaudet, N. Dale & K. M. Spyer, unpublished observations). Interestingly, the amplitude of the changes in adenosine concentration in the VLM observed by Richter et al. (1999) was very similar to that recorded in our study using the mark-2 sensor in the NTS. Indeed, similar to our data, Richter et al. (1999) have shown that adenosine concentration in the VLM reaches its peak of 3.3 ± 0.9 μM (compared to 2–5 μM in the NTS in this study) after the onset of the hypoxic ventilatory depression during the period of reoxygenation. Considering that the VLM was approached from the dorsal surface and the large diameter of the microdialysis probe that was used, the increase in adenosine concentration observed in the VLM by Richter et al. (1999) might have been due to the leakage of adenosine from the dorsal areas of the medulla along the track of the probe.
The second aspect of our results that was unexpected was that the timing of adenosine release within the NTS was too late to underlie respiratory depression. Indeed, despite the ability of exogenous adenosine to depress the activity of the respiratory circuits, endogenous adenosine was released in greatest quantities as the respiratory pattern generator recovered from depression and was activated. Our conclusions therefore support those of Richter et al. (1999) that even if adenosine contributes to the sustained depression of respiration during prolonged hypoxia, its action in the NTS alone cannot explain hypoxic apnoea. Given that far smaller levels of adenosine were recorded in the VLM, it seems unlikely that adenosine production in this area contributes to respiratory depression either.
On the other hand, when measurements were taken from the dorsal surface of the medulla oblongata the purine (inosine) level, derived from extracellular breakdown of ATP, was observed to rise almost immediately after the onset of hypoxia, and before ventilatory depression had begun. This might suggest that adenosine could be produced in an as yet unidentified part of the dorsal brainstem with timing that is sufficient to evoke respiratory depression. This is supported by the ability of adenosine applied to the dorsal surface of the medulla oblongata to induce respiratory depression. However, while the production of inosine at the brainstem surface during hypoxia was markedly reduced by application of α,β-methylene ADP, the cardiovascular and respiratory responses evoked by hypoxia were unaffected. This is the opposite of what would be expected if endogenous adenosine (the precursor to inosine observed at the surface) were to mediate respiratory depression. The simplest conclusion is therefore that endogenously-released adenosine in the dorsal brainstem does not contribute to hypoxia-induced ventilatory depression.
In retrospect, the hypothesis that adenosine action alone may be responsible for the respiratory depression and apnoea induced by severe hypoxia appears naive. On balance, the generalised decline in membrane permeability or ‘channel arrest’ due to the lack of oxygen (for review, see Hochachka & Lutz, 2001) would be expected to have a much more profound effect on the activity of respiratory neurones and, therefore, on the whole respiratory network compared to the action of adenosine. However, there is overwhelming evidence that adenosine plays a neuroprotective role during hypoxia/ischaemia (for review, see de Mendonca et al. 2000). The marked increase in adenosine concentration that we observed following the termination of the hypoxic episode could therefore serve such a role in the brainstem. It is also possible that the delayed elevated levels of adenosine in these areas of the brainstem may be responsible for the secondary slowing of the respiratory rhythm, which in our preparation sometimes occurred following termination of the hypoxic challenge, several minutes after the beginning of reoxygenation. Indeed, the timing of the increase in adenosine concentration in the NTS is consistent with this idea but additional studies are needed in order to test this hypothesis as well as to investigate potential mechanisms of this late adenosine release in the dorsal brainstem following systemic hypoxia.
In conclusion, this study illustrates the usefulness of the enzyme-based amperometric sensor for making direct on-line measurements of purine release during hypoxia from the central nervous system structures in vivo. Successful application of this sensor for in vivo use allowed us to investigate the precise time course of hypoxia-induced changes in adenosine concentration within the NTS and VLM. The results indicate that following systemic hypoxia the level of adenosine increases in the NTS and to a significantly lesser extent in the VLM and that these increases are unlikely to be responsible for the hypoxia-induced depression of respiratory activity.
Acknowledgments
We thank the BBSRC, British Heart Foundation, Cunningham Trust, The Royal Society and the Wellcome Trust for financial support.
REFERENCES
- Bisserbe JC, Patel J, Marangos PJ. Autoradiographic localization of adenosine uptake sites in the brain using [3H]nitrobenzylthioinosine. Journal of Neuroscience. 1985;5:544–550. doi: 10.1523/JNEUROSCI.05-02-00544.1985. [DOI] [PMC free article] [PubMed] [Google Scholar]
- Chau A, Koos BJ. Metabolic and cardiorespiratory responses to hypoxia in fetal sheep: adenosine receptor blockade. American Journal of Physiology. 1999;276:R1805–1811. doi: 10.1152/ajpregu.1999.276.6.R1805. [DOI] [PubMed] [Google Scholar]
- Dale N. Delayed production of adenosine underlies temporal modulation of swimming in frog embryo. Journal of Physiology. 1998;511:265–272. doi: 10.1111/j.1469-7793.1998.265bi.x. [DOI] [PMC free article] [PubMed] [Google Scholar]
- Dale N, Gourine AV, Llaudet E, Bulmer D, Thomas T, Spyer KM. Rapid adenosine release in the nucleus tractus solitarii during defence response in rats: real-time measurement in vivo. Journal of Physiology. 2002a;544:149–160. doi: 10.1113/jphysiol.2002.024158. [DOI] [PMC free article] [PubMed] [Google Scholar]
- Dale N, Gourine AV, Thomas T, Llaudet E, Spyer KM. Adenosine release in the nucleus of the solitary tract during hypothalamic stimulation and hypoxia in anaesthetised rats. Journal of Physiology. 2002b;539:105P. [Google Scholar]
- Dale N, Pearson T, Frenguelli BG. Direct measurement of adenosine release during hypoxia in the CA1 region of the rat hippocampal slice. Journal of Physiology. 2000;526:143–155. doi: 10.1111/j.1469-7793.2000.00143.x. [DOI] [PMC free article] [PubMed] [Google Scholar]
- De Mendonca A, Sebastiao AM, Ribeiro JA. Adenosine: does it have a neuroprotective role after all? Brain Research Reviews. 2000;33:258–274. doi: 10.1016/s0165-0173(00)00033-3. [DOI] [PubMed] [Google Scholar]
- Hochachka PW, LutZ PL. Mechanism, origin, and evolution of anoxia tolerance in animals. Comparative Biochemistry and Physiology B - Biochemistry and Molecular Biology. 2001;130:435–459. doi: 10.1016/s1096-4959(01)00408-0. [DOI] [PubMed] [Google Scholar]
- Johansson B, Halldner L, Dunwiddie TV, Masino SA, Poelchen W, GimeneZ-Llort L, Escorihuela RM, FernandeZ-Teruel A, Wiesenfeld-Hallin Z, Xu XJ, Hardemark A, BetsholtZ C, Herlenius E, Fredholm BB. Hyperalgesia, anxiety, and decreased hypoxic neuroprotection in mice lacking the adenosine A1 receptor. Proceedings of the National Academy of Sciences of the USA. 2001;98:9407–9412. doi: 10.1073/pnas.161292398. [DOI] [PMC free article] [PubMed] [Google Scholar]
- Lawrence AJ, Castillo-MelendeZ M, McLean KJ, Jarrott B. The distribution of nitric oxide synthase-, adenosine deaminase- and neuropeptide Y-immunoreactivity through the entire rat nucleus tractus solitarius: Effect of unilateral nodose ganglionectomy. Journal of Chemical Neuroanatomy. 1998;15:27–40. doi: 10.1016/s0891-0618(98)00020-9. [DOI] [PubMed] [Google Scholar]
- Llaudet E, Botting NP, Crayston JA, Dale N. A 3-enzyme sensor for detecting purines from CNS. Biosensors and Bioelectronics. 2002 doi: 10.1016/s0956-5663(02)00106-9. (in the Press) [DOI] [PubMed] [Google Scholar]
- Mironov SL, Langohr K, Richter DW. A1 adenosine receptors modulate respiratory activity of the neonatal mouse via the cAMP-mediated signaling pathway. Journal of Neurophysiology. 1999;81:247–255. doi: 10.1152/jn.1999.81.1.247. [DOI] [PubMed] [Google Scholar]
- Paxinos G, Watson C. The Rat Brain in Stereotaxic Coordinates. London: Academic Press; 1998. [Google Scholar]
- Pearson T, Nuritova F, Caldwell D, Dale N, Frenguelli BG. A depletable pool of adenosine in area CA1 of the rat hippocampus. Journal of Neuroscience. 2001;21:2298–2307. doi: 10.1523/JNEUROSCI.21-07-02298.2001. [DOI] [PMC free article] [PubMed] [Google Scholar]
- Phillis JW, Wu PH. Physiology and Pharmacology of Adenosine Derivatives. New York: Raven; 1981. [Google Scholar]
- Reppert SM, Weaver DR, Stehle JH, Rivkees SA. Molecular cloning and characterization of a rat A1-adenosine receptor that is widely expressed in brain and spinal cord. Molecular Endocrinology. 1991;5:1037–1048. doi: 10.1210/mend-5-8-1037. [DOI] [PubMed] [Google Scholar]
- Richter DW, Bischoff AM, Anders K, Bellingham M, Windhorst U. Response of the medullary respiratory network of the cat to hypoxia. Journal of Physiology. 1991;443:231–256. doi: 10.1113/jphysiol.1991.sp018832. [DOI] [PMC free article] [PubMed] [Google Scholar]
- Richter DW, Schmidt-Garcon P, Pierrefische O, Bischoff AM, Lalley PM. Neurotransmitters and neuromodulators controlling the hypoxic respiratory response in anaesthetised cats. Journal of Physiology. 1999;514:567–578. doi: 10.1111/j.1469-7793.1999.567ae.x. [DOI] [PMC free article] [PubMed] [Google Scholar]
- Rubio R, Berne R, Bockman E, Curnish R. Relationship between adenosine and oxygen supply in rat brain. American Journal of Physiology. 1975;228:1896–1902. doi: 10.1152/ajplegacy.1975.228.6.1896. [DOI] [PubMed] [Google Scholar]
- Runold M, LagercrantZ H, Prabhakar NR, Fredholm BB. Role of adenosine in hypoxic ventilatory depression. Journal of Physiology. 1989;67:541–546. doi: 10.1152/jappl.1989.67.2.541. [DOI] [PubMed] [Google Scholar]
- St Lambert JH, Dashwood MR, Spyer KM. Role of brainstem adenosine A1 receptors in the cardiovascular response to hypothalamic defence area stimulation in the anaesthetised rat. British Journal of Pharmacology. 1996;117:277–282. doi: 10.1111/j.1476-5381.1996.tb15187.x. [DOI] [PMC free article] [PubMed] [Google Scholar]
- Schmidt C, Bellingham MC, Richter DW. Adenosinergic modulation of respiratory neurones and hypoxic responses in the anaesthetized cat. Journal of Physiology. 1995;483:769–781. doi: 10.1113/jphysiol.1995.sp020621. [DOI] [PMC free article] [PubMed] [Google Scholar]
- Schubert P, Rudolph KA, Fredholm BB, Nakamura Y. Modulation of nerve and glial function by adenosine - role in the development of ischemic damage. International Journal of Biochemistry. 1994;26:1227–1236. doi: 10.1016/0020-711x(94)90092-2. [DOI] [PubMed] [Google Scholar]
- Thomas T, Dale N, Spyer KM. Release of adenosine from brainstem structures during hypothalamic stimulation and hypoxia in the anaesthetised rat. Journal of Physiology. 2000a;523:252P. [Google Scholar]
- Thomas T, Marshall JM. Interdependence of respiratory and cardiovascular changes induced by systemic hypoxia in the rat: the roles of adenosine. Journal of Physiology. 1994;480:627–636. doi: 10.1113/jphysiol.1994.sp020389. [DOI] [PMC free article] [PubMed] [Google Scholar]
- Thomas T, st Lambert JH, Dashwood MR, Spyer KM. Localization and action of adenosine A2a receptors in regions of the brainstem important in cardiovascular control. Neuroscience. 2000b;95:513–518. doi: 10.1016/s0306-4522(99)00473-x. [DOI] [PubMed] [Google Scholar]
- Winn HR, Rubio R, Berne RM. Brain adenosine concentration during hypoxia in rats. American Journal of Physiology. 1981;241:H235–242. doi: 10.1152/ajpheart.1981.241.2.H235. [DOI] [PubMed] [Google Scholar]
- Yan S, Laferriere A, Zhang C, Moss IR. Microdialyzed adenosine in nucleus tractus solitarii and ventilatory response to hypoxia in piglets. Journal of Applied Physiology. 1995;79:405–410. doi: 10.1152/jappl.1995.79.2.405. [DOI] [PubMed] [Google Scholar]
- Zetterstrom T, Vernet L, Ungerstedt U, Tossman U, Jonzon B, Fredholm BB. Purine levels in the intact rat brain. Studies with an implanted perfused hollow fibre. Neuroscience Letters. 1982;29:111–115. doi: 10.1016/0304-3940(82)90338-x. [DOI] [PubMed] [Google Scholar]
- Zimmermann H. Biochemistry, localization and functional roles of ecto-nucleotidases in the nervous system. Progress Neurobiology. 1996;49:589–618. doi: 10.1016/0301-0082(96)00026-3. [DOI] [PubMed] [Google Scholar]
- Eldridge FL, Millhorn DE, Kiley JP. Antagonism by theophylline of respiratory inhibition induced by adenosine. Journal of Applied Physiology. 1985;59:1428–1433. doi: 10.1152/jappl.1985.59.5.1428. [DOI] [PubMed] [Google Scholar]
- Melton JE, Neubauer JA, Edelman NH. GABA antagonism reverses hypoxic respiratory depression in the cat. Journal of Applied Physiology. 1990;69:1296–1301. doi: 10.1152/jappl.1990.69.4.1296. [DOI] [PubMed] [Google Scholar]