

Abstract
Sensory organs are specialized to detect and decode stimuli in terms of intensity and quality. In the gustatory system, the process of identifying and distinguishing taste qualities (e.g. bitter versus sweet) begins in taste buds. A central question in gustatory research is how information about taste quality is extracted by taste receptor cells. For instance, whether and how individual taste cells respond to multiple chemical stimuli is still a matter for debate. A recent study showed that taste cells expressing bitter-responsive taste receptors do not also express sweet-responsive taste receptors and vice versa. These results suggest that the gustatory system may use separate cellular pathways to process bitter and sweet signals independently. Results from electrophysiological studies, however, reveal that individual taste receptor cells respond to stimuli representing multiple taste qualities. Here we used non-invasive Ca2+ imaging in slices of lingual tissue containing taste buds to address the issue of quality detection in murine taste receptor cells. We recorded calcium transients elicited by chemical stimuli representing different taste qualities (sweet, salty, sour and bitter). Many receptor cells (38 %) responded to multiple taste qualities, with some taste cells responding to both appetitive (‘sweet’) and aversive (‘bitter’) stimuli. Thus, there appears to be no strict and separate detection of taste qualities by distinct subpopulations of taste cells in peripheral gustatory sensory organs in mice.
The division of gustatory stimuli into basic taste qualities such as sweet, salty and bitter has been described since the period of the early Greek scientists. Humans and many other mammals readily distinguish bitter from sweet, aversive from appetitive taste stimuli. Intuitively, one might expect the gustatory system to use separate cellular mechanisms and pathways to process bitter and sweet signals independently (‘labelled lines’). Indeed, a recent study showed that subpopulations of taste cells that express mRNAs for bitter-responsive (bitter) versus sweet-responsive (sweet) taste receptors do not overlap, in part supporting the concept of labelled lines (Nelson et al. 2001). At odds with the notion of such separate pathways, however, are results from electrophysiological studies showing that individual neurons at several different levels in the gustatory neuraxis – from sensory afferent axons to higher order centres – are activated by taste stimulation with two or more basic qualities (reviewed in Smith & St John, 1999). In the peripheral taste organs, electrophysiological recordings showed that individual taste receptor cells respond to stimuli representing multiple taste qualities (Kimura & Beidler, 1961; Ozeki, 1971; Ozeki & Sato, 1972; Sato & Beidler, 1982, 1997; Tonosaki & Funakoshi, 1984; Gilbertson et al. 2001).
Electrophysiological results on taste cells, however, have raised questions because the recordings require invasive procedures, may involve cell damage, and often yield relatively small sample sizes (for a discussion see Herness, 2000). Several researchers have used functional imaging on isolated taste cells, isolated taste buds or stripped epithelial sheets to overcome these problems (Akabas et al. 1988; Bernhardt et al. 1996; Hayashi et al. 1996; Ogura et al. 1997; Fujiyama et al. 1998; Lyall et al. 2001; Liu & Simon, 2001; Ohtubo et al. 2001), but cellular resolution of signals and restriction of chemical stimulation to the apical chemosensitive tip of taste cells have been serious challenges until now. Here, we have used functional Ca2+ imaging with laser scanning confocal microscopy in a relatively intact preparation of taste buds to investigate how taste quality is detected. We recorded Ca2+ changes in single taste cells in response to focal apical stimulation at the taste pores of taste buds in thick slices of mouse lingual epithelium containing vallate papillae.
METHODS
All experimental protocols were approved by the University of Miami Care and Use Committee and procedures have been described in detail elsewhere (Caicedo et al. 2000). Mice (46 DBA/2J and 10 C57BL/6B mice, ≈8 weeks old) were killed by exposure to a rising concentration of CO2, followed by cervical dislocation. Tongues were removed and immersed in cold (4 °C) Tyrode solution (mm: 130 NaCl, 5 KCl, 8 CaCl2, 1 MgCl2, 10 Hepes, 10 glucose, 10 sodium pyruvate, 5 NaHCO3, pH 7.4, 300-310 mosmol kg−1). The osmolality of the bathing solution was measured before the experiments. Calcium Green-1 dextran (CaGD; MW 3000, Kd = 259 nm; Molecular Probes, Eugene, OR, USA) was injected iontophoretically (1 mm in H2O, −3.5 μA, 10 min) through a glass micropipette (40 μm tip) into the vallate papillae. Next, the tongues were sliced (150 μm) on a vibroslicer (Campden Instruments, Leicester, UK). CaGD-loaded taste cells in tongue slices were excited at 488 nm using an argon laser attached to an Olympus Fluoview scanning confocal microscope. Confocal images were collected and changes in CaGD fluorescence over time were then analysed off-line using Fluoview software (Olympus America Inc., Melville, NY, USA). Solutions bathing the slices were maintained at 30 °C.
Individual taste receptor cells, their apical and basal processes, and their cell bodies were readily distinguished (see Fig 1). We measured the mean intensity of CaGD fluorescence in cell bodies of single taste cells at 2.5 s intervals. Fluorometric signals are expressed as relative fluorescence change: ΔF/F = (F – F0)/F0. Using ΔF/F corrects for variations of baseline fluorescence, cell thickness, total dye concentration and illumination (Helmchen, 2000). We avoided measuring responses from cells with extreme ranges of resting fluorescence (F0), either near-saturating or threshold levels for the photodetector. Peak ΔF/F constituted the response amplitude. Our criteria for accepting Ca2+ responses included: (1) that responses were consistent over time (could be elicited ≥ 2 times in the same cell by the same stimulus), and (2) that the peak ΔF/F was ≥ 2 times baseline ΔF/F fluctuation. Records were examined off-line independently and blindly by three investigators to categorize responses. Only Ca2+ transients that were scored as a response by all three researchers were included in our results. In some cases, we observed reductions in ΔF/F in response to NaCl and sucrose, possibly representing a decrease in intracellular Ca2+. Although these signals might represent bona fide cellular responses, we did not score these changes as responses because they were neither repeatable nor concentration dependent. The above stringent criteria led to a conservative estimate for the chemosensitivity range of taste cells and may underestimate the true breadth of chemical responsiveness of individual taste cells.
Figure 1. Ca2+ response to local apical stimulation with the bitter compound quinine.
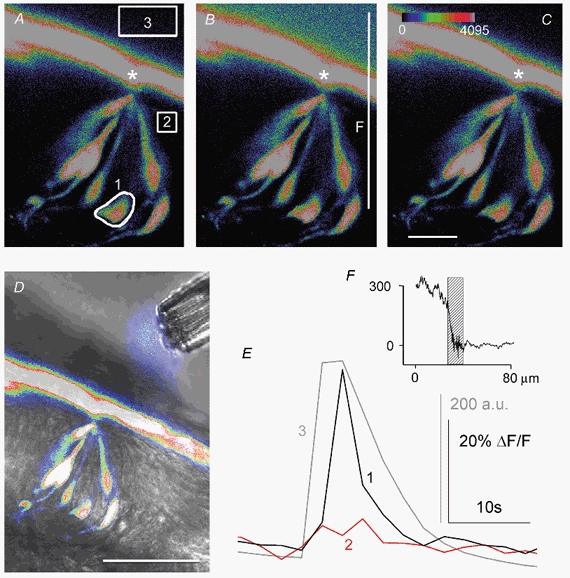
A-C, three sequential confocal images of a lingual slice showing seven individual taste cells loaded with Calcium Green-1 dextran (CaGD) in a vallate taste bud. The regions selected for fluorescence measurements are outlined (1-3). Only one cell (1) responded to the stimulus, with maximum ΔF/F occurring in the image in B. Fluorescein (2 μM) was included in the quinine solution to monitor stimulus application and concentration near the taste pore (outline 3, A). Apical processes extend to and converge at the taste pore (*). Scale bar, 20 μm; colour palette shows the pixel intensity mapping (range: 0-4095, 12-bit data). D, superimposed fluorescence and transmitted light image of the multi-barrelled pipette during focal apical stimulation showing the onset of quinine stimulation (fluorescence at tip of pipette). Scale bar, 50 μm. E, quantitative fluorescence changes for the experiment shown in A-C. Focal application of quinine (3) elicited a rapid response in one taste cell (1). Traces 1-3 correspond to the regions outlined in A. a.u., arbitrary units of pixel intensity. F, the stimulus gradient between the bath solution and interstitial tissue adjacent to the taste bud shows that chemical stimuli do not penetrate into the lingual tissue. The fluorescence intensity of the fluorescein (in quinine solution) measured along the vertical line shown in B (F) was taken before (A) and at the peak (B) of the stimulus. The difference (B minus A) is shown in F. Hatched bar: layer of fluorescent CaGD adhering to the surface of the epithelium (grey layer in A-D).
The setup for local apical stimulation at the taste pore was adapted from Stevens et al. (2001). We used multi-barrelled pipettes (7 barrels; total tip diameter, 30-50 μm; Fig. 1) filled with different chemical solutions as stimuli. Solutions were ejected under pressure (picospritzer; General Valve Corporation, Fairfield, NJ, USA). The bathing solution superfused the preparation countercurrent to the focal application such that the stimulation solutions did not flow over the exposed tissue surfaces. In this way, focal stimulation was limited to taste bud pores and to the apical chemosensitive tips of taste receptor cells.
All stimulation solutions contained 2 μM fluorescein (Fig. 1) or 100 μM lucifer yellow (for citric acid) to monitor stimulus application, duration and concentration. Calibration tests showed that the fluorescence intensity in the stimulation solution varied linearly with the stimulus concentration. This was determined by plotting the fluorescence of solutions versus stimulus concentration at progressively higher stimulus dilutions. To estimate stimulus concentrations applied to the taste cells during the experiment, we measured the fluorescence intensity of the stimulation solution at the taste pore (see Fig. 1) using the calibrations established by the aforementioned procedure. Fluorescence was calibrated for all stimulation solutions before each experiment.
With focal apical stimulation, we were able to stimulate taste cells in a physiologically appropriate manner with chemical solutions representing multiple taste qualities and at concentrations that elicit behavioural responses in mice. For convenience and simplicity, and in keeping with the convention in the literature, we used the human psychophysical characterizations such as ‘bitter’, ‘sweet’, ‘salty’ etc. to describe the taste stimuli applied to mouse taste buds. The stimuli used were: quinine-HCl and cycloheximide (bitter); sodium saccharin and sucrose (sweet); NaCl and monosodium glutamate (salty); and citric acid (sour). Monosodium glutamate was also tested as an umami stimulus. However, under the conditions of our experiments, we observed no differences between responses to NaCl and monosodium glutamate. Thus we have included monosodium glutamate responses in the category salty. All chemicals used as stimuli were dissolved in Tyrode solution without adjusting for osmolality. The stimulus concentrations in the multi-barrelled pipette barrels were: quinine-HCl (quinine), 5 mm; cycloheximide, 100 μM; sodium saccharin (saccharin), 50 mm; sucrose, 500 mm; NaCl, 500 mm; monosodium glutamate, 500 mm; and citric acid, 50 mm. (NaCl was added to the 130 mm present in the Tyrode solution to give a final concentration of 500 mm.) The stimulus concentration at the taste pore was varied by changing the duration and intensity of the pressure pulse applied to the barrel of the pipette. With these procedures, we were able to apply a range of concentrations that spanned ≥ 2 orders of magnitude for each stimulus. The individual barrels were controlled independently.
With our technique, taste cells are loaded with CaGD at the taste pore. Thus, it is likely that we loaded CaGD into and recorded selectively from taste cells that extend their apical processes into the taste pore. By definition, these cells represent mature taste receptor cells (see Lindemann, 1996).
RESULTS
Each chemical stimulus tested evoked distinct transient increases in intracellular Ca2+ at stimulus concentrations consistent with taste responses (see later). Different chemical stimuli elicited characteristic responses with different time courses and amplitudes (Fig. 1 and Fig. 2). Bitter stimuli (cycloheximide and quinine) elicited rapid transient intracellular Ca2+ increases (Fig. 1 and Fig. 2A), as reported previously for rats (Caicedo & Roper, 2001). Ca2+ responses elicited by citric acid were phasic-tonic and showed the largest peak amplitudes of all stimuli tested (Fig. 2B). Monosodium glutamate and NaCl induced prolonged Ca2+ transients (Fig. 3A). Interestingly, saccharin and sucrose elicited different responses – transient and prolonged, respectively (Fig. 2C and Fig. 3A). This result is consistent with findings showing that saccharin and sucrose activate different intracellular signalling cascades (e.g. Bernhardt et al. 1996).
Figure 2. Ca2+ responses elicited by compounds representing different taste qualities, measured in cell bodies of single taste cells.
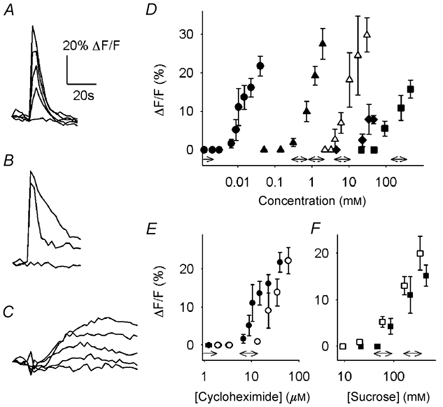
All responses were concentration dependent and had distinctive time courses. A-C, representative responses in three different taste cells evoked by cycloheximide (A), citric acid (B) and sucrose (C) at progressively higher stimulus concentrations. D, concentration-response relationships showing different potencies for cycloheximide (•), quinine (▴), citric acid (▵), saccharin (♦) and sucrose (▪). Responses are from at least five taste cells. Data shown are means ± s.e.m. The corresponding behavioural thresholds show the same sequence and approximate ranges (double-headed arrows above abscissa; data in D-F from Lush, 1984, 1989; Lush & Holland, 1988; Whitney et al. 1990; Whitney & Harder, 1994; Bachmanov et al. 2001). E and F, concentration-response relationships for cycloheximide (E) and sucrose (F) in DBA/2J (filled symbols) and C57BL/6B (open symbols) mice.
Figure 3. Chemical specificity of taste cells.
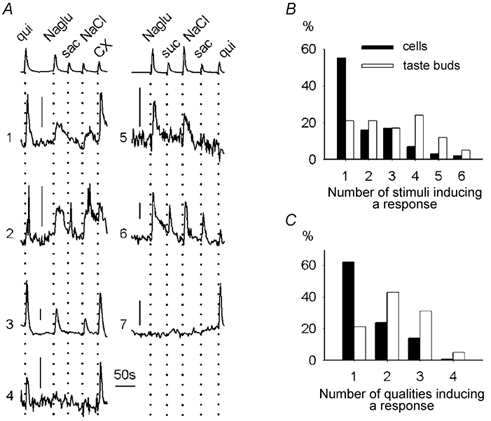
A, sequential stimulation with five stimuli at concentrations ≥ 3 times threshold induced different responses in seven different taste cells in two taste buds. Top traces show the stimulus applications. Three cells responded to one taste quality (bitter: cells 4 and 7; salty: cell 5), two cells to two qualities (bitter and salty: cells 1 and 3), and two to three qualities (bitter, salty and sweet: cells 2 and 6). Scale bars, 10 % ΔF/F. B, percentage of cells and taste buds responding to one or more stimuli. For the taste bud analyses we grouped the responses of all responding cells in a taste bud. C, percentage of cells and taste buds responding to one or more taste qualities. Monosodium glutamate and NaCl were grouped in one class for this analysis. CX, cycloheximide; qui, quinine; suc, sucrose; sac, saccharin; Naglu, monosodium glutamate.
We measured concentration-response relationships by varying the quantity of chemical stimulus released from the multi-barrelled pipette. The stimulus concentration at the taste pore was measured by including a fluorescent dye in the stimulation solution (see Methods; Fig. 1). Responses to all compounds tested were concentration dependent (Fig. 2D) and each stimulus had a characteristic activation threshold concentration. That is, additional responses in other cells were not recruited by applying increasingly higher stimulus concentrations. This was tested more rigorously (see later). Cycloheximide and quinine were the most potent stimuli (thresholds: ≈10 and 200 μM, respectively), followed by citric acid (≈4 mm). Saccharin and sucrose elicited responses only when applied at concentrations ≥ 10 mm (thresholds: ≈10 and 100 mm, respectively). We did not attempt to measure concentration-response relationships for NaCl and monosodium glutamate because the bathing solution already contained 150 mm Na+.
Importantly, the activation thresholds for Ca2+ transients elicited by chemical stimuli were similar to behavioural thresholds in mice for these same stimuli (Fig. 2D; Lush, 1984, 1989; Lush & Holland, 1988; Whitney et al. 1990; Whitney & Harder, 1994; Bachmanov et al. 2001). In taste cells of C57BL/6B mice, which in behavioural taste tests are less sensitive to cycloheximide than DBA/2J mice (Lush & Holland, 1988), the concentration-response relationship for Ca2+ transients elicited by cycloheximide was shifted to higher concentrations (Fig. 2E). Furthermore, sucrose was a more potent stimulus for eliciting Ca2+ transients in taste cells of C57BL/6B mice compared to DBA/2J mice (Fig. 2F), a finding consistent with behavioural studies showing that C57BL/6B mice are more sensitive to sucrose (Lush, 1989). Such correlations between the concentration- response relationships, strains and behavioural tests strongly support the conclusion that the Ca2+ transients elicited by applying chemical stimuli to the apical tips of taste cells represent bona fide taste responses and not some unrelated phenomenon of Ca2+ homeostasis.
Forty-nine per cent of the cells tested (160 out of 326) showed responses to one or more of the test compounds when applied at concentrations ≥ 3 times the average activation threshold for that compound (see Table 1). The highest incidence of responses (≈25 %) was elicited by cycloheximide and citric acid (Table 1). Other stimuli elicited responses in < 15 % of the cells. As in the rat (Caicedo & Roper, 2001), there was a low incidence of responses to bitter stimuli (13-25 %), similar to that reported for the proportion of cells expressing mRNAs for bitter receptors (15-20 %; Adler et al. 2000). The incidence of responses to sweet stimuli (17 %, 56 out of 326), however, appears somewhat lower than the expression pattern observed for mRNAs for sweet taste receptors (T1R2, ≈20-30 %, T1R3, ≈30 %; Hoon et al. 1999; Nelson et al. 2001). It is possible that the sweet-responsive cells are only those which specifically co-express combinations of T1R2 and T1R3 to form functional sweet receptors (Nelson et al. 2001; Li et al. 2002).
Table 1.
Proportions of taste cells responding to the chemical stimuli
| Chemical stimulus | Percentage of cells | Number of cells/total number |
|---|---|---|
| Cycloheximide (20–60 μM) | 25 | 83/326 |
| Quinine-HCl (1–5 mM) | 13 | 41/326 |
| Saccharin (15–30 mM) | 10 | 34/326 |
| Sucrose (250–500 mM) | 10 | 31/326 |
| Monosodium glutamate (200–500 mM) | 11 | 36/326 |
| NaCl (200–500 mM) | 11 | 37/326 |
| Citric acid (10–50 mM) | 23 | 46/199 |
Do individual taste cells respond to multiple taste qualities? When tested consecutively with seven different stimuli, applied in random order to avoid systematic errors, 55 % of the responsive cells (88 out of 160) responded to only one compound (Fig. 3). Most of these exclusive responses were elicited by cycloheximide (35 cells) or citric acid (23 cells). Sixteen per cent of the cells (25 out of 160) responded to two stimuli; 17 % (27 out of 160) to three stimuli; 7 % (12 out of 160) to four stimuli; 3 % (5 out of 160) to five stimuli; and 2 % (3 out of 160) to six stimuli (Fig. 3A and B). Similar results were obtained when taste buds were compared as a whole (Fig. 3B and C). Interestingly, we found that a significant fraction of the taste cells (14 %, 22 out of 160) responded to bitter and sweet stimuli alike. These findings are necessarily a conservative estimate of the breadth of response for those murine taste cells that responded to any stimulus because of the practical limitation on the number of different taste stimuli that could be tested.
Does the breadth of responsiveness for a taste cell depend on the stimulus intensity? To address this issue, we exposed taste cells to stimuli representing four different taste qualities (sucrose/sweet, cycloheximide/bitter, NaCl/salty, and citric acid/sour) at progressively higher concentrations. Applying increasing concentrations of taste stimuli did not change the response pattern of individual cells (n = 8; Fig. 4). These results indicate that chemical specificity in taste receptor cells is not a function of stimulus concentration.
Figure 4. Chemical specificity of taste cells does not vary with stimulus concentration.
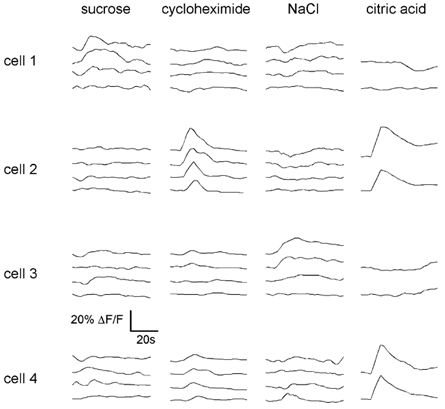
Stimulation with four stimuli at progressively higher concentrations in four different taste cells. Cell 1 responded selectively to sucrose, cell 2 to cycloheximide and citric acid, cell 3 to NaCl and cell 4 to citric acid. These response patterns were stable across concentrations for all cells. Tested concentrations were: sucrose, 24, 288, 622, 900 mm; cycloheximide, 93, 267, 448, 490 μM; NaCl, 60, 70, 495, 975 mm; citric acid, 32 and 190 mm. Only two concentrations could be tested for citric acid.
Because a significant proportion of taste cells responded to two or more of the chemical stimuli tested, we used a statistical analysis to examine whether any two responses were particularly associated in individual cells. Multiple pairwise comparisons on multiply sensitive cells (χ2 test) showed that most responses were independently distributed across taste qualities (Fig. 5; in Fig. 5, log(P) = 3 is equivalent to P = 0.001). Responses to monosodium glutamate and NaCl, however, were associated in individual taste cells (19 cells responded to both stimuli out of 36 and 37 cells responsive to monosodium glutamate and NaCl, respectively), that is, combinations of these responses were greater than that expected to occur by chance (Fig. 5B). This was not surprising, given that Na+ is a major component of both stimuli. Importantly, sucrose and saccharin responses were also associated in the cells, although the coincidence was not 100 % (19 cells responded to both stimuli out of 34 and 31 cells responsive to saccharin and sucrose, respectively; Fig. 5). This is consistent with results showing that the sweet receptor combination T1R2 + T1R3 responds to sucrose and saccharin (Nelson et al. 2001; Li et al. 2002). The association between the incidence of cells responding to the two bitter stimuli cycloheximide and quinine in mouse taste cells was weaker than that of the sweet stimuli (30 cells responded to both stimuli out of 83 and 41 cells responsive to cycloheximide and quinine, respectively; Fig. 5). This is consistent with our previous study showing that bitter responses in rat taste cells are independently distributed (Caicedo & Roper, 2001).
Figure 5. Association between coincidences of chemospecificity in individual cells.
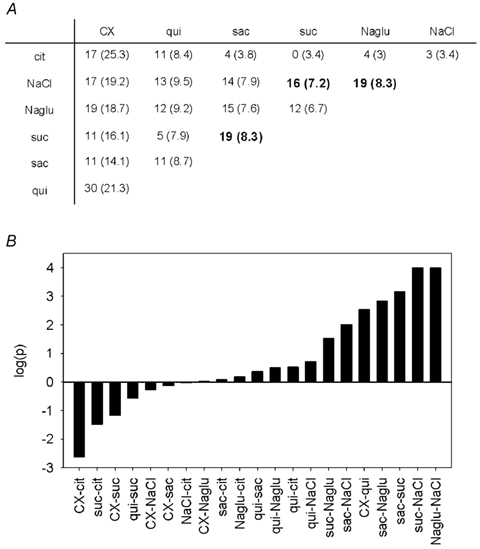
A, contingency table of the responses of individual cells to seven different stimuli. Values represent the observed number of taste cells responding to the two chemical stimuli, indicated by the row and column headings. Numbers in parentheses are the expected number of cells if the responses were to occur independently (calculated as in Gilbertson et al. 2001). B, P values obtained from multiple pairwise comparisons of the data in A (χ2 test). Note that the log of the P values is plotted. To indicate negative (i.e. coincidence was smaller than expected, see A) or positive (coincidence was greater than expected) associations, we arbitrarily assigned negative and positive signs to the log of the P value. The strongest associations were saccharin with sucrose, monosodium glutamate with NaCl, and sucrose with NaCl. These associations are also indicated in bold in A. Abbreviations as in Fig. 3. cit, citric acid.
DISCUSSION
Our results show that individual taste cells display a range of chemical sensitivities. Many individual taste cells respond to stimuli representing different taste qualities. Furthermore, the results are necessarily an underestimate of the true breadth of responsiveness of taste cells. It should be emphasized that our data were collected from murine vallate taste buds. Results from other gustatory regions (e.g. foliate, fungiform and palatal taste buds) and other species may not be quantitatively the same, but the general conclusion that mammalian taste buds include many receptor cells that are broadly responsive vis-à-vis chemical sensitivity is inescapable.
Our results are consistent with those of previous electrophysiological studies showing multiple sensitivity of taste cells (Kimura & Beidler, 1961; Ozeki, 1971; Ozeki & Sato, 1972; Sato & Beidler, 1982, 1997; Tonosaki & Funakoshi, 1984; Gilbertson et al. 2001). In our study, however, we found a generally lower incidence of responses to chemical stimuli. For instance, 13 % of the cells showed Ca2+ responses to quinine, whereas approximately 50 % responded to quinine in electrophysiological studies (Ozeki & Sato, 1972; Gilbertson et al. 2001). This probably reflects differences in the technique, preparation and species used. Some of the non-responsive cells in our study might be supporting (non-sensory) cells. Lastly, it is plausible that many non-responsive cells would have been activated had it been possible to test more taste stimuli. Whether Ca2+ responses or membrane depolarization of taste cells, or both, faithfully reflect the initial step in taste stimulus detection is open to question. Nevertheless, the Ca2+ responses we recorded show a good correlation with behavioural responses (concentration-response relationships and mouse strain sensitivity) and with the expression of taste receptors, suggesting that tastant-evoked Ca2+ responses represent bona fide gustatory responses.
As stated earlier, taste cells range in their chemical specificity from narrowly tuned to broadly responsive. These findings are consistent with those from electrophysiological studies (Ozeki & Sato, 1972; Gilbertson et al. 2001). The response profile of taste cells does not change significantly with stimulus intensity; applying multiple stimuli at increasing concentrations did not increase the breadth of responsiveness. In agreement with this, all taste cells that respond to a given chemical stimulus have similar thresholds for Ca2+ responses as well as for receptor potentials (Ozeki & Sato, 1972).
On the other hand, many taste cells are multiply sensitive and consequently their response profiles become broader when additional taste stimuli are applied. Multiple receptors or transduction cascades might therefore be present in individual cells. Interestingly, a fraction of taste cells (14 %) responded to aversive (bitter) as well as to appetitive (sweet) stimuli in our experiments, as well as in electrophysiological studies (Kimura & Beidler, 1961; Ozeki & Sato, 1972; Tonosaki & Funakoshi, 1984; Gilbertson et al. 2001), and for reasons mentioned earlier these values are probably a conservative estimate. Taste cells that respond to multiple taste stimuli might express receptors for more than one taste quality (but see Nelson et al. 2001). Alternatively, synaptic interactions between taste cells (Roper, 1992) might lead to a spread of taste signals and indirect activation of several cells in a taste bud. If synaptic cross-talk occurs in taste buds, the activation of an individual taste cell might be ambiguous with respect to the proximate stimulus identity.
The contribution of the different taste cells to the neural code for taste quality ultimately depends on how sensory information is transmitted to second order gustatory neurons. Most sensory afferent fibres are not selectively tuned to individual taste qualities and, like many taste cells, respond to multiple taste stimuli (Smith & St John, 1999). However, gustatory afferent fibres are more broadly tuned than the taste cells they innervate. Sensory afferent fibres that respond best to sweeteners appear to be an exception: these sensory afferent fibres are more narrowly tuned than other fibres in the gustatory nerve (Frank, 1991; Danilova et al. 1998; Hellekant et al. 1998). The broader tuning of gustatory afferents is consistent with convergence of taste cells with different chemosensitivities onto individual sensory fibres, but this remains to be determined experimentally.
Acknowledgments
We would like to thank Drs David V. Smith and Scott Herness for their comments on the manuscript. This work was supported by NIH grants DC00374 (S.D.R.) and NIDCD DC04525-01 (A.C.) from the National Institute on Deafness and Other Communication Disorders. K.-N. Kim was supported by grant no. R05-2002-000-00395-0 from the Basic Research Program of Korea Science and Engineering Foundation.
REFERENCES
- Adler E, Hoon MA, Mueller KL, Chandrashekar J, Ryba NJ, Zuker CS. A novel family of mammalian taste receptors. Cell. 2000;100:693–702. doi: 10.1016/s0092-8674(00)80705-9. [DOI] [PubMed] [Google Scholar]
- Akabas MH, Dodd J, Al-Awqati Q. A bitter substance induces a rise in intracellular calcium in a subpopulation of rat taste cells. Science. 1988;242:1047–1050. doi: 10.1126/science.3194756. [DOI] [PubMed] [Google Scholar]
- Bachmanov AA, Tordoff MG, Beauchamp GK. Sweetener preference of C57BL/6ByJ and 129P3/J mice. Chemical Senses. 2001;26:905–913. doi: 10.1093/chemse/26.7.905. [DOI] [PMC free article] [PubMed] [Google Scholar]
- Bernhardt SJ, Naim M, Zehavi U, Lindemann B. Changes in IP3 and cytosolic Ca2+ in response to sugars and non-sugar sweeteners in transduction of sweet taste in the rat. Journal of Physiology. 1996;490:325–336. doi: 10.1113/jphysiol.1996.sp021147. [DOI] [PMC free article] [PubMed] [Google Scholar]
- Caicedo A, Jafri MS, Roper SD. In situ Ca2+ imaging reveals neurotransmitter receptors for glutamate in taste receptor cells. Journal of Neuroscience. 2000;20:7978–7985. doi: 10.1523/JNEUROSCI.20-21-07978.2000. [DOI] [PMC free article] [PubMed] [Google Scholar]
- Caicedo A, Roper SD. Taste receptor cells that discriminate between bitter stimuli. Science. 2001;291:1557–1560. doi: 10.1126/science.291.5508.1557. [DOI] [PMC free article] [PubMed] [Google Scholar]
- Danilova V, Hellekant G, Tinti JM, Nofre C. Gustatory responses of the hamster Mesocricetus auratus to various compounds considered sweet by humans. Journal of Neurophysiology. 1998;80:2102–2112. doi: 10.1152/jn.1998.80.4.2102. [DOI] [PubMed] [Google Scholar]
- Gilbertson TA, Boughter JD, Jr, Zhang H, Smith DV. Distribution of gustatory sensitivities in rat taste cells: whole-cell responses to apical chemical stimulation. Journal of Neuroscience. 2001;21:4931–4941. doi: 10.1523/JNEUROSCI.21-13-04931.2001. [DOI] [PMC free article] [PubMed] [Google Scholar]
- Frank M. Taste-responsive neurons of the glossopharyngeal nerve of the rat. Journal of Neurophysiology. 1991;65:1452–1463. doi: 10.1152/jn.1991.65.6.1452. [DOI] [PubMed] [Google Scholar]
- Fujiyama R, Miyazaki T, Miyamoto T, Okada Y, Mizuno A, Inokuchi T, Sato T. Intracellular free calcium concentration in human taste bud cells increases in response to taste stimuli. FEBS Letters. 1998;434:47–50. doi: 10.1016/s0014-5793(98)00949-1. [DOI] [PubMed] [Google Scholar]
- Hayashi Y, Zviman MM, Brand JG, Teeter JH, Restrepo D. Measurement of membrane potential and [Ca2+]i in cell ensembles: application to the study of glutamate taste in mice. Biophysical Journal. 1996;71:1057–1070. doi: 10.1016/S0006-3495(96)79306-2. [DOI] [PMC free article] [PubMed] [Google Scholar]
- Hellekant G, Ninomiya Y, Danilova V. Taste in chimpanzees. III: Labeled-line coding in sweet taste. Physiology and Behavior. 1998;65:191–200. doi: 10.1016/s0031-9384(97)00532-5. [DOI] [PubMed] [Google Scholar]
- Helmchen F. Calibration of fluorescent calcium indicators. In: Yuste R, Lanni F, Konnerth A, editors. Imaging Neurons. A Laboratory Manual. New York: Cold Spring Harbor Laboratory Press; 2000. chap. 32. [Google Scholar]
- Herness S. Coding in taste receptor cells. The early years of intracellular recordings. Physiology and Behavior. 2000;69:17–27. doi: 10.1016/s0031-9384(00)00186-4. [DOI] [PubMed] [Google Scholar]
- Hoon MA, Adler E, Lindemeier J, Battey JF, Ryba NJ, Zuker CS. Putative mammalian taste receptors: a class of taste-specific GPCRs with distinct topographic selectivity. Cell. 1999;96:541–551. doi: 10.1016/s0092-8674(00)80658-3. [DOI] [PubMed] [Google Scholar]
- Kimura K, Beidler LM. Microelectrode study of taste receptors of rat and hamster. Comparative Biochemistry and Physiology A. 1961;58:131–139. doi: 10.1002/jcp.1030580204. [DOI] [PubMed] [Google Scholar]
- Li X, Staszewski L, Xu H, Durick K, Zoller M, Adler E. Human receptors for sweet and umami taste. Proceedings of the National Academy of Sciences of the USA. 2002;99:4692–4696. doi: 10.1073/pnas.072090199. [DOI] [PMC free article] [PubMed] [Google Scholar]
- Lindemann B. Taste reception. Physiological Reviews. 1996;76:718–766. doi: 10.1152/physrev.1996.76.3.719. [DOI] [PubMed] [Google Scholar]
- Liu L, Simon SA. Acidic stimuli activate two distinct pathways in taste receptor cells from rat fungiform papillae. Brain Research. 2001;923:58–70. doi: 10.1016/s0006-8993(01)03190-0. [DOI] [PubMed] [Google Scholar]
- Lush IE. The genetics of tasting in mice. III. Quinine. Genetical Research. 1984;44:151–160. doi: 10.1017/s0016672300026355. [DOI] [PubMed] [Google Scholar]
- Lush IE. The genetics of tasting in mice. VI. Saccharin, acesulfame, dulcin and sucrose. Genetical Research. 1989;53:95–99. doi: 10.1017/s0016672300027968. [DOI] [PubMed] [Google Scholar]
- Lush IE, Holland G. The genetics of tasting in mice. V. Glycine and cycloheximide. Genetical Research. 1988;52:207–212. doi: 10.1017/s0016672300027671. [DOI] [PubMed] [Google Scholar]
- Lyall V, Alam RI, Phan DQ, Ereso GL, Phan TH, Malik SA, Montrose MH, Chu S, Heck GL, Feldman GM, Desimone JA. Decrease in rat taste receptor cell intracellular pH is the proximate stimulus in sour taste transduction. American Journal of Physiology – Cell Physiology. 2001;281:C1005–1013. doi: 10.1152/ajpcell.2001.281.3.C1005. [DOI] [PubMed] [Google Scholar]
- Nelson G, Hoon MA, Chandrashekar J, Zhang Y, Ryba NJ, Zuker CS. Mammalian sweet taste receptors. Cell. 2001;106:381–390. doi: 10.1016/s0092-8674(01)00451-2. [DOI] [PubMed] [Google Scholar]
- Ogura T, Mackay-Sim A, Kinnamon SC. Bitter taste transduction of denatonium in the mudpuppy Necturus maculosus. Journal of Neuroscience. 1997;17:3580–3587. doi: 10.1523/JNEUROSCI.17-10-03580.1997. [DOI] [PMC free article] [PubMed] [Google Scholar]
- Ohtubo Y, Suemitsu T, Shiobara S, Matsumoto T, Kumazawa T, Yoshii K. Optical recordings of taste responses from fungiform papillae of mouse in situ. Journal of Physiology. 2001;530:287–293. doi: 10.1111/j.1469-7793.2001.0287l.x. [DOI] [PMC free article] [PubMed] [Google Scholar]
- Ozeki M. Conductance change associated with receptor potentials of gustatory cells in rat. Journal of General Physiology. 1971;58:688–699. doi: 10.1085/jgp.58.6.688. [DOI] [PMC free article] [PubMed] [Google Scholar]
- Ozeki M, Sato M. Responses of gustatory cells in the tongue of rat to stimuli representing four taste qualities. Comparative Biochemistry and Physiology A. 1972;41:391–407. doi: 10.1016/0300-9629(72)90070-9. [DOI] [PubMed] [Google Scholar]
- Roper SD. The microphysiology of peripheral taste organs. Journal of Neuroscience. 1992;12:1127–1134. doi: 10.1523/JNEUROSCI.12-04-01127.1992. [DOI] [PMC free article] [PubMed] [Google Scholar]
- Sato T, Beidler LM. The response characteristics of rat taste cells to four basic taste stimuli. Comparative Biochemistry and Physiology A. 1982;73:1–10. doi: 10.1016/0300-9629(82)90083-4. [DOI] [PubMed] [Google Scholar]
- Sato T, Beidler LM. Broad tuning of rat taste cells for four basic taste stimuli. Chemical Senses. 1997;22:287–293. doi: 10.1093/chemse/22.3.287. [DOI] [PubMed] [Google Scholar]
- Smith DV, St John SJ. Neural coding of gustatory information. Current Opinion in Neurobiology. 1999;9:427–435. doi: 10.1016/S0959-4388(99)80064-6. [DOI] [PubMed] [Google Scholar]
- Stevens DR, Seifert R, Bufe B, Muller F, Kremmer E, Gauss R, Meyerhof W, Kaupp UB, Lindemann B. Hyperpolarization-activated channels HCN1 and HCN4 mediate responses to sour stimuli. Nature. 2001;413:631–635. doi: 10.1038/35098087. [DOI] [PubMed] [Google Scholar]
- Tonosaki K, Funakoshi M. Intracellular taste cell responses of mouse. Comparative Biochemistry and Physiology A. 1984;78:651–656. doi: 10.1016/0300-9629(84)90611-x. [DOI] [PubMed] [Google Scholar]
- Whitney G, Harder DB. Genetics of bitter perception in mice. Physiology and Behavior. 1994;56:1141–1147. doi: 10.1016/0031-9384(94)90358-1. [DOI] [PubMed] [Google Scholar]
- Whitney G, Maggio JC, Harder DB. Manifestations of the major gene influencing sucrose octaacetate (Soa) tasting among mice: Classic taste qualities. Chemical Senses. 1990;15:243–252. [Google Scholar]